
Abstract
Background:
Several advancements in evidence and changes in recommendations for screening pelvic examinations (SPEs) have occurred in the last decade, yet their impact on the use of SPEs is unknown. We assessed the impact of two changes: the September 2013 Quality Enhancement Research Initiative (QUERI) Evidence-based Synthesis Program report finding no evidence that SPEs reduce morbidity or mortality; and the July 2014 American College of Physicians (ACP) guidelines recommending against SPEs in asymptomatic, nonpregnant women.
Methods:
We described monthly rates of SPEs among females ages 15–64 enrolled in a claims database between January 2012 and December 2019. We implemented an interrupted time series analysis to examine the impact of the QUERI evidence report and ACP guidelines on the trend in monthly SPE rates, overall and stratified by age group and geographic region.
Main Findings:
The average monthly rate of SPEs decreased from 357 per 1,000 person-years at risk in 2012 to 302 per 1,000 person-years at risk in 2019. There were no significant immediate changes in rates of SPEs after either the 2013 QUERI white paper or the 2014 ACP guidelines.
Conclusions:
Changes in guidelines had no observable impact on the rate of SPEs. Future work is needed to better understand why recent evidence and guideline developments have not impacted real-world practice to target interventions for providers to decrease SPEs efficiently.
Keywords
Introduction
Bimanual pelvic examinations (henceforth, pelvic exams) have been a usual component of preventive gynecological care in the United States for over a century. 1 A bimanual pelvic exam consists of a provider palpating the internal pelvic organs using two fingers inside the vagina while applying external abdominopelvic pressure. A screening pelvic exam (SPE) is performed for asymptomatic individuals, or those who are not currently experiencing any abnormal or concerning gynecological symptoms, to detect gynecological conditions, such as cancers, infections, and asymptomatic pelvic inflammatory disease. 2
A growing evidence base casts doubt on the clinical utility of SPEs.3–7 Over time, more effective screening mechanisms have been created for several conditions, such as the Papanicolaou test (Pap test) to screen for cervical cancer and self-collected specimens for sexually transmitted infection screening.2–4,6 SPEs can lead to psychological harms such as fear, embarrassment, or anxiety, and any false-positive signals for ovarian cancer may lead to unnecessary surgery for benign growths.3,8
Changes to guidelines by major professional societies over the past decade reflect the lack of effectiveness and a growing acknowledgment of the potential harms of SPEs. In 2013, the Quality Enhancement Research Initiative (QUERI) Evidence-based Synthesis Program released a white paper of their systematic review evaluating the benefits and harms of SPEs. 8 In it, they found “no data [studies] indicating that the performance of the routine pelvic examination in asymptomatic average risk women reduces morbidity or mortality from any condition other than cervical cancer. For cervical cancer the recommended examination is visual inspection of the cervix and cervical swabs for cancer and HPV [Human Papillomavirus].” 8 The authors published these findings in the Annals of Internal Medicine in 2014, alongside the American College of Physicians (ACP) guidelines recommending against SPEs in asymptomatic, nonpregnant adults.9,10 These publications were the first systematic review and guidelines recommending against the routine utilization of SPEs. However, other professional societies were slower to change their guidelines or issued less definitive recommendations. In 2017, the American Association of Family Physicians (AAFP) also recommended against SPEs in asymptomatic, nonpregnant adults. 11 However, the United States Preventive Services Task Force (USPSTF) concluded that there was insufficient evidence, due to lack of studies, to recommend in favor of or against SPEs, 12 and the American College of Obstetricians and Gynecologists (ACOG) recommended that the decision of whether to conduct an SPE be shared between individuals and their provider. 2
To date, the effect of these guideline changes on the occurrence of SPEs in clinical practice over time has not been examined. Prior U.S. studies using data from the National Survey of Family Growth (NSFG) suggest that most pelvic exams in young adults (i.e., ages 15–20) are done for routine or screening purposes1,13,14 but have not examined trends in utilization of SPEs over time. Specifically, the effect of the seminal QUERI systematic review and corresponding ACP guideline changes is unknown. In addition, there are limited data on the prevalence of SPEs among individuals older than 20 years.
The objectives of this study were to describe rates of SPEs over time and assess the impact of the September 2013 QUERI evidence report and the July 2014 ACP guideline change on SPE rates. We hypothesized that the trend in monthly rates of SPEs would decrease after the 2013 QUERI evidence report and then decrease again after the 2014 ACP guidelines.
Materials and Methods
We examined monthly rates of SPEs as the number of SPEs per 1,000 person-years at risk of SPEs each month from January 2012 to December 2019. We used an interrupted time series (ITS) analysis, a quasi-experimental study design, to assess the population-level impact of policy changes on SPE rates.15–18 We utilized two interruption time points: (1) October 2013, following the QUERI white paper release in September 2013; and (2) August 2014, following the July 2014 journal publication of the systematic review alongside the ACP recommendation against SPEs.8–10
This study was reviewed and exempted by the University of North Carolina at Chapel Hill Institutional Review Board (#21-1736).
Data source
This work was conducted using the Merative MarketScan Commercial Claims and Encounters database (henceforth, MarketScan) from 2011 to 2019. MarketScan is a large, de-identified database of inpatient and outpatient medical claims and outpatient prescription data for employer-sponsored, commercially insured patients younger than 65 years of age. 19
Measures
Time at risk of a SPE
We included individuals in the MarketScan database coded as females, defined by MarketScan to indicate individuals born with pelvic organs, including uterus, cervix, fallopian tubes, and ovaries. We limited to females ages 15–64 years with at least 365 days of continuous enrollment in MarketScan from 2011 to 2019. All females in this age group were considered at risk of experiencing a pelvic exam. During this period, we categorized indications for pelvic exams (described below) to increase the likelihood that we were accurately measuring SPEs only.
To identify SPEs, we considered individuals ineligible for SPEs during days they were admitted as an inpatient, as well as days they had a billed code for a potential indication for a pelvic exam and for a period after the potential indication during which another pelvic exam may be indicated. These periods, reviewed by a board-certified obstetrician-gynecologist (OBGYN), fall into seven categories of the approximate number of days that a pelvic exam could be indicated: 1, 30, 60, 90, 270, 365, and infinite. On these days, individuals were considered ineligible for an SPE (i.e., due to a potential indication for a pelvic exam). Examples of indications in each category and justification for the estimated time frame in which a pelvic exam could be indicated (and therefore a person was not at risk of an SPE) can be found in Table 1 (full details in Supplementary Fig. S1 and Supplementary Table S1).
Number of Days Ineligible for Screening Pelvic Exams with Examples of Corresponding Symptoms and Diagnoses
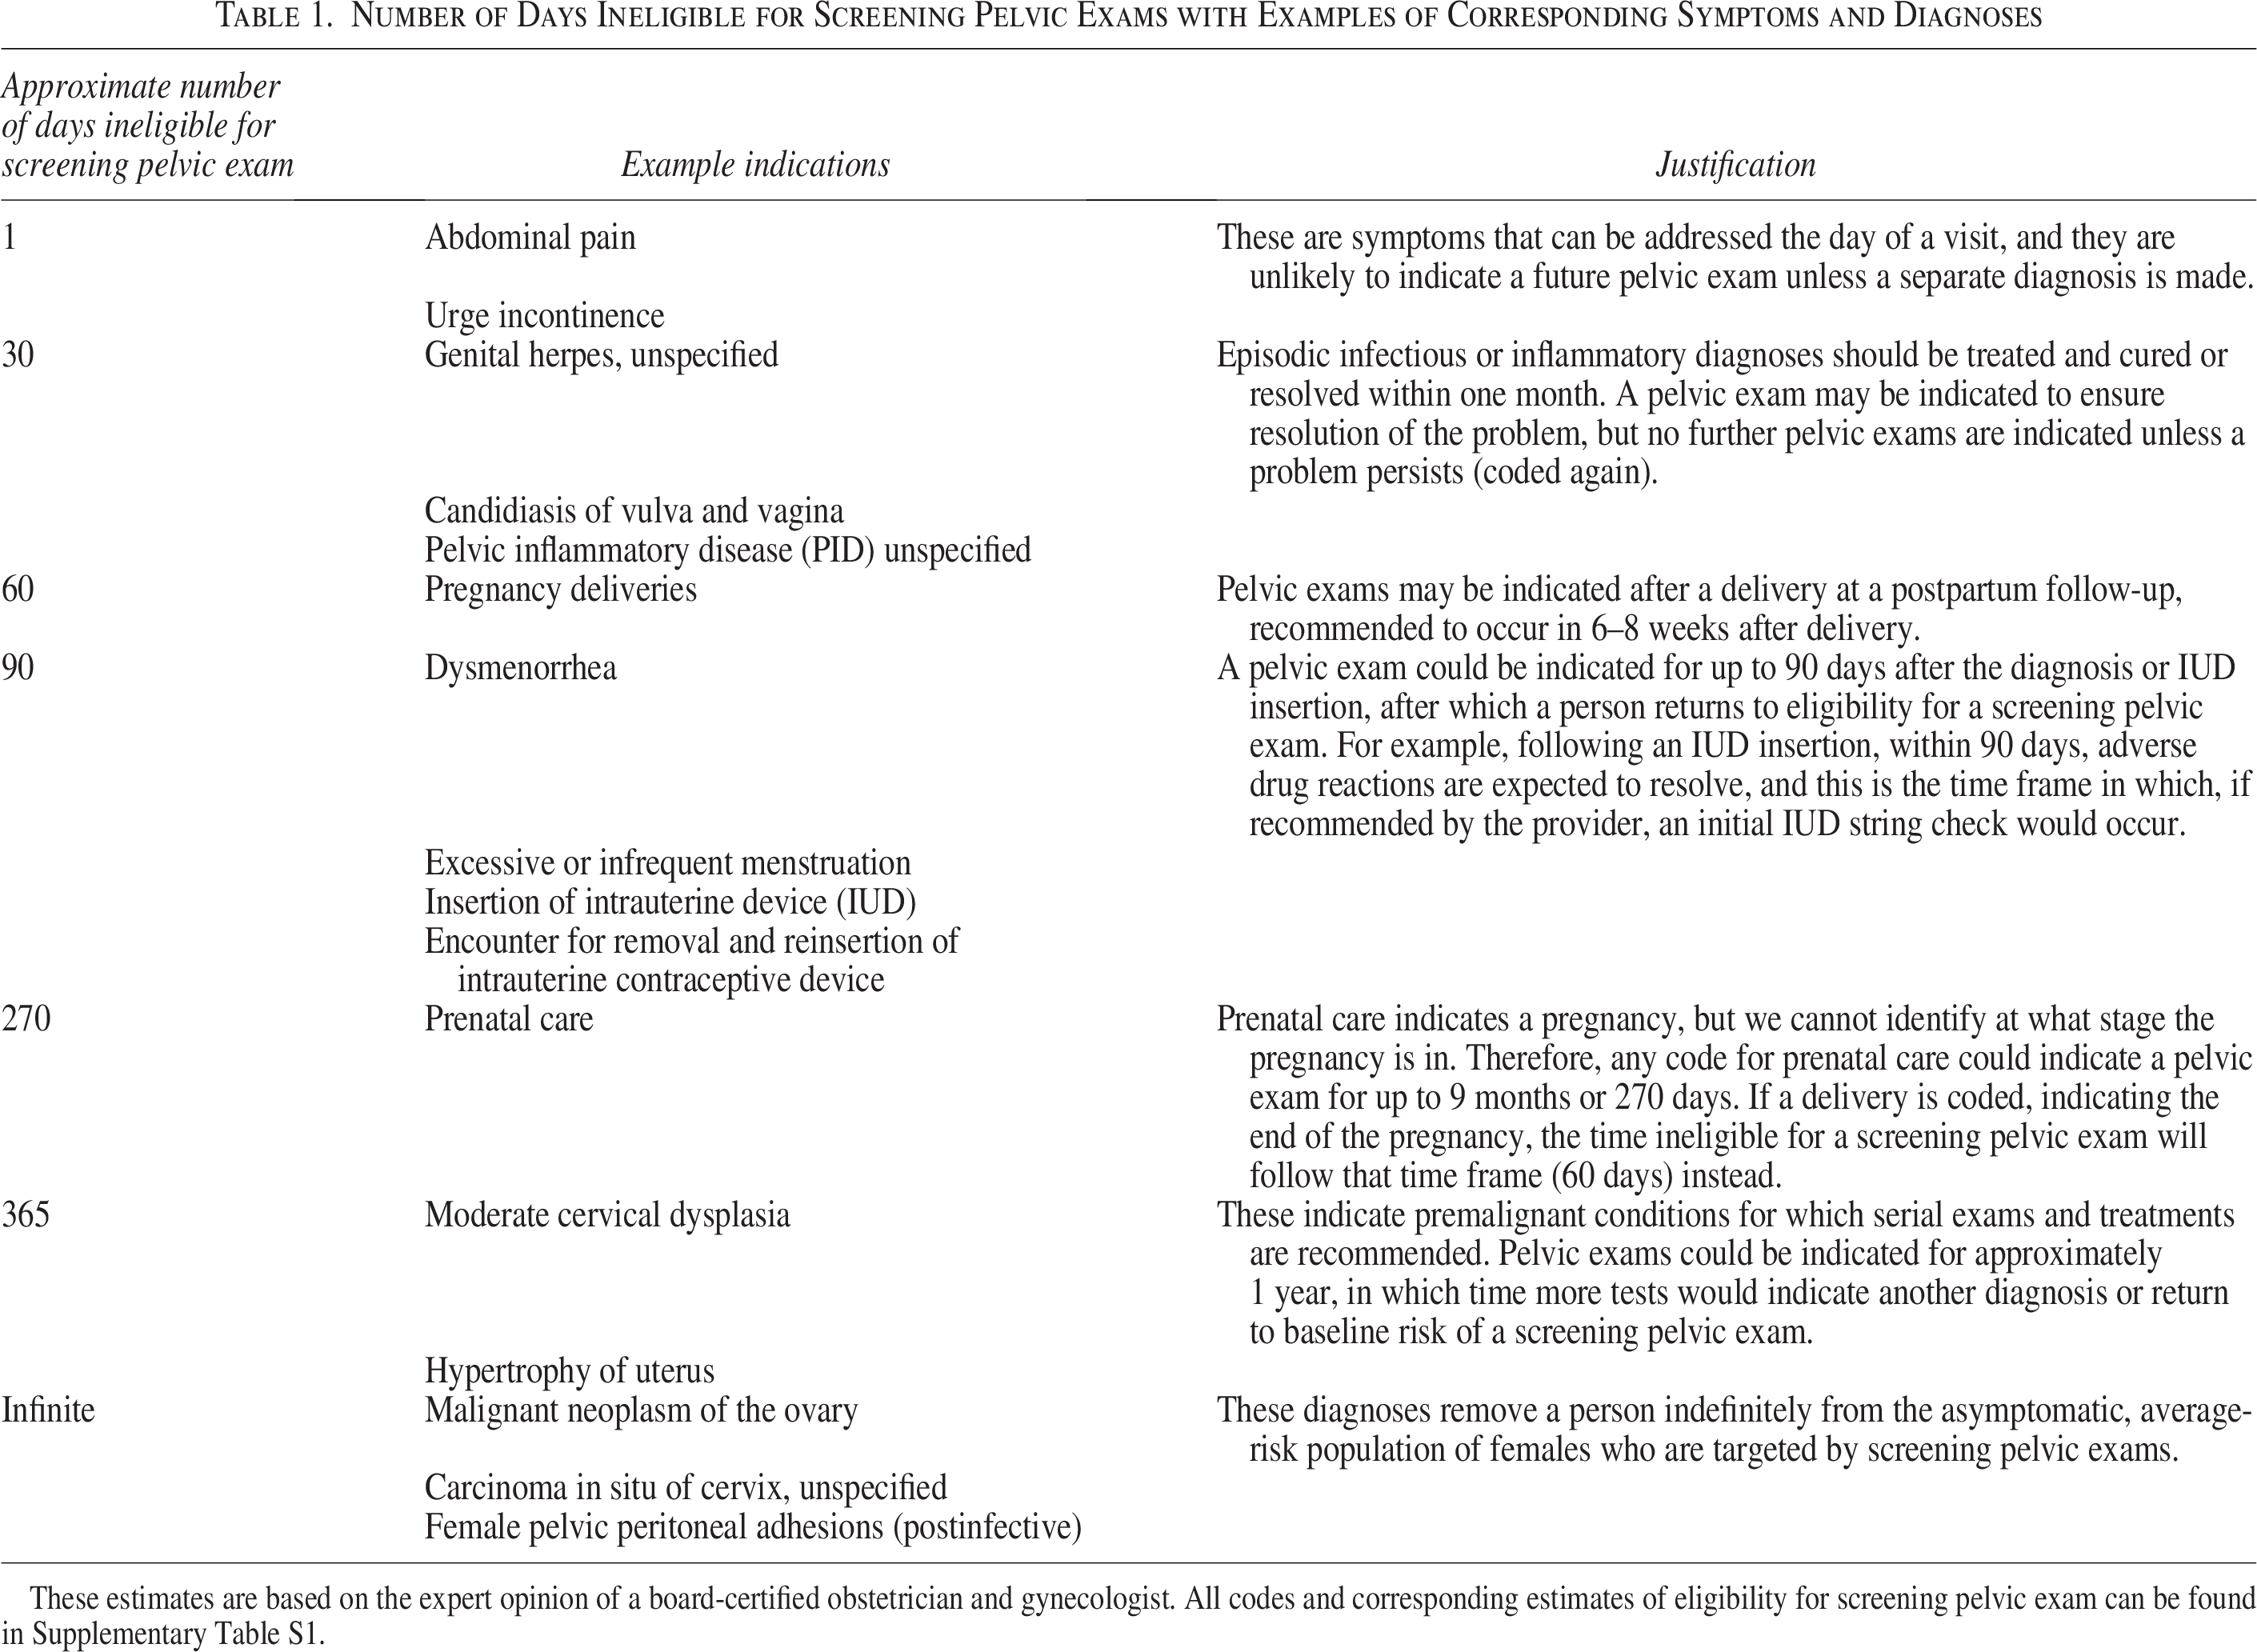
These estimates are based on the expert opinion of a board-certified obstetrician and gynecologist. All codes and corresponding estimates of eligibility for screening pelvic exam can be found in Supplementary Table S1.
SPE occurrence
We measured pelvic exams during any period an individual was considered at risk of a SPE using the International Classification of Diseases, 9th version, Clinical Modification (ICD-9-CM) diagnosis code V72.31; ICD-10-CM diagnosis codes Z01.411 and Z01.419; and Healthcare Common Procedure Coding System code G0101 (Supplementary Tables S2 and S3).20,21 Given our study inclusion/exclusion criteria, we assumed that these codes represented SPEs or those done without a medical indication.20,21
Other measures
We categorized age as 15–17 years, 18–20 years, 21–24 years, 25–34 years, 35–44 years, 45–54 years, and 55–64 years.
Geographic region was measured using a state-level indicator of geographic location of the patient, which we further categorized according to U.S. census region: Northeast, Midwest, South, West, and other/unknown. For individuals with other/unknown values for state of residence, we used a higher-level, region-only variable available in the database to indicate those individuals’ geographic region. We considered the remaining other/unknown geographic region values (1.6% of person-years at risk) to be missing. We used a single (i.e., deterministic) imputation to impute the geographic region for these individuals.
Data analysis
All analyses were performed using SAS, v9.3 (SAS Institute Inc., Cary, NC). We calculated the monthly rate of SPEs from January 2012 to December 2019. The denominator of the SPE rate represents all days at risk each month and was converted to 1,000 person-years at risk (where 365 days at risk = 1 person-year at risk); and the numerator is the number of SPEs that occurred during those days at risk. To control for anticipated month-to-month variation in the number of days in a month and the geographic and age distribution in our sample, we standardized the rates for females by age group and U.S. census region to a standard 30-day month.15,22,23 We used a standard population of females with employer-sponsored health insurance in the United States in the most recently available data (year 2017) from the Current Population Survey from the U.S. Census Bureau (Supplementary Table S4). 24
We fit a segmented linear regression model for the standardized monthly rates, allowing for a change in intercepts and slopes after each interruption. The changes in slopes represent the changes in monthly trend (change each month) of SPEs. We allowed for a change in intercepts in the model to allow better model fit and examined whether there were significant immediate changes following the guideline changes. We visually inspected the trend in rates and did not identify any new interruption points to evaluate. We defined statistical significance as alpha < 0.05.
We conducted two sensitivity analyses. First, we limited the analysis to individuals with no missing data (i.e., complete cases) to examine the robustness of the results to different methods of handling missingness. Second, we conducted a sensitivity analysis, which required only 90 days of continuous enrollment before contributing person-time at risk or the occurrence of an SPE, instead of 365 days, to examine the robustness of results to different continuous enrollment requirements.
Stratified analyses
We conducted several stratified analyses to examine whether the guidelines impacted age groups or regions differently. Prior literature examining the occurrence of SPEs has focused on individuals ages 15–20, likely because these studies also examined potentially unnecessary Pap tests (which are rarely recommended for individuals younger than 21 years).1,13 We theorized that the changes in guidelines may have differential effects across each age group. Each age group was standardized to the distribution of geographic region in its specific stratum (i.e., the distribution of region was specific to each stratum of age group). 24
Results
SPE rates
The study sample included over 31 million unique individuals with more than 63 million person-years at risk of an SPE (Table 2). Over 21 million SPEs occurred from 2012 to 2019 (Table 2). The average monthly rate of SPEs decreased from 357 SPEs per 1,000 person-years at risk in 2012 to 302 SPEs per 1,000 person-years at risk in 2019, and these results were similar in sensitivity analyses (Table 3).
Sample Characteristics
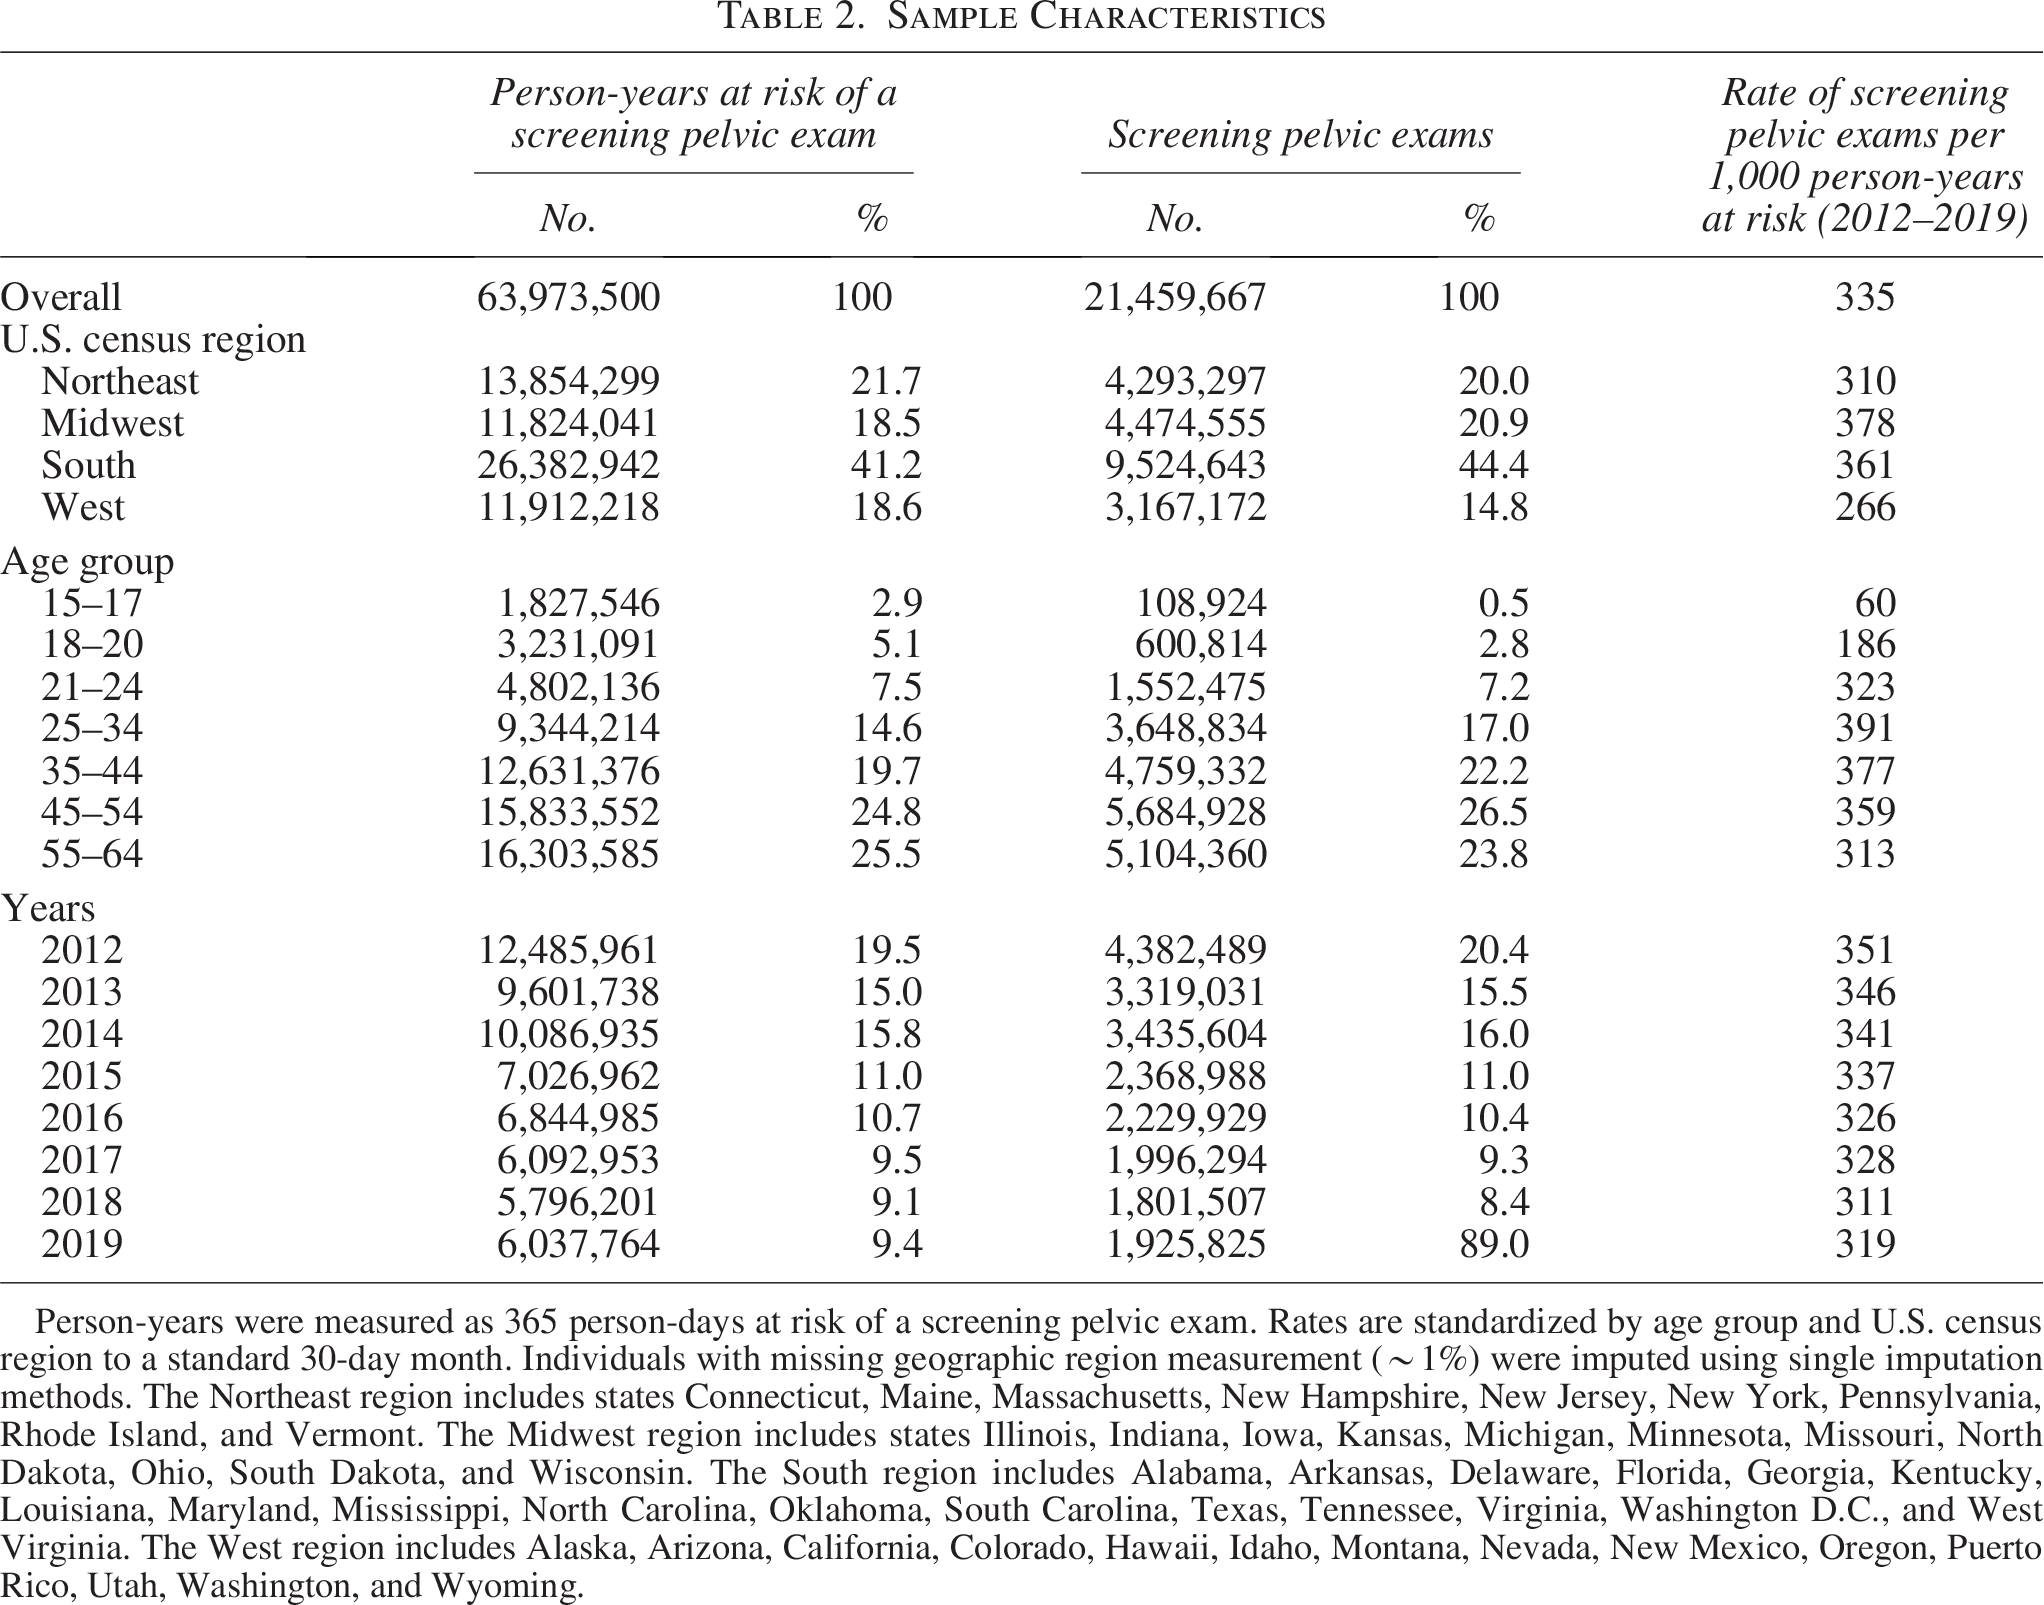
Person-years were measured as 365 person-days at risk of a screening pelvic exam. Rates are standardized by age group and U.S. census region to a standard 30-day month. Individuals with missing geographic region measurement (∼1%) were imputed using single imputation methods. The Northeast region includes states Connecticut, Maine, Massachusetts, New Hampshire, New Jersey, New York, Pennsylvania, Rhode Island, and Vermont. The Midwest region includes states Illinois, Indiana, Iowa, Kansas, Michigan, Minnesota, Missouri, North Dakota, Ohio, South Dakota, and Wisconsin. The South region includes Alabama, Arkansas, Delaware, Florida, Georgia, Kentucky, Louisiana, Maryland, Mississippi, North Carolina, Oklahoma, South Carolina, Texas, Tennessee, Virginia, Washington D.C., and West Virginia. The West region includes Alaska, Arizona, California, Colorado, Hawaii, Idaho, Montana, Nevada, New Mexico, Oregon, Puerto Rico, Utah, Washington, and Wyoming.
Average Monthly Rate of Screening Pelvic Exams (per 1,000 Person-Years) Each Year, 2012–2019
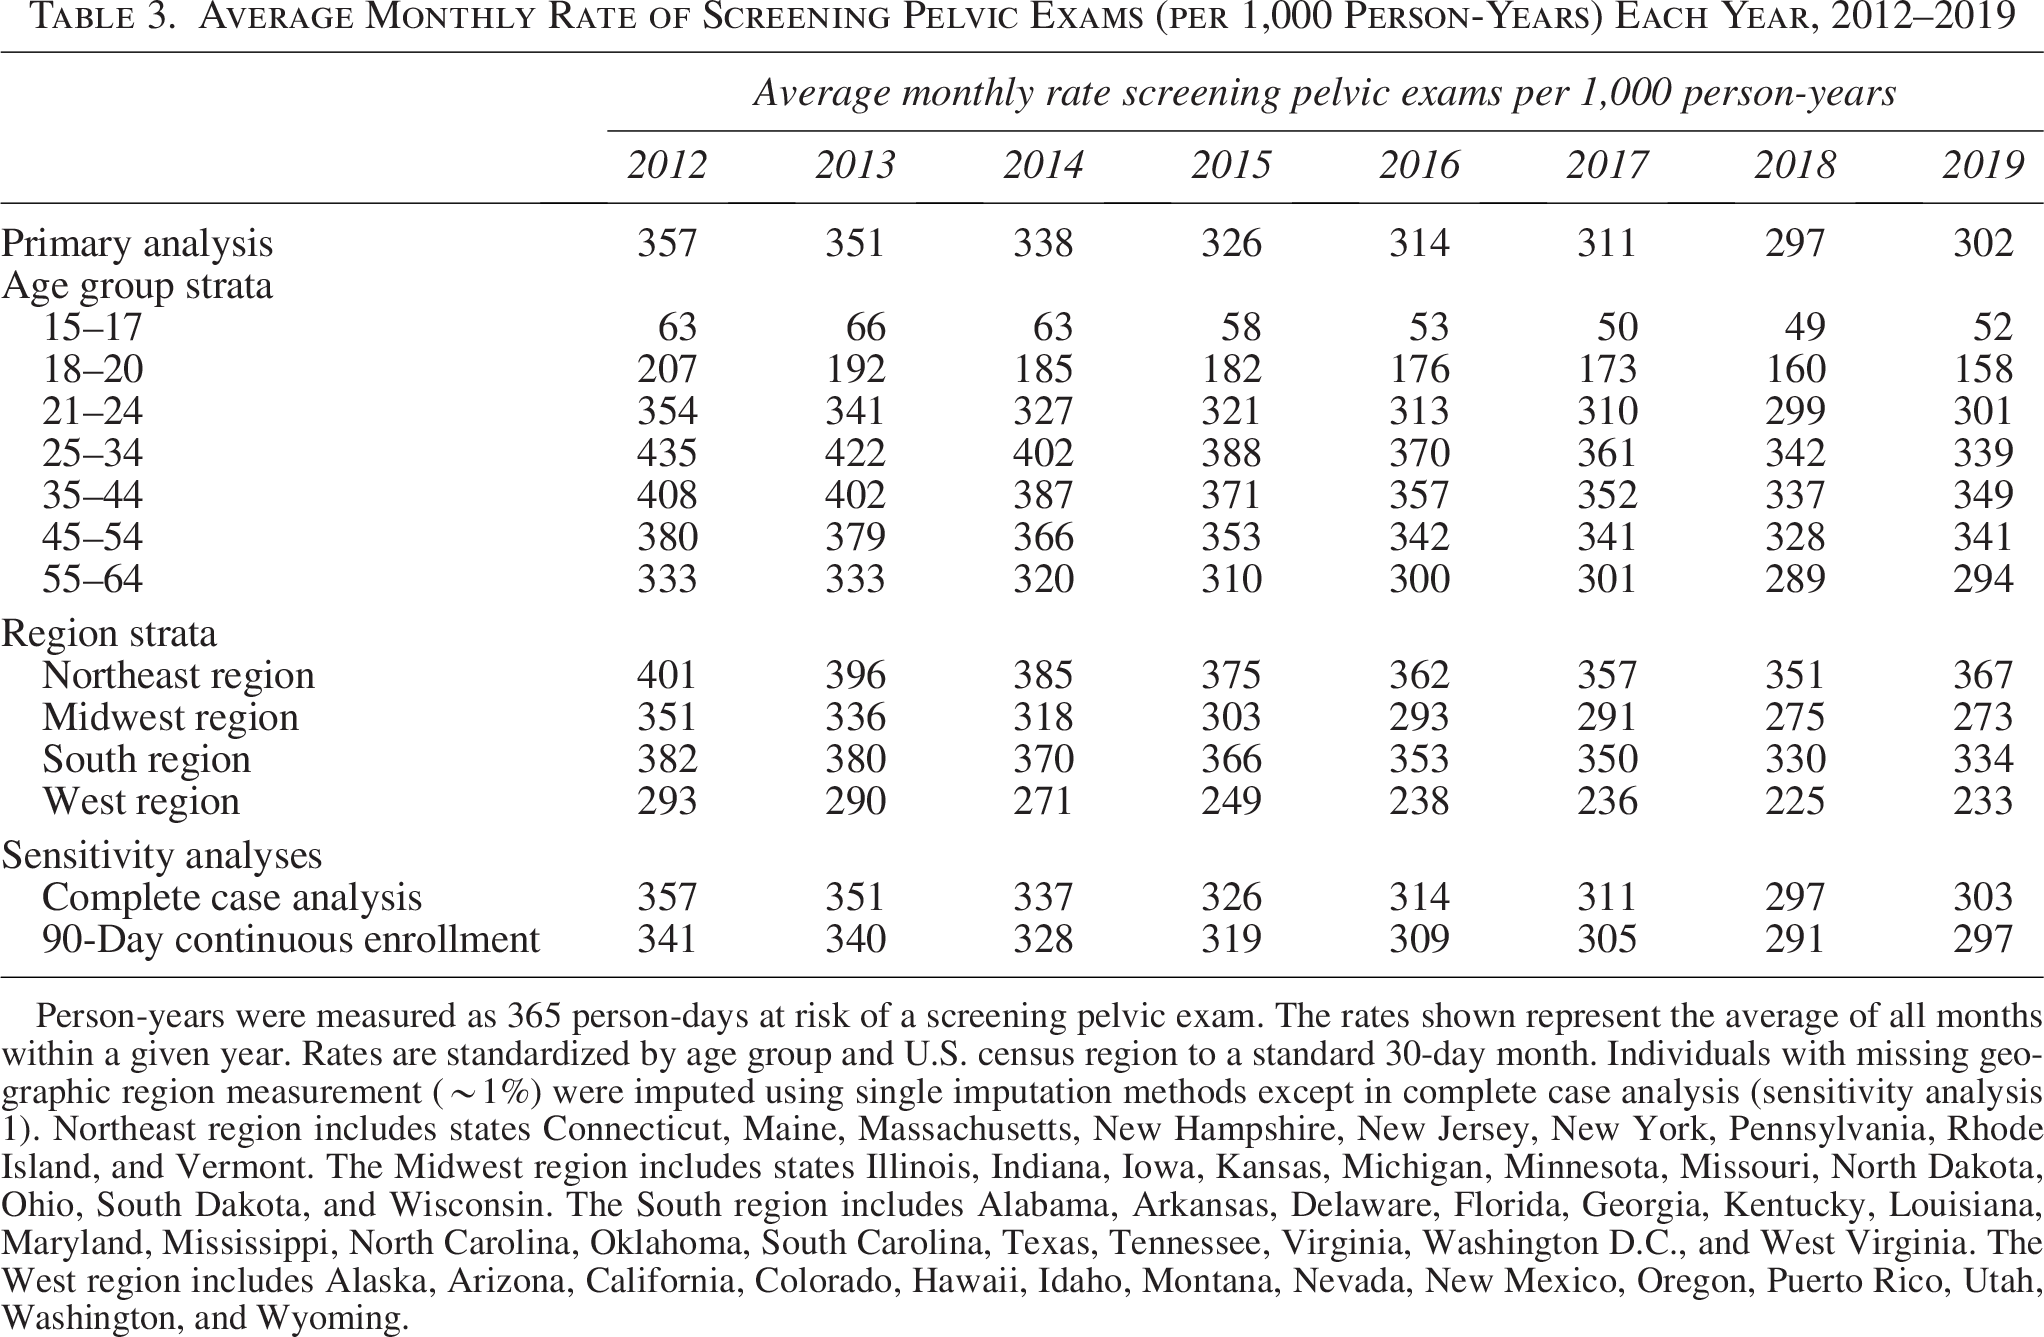
Person-years were measured as 365 person-days at risk of a screening pelvic exam. The rates shown represent the average of all months within a given year. Rates are standardized by age group and U.S. census region to a standard 30-day month. Individuals with missing geographic region measurement (∼1%) were imputed using single imputation methods except in complete case analysis (sensitivity analysis 1). Northeast region includes states Connecticut, Maine, Massachusetts, New Hampshire, New Jersey, New York, Pennsylvania, Rhode Island, and Vermont. The Midwest region includes states Illinois, Indiana, Iowa, Kansas, Michigan, Minnesota, Missouri, North Dakota, Ohio, South Dakota, and Wisconsin. The South region includes Alabama, Arkansas, Delaware, Florida, Georgia, Kentucky, Louisiana, Maryland, Mississippi, North Carolina, Oklahoma, South Carolina, Texas, Tennessee, Virginia, Washington D.C., and West Virginia. The West region includes Alaska, Arizona, California, Colorado, Hawaii, Idaho, Montana, Nevada, New Mexico, Oregon, Puerto Rico, Utah, Washington, and Wyoming.
The average monthly rate of SPEs decreased between 2012 and 2019 across all age groups, with heterogeneity by age group (Table 3, Fig. 2). Across all years, the average monthly rate of SPEs was lowest among ages 15–17 (63 and 52 SPEs per 1,000 person-years at risk for years 2012 and 2019, respectively) and only slightly higher among ages 18–20 (207 and 158 SPEs per 1,000 person-years at risk for years 2012 and 2019, respectively; Table 3). For all other age groups, the monthly average rate of SPEs ranged from 333 to 435 and 294 to 349 SPEs per 1,000 person-years at risk for years 2012 and 2019, respectively (Table 3).
ITS—SPE rates
The model results indicate a slight downward, nonsignificant trend in the rate of SPEs per 1,000 person-years at risk for each month of time, and the trend of monthly change in rate of SPEs did not significantly change in level or slope following either interruption (Table 4, Fig. 1). The slopes indicate a consistent monthly decrease in the rate of SPEs over time, although this was only statistically significant for Segment 3, from August 2014 to December 2019, when the rate decreased 0.5 SPEs per 1,000 person-months at risk (95% confidence interval [CI] −0.9, −0.1; Table 4). Across sensitivity analyses, we consistently found no statistically significant changes in the trend of monthly change in rate of SPEs following the 2013 QUERI publication nor the July 2014 guideline changes (Table 4). The findings of the two sensitivity analyses were consistent with the primary results (Figs. S2 and S3).
Interrupted Time Series Analysis Model Results, Segment Slopes, and Absolute Change in Slopes After Interruption
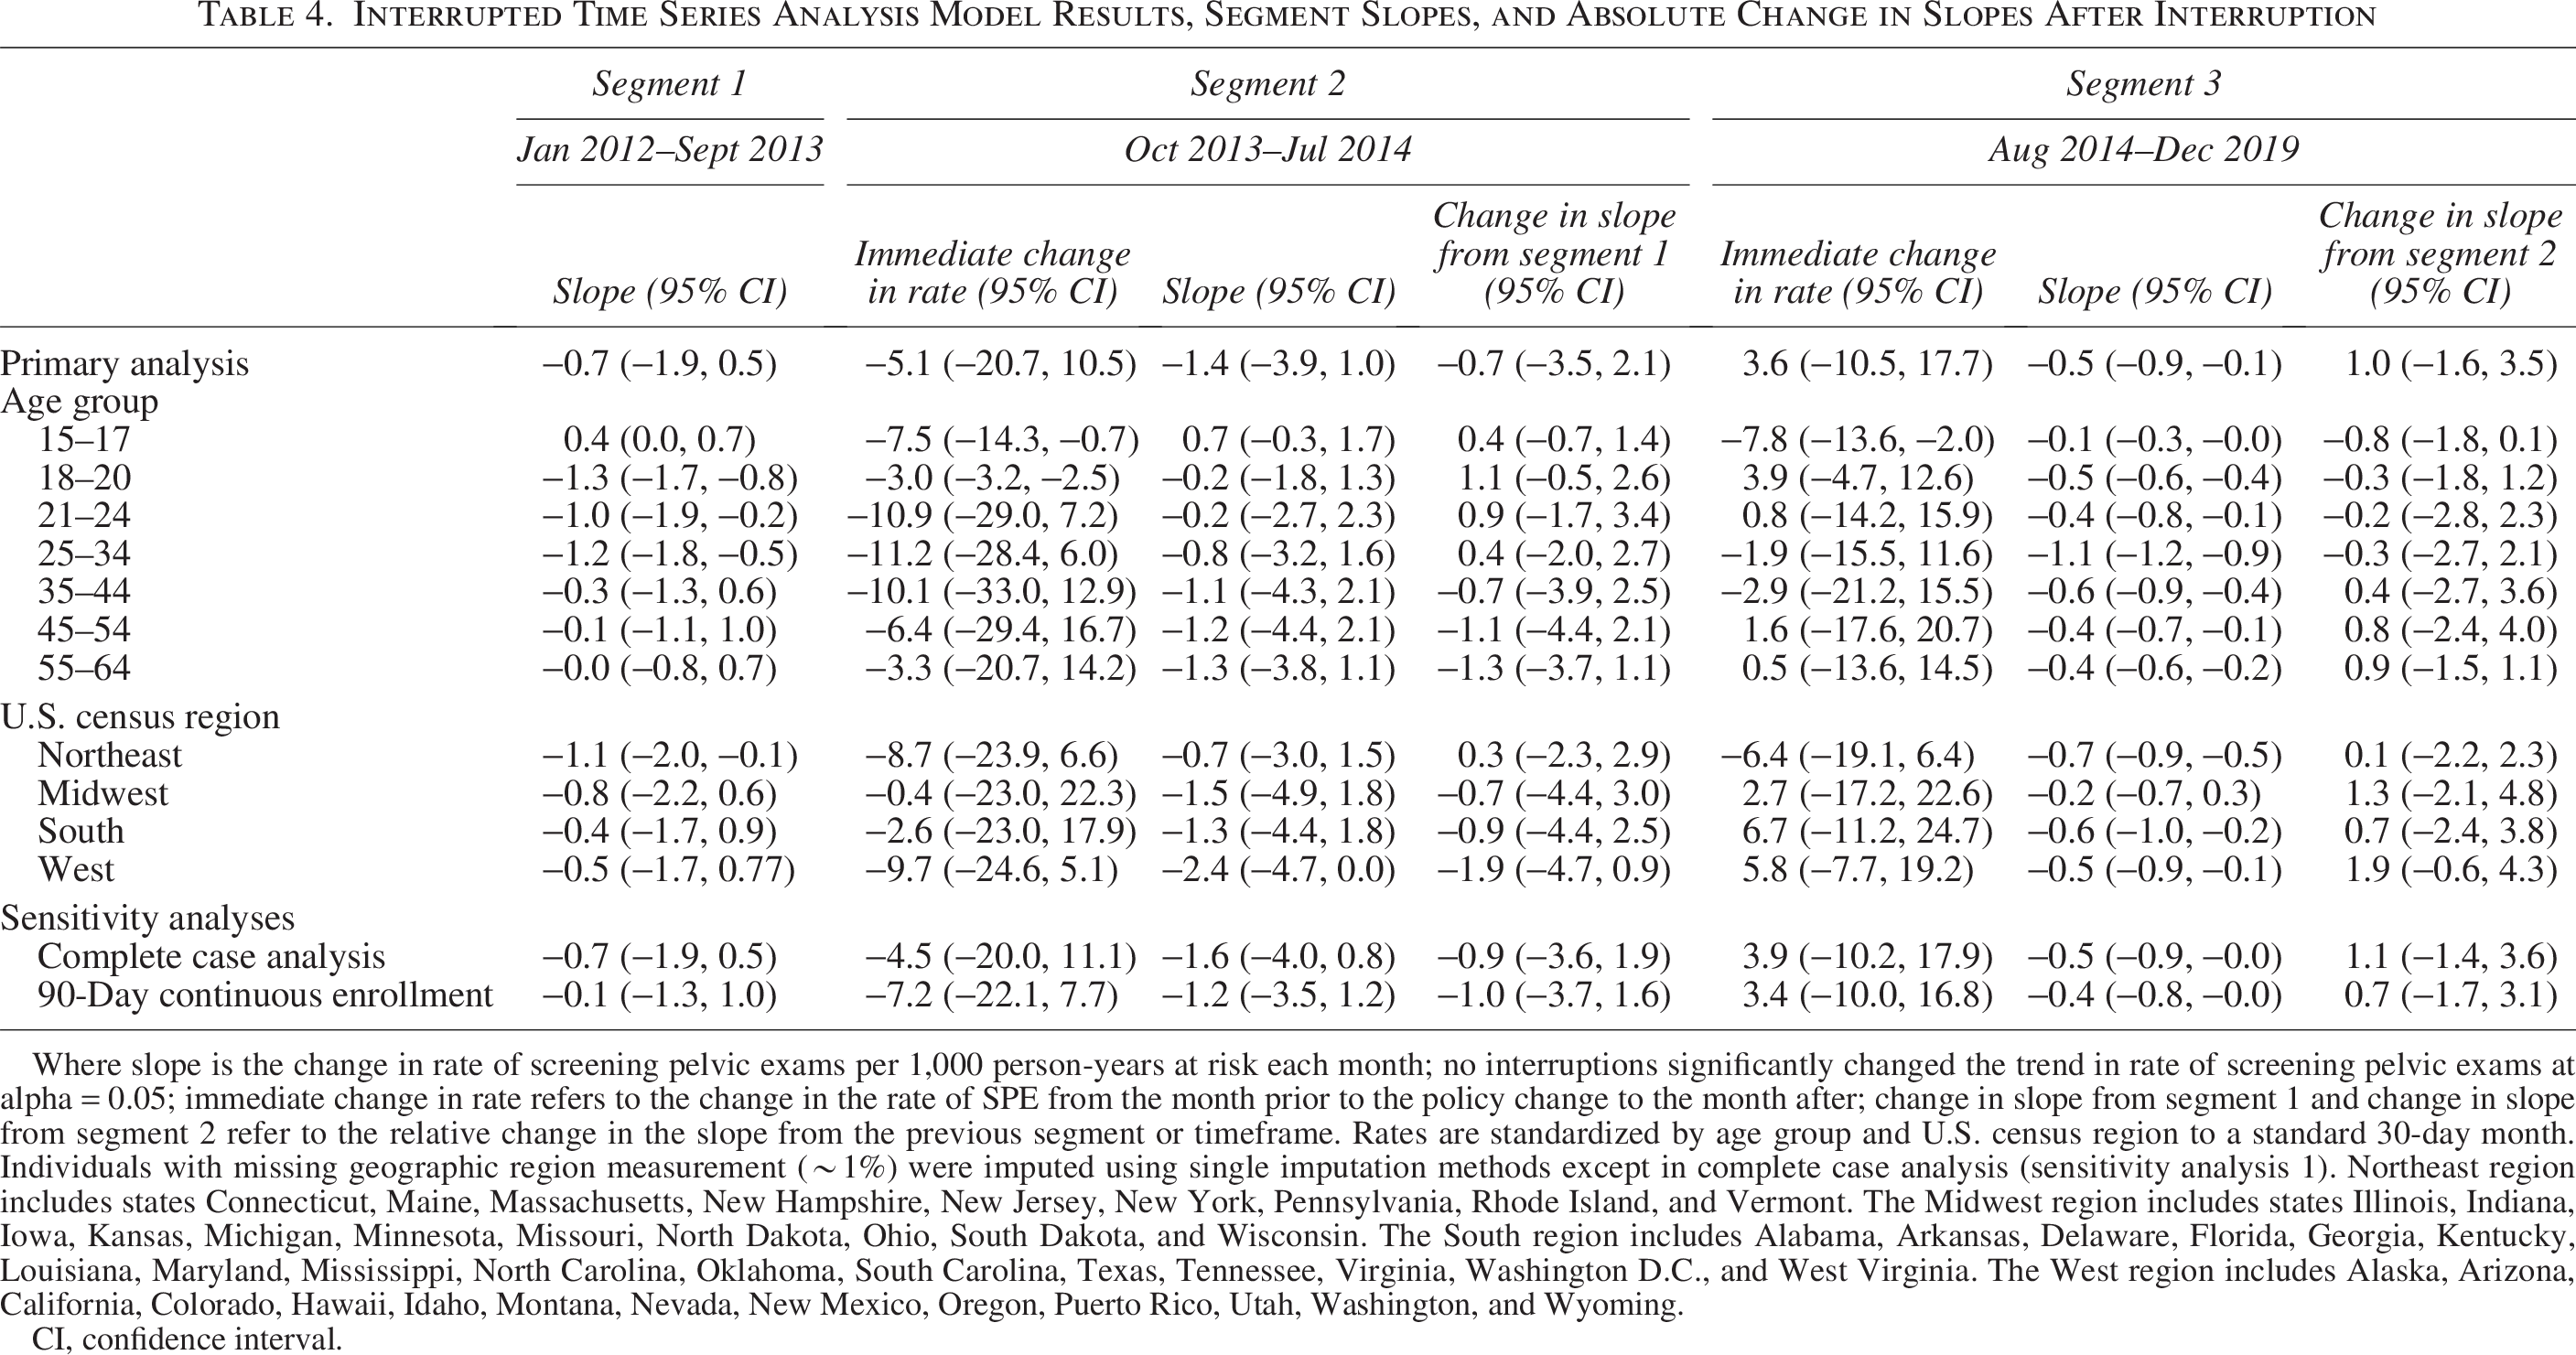
Where slope is the change in rate of screening pelvic exams per 1,000 person-years at risk each month; no interruptions significantly changed the trend in rate of screening pelvic exams at alpha = 0.05; immediate change in rate refers to the change in the rate of SPE from the month prior to the policy change to the month after; change in slope from segment 1 and change in slope from segment 2 refer to the relative change in the slope from the previous segment or timeframe. Rates are standardized by age group and U.S. census region to a standard 30-day month. Individuals with missing geographic region measurement (∼1%) were imputed using single imputation methods except in complete case analysis (sensitivity analysis 1). Northeast region includes states Connecticut, Maine, Massachusetts, New Hampshire, New Jersey, New York, Pennsylvania, Rhode Island, and Vermont. The Midwest region includes states Illinois, Indiana, Iowa, Kansas, Michigan, Minnesota, Missouri, North Dakota, Ohio, South Dakota, and Wisconsin. The South region includes Alabama, Arkansas, Delaware, Florida, Georgia, Kentucky, Louisiana, Maryland, Mississippi, North Carolina, Oklahoma, South Carolina, Texas, Tennessee, Virginia, Washington D.C., and West Virginia. The West region includes Alaska, Arizona, California, Colorado, Hawaii, Idaho, Montana, Nevada, New Mexico, Oregon, Puerto Rico, Utah, Washington, and Wyoming.
CI, confidence interval.
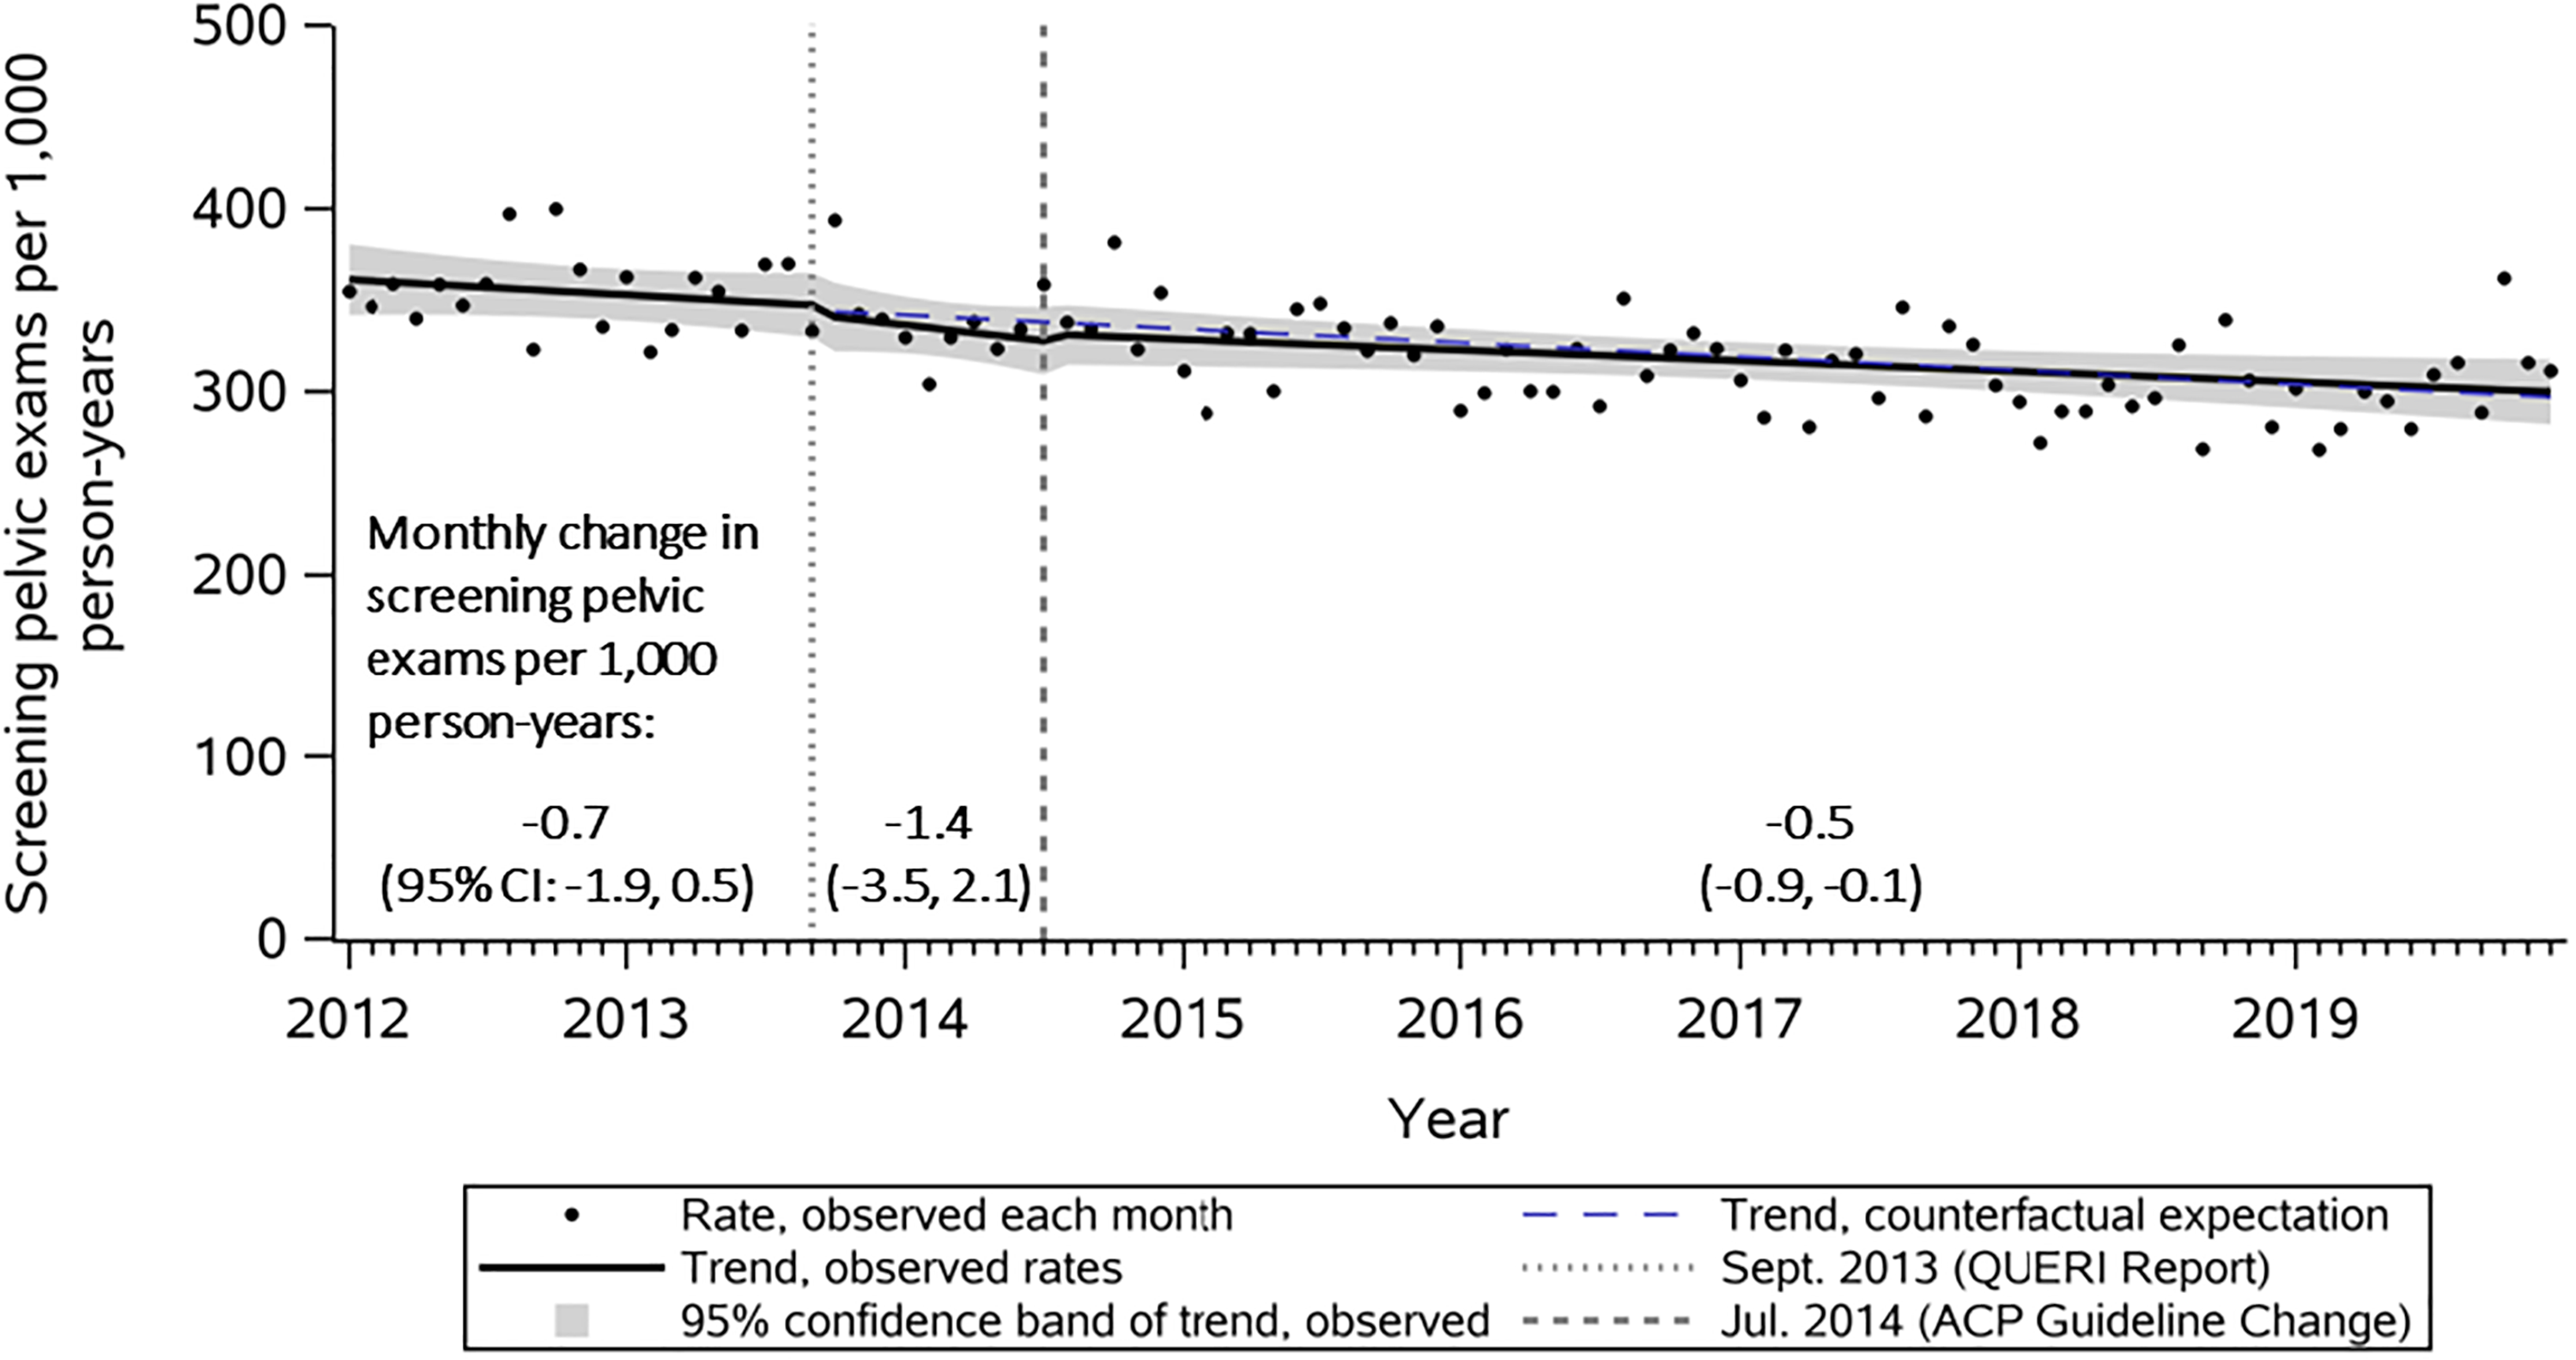
The impact of evidence and guideline changes on screening pelvic exam rates estimated using interrupted time series, 2012–2019. Abbreviations: CI, Confidence Interval; QUERI, Quality Enhancement Research Initiative; ACP, American College of Physicians; Rates are standardized by age group and U.S. census region to a standard 30-day month.
Stratified analyses: age group
From January 2012 to September 2013, the rate of SPEs trended down for all age groups except 15–17 years, but only age groups 18–20 years, 21–24 years, and 25–34 years trended down significantly (Table 4). The monthly rate of SPEs from January 2012 to September 2013 for the age group 15–17 years significantly increased over time, albeit only slightly, at 0.4 SPEs per 1,000 person-years at risk each month (95% CI 0.002, 0.7; Table 4, Fig. 2).
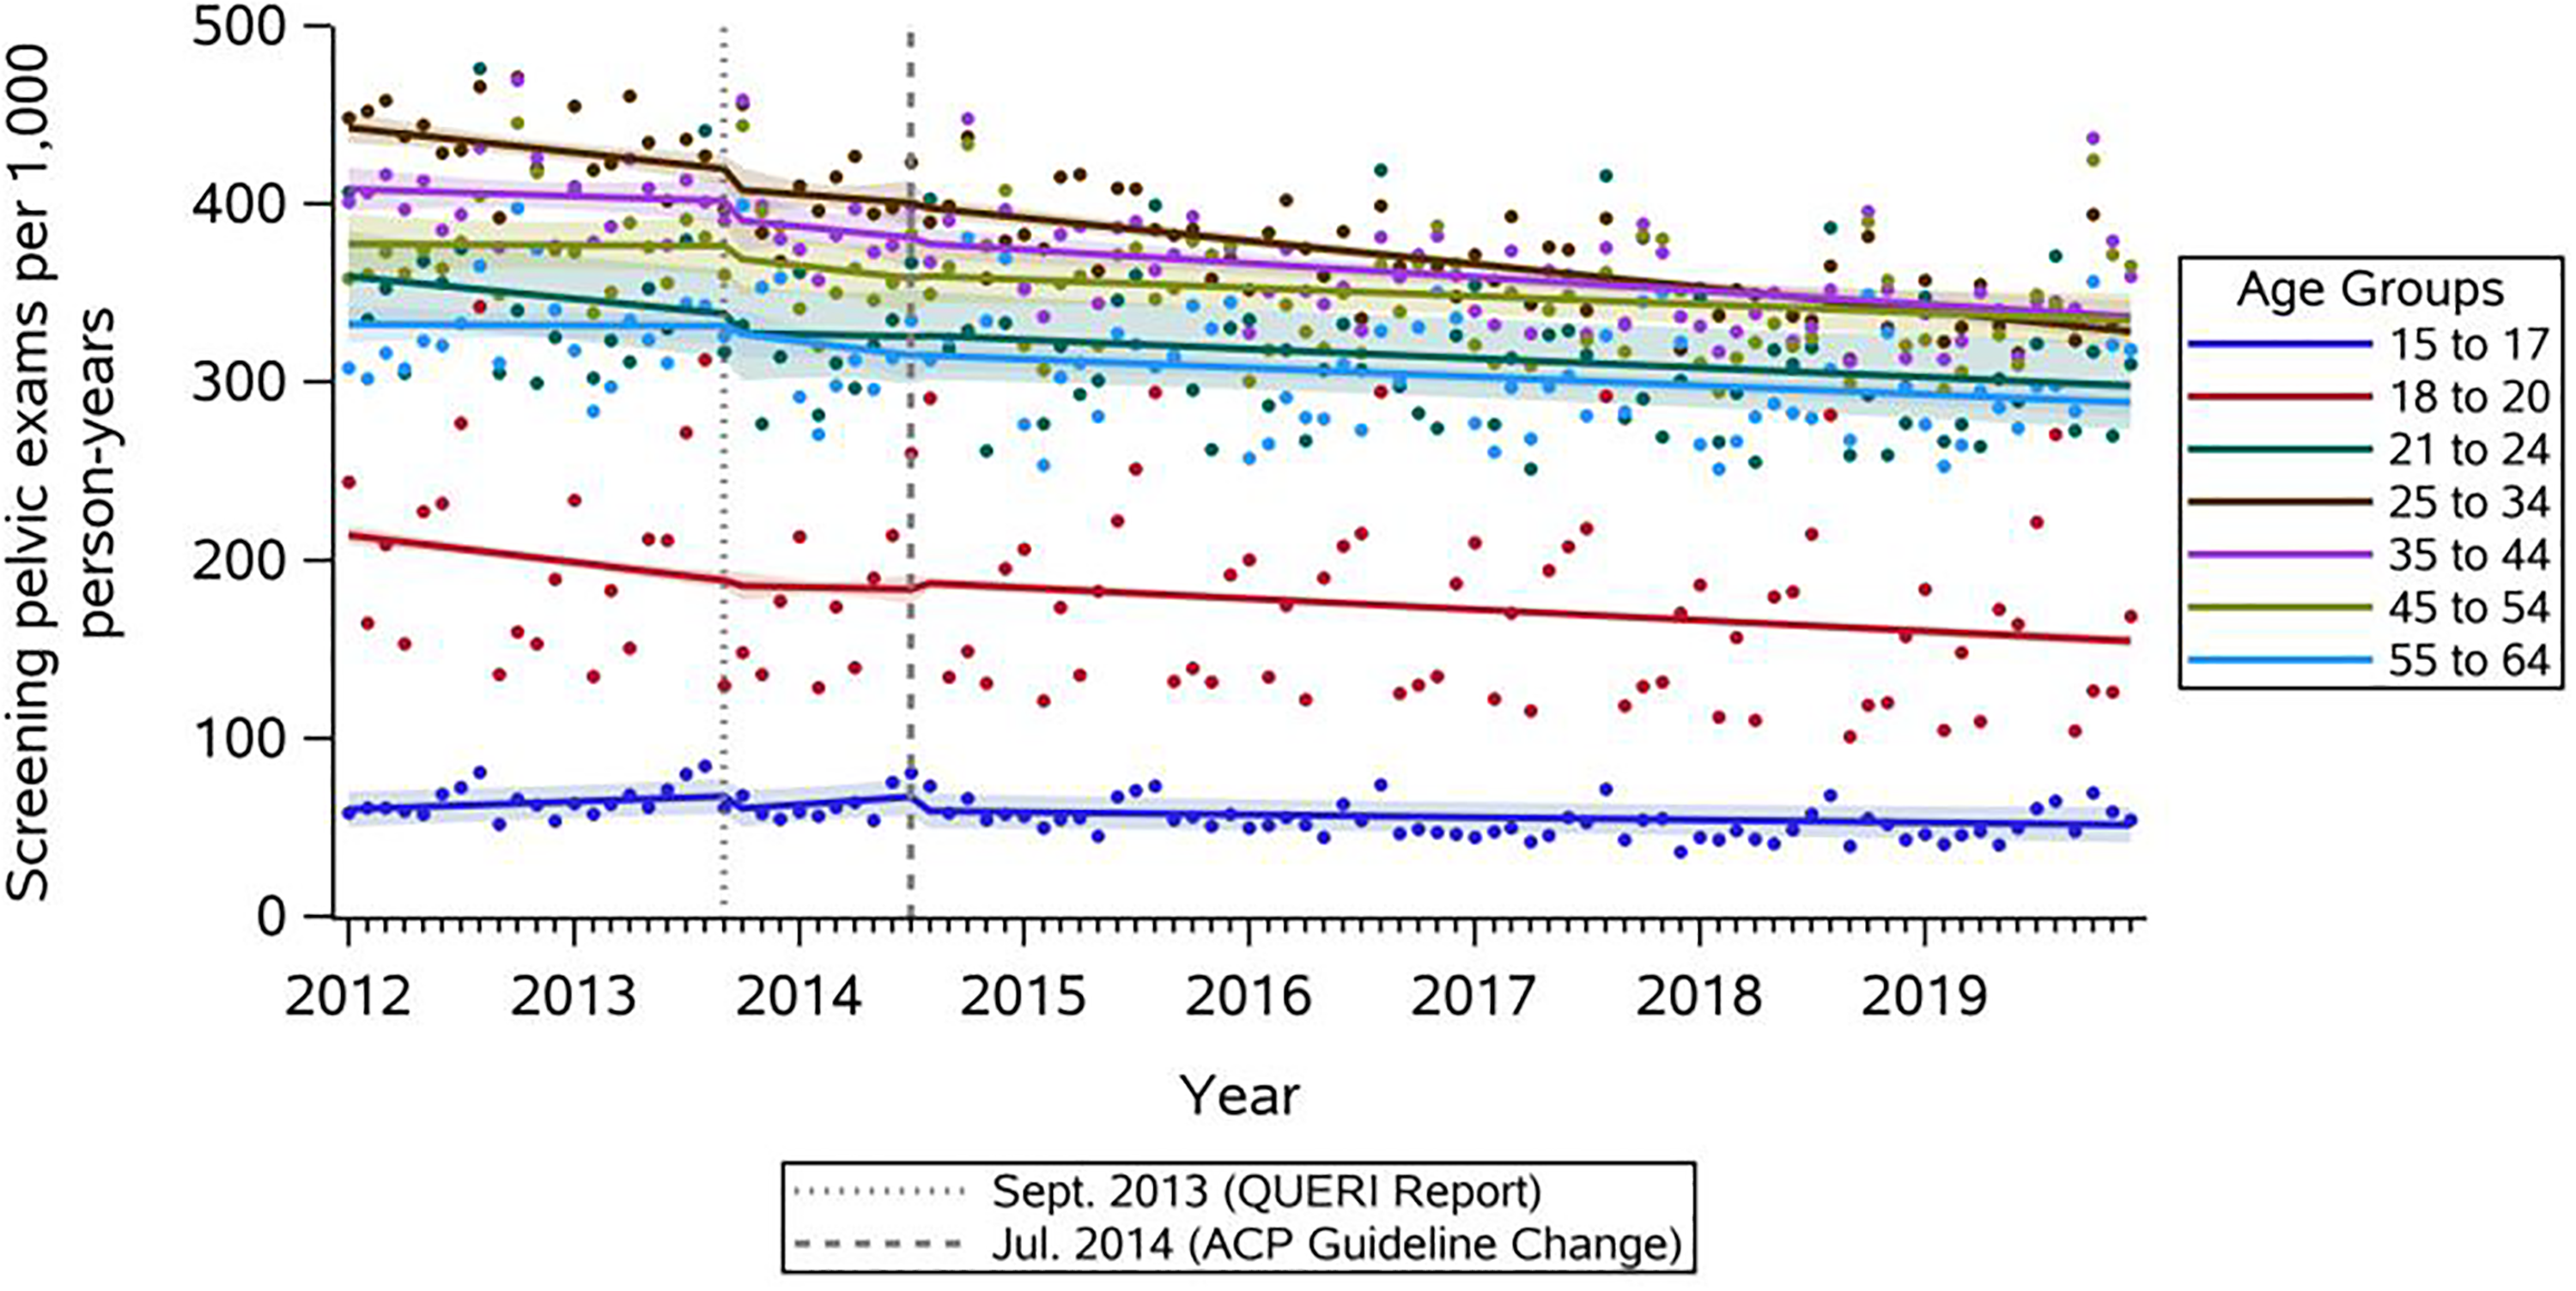
Age group strata, the impact of evidence and guideline changes on screening pelvic exam rates estimated using interrupted time series, 2012–2019. Abbreviations: QUERI, Quality Enhancement Research Initiative; ACP, American College of Physicians.
Across all age groups, the change in trend of monthly rate of SPEs after the September 2013 QUERI evidence report and the July 2014 ACP guideline change was not statistically significant (Table 4, Segment 2; Fig. 2). However, there were statistically significant decreases in the immediate rate of SPEs immediately after the 2013 QUERI evidence report for age groups 15–17 (−7.5 [95% CI −14.3, 0.0.7]) and 18–20 (−3.0 [95% CI −3.2, −2.5]; Table 4, Segment 2; Fig. 2) and immediately after the 2014 ACP guidelines for age group 15–17 (−7.8 [95% CI −13.6, −2.0]; Table 4, Segment 3; Fig. 2).
Stratified analyses: region
The overall monthly rates of SPEs were slightly lower in the West and Midwest regions than in the South and Northeast. The monthly rate of SPEs significantly decreased from January 2012 to September 2013 in the Northeast by 1.1 SPEs per 1,000 person-years at risk (95% CI −2.0, −0.1) but did not significantly change in the Midwest, South, and West regions (Table 4, Segment 1; Fig. 3). There were no significant immediate changes in the monthly rate of SPEs in any region after the September 2013 QUERI evidence report. Following the 2014 ACP guideline update, there were no significant changes in slope in any region (Table 4, Segment 3; Fig. 3).
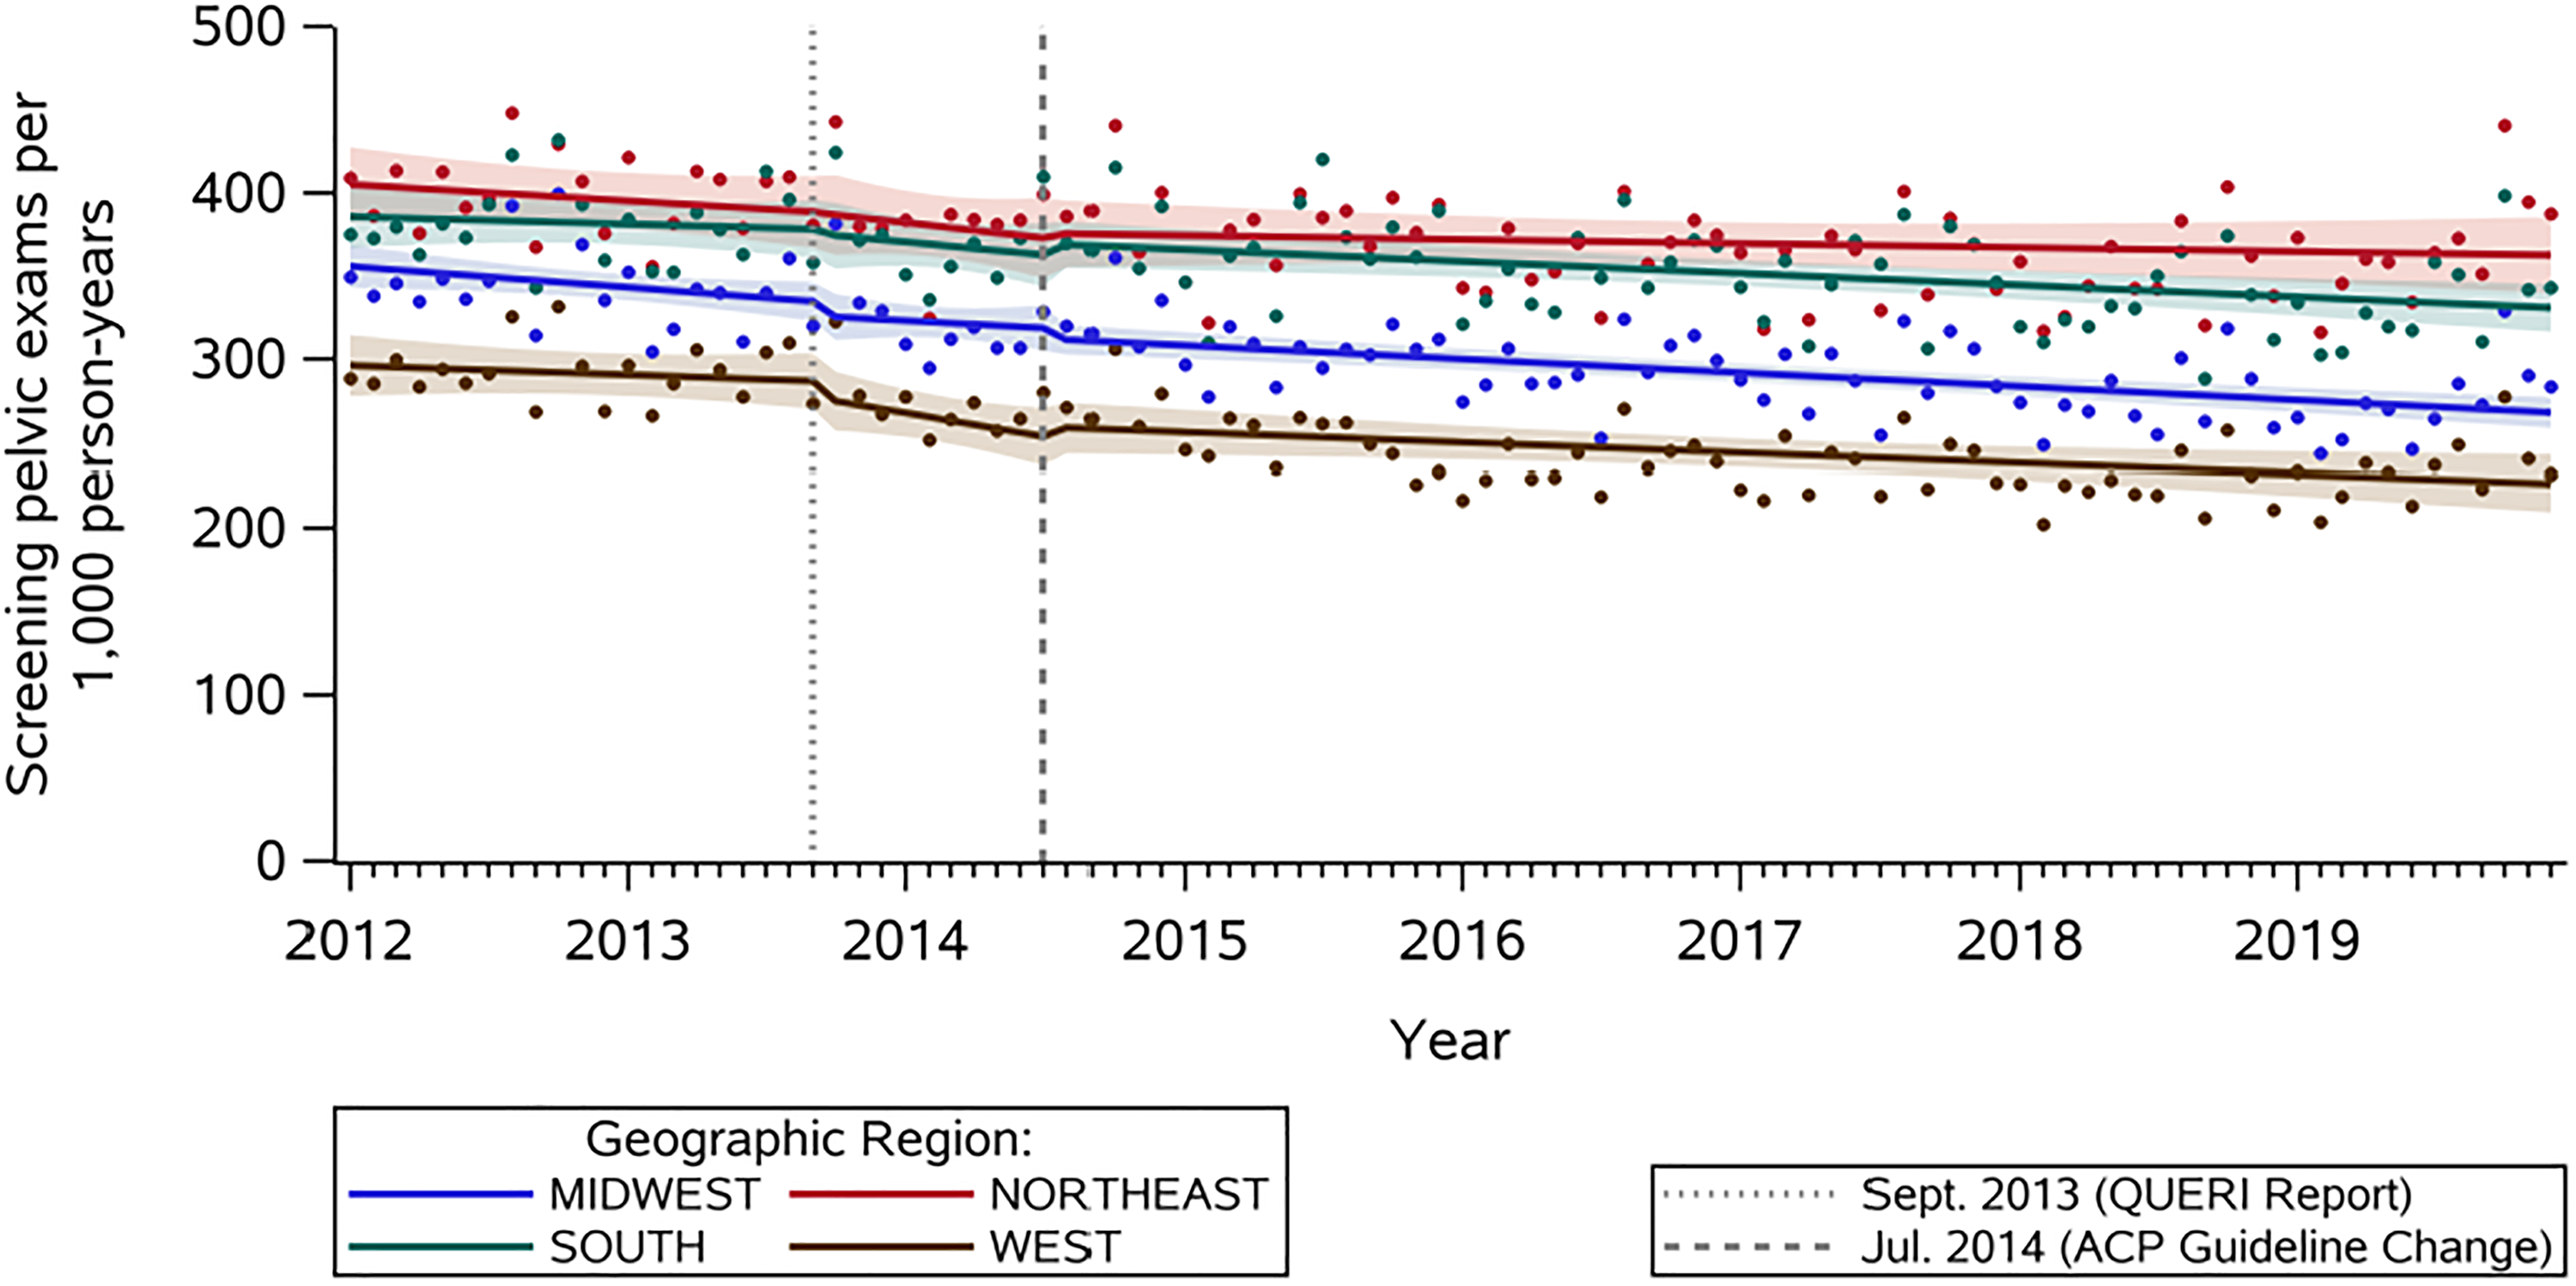
Region group strata, the impact of evidence and guideline changes on screening pelvic exam rates estimated using interrupted time series, 2012–2019. Abbreviations: QUERI, Quality Enhancement Research Initiative; ACP, American College of Physicians.
Discussion
We observed a gradual decrease in the monthly rate of SPEs from 2012 to 2019, with a significant downward trend from August 2014 to December 2019. The monthly rate of SPEs was notably lower among 15- to 20-year-olds compared with older age groups, and the monthly rates of SPEs were lowest among 15- to 17-year-olds. We found no significant overall change in trend of change in the monthly rate of SPEs following the publication of the September 2013 white paper nor the July 2014 peer-reviewed paper and ACP recommendations, which recommended against SPEs for average-risk, nonpregnant women. However, our results showed a statistically significant immediate decrease in SPE rates immediately after the 2013 QUERI evidence report for age groups 15–17 and 18–20 and immediately after the 2014 ACP guidelines for age group 15–17, although the magnitude of these decreases is modest. Our findings indicate that changes in the pelvic exam guidelines had limited immediate impact on the change in rate of SPEs. To our knowledge, this is the first study examining the impact of these guidelines on the change in SPE rates.
Implications for practice and policy
The lack of immediate change in trend of SPE rates after the QUERI publication and ACP guideline change may reflect the lack of consensus among medical providers about how to include SPEs in their practice. Although ACP and AAFP agree that routine SPEs should not be performed,10,11 the USPSTF and the ACOG have avoided issuing such recommendations, respectively claiming insufficient evidence about benefits and harm for asymptomatic women 12 and deferring decisions to individual patients and their providers. 2
SPEs are not without potential harm, but the USPSTF has noted the lack of studies that quantify the anxiety and psychological harms associated with SPEs as a particular limitation in being able to weigh the harms and benefits.12,25 The potential for physical and psychological harm due to unnecessary SPEs must be examined and quantified to support women’s well-being and receipt of evidence-based care. In addition, consensus among stakeholder organizations is necessary to provide clarity in best practices regarding pelvic exams.
It is unclear to what extent providers are aware of these guideline changes, which could be a barrier to practice change. 26 Clinical inertia, or the habits and routines of past years of clinical practice that are a barrier to change for both clinicians and patients, could also contribute to the slow and gradual rate of change in SPE rates. 26 Studies examining the adoption of longer cervical cancer screening intervals also show a substantial lag between guideline issuance and clinical practice change.27,28 Even if providers are aware of the guideline changes, whether they are ready to change their clinical practice accordingly is unknown. 26 Although the immediate impact of the policies did not result in significantly different rates of screening, we were able to describe an overall downward trend starting in 2014. This trend may reflect a clinically significant but much more gradual acceptance and implementation of the accumulated guideline recommendations over time by both clinicians and patients.
SPEs in specific populations
We found notably lower monthly rates of SPEs among individuals younger than 21 years, perhaps due to more awareness of the lack of benefits for SPEs in younger individuals. The higher rates of SPEs among other age groups may also be related to Pap test guidelines and the historic connection recommending annual Pap tests alongside SPEs. A 1987 consensus statement regarding cervical cancer screening recommended that all women have an annual pelvic examination, including a Pap test, beginning with the onset of sexual activity or by age 18.29,30 Since 2012, guidelines from ACOG, USPSTF, and ACS agree that before age 21, no cervical cancer screening is recommended, regardless of sexual history,5–7 which may result in lower provision of SPEs without the prompt of an accompanying Pap test.
Moreover, our findings suggest that SPEs continue in clinical practice today, aligning with prior literature. Mason et al. analyzed the 2013–2014 NSFG data to identify factors associated with receiving a pelvic exam (not necessarily for screening purposes) before age 21. 13 Among 1,170 respondents ages 15–20 years, 31% had received a pelvic exam before age 21. 13 Similarly, Qin et al. estimated that from 2011 to 2017, 23% of women ages 15–20 reported having a pelvic exam in the previous year 1 ; an estimated 54% (95% CI 49–60%) of those pelvic exams were potentially unnecessary screening exams, affecting an estimated 1.4 million women. 1
Ellison et al. found that 24.2% of females ages 15–49 enrolled in MarketScan experienced SPEs at a contraceptive encounter between 2007 and 2017. 20 In contrast to our results, they found that SPEs increased from 4.3% in 2007 to 13.3% in 2017. 20 Notably, this study was limited to only visits that were billed as contraceptive encounters, which may not be representative of all preventive care visits that females attend and may experience an SPE. Future work should examine subgroups that may have a higher rate of SPEs, such as individuals who use self-administered hormonal contraception.
Limitations
The results of this study should be interpreted in light of several limitations. There is currently no gold standard for identifying SPEs in insurance claims data. We used prior literature to guide our approach to measure SPEs, but no approach in measuring SPEs has been validated yet.15,20 We do not know to what extent we may be over- or underestimating SPE occurrence. The exclusion criteria used to isolate SPEs (versus pelvic exams indicated due to a problem or complaint) seem robust but have not been formally examined. A validation study is needed to understand how providers bill for pelvic exams in general and how to distinguish between SPEs and indicated pelvic exams in insurance claims data.
We used a 365-day lookback period, during which we required continuous enrollment, before an individual was included in measuring the rates of SPEs. However, some exclusion criteria could indicate a lifetime of potential pelvic exams (e.g., gynecological cancers), which we may not have observed in the lookback period. Although these diagnosis codes would be expected to be associated with all future encounters, if they were not, this could lead to an overestimating of person-time at risk of an SPE. In the sensitivity analysis, we found similar results to the primary analysis, although we cannot rule out potential mismeasurement due to enrollment criteria in either approach.
In this analysis, we used “months” as our unit of time. Although this is a commonly used measure in ITS, 31 other units of time, such as quarters or years, may be helpful in policy analysis to capture the intended and unintended impacts. Future analyses on SPE guideline changes may benefit from incorporating varying units of time.
While we found no significant changes in trend of the monthly rate of SPEs after the 2013 QUERI report nor the 2014 ACP guideline change overall, these results may not be generalizable across all groups of provider specialty (e.g., obstetrician-gynecologists, primary care providers). It is possible that providers in some specialties implemented changes. The MarketScan database includes only individuals insured by employer-sponsored health insurance, and as such, the results may have limited generalizability to other populations.
Conclusions
Our findings suggest that neither the 2013 QUERI evidence report nor the 2014 ACP guideline change, recommending against SPEs, altered the overall trend in monthly rates of SPEs from 2012 to 2019. SPEs have questionable benefits in routine care, and false positives for diseases such as ovarian cancer can cause significant undue harm. Future work is needed to understand these harms as well as concrete morbidity and mortality benefits of SPEs for conditions other than cervical cancer, ovarian cancer, gonorrhea, and chlamydia and to better understand why recent evidence and guideline developments have not impacted real-world practice.
Authors' Contributions
R.A.P. conceptualized the study idea and methods, curated the data, performed the analyses, acquired funding, created the tables and figures, and wrote the original draft. C.T.T. and C.R.T. assisted with the study conceptualization, supervised the work, and assisted with funding acquisition. A.K.K. assisted with the study conceptualization and validated study approach. A.C.K. provided methodological expertise. D.M.C. validated study approach. V.P. assisted with software implementation. All authors were involved with reviewing and editing the manuscript and approved of the final draft.
Footnotes
Author Disclosure Statement
No interests to disclose.
Funding Information
The project described was supported by the Agency for Health Research Quality (project number 1R36HS028539-01) and the National Center for Advancing Translational Sciences (NCATS), National Institutes of Health, through Grant Award Number UL1TR002489. The first author’s time was, in part, supported by a Bristol-Myers Squibb—University of North Carolina Worldwide Health Economics and Outcomes Research Fellowship. The content is solely the responsibility of the authors and does not necessarily represent the official views of the NIH or the Department of Veterans Affairs. The authors are responsible for the contents of this article.