
Abstract
Background:
Dairy intake has been associated with lower fibroid incidence in some studies, but none used standardized serial ultrasound screening to detect fibroids.
Methods:
We examined dairy intake and fibroid development in the Study of Environment, Lifestyle and Fibroids, a prospective cohort (2010–2018) of 1,610 Black/African American women with no prior clinical diagnosis of fibroids. At the baseline, participants completed a Food Frequency Questionnaire about their intake of daily milk, cheese, yogurt, and total dairy. At three follow-up visits, conducted approximately every 20 months, participants updated their cow’s milk intake. Incident cases were those with ultrasound-detected fibroids among those fibroid-free at the baseline ultrasound. We used Cox proportional hazards models to estimate adjusted hazard ratios for fibroid incidence with 95% confidence intervals (CI). For fibroid growth, we calculated the change in log-volume from one visit to the next.
Results:
The majority (83%) of participants consumed <0.5 cups of milk/day. Neither dairy nor milk intake was appreciably associated with fibroid incidence. However, the baseline total dairy consumption of ≥1 versus <1 cup/day was associated with a 19% decrease (95% CI = −34%, −0.8%) in fibroid growth over the first 20-month interval. The baseline milk intake of ≥0.5 versus <0.5 cups/day was associated with a 26% decrease in growth (95% CI = −39%, −11%) in the same interval. We did not observe similar associations between time-varying milk intake and growth over other study intervals.
Conclusions:
The data from this prospective ultrasound study provide some evidence that dairy intake may reduce fibroid growth.
Introduction
Uterine leiomyomas, or fibroids, are benign tumors of the uterine smooth muscle that occur in more than 70% of females by menopause. 1 These tumors can cause severe symptoms, such as heavy menstrual bleeding, anemia, and pelvic pain, which reduce quality of life. 2 To date, fibroids are the most common indication for hysterectomy, which contributes to the high economic burden resulting from the treatment and management of this condition. 3,4 Black women tend to have earlier onset, a greater lifetime risk, and markedly higher rates of hospitalizations and surgical interventions for fibroids compared with White women. 1,5 Yet, the reasons for the observed differences in the natural history of fibroid development remain unclear.
Dietary factors may play an important role in influencing fibroid risk. 6 –8 Dairy intake has been of increasing interest due to its potential role in altering reproductive hormone levels, 9 and previous studies have suggested protective effects between dairy intake and fibroid development. 10 –14 In the United States, Black Americans consume less dairy compared with other racial and ethnic groups, which may contribute to differences in fibroid onset and severity. 15 None of the previous studies examining dairy intake used screening ultrasound to detect undiagnosed fibroids, and none examined the fibroid growth. In this study, we evaluated the associations between dairy intake and ultrasound-detected fibroid incidence and growth in a prospective cohort of reproductive-aged participants who identify as Black or African American.
Methods and Materials
Study design
The Study of Environment, Lifestyle, and Fibroids (SELF) is a prospective study of fibroid incidence and growth among self-identified Black/African Americans with an intact uterus at enrollment. 16,17 SELF participants were recruited from the Detroit, Michigan, area from 2010 to 2012 in collaboration with Henry Ford Health. The enrollment criteria included: age of 23–35 years, premenopausal, at least 3 months postpartum, and no previous diagnosis of fibroids, cancer, or autoimmune disease requiring medication. SELF enrolled 1,693 participants who completed baseline questionnaires and a transvaginal ultrasound examination at the first clinic visit. Participants returned at approximately 20-month intervals (median 19 months, 25th–75th percentile 18–20) for a total of four clinic visits over 5 years. Participants who missed a visit were encouraged to attend the next one. Of those enrolled, 1,610 returned for at least one follow-up visit, and 90% of enrollees returned for the final visit. Additional eligibility criteria and study design details have been previously described. 16
SELF was approved by the Institutional Review Boards of the National Institute of Environmental Health Sciences/National Institute of Health (NIH) (IRB 10EN044) and Henry Ford Health and was conducted in accordance with the Declaration of Helsinki as revised in 2013. All participants provided written informed consent and were compensated for their time.
Fibroid outcome assessment
The detailed methods for assessing fibroids in SELF have been previously described. 16,17 Briefly, experienced sonographers who were trained on the study protocol used transvaginal ultrasound for each participant to measure up to six fibroids that were at least 0.5 cm in diameter following a standardized protocol. Sonographers made three separate passes through the uterus and each fibroid’s three perpendicular diameters were measured at every pass. Fibroid volume was calculated using the ellipsoid formula for each separate pass, and the average of the three calculated volumes was our measure of fibroid size. Video and still images were archived, and each month, an 8% sample of each sonographer’s scans, oversampled for fibroid cases, was reviewed by the study’s lead sonographer.
Dairy exposure variables
All participants completed a validated web-based semiquantitative Block Food Frequency Questionnaire (FFQ) at baseline, reporting their average intake of 110 foods and beverages over the past 12 months.
18
–20
This included milk (of any kind, including cow’s milk, rice, or soy milk), cheese, and yogurt, as well as foods that include dairy ingredients. More than 92% of “milk” reported in the FFQ by SELF participants was identified as cow’s milk. The FFQ total dairy intake was estimated from milk, cheese, and yogurt consumption as well as milk solids and whey present in other foods (details on the FFQ dairy variables and the food/drink items included in the dairy group are shown in Supplementary Appendix A1). A low-fat dairy variable was also created using the nonfat and low-fat portion of the total dairy estimate. Nonfat milk, 1% milk, and yogurt were included in the low-fat portion, but not cheese, 2% milk, or whole milk. Intake is reported in “cups of milk equivalents” per day. One milk-equivalent cup is 245 g of fluid milk or yogurt. The milk equivalent for cheese varied depending on the type (range 1–4.5 oz).
21
Due to the low consumption of dairy in this cohort (Supplementary Table S1), the FFQ daily intake variables were dichotomized at less than versus greater than or equal to 1 cup for total dairy, 0.5 cups for milk and cheese, and 0.25 cups for low-fat dairy and yogurt. Those consuming “none” were included in the low category. The FFQ question asked, “How often do you drink milk (any kind, including soy), not including on cereal or in coffee?” Those who reported drinking any milk were then asked to specify the type of milk consumed most often, which included options for cow’s milk (with fat content), soy milk, or rice milk. The majority of individuals consuming milk reported higher fat cow’s milk (81%) as their primary milk of choice, with a smaller percent choosing lower fat cow’s milk (11%). Participants who reported mostly consuming soy (7%) or rice milk (
In addition to the baseline FFQ dairy data, a single question ascertaining consumption of cow’s milk was asked at each follow-up visit: “During the past 12 months, about how much cow’s milk did you consume, as a drink, on cereal, or mixed in with other foods (like pancake batter, for example)?” (Question and response options are shown in the Supplementary Appendix A2). We created two time-varying categorical variables harmonizing the baseline FFQ milk variable and the follow-up question about consumption of cow’s milk: a two-level variable that categorized cow’s milk consumption as <0.5 cups or ≥0.5 cups and a four-level variable (<0.5 cups, 0.5– <1 cup, 1– <1.5 cups, and ≥1.5 cups) per day that recategorized participants in the ≥0.5 cups group to try to evaluate higher quantities of milk consumption, though numbers were limited in the higher categories. These two time-varying harmonized variables were used to assess outcomes over the whole study period.
We also asked about childhood consumption of milk. On the baseline web-based questionnaire, participants answered the question, “When you were around 10 years old, how many glasses of milk did you typically drink per day?”
Covariates
Covariates were chosen based on previous methodologic and risk assessment work in this cohort focused on estimating fibroid incidence or growth. 8,17 Time-varying covariates [age, education, income, smoking status, multivitamin use, parity, time since last birth, and use of depot medroxyprogesterone acetate (DMPA) within the last 2 years] were self-reported at all visits. Body mass index (BMI) was calculated based on measured height (baseline only) and measured weight at every visit. Fibroid characteristics (number and volume of each) were collected during the ultrasound at every visit. Energy intake (from FFQ), age of menarche, maternal education, and household income at age 10 were collected at the baseline. Previous studies have suggested that vitamin D, present in varying amounts in dairy products, 22 may influence fibroid development. 8 We measured concentrations of total 25-hydroxyvitamin D (25(OH)D) using a LIAISON immunoassay in serum from baseline samples 23 and liquid chromatography tandem mass spectrometry in follow-up samples. 8 The categories for the covariates for each analysis are specified in table footnotes.
Statistical analysis
For analyses of fibroid incidence, we used a Cox proportional hazards regression model with robust standard errors, with age as the time scale, to estimate hazard ratios (HRs) and 95% confidence intervals (CI) associated with dairy intake. We excluded participants from the analysis if they had no follow-up ultrasound (N = 83), fibroids at baseline (N = 364), or ultrasounds of poor quality (N = 14), resulting in an analytic sample of 1,232 participants who were fibroid-free at the baseline and who returned for at least one follow-up ultrasound. Participants were censored following detection of an incident fibroid, a non-fibroid-related hysterectomy, or at the end of follow-up, whichever came first. Models were adjusted for age at menarche and time-varying BMI, education, income, DMPA use, years since last birth, parity, smoking status, and multivitamin use. Energy intake was added as an additional covariate for all FFQ variables.
For fibroid growth, we used a linear mixed model to analyze dairy intake associations with log-volume change in a by-fibroid analysis. Fibroids included in the growth analysis were those prevalent at the baseline as well as incident fibroids over the study. We identified 429 participants who had one or more fibroids that could be matched from one ultrasound to the next based on the recorded position in the uterus and by examining archived ultrasound images, including a video scan through the uterus. This resulted in data for 1,348 fibroid growth intervals. To account for variation in interval lengths between visits, the change in log volume was standardized to 18 months by calculating daily growth rates and multiplying by 540. Models accounted for repeated measures within a participant over time and differences in measurement error for smaller versus larger fibroids. 24 Minimally adjusted models included age, fibroid volume, and fibroid number as covariates. 8,17 The fully adjusted model also included age at menarche and time-varying employment, income, education, BMI, years since last birth, multivitamin use, and the use of DMPA. Energy intake (kcal) was added as an additional covariate for all FFQ variables. For ease of interpretation, we converted the model-based estimate of association (β) to an estimated percent difference in growth as [exp(β)−1]*100.
We used FFQ variables (only collected at baseline) to examine incidence and growth over the first observation interval. The 20-month analysis included 1,123 individuals in the incidence analysis and 251 individuals in the growth analysis and used covariates from the first interval. Analysis of fibroid incidence and growth over the entire study period was examined for the harmonized 2-level and 4-level cow’s milk variables. Covariates in these models were time-varying.
As a sensitivity analysis, we further adjusted both incidence and growth models for 25(OH)D concentrations categorized as <20 or ≥20 ng/mL.
All statistical analyses were done using SAS 9.4 (Cary, NC, USA) and R (version 4.1.2).
Secondary analysis
To examine the potential impact of childhood dairy consumption on both fibroid incidence and growth, we used as a surrogate, cow’s milk consumption at age 10. We considered three sets of adjustments for both outcomes. The first was an unadjusted model for fibroid incidence, which used age as the time scale, and a minimally adjusted model for fibroid growth that accounted for age, fibroid volume, and fibroid number. The second model further adjusted for two factors related to socioeconomic status during childhood: maternal educational attainment and participant-perceived household income level when the participant was age 10. In the final model, we additionally adjusted for risk factors during adulthood, including the same sociodemographic, lifestyle, and reproductive history variables used in the primary analyses.
Results
Cohort characteristics
Baseline characteristics of participants with at least one follow-up visit (N = 1,610) are summarized in Table 1. Intake of all dairy products was low, with 83% of participants consuming less than 1 cup of milk per day. At the baseline, participants in the highest milk intake category (≥1.5 cups/day) were more likely to have lower educational attainment and household income, less alcohol intake, higher parity, and more recent births. Although individuals who drank more milk had slightly higher concentrations of 25(OH)D, the population had low vitamin D, with less than 7% meeting the Endocrine Society’s recommendation of 25(OH)D above 30 ng/mL. 25
Baseline Participant Demographics by Categories of Milk Intake in 1,610 Study of Environment, Lifestyle and Fibroids Participants with at Least One Follow-Up Ultrasound, Detroit, Michigan, 2010–2012
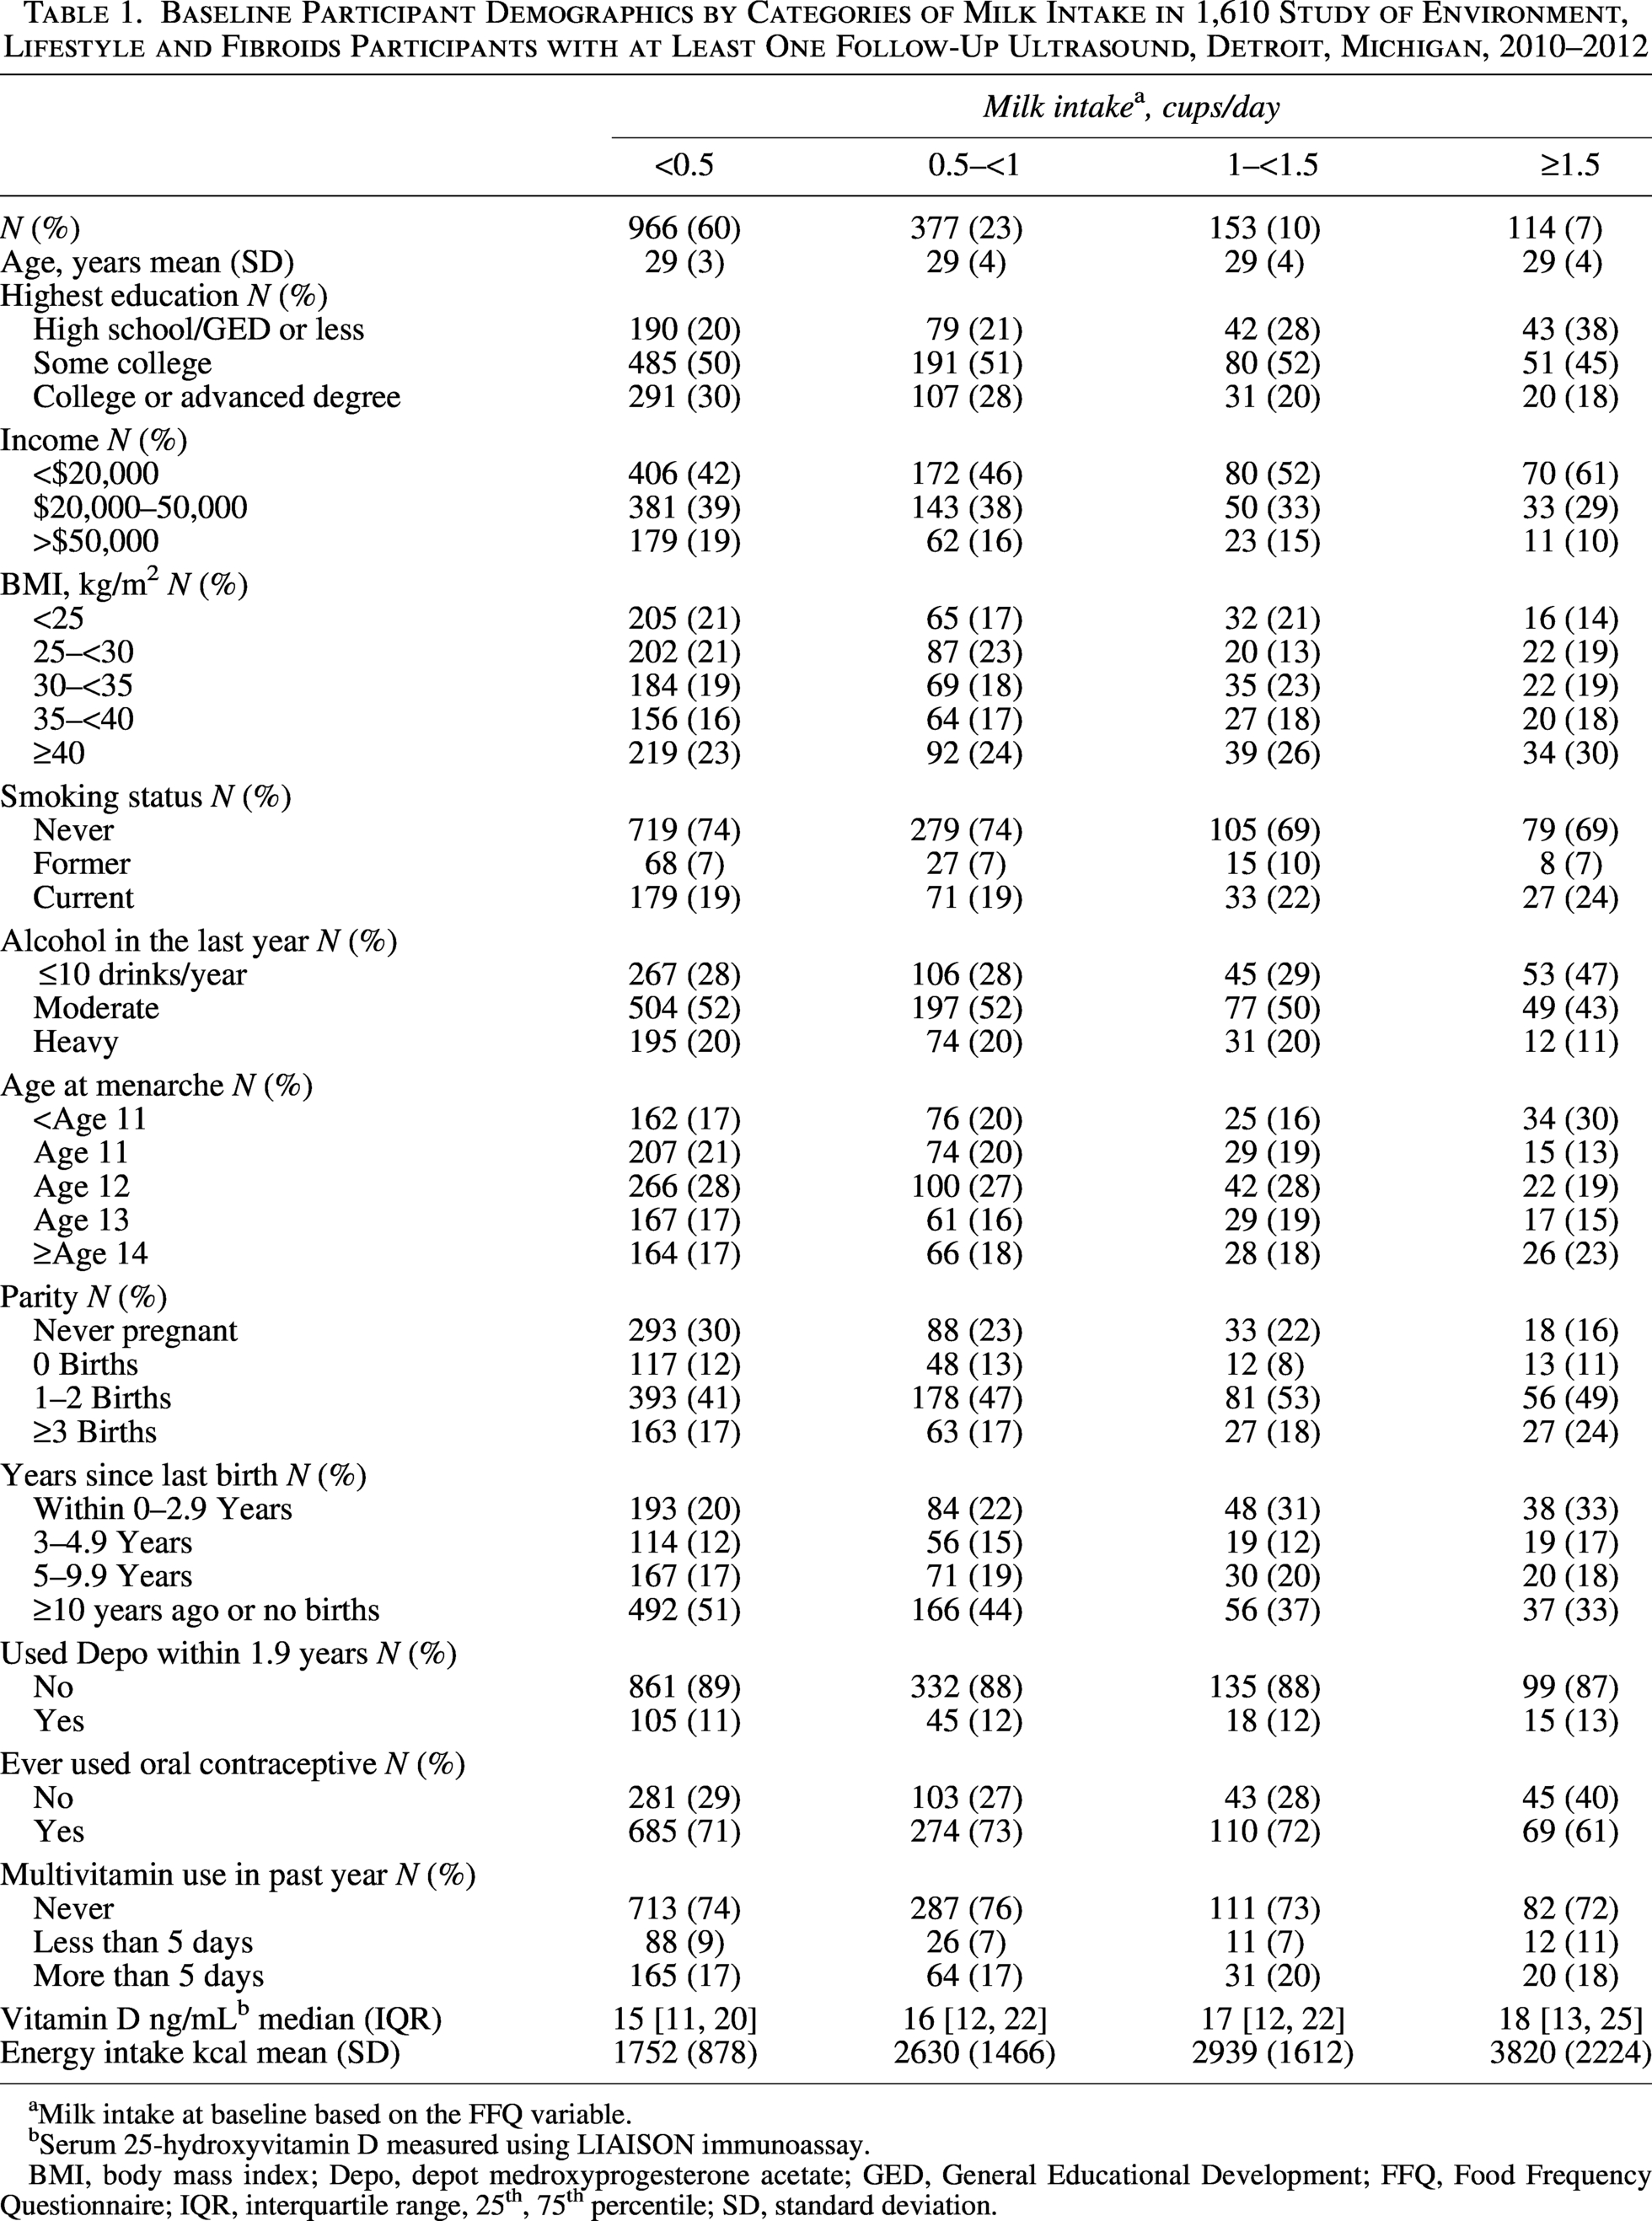
Milk intake at baseline based on the FFQ variable.
Serum 25-hydroxyvitamin D measured using LIAISON immunoassay.
BMI, body mass index; Depo, depot medroxyprogesterone acetate; GED, General Educational Development; FFQ, Food Frequency Questionnaire; IQR, interquartile range, 25th, 75th percentile; SD, standard deviation.
Fibroid incidence and dairy intake
During the 5-year follow-up period (5,323 person-years), 295 incident fibroid cases were detected among 1,232 participants (Table 2). Associations between time-varying milk intake and fibroid incidence were generally null, with no distinguishable pattern by amount of intake when modeled as a 4-level variable or as the dichotomized variable of ≥0.5 versus <0.5 cups (an adjusted HR [aHR] of 1.05, 95% CI = 0.84–1.32). We observed similar null estimates for the FFQ milk intake (≥0.5 vs. <0.5 cups) and fibroid incidence over the first 20 months of study with an aHR of 1.02 (95% CI = 0.67–1.54). Associations for higher versus lower intake of the other dairy products from the FFQ and 20-month fibroid incidence were also close to the null: total dairy (an aHR of 1.07, 95% CI = 0.70–1.65), low-fat dairy (an aHR of 1.09, 95% CI = 0.70–1.71), cheese (an aHR of 0.94, 95% CI = 0.61–1.45), and yogurt (an aHR of 0.88, 95% CI = 0.48–1.63).
Association Between Daily Dairy Intake and Fibroid Incidence: Study of Environment, Lifestyle and Fibroids 2010–2018 (n = 1,232 Participants)
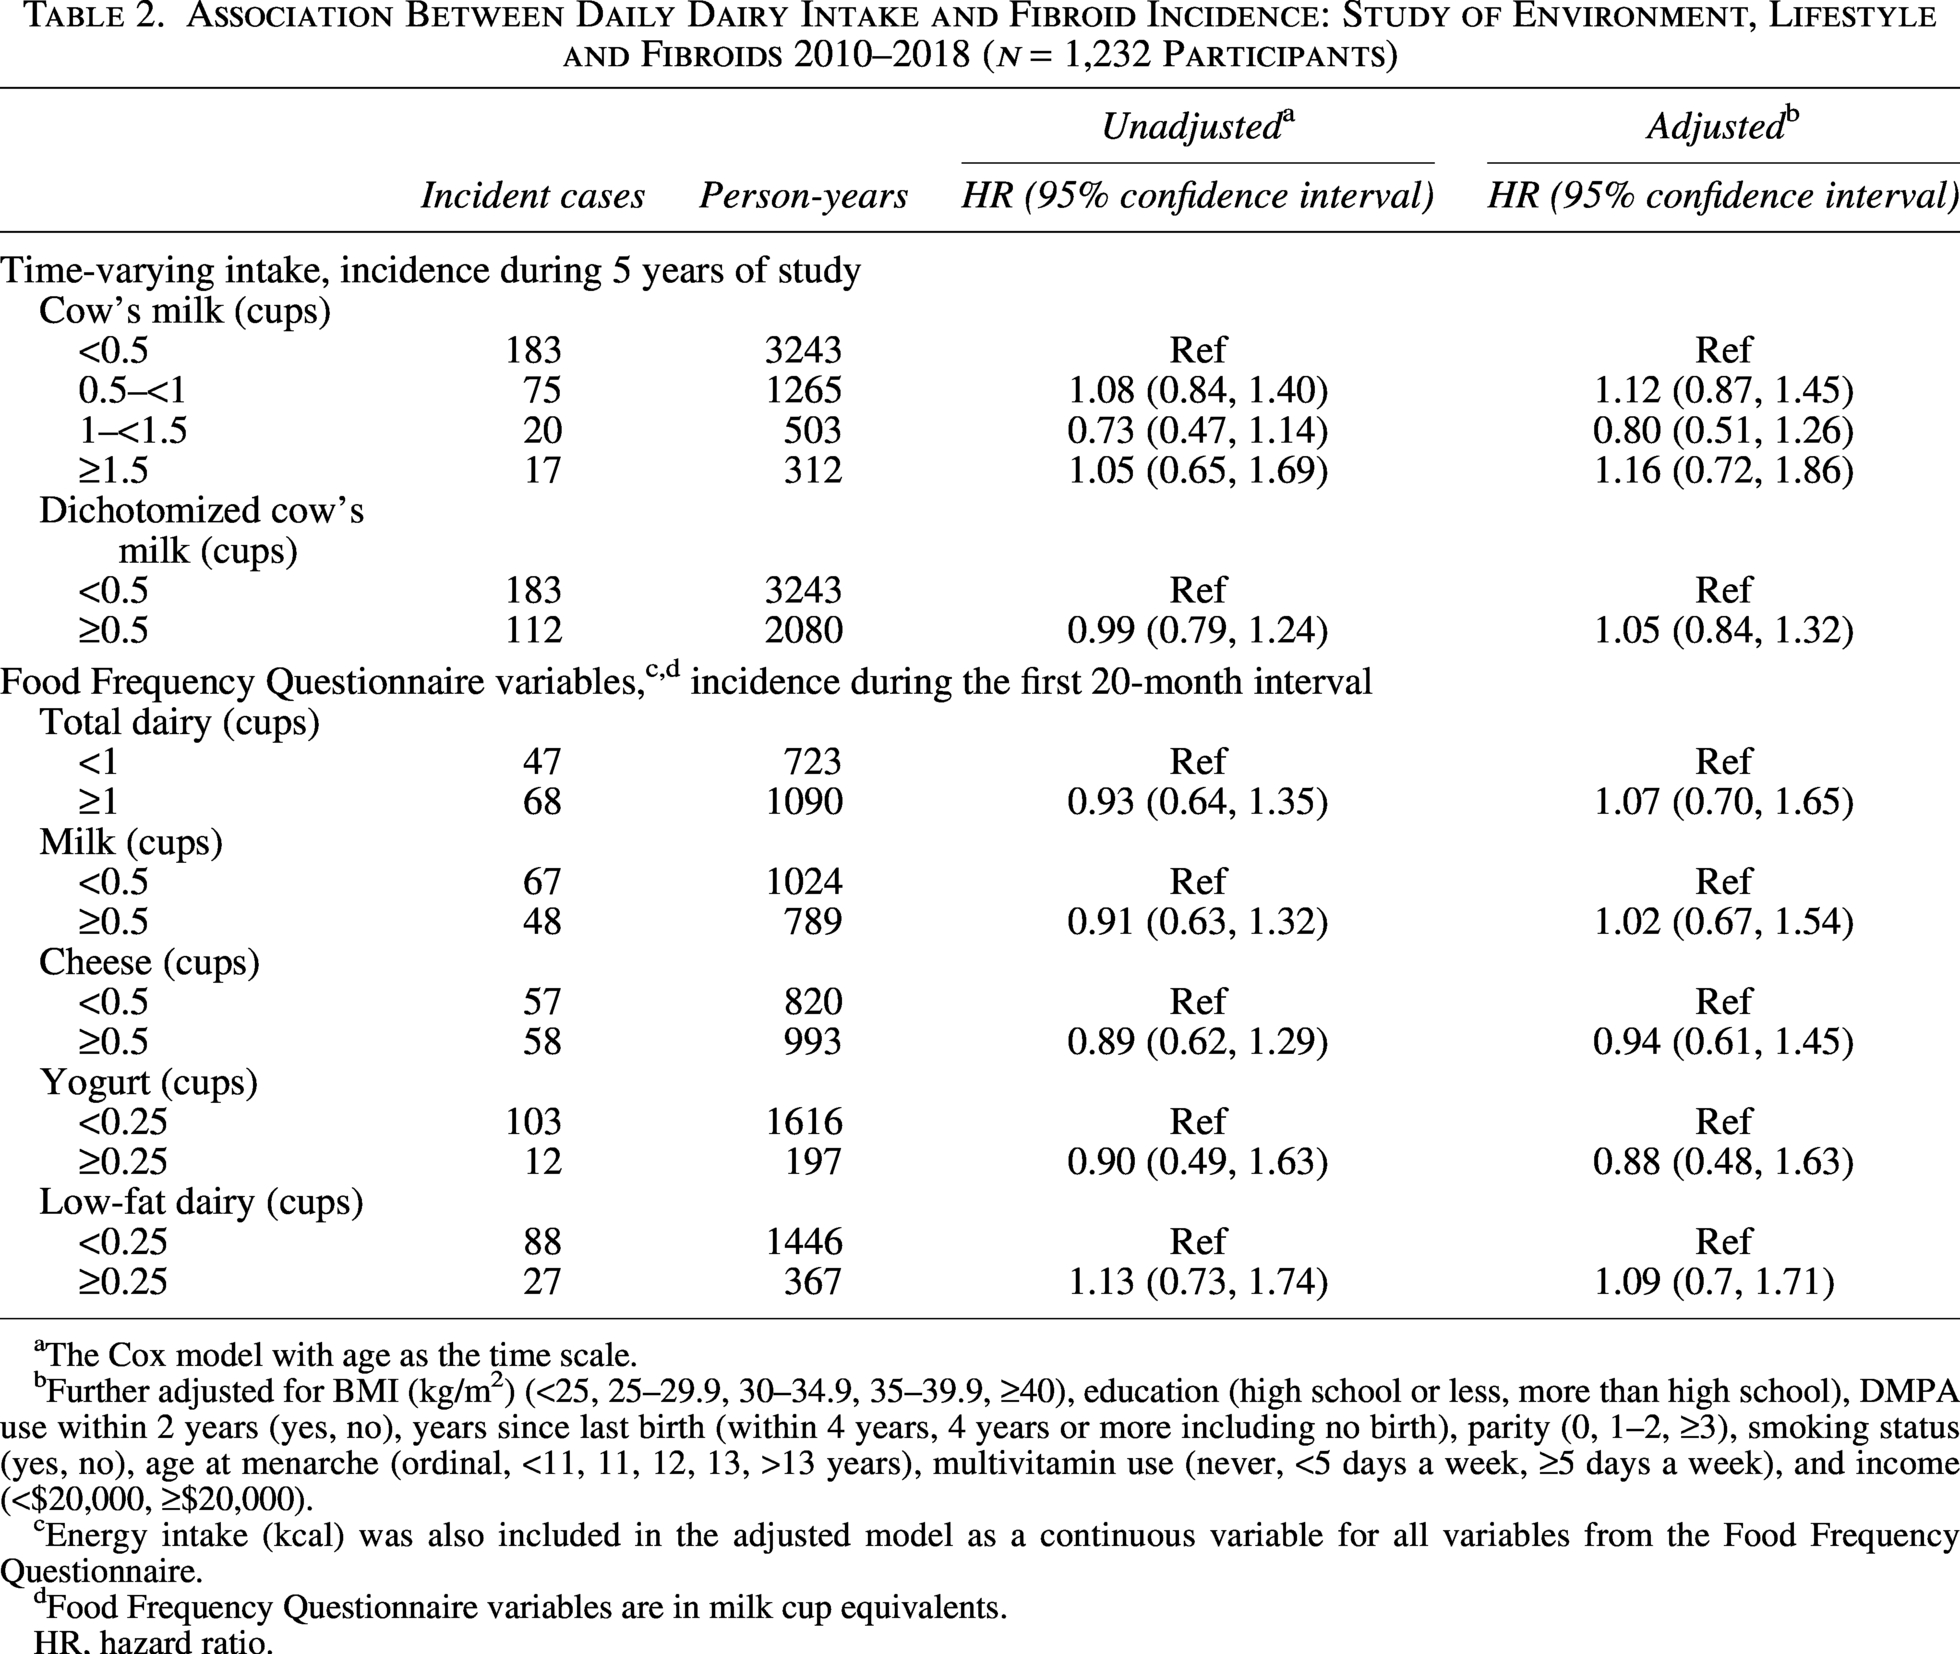
The Cox model with age as the time scale.
Further adjusted for BMI (kg/m2) (<25, 25–29.9, 30–34.9, 35–39.9, ≥40), education (high school or less, more than high school), DMPA use within 2 years (yes, no), years since last birth (within 4 years, 4 years or more including no birth), parity (0, 1–2, ≥3), smoking status (yes, no), age at menarche (ordinal, <11, 11, 12, 13, >13 years), multivitamin use (never, <5 days a week, ≥5 days a week), and income (<$20,000, ≥$20,000).
Energy intake (kcal) was also included in the adjusted model as a continuous variable for all variables from the Food Frequency Questionnaire.
Food Frequency Questionnaire variables are in milk cup equivalents.
HR, hazard ratio.
Fibroid growth and dairy intake
Table 3 shows the results for fibroid growth estimates associated with dairy intake. Growth over the 5-year study was lower during the 323 intervals characterized by 0.5–<1 cups of cow’s milk versus <0.5 cups [% difference = −11.6 (95% CI = −19.5, −2.9)], but the relatively small number of intervals with higher cow’s milk intakes (1–<1.5 cups and ≥1.5 cups) showed no reduction in growth. Higher intake of dairy, milk, and cheese based on the FFQ variables was strongly associated with reduced growth during the first study interval (Table 3). Individuals with a higher intake of milk (
Associations Between Milk Intake and Fibroid Growth: Study of Environment, Lifestyle and Fibroids 2010–2018 (n = 429 Participants)
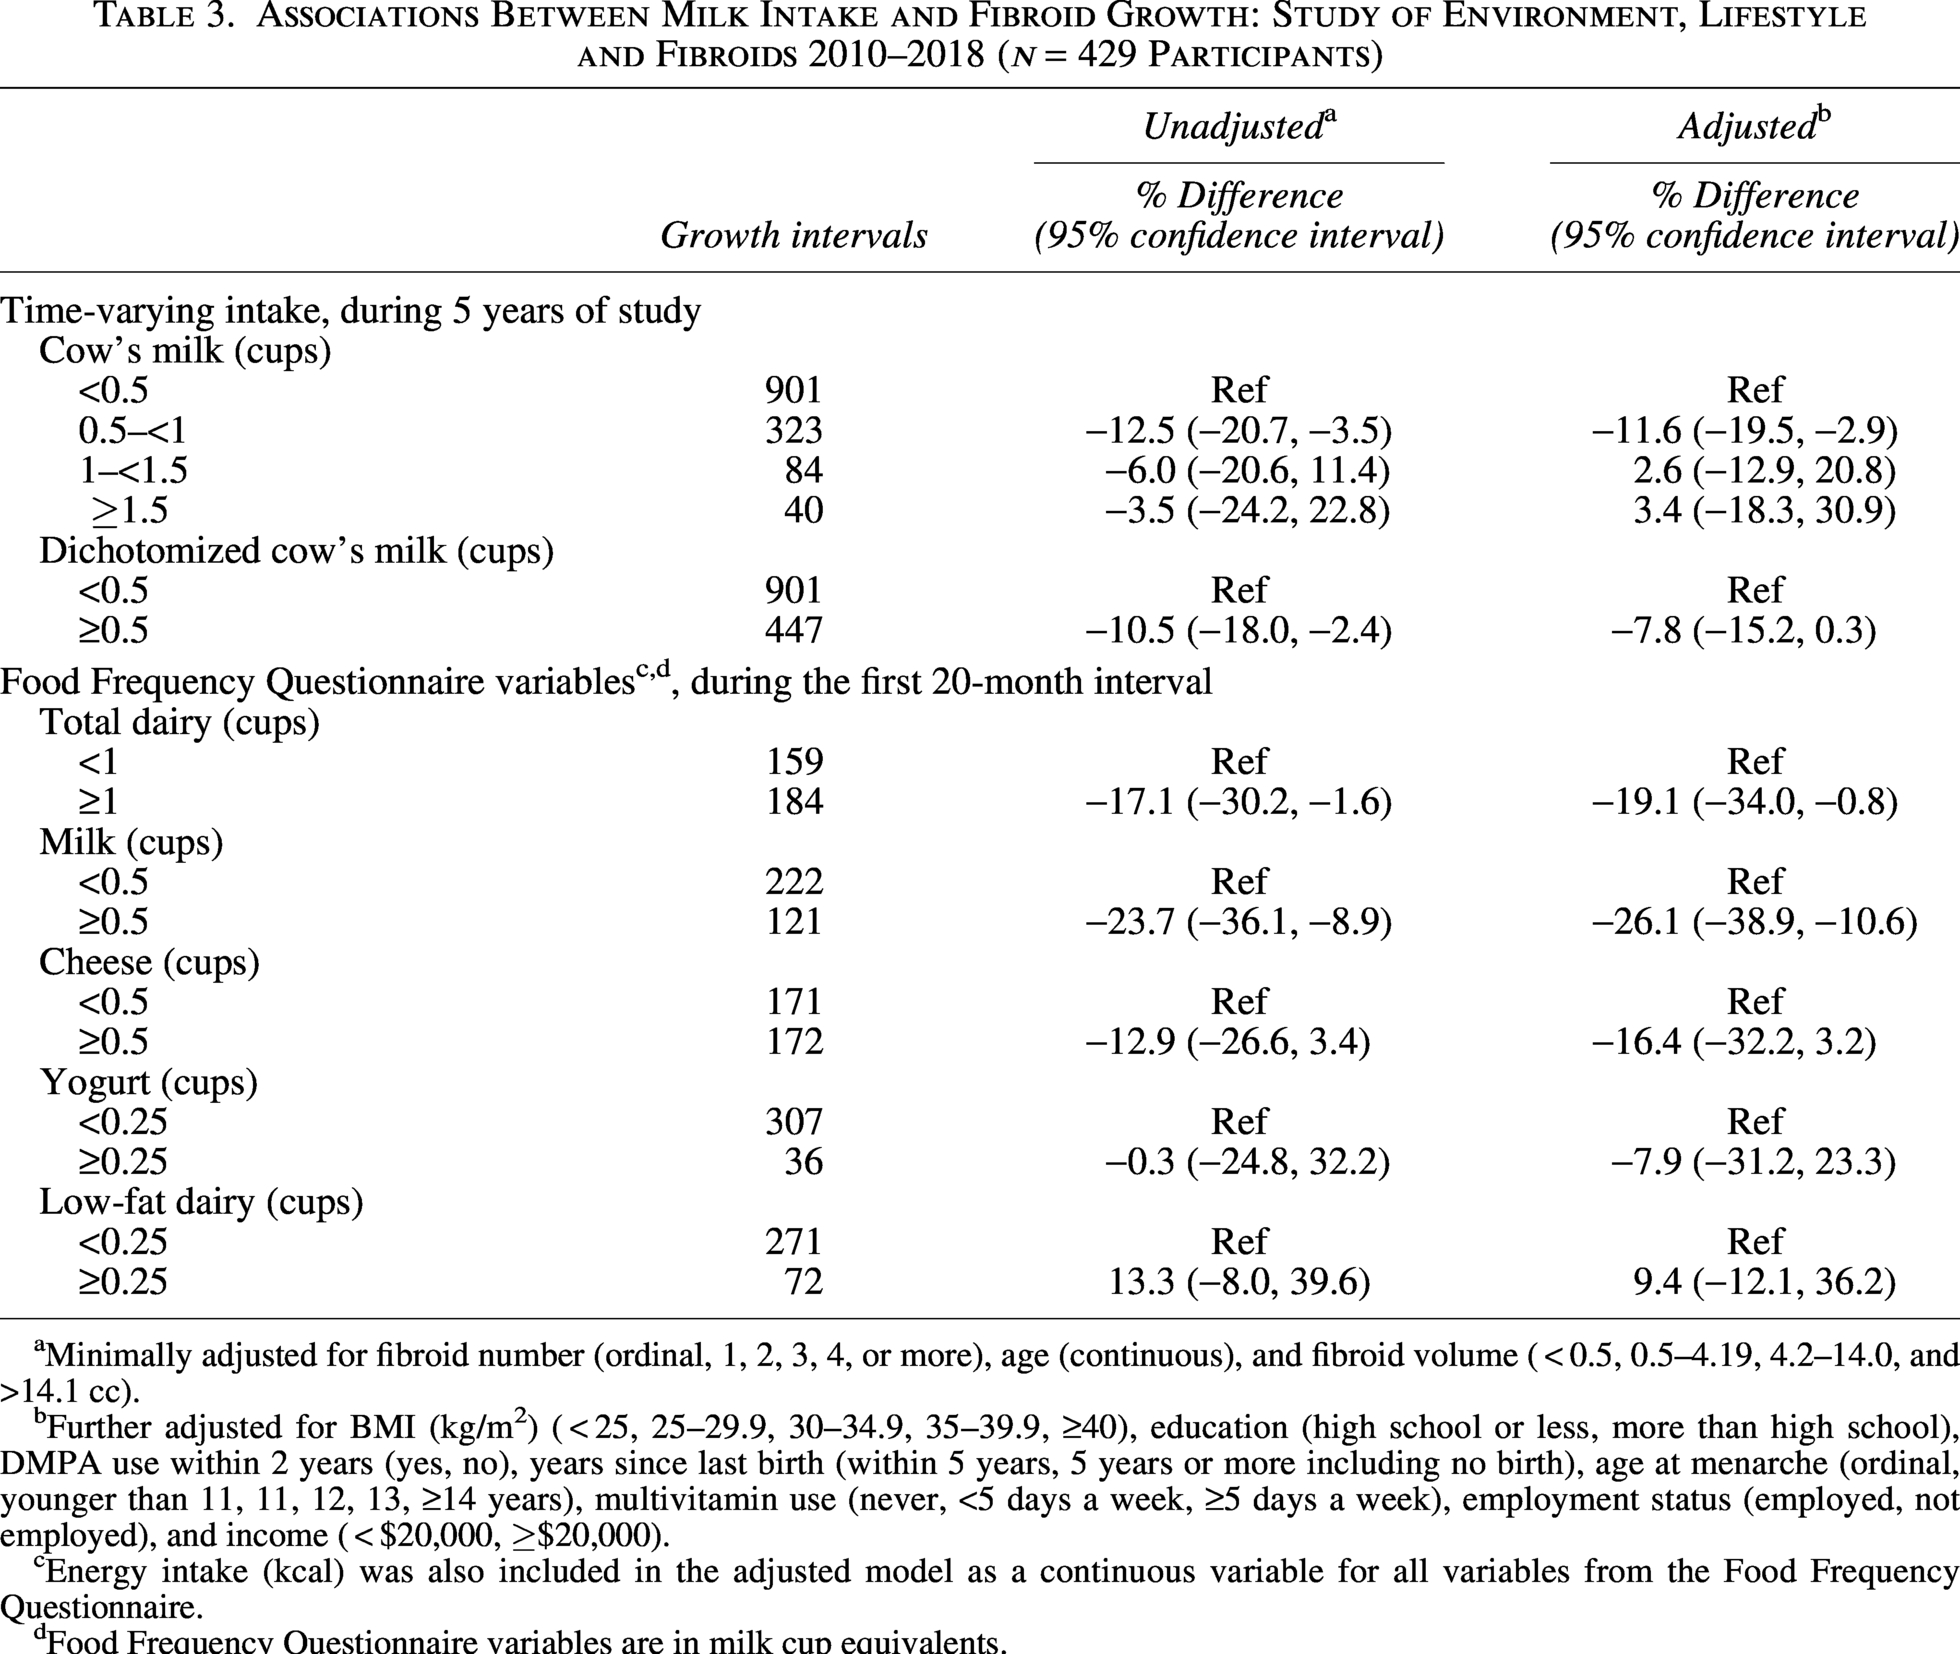
Minimally adjusted for fibroid number (ordinal, 1, 2, 3, 4 or more), age (continuous), and fibroid volume (
Further adjusted for BMI (kg/m2) (
Energy intake (kcal) was also included in the adjusted model as a continuous variable for all variables from the Food Frequency Questionnaire.
Food Frequency Questionnaire variables are in milk cup equivalents.
Adjusting for 25(OH)D concentrations did not meaningfully change estimates from our primary analyses of either incidence or growth (Supplementary Table S2).
Secondary analysis
On average, SELF participants reported higher milk consumption at 10 years old than they did in adulthood. At this younger age, 72% reported drinking at least 1 cup of milk per day. However, of those, only 9% continued to drink at least 1.5 cups of milk per day during adulthood (Supplementary Table S3). Despite a broader range of milk intake in childhood, we observed generally weak or inconsistent associations with fibroid incidence and growth (Supplementary Table S4).
Discussion
In this prospective ultrasound cohort study with 5 years of follow-up, dairy intake was not materially associated with fibroid incidence. However, we did see some evidence that higher dairy intake was associated with a reduction in the fibroid growth rate. Milk and total dairy intake estimated using an FFQ showed the strongest associations in the 20 months following baseline. Associations for other specific dairy products assessed on the FFQ also indicated lower fibroid growth, though associations were generally imprecise. Using the harmonized variable, we did see that intake of ≥0.5 cups of cow’s milk/day across the study was associated with an 8% reduction in growth compared with <0.5 cups/day; this association appeared to be driven by those drinking 0.5
The stronger associations observed for growth over the first 20 months as compared with the full 5-year study period could relate to differences in how dairy intake was defined for the statistical analyses. The FFQ asked about 100+ food and beverage items and used these responses to calculate the total dairy variable, which included yogurt, cheese, and milk, as well as estimates of milk, yogurt, cheese, and whey present in other foods. The FFQ milk variable included fluid milk (including calcium-fortified soy milk), buttermilk, evaporated milk, and dry milk consumed as a drink and incorporated into other drinks (e.g., coffee) or foods (e.g., cream soups, cereal, and baked goods). In contrast, the data collected at follow-up visits were limited specifically to cow’s milk as a drink or consumed in other foods that include milk (e.g., pancakes). The literature on dairy intake and fibroid risk has been limited, and previous studies have inconsistent findings. The Black Women’s Health Study (BWHS), a prospective cohort study with self-reported clinical diagnoses of fibroids, reported a lower incidence rate of fibroids with greater intake of total dairy foods and milk (≥14 servings per week). 10 Of the other dairy foods examined in the BWHS, only yogurt (≥7 servings/week) was found to have a suggestive inverse association. The Nurses’ Health Study II (NHS), which enrolled mostly White participants, is another prospective cohort study with self-reported clinically diagnosed fibroids, reported a decreased incidence rate of fibroids among participants with high total dairy intake (>4 servings/day), with yogurt consumption being an important contributor. 11 The levels of consumption that showed inverse associations with fibroid incidence in both BWHS and the NHS could not be evaluated in SELF, given the generally low dairy consumption in SELF.
Outside of the United States, where dietary patterns differ and food composition may vary, a cross-sectional study among pre- and postmenopausal private clinic patients in South Korea observed a reduction in the odds of ultrasound-detected fibroids among patients with the highest quartiles of dairy consumption (Q4 vs. Q1, odds ratio = 0.6, 95% CI = 0.4–1.0). 13 A case-control study of surgical fibroid cases and hospital controls from Italy reported a null association between the intake of milk or cheese and the odds of histologically confirmed fibroids, although the association with higher milk consumption was an odds ratio of 1.2 (95% CI = 1.0, 1.6). 12 There was no association found between dairy consumption and ultrasound-detected or hysterectomy-confirmed fibroids among 283 pre- and postmenopausal patients in a hospital setting in Beijing, China. 14 Differences in the direction and magnitude of effects in the literature may also be the result of differences in study design and case ascertainment. For example, the BWHS, NHS, and SELF are prospective cohort studies that ascertained diet before the diagnosis of fibroids, thereby avoiding potential for recall bias (differential misclassification of exposure). In contrast, the Italian case-control study was susceptible to recall bias in interviewing cases after fibroid diagnosis. Fibroid cases in the BWHS and NHS were based on diagnoses by ultrasound or surgery self-reported on biannual questionnaires, which, although likely to have high specificity, results in misclassification because participants who have fibroids that have not yet been diagnosed are treated as noncases. In the Italian case-control study, fibroid cases were restricted to those receiving surgical intervention, and controls were hospitalized for other pathologies, a design that also includes controls that may have fibroids and also involves selection on the factors associated with hospitalization. In our study, all participants received an ultrasound at each clinic visit, identifying new cases among those known to be fibroid-free at the baseline ultrasound, thus standardizing and improving timely detection of cases and reducing misclassification of noncases. SELF is also the only study to report on fibroid growth.
Differences in the calendar years of study may also influence differences seen across studies, with SELF as the most recent. Over time, consumption of dairy in the United States has declined. 15,26 Although the 2025 Dietary Guidelines for Americans recommend 3 cups of dairy a day, 27 more than 80% of the U.S. population does not meet this requirement. 26 –28 Of note, Black Americans have the lowest consumption of dairy compared with other ethnic groups in the United States, 15,29 and Black American females have lower intakes on average compared with Black American males. 29 Lactose intolerance is more prevalent in Black Americans than White Americans 30,31 ; however, we did not assess reasons for more or less dairy consumption, but this information would be valuable in future studies.
The mechanism underlying a reduction in fibroid growth with increased intake of dairy may be related to a possible decrease in circulating endogenous estradiol observed in those with higher dairy intake, 9 although why estradiol is decreased with increased dairy intake is not known. Cow’s milk can be an important source of vitamin D and calcium, both of which have shown protective associations with fibroid growth 8 and incidence. 10 However, in SELF, neither of these nutrients is likely to explain the observed association due to the low dairy intake. We have previously shown that dietary sources of vitamin D (such as cow’s milk) do not contribute meaningfully to measured serum 25(OH)D in SELF participants. 23 Dietary patterns are complex, and consumption of a specific component, such as cow’s milk, occurs in the context of other dietary choices. We had limited dietary data, apart from cow’s milk consumption and measured 25(OH)D, after baseline; therefore, we were unable to account for the time-varying intake of other food items, drinks, or nutrients that may be correlated with higher (or lower) intake of cow’s milk or examine overall dietary patterns (e.g., vegan), which would capture a more holistic measure of related nutrient intake.
Despite the relatively low dairy intake for this cohort, the study has important strengths. This is the first study to identify new fibroid cases with prospective ultrasound examinations and the first to examine associations between dairy and fibroid growth. For fibroid incidence and growth, we examined a variety of dairy intake variables, including FFQ variables, which showed reduced fibroid growth over the first observed 20-month study interval for those with higher intake. We utilized a time-varying measure of cow’s milk intake to examine fibroid development over the study. Better assessment of intake of detailed products over time, including frequency and the amount of consumption of specific types of milk and overall dietary patterns, will be important for future studies.
In summary, although no strong patterns of association between dairy intake and fibroid incidence were identified, we observed reduced fibroid growth with higher intake of milk and total dairy in the first 20-month interval. The low dairy intake in the SELF cohort is consistent with patterns observed for women and Black Americans in the United States. 29,32 If dairy consumption at relatively high intake levels is protective against fibroid incidence, as suggested by BWHS and NHS data, the pattern of low consumption seen in SELF may be one of many yet-to-be-identified factors that put Black Americans at particularly high risk of fibroids.
Authors’ Contributions
K.V.A.: Conceptualization, formal analysis, and writing—original draft. L.A.W.: Conceptualization, funding acquisition, methodology, project administration, and writing—reviewing and editing. G.R.W.: Data curation, funding acquisition, investigation, project administration, and writing—reviewing and editing. A.M.Z.J.: Funding acquisition, project administration, supervision, and writing—reviewing and editing. D.D.B.: Conceptualization, data curation, funding acquisition, investigation, project administration, supervision, and writing—reviewing and editing. Q.E.H.: Conceptualization, data curation, formal analysis, methodology, writing—original draft, and writing—reviewing and editing.
Footnotes
Data Availability
Some or all datasets generated during and/or analyzed during the current study are not publicly available but are available from the corresponding author on reasonable request.
Author Disclosure Statement
A.M.Z.J. is the (unpaid) chair of the Environment and Reproduction Special Interest Group of the American Society for Reproductive Medicine and received a travel award in 2024 from the Society for Epidemiologic Research. L.A.W. receives in-kind donations from Kindara.com, a fertility app. and, in the last 3 years, has served as a paid consultant for AbbVie, Inc., and the Gates Foundation. The remaining authors have no disclosures to report. The contributions of the NIH authors were made as part of their official duties as NIH federal employees, are in compliance with agency policy requirements, and are considered Works of the U.S. Government. However, the findings and conclusions presented in this article are those of the authors and do not necessarily reflect the views of the NIH or the U.S. Department of Health and Human Services.
Funding Information
This work was supported by the Intramural Research Program of the NIH, the National Institute of Environmental Health Sciences (ZIAES09013 and ZIAES103333), and the funds from the American Recovery and Reinvestment Act designated for National Institute of Health research. The NIH Office of Disease Prevention provided co-funding for baseline visit vitamin D assays.
Supplemental Material
References
Supplementary Material
Please find the following supplemental material available below.
For Open Access articles published under a Creative Commons License, all supplemental material carries the same license as the article it is associated with.
For non-Open Access articles published, all supplemental material carries a non-exclusive license, and permission requests for re-use of supplemental material or any part of supplemental material shall be sent directly to the copyright owner as specified in the copyright notice associated with the article.