
Abstract
Background:
Metabolic syndrome and related abnormalities, including insulin resistance and hyperinsulinemia, remain critical public health challenges, particularly among women. However, recent nationwide trends and diet-related determinants have not been fully explored.
Methods:
4,426 women aged ≥18 years from the 2013–2023 National Health and Nutrition Examination Survey were included. Metabolic syndrome (MetS) was defined according to NCEP ATP III, WHO, and International Diabetes Federation criteria. Additional outcomes included elevated hemoglobin A1c (HbA1c ≥ 5.7%), hyperinsulinemia (≥10 μU/mL), and IR (HOMA-IR ≥ 2.6). Survey-weighted logistic regression and generalized structural equation modeling were used to examine temporal trends and dietary associations, adjusting for race/ethnicity, menopausal stage, physical activity, and energy intake.
Results:
Overall prevalence of MetS remained around 20%, whereas IR and hyperinsulinemia affected over 40% of women, peaking during 2017–2020. Later menopausal stages were strongly associated with higher odds of MetS, IR, and hyperinsulinemia. Moderate-carbohydrate diets became more common. Low-carbohydrate diets, which remained rare (<2%), were associated with lower odds of elevated HbA1c (odds ratio [OR] = 0.40, 95% confidence interval [CI]: 0.15–1.00) and hyperinsulinemia (OR = 0.35, 95% CI: 0.14–0.87). Higher fiber and monounsaturated fatty acid intakes were inversely associated with MetS and insulin-related markers, whereas greater omega-6 fatty acid intake and higher omega-6:omega-3 ratios were positively associated with insulin resistance. Elevated protein intake was protective among perimenopausal and naturally menopausal women.
Conclusions:
Between 2013 and 2023, U.S. women exhibited persistently high rates of metabolic abnormalities, with risk increasing across menopausal stages. Low-carbohydrate diets with higher fiber, monounsaturated fat, protein, and lower omega-6:omega-3 ratios were associated with improved metabolic health.
Introduction
Metabolic syndrome (MetS), characterized by a cluster of metabolic abnormalities such as hypertension, dyslipidemia, and hypertriglyceridemia, has become a major global public health concern. Using data from the National Health and Nutrition Examination Survey (NHANES), the prevalence of MetS increased from 29% to 34% between 1999 and 2006, 1 remained around 35% during the 2010s,2,3 and further increased to 41% in 2018. 4 Similarly, mean fasting insulin concentrations rose by approximately 5% among nondiabetic U.S. adults from 1988 to 2002, 5 whereas the prevalence of hyperinsulinemia increased from 28.2% in 1999–2000 to 41.4% in 2017–2018, and IR prevalence from 24.8% to 38.4% over the same period. 6
Beyond its increasing prevalence, MetS is a major public health concern due to its strong associations with various long-term adverse health outcomes. MetS is closely linked to insulin resistance (IR), a state in which insulin-sensitive tissues (e.g., skeletal muscle, liver, and adipose tissue) exhibit reduced responsiveness to insulin; and it is often co-occurring with hyperglycemia, defined as elevated blood glucose levels meeting established diagnostic thresholds (e.g., HbA1c ≥ 6.5%) for impaired glucose regulation or diabetes, and hyperinsulinemia, defined as elevated fasting serum insulin concentrations.7,8 Collectively, these metabolic disturbances substantially increase the risk of type 2 diabetes mellitus, cardiovascular disease, and several cancers.9–14 Understanding temporal trends in these risk factors is therefore critical for identifying evolving patterns of metabolic health and disease burden.
There is a higher prevalence of MetS among females compared with males.2,3 A recent study showed that the 2023 global prevalence of MetS was estimated at 31.0% in women and 25.7% in men. 15 In addition, there are inconsistencies in previously reported temporal trends within the female population.1,2 Understanding the sex differences and temporal trends in the prevalence of MetS is clinically and epidemiologically meaningful, reflecting distinct biological, behavioral, and social risk pathways, and underscoring the importance of sex-specific screening, prevention, and intervention strategies. However, given the significance and the remaining inconsistency, studies focused on the female population are limited, especially on female populations across various menopausal stage subgroups.
Using NHANES data from 2013 to 2023, this study aims to examine decade-long temporal trends in MetS, as well as related metabolic abnormalities—including elevated hemoglobin A1c (HbA1c), hyperinsulinemia, and IR—among U.S. women. Given the absence of a single gold-standard definition of MetS, this study applied the National Cholesterol Education Program Adult Treatment Panel III (NCEP ATP III), the World Health Organization (WHO), and the International Diabetes Federation (IDF) criteria to capture differences in diagnostic frameworks, enhance comparability with prior research, and assess the robustness of prevalence trends across commonly used definitions.
Furthermore, dietary composition plays a crucial role in metabolic health by directly regulating glucose homeostasis, lipid metabolism, and systemic inflammation. In particular, high carbohydrate diets increase glucose level and insulin secretion, affect triglyceride levels, and blood pressure,16,17 all of which are core components of MetS. Given the significance of diets on metabolic health, this study further investigates the prevalence of different diet types and explores associations between macronutrient intake and various metabolic health markers.
Materials and Methods
Participants and study design
This study utilized data from multiple waves of NHANES data conducted between 2013 and 2023. NHANES employs a multistage, stratified, clustered probability sampling design to produce nationally representative estimates of the U.S. civilian, noninstitutionalized population.
We included female adults aged 18 years and older who had complete data on all variables of interest. Among a total of 47,639 participants across the 2013–2023 NHANES cycles, we excluded individuals who were younger than 18 years (n = 17,688), those with missing data on key variables (n = 21,372), those with implausible biomarker values exceeding physiological ranges (n = 298), and male participants (n = 3,855). After exclusions, the final analytic sample comprised 4,426 female adults (Fig. 1).
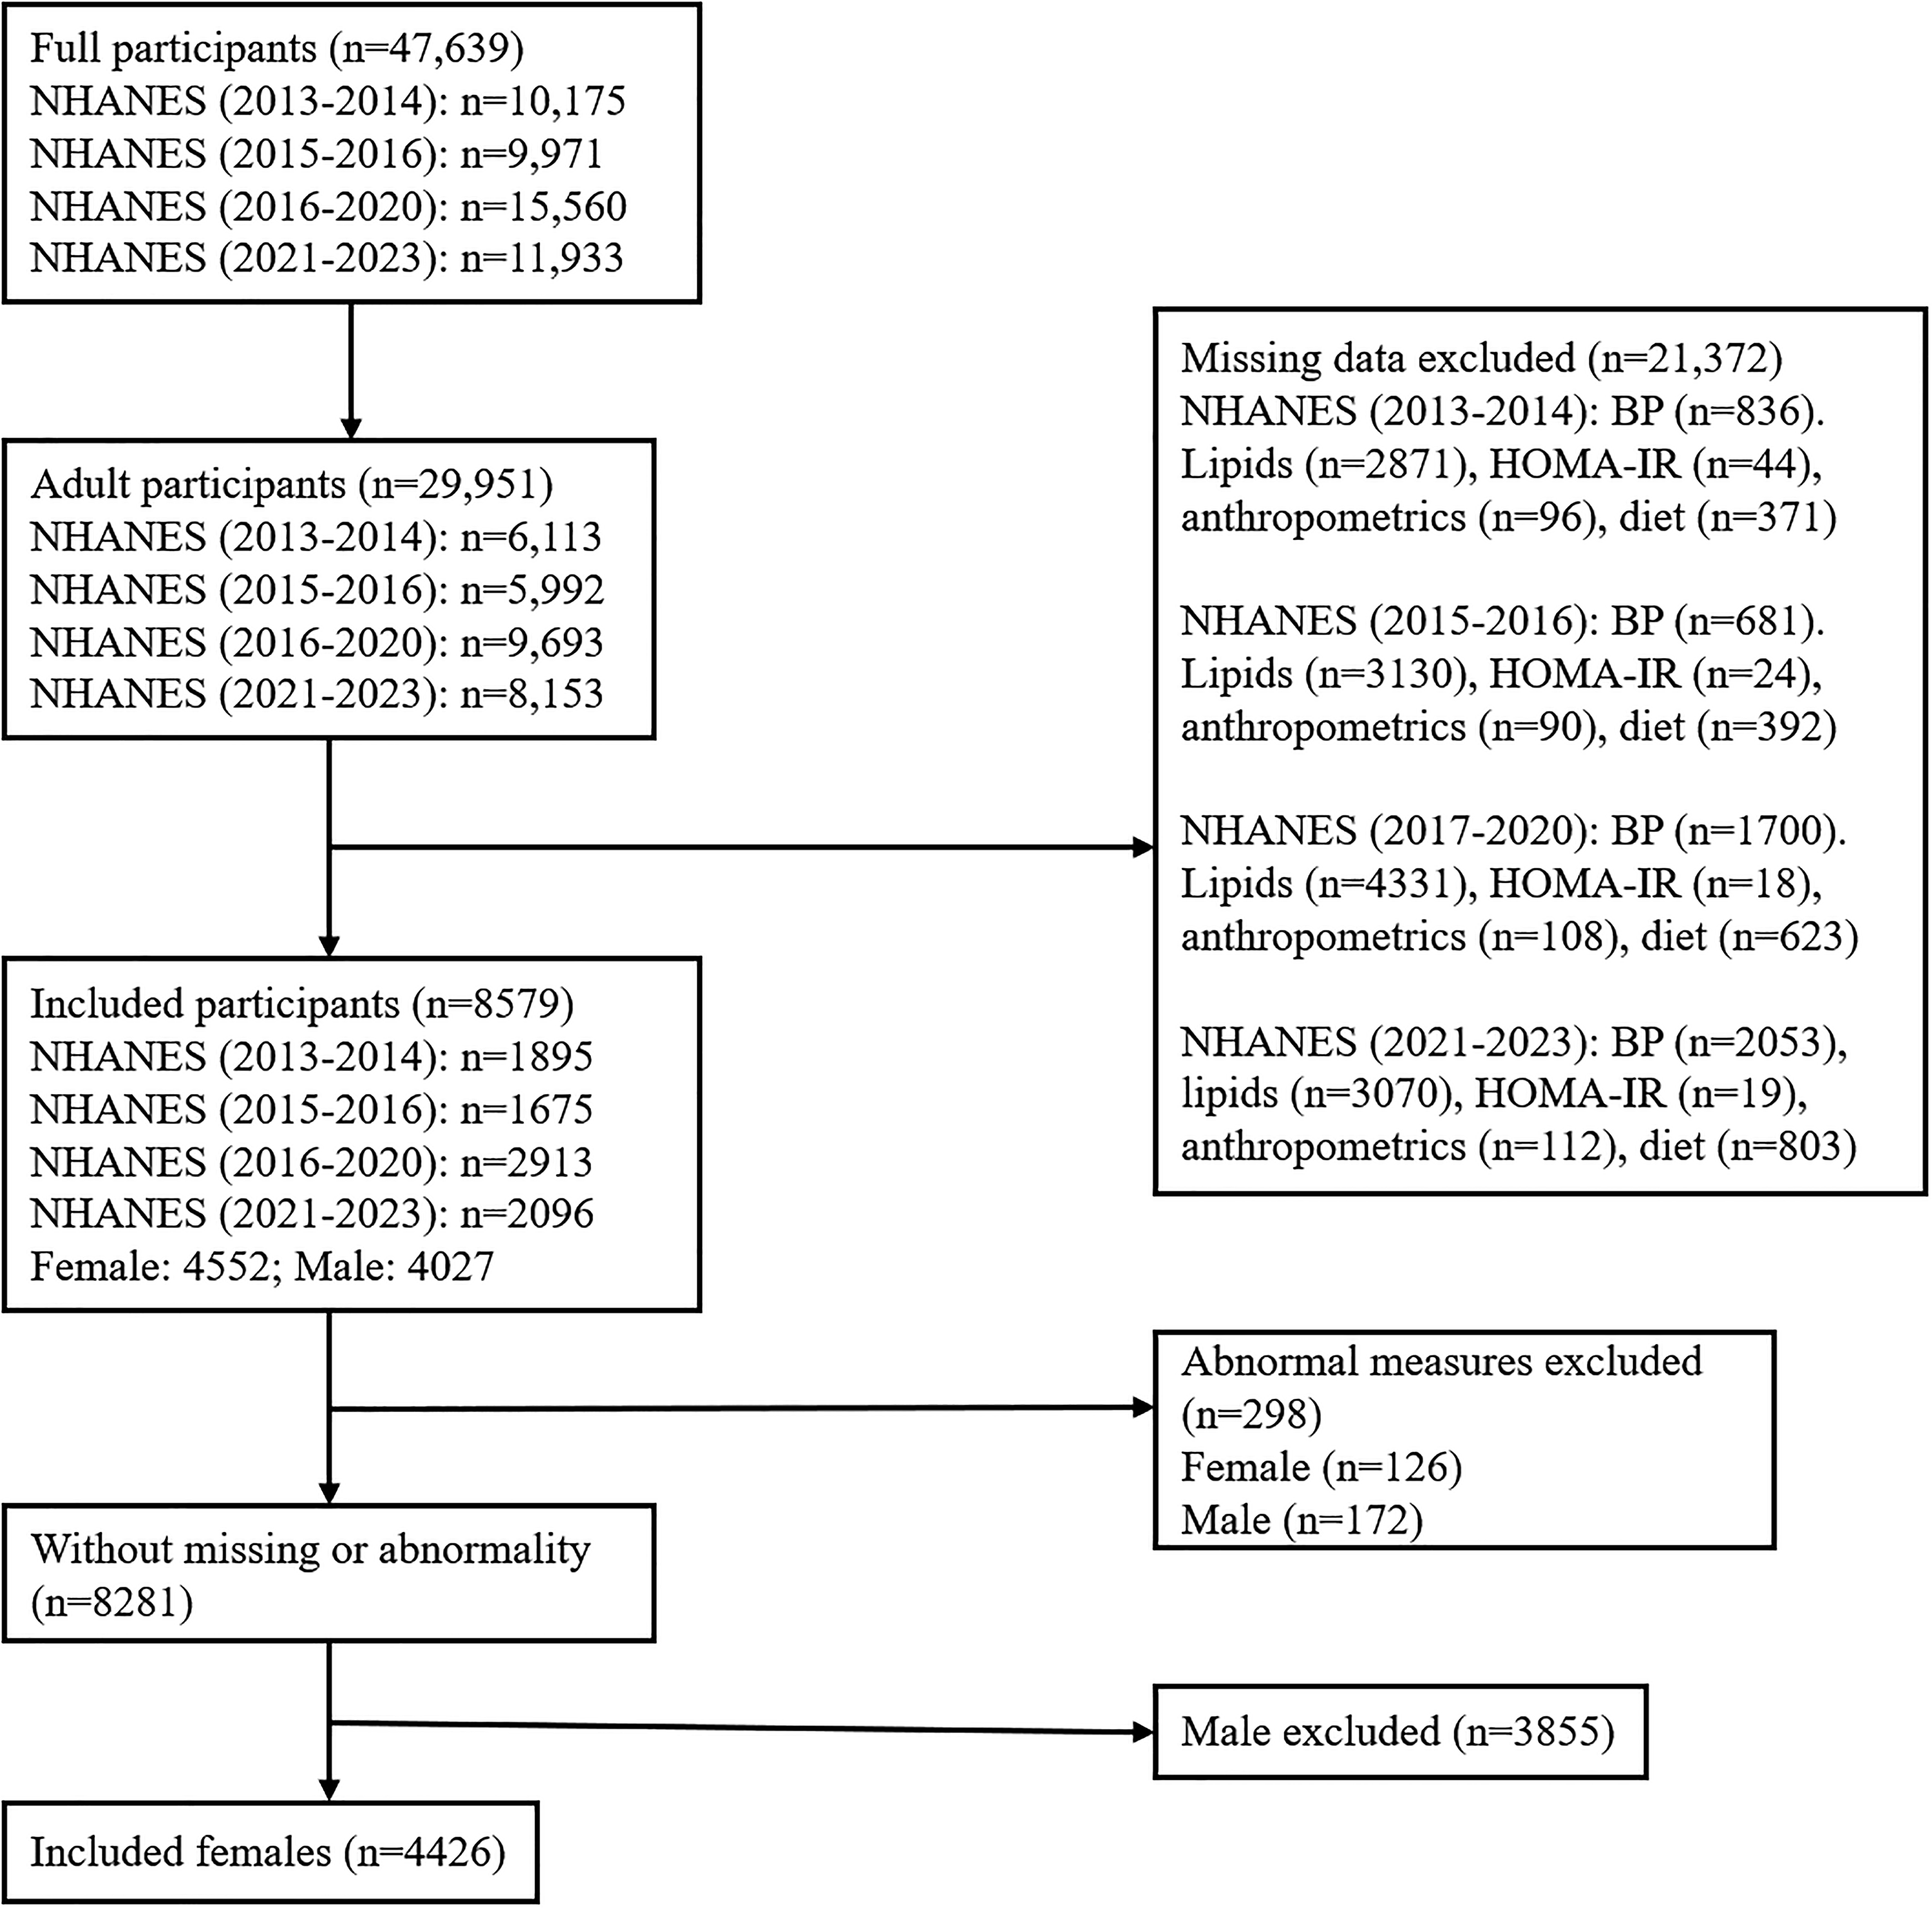
Study population flow diagram. flowchart illustrating the inclusion and exclusion criteria applied to the NHANES 2013–2023 dataset, resulting in a final sample of 4,426 females included in the study. NHANES, National Health and Nutrition Examination Survey.
Measures
MetS
Metabolic syndrome (MetS) was defined according to three widely used diagnostic criteria: the NCEP ATP III, the WHO, and the IDF. 18 Each classification identifies MetS based on five core components—abdominal obesity, elevated triglycerides, reduced high-density lipoprotein cholesterol (HDL-C), elevated blood pressure, and impaired glucose regulation—with slight variations in the specific cut-off values and required conditions. In accordance with these definitions, participants who met three or more of the five criteria under each classification were considered to have MetS (Table 1). Medication use was not adjusted for, despite its potential influence on biomarker measurements, because the study focused on temporal trends in measured metabolic markers and MetS prevalence, and because medication information was limited and inconsistently recorded across NHANES cycles.
Diagnostic Criteria for the Metabolic Syndrome
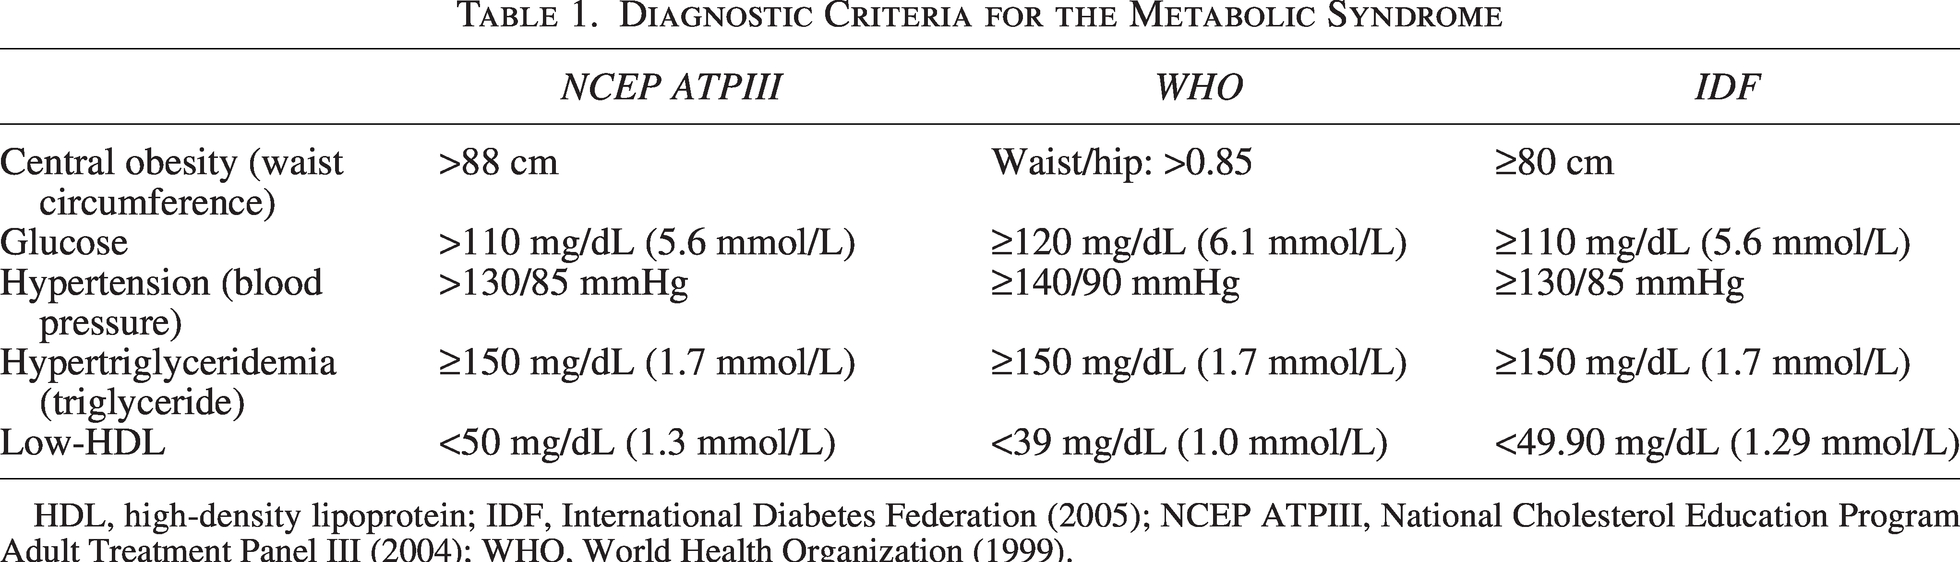
HDL, high-density lipoprotein; IDF, International Diabetes Federation (2005); NCEP ATPIII, National Cholesterol Education Program Adult Treatment Panel III (2004); WHO, World Health Organization (1999).
Other metabolic health indicators
An elevated HbA1c level was defined as ≥ 5.7% in accordance with the American Diabetes Association
19
guidelines. Following prior NHANES-based studies, hyperinsulinemia was defined as fasting serum insulin levels ≥ 10 μU/mL,
6
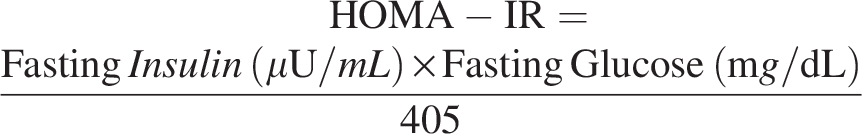
and insulin resistance was defined as a Homeostasis Model Assessment of Insulin Resistance (HOMA-IR) index ≥ 2.6, corresponding to the 66.7th percentile.6,20 HOMA-IR was calculated as:
Dietary intakes
Dietary analysis in this study was limited to macronutrient intake, especially carbohydrate intake, given its direct role in glucose/insulin, triglycerides, cholesterol, blood pressure, and obesity,16,17 which are the focal criteria for MetS. Fiber, non-fiber carbohydrates, monounsaturated fatty acids (MUFAs), polyunsaturated fatty acids (PUFAs), saturated fatty acids (SFAs), and protein were included in the analysis. In the NHANES datasets, such dietary intakes were assessed using two 24-hour dietary recall interviews. In this study, the usual daily intake for each participant was calculated as the mean of all available 24-hour dietary recalls.21–23 For PUFAs, ω-3 fatty acids included octadecatrienoic acid (18:3), octadecatetraenoic acid (18:4), eicosapentaenoic acid (20:5), docosapentaenoic acid (22:5), and docosahexaenoic acid (22:6). ω-6 fatty acids included octadecadienoic acid (18:2) and eicosatetraenoic acid (20:4).23,24
Total energy intake (kcal/day) was estimated using the standard Atwater factors:
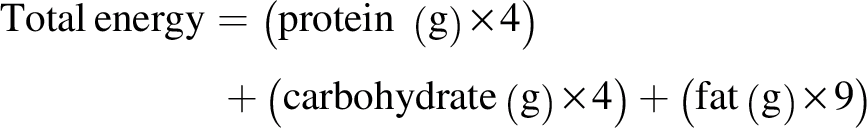
The percentage contribution of each macronutrient (protein, carbohydrate, and fat) to total energy intake was calculated accordingly. Following previous research, 23 detailed macronutrient variables were also categorized into tertiles (T1: <33rd percentile; T2: 33rd–67th percentile; T3: ≥67th percentile), with T1 serving as the reference group.
To compare dietary patterns, participants were categorized by carbohydrate intake as follows: low-carbohydrate diet (LCD): <26% of total energy from carbohydrates; moderate-carbohydrate diet (MCD): 26%–45% of total energy from carbohydrates; and high-carbohydrate diet (HCD): >45% of total energy from carbohydrates (reference group).
Menopausal stages
Following the Cleveland Clinic guidance, 25 the menopausal stage was categorized into five stages: 18–35 as young adults, 35–45 as perimenopausal, 45–55 as the natural menopausal period, and 55 and over as post-menopausal. The young adults’ group was the reference group in the analysis.
Physical activity
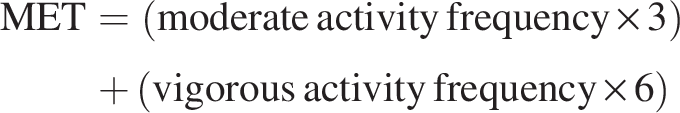
Physical activity was included as a covariate. NHANES assessed activity levels based on the frequency and duration of moderate and vigorous activities during work and leisure time. The Metabolic Equivalent of Task (MET) score was used to quantify total physical activity and was calculated as:
Race/ethnicity
Race/ethnicity was included as a covariate and categorized into six groups: White, Mexican American, Other Hispanic, Asian, Black, and Other. The White group was used as the reference category.
Statistical analysis
Following prior NHANES-based studies,6,24,26,27 fasting subsample weights (WTSAF2YR) were applied to generate nationally representative estimates of biomarker levels. For continuous variables, weighted means and standard errors (SEs) were reported. For categorical variables, unweighted sample counts and weighted percentages were presented.
Trend analyses were conducted using survey-weighted logistic regression models, with the 2013–2014 cycle serving as the reference period. Binary health outcomes were modeled for both the overall female population and within each menopausal stage subgroup. Two regression models were specified: the crude model, including the survey year only; and the adjusted model, controlling for race/ethnicity, dietary type, menopausal stage, and physical activity level.
To account for potential covariances among correlated outcomes, generalized structural equation modeling (GSEM) was employed to examine the associations between dietary patterns (LCDs, MCDs, and HCDs) and binary metabolic health indicators (e.g., high HbA1c, insulin resistance, hyperinsulinemia, dyslipidemia, and elevated waist circumference). Additionally, survey-weighted logistic regressions were used to assess the independent associations between macronutrient components (ω-3 fatty acids, ω-6 fatty acids, MUFAs, SFAs, fiber, non-fiber carbohydrates, and protein) and MetS and other metabolic health indicators.
Given the high exclusion rate due to missing or implausible data, sensitivity analyses, using design-based Pearson chi-square tests, were conducted to compare the demographic characteristics between included and excluded participants to assess potential sample selection bias.
All analyses were performed using Stata version 19.0 (StataCorp LLC, College Station, TX, USA), incorporating survey weights, strata, and primary sampling units (PSUs) to ensure nationally representative estimates.
Results
Participant characteristics
A total of 4,426 adult women from NHANES 2013–2023 were included in the analytic sample after applying exclusion criteria. The weighted proportion for race was non-Hispanic White (64.82%), followed by Black (11.99%), Mexican (7.52%), other Hispanic (6.96%), Asian (4.87%), and other races (3.84%). The weighted distribution of menopausal stages indicated that 29.58% were young adults (18–35 years), 15.72% were perimenopausal (35–45 years), 17.09% were menopausal (45–55 years), and 37.61% were postmenopausal (≥55 years).
Prevalence and trends in metabolic syndrome and related biomarkers across NHANES waves
Table 2 presents the weighted prevalence and logistic trend analyses of MetS and related metabolic abnormalities among 4,426 female participants across four NHANES waves (2013–2014, 2015–2016, 2017–2020, and 2021–2023). Overall, the prevalence of all metabolic health indicators modestly increased over time in the first three waves, with the highest prevalence observed during 2017–2020. Significant increases were found for ATPIII- and IDF-defined MetS from 2013–2014 to 2017–2020 (adjusted odds ratio [OR] = 1.36, 95% confidence interval [CI]: 1.01–1.83). Following the increase, all prevalences decreased in 2021–2023. Insulin resistance and hyperinsulinemia remained highly prevalent, affecting approximately 40%–45% of participants across survey waves.
Weighted Prevalence and Logistic Trend Analysis of Metabolic Indicators Across Menopausal Stages
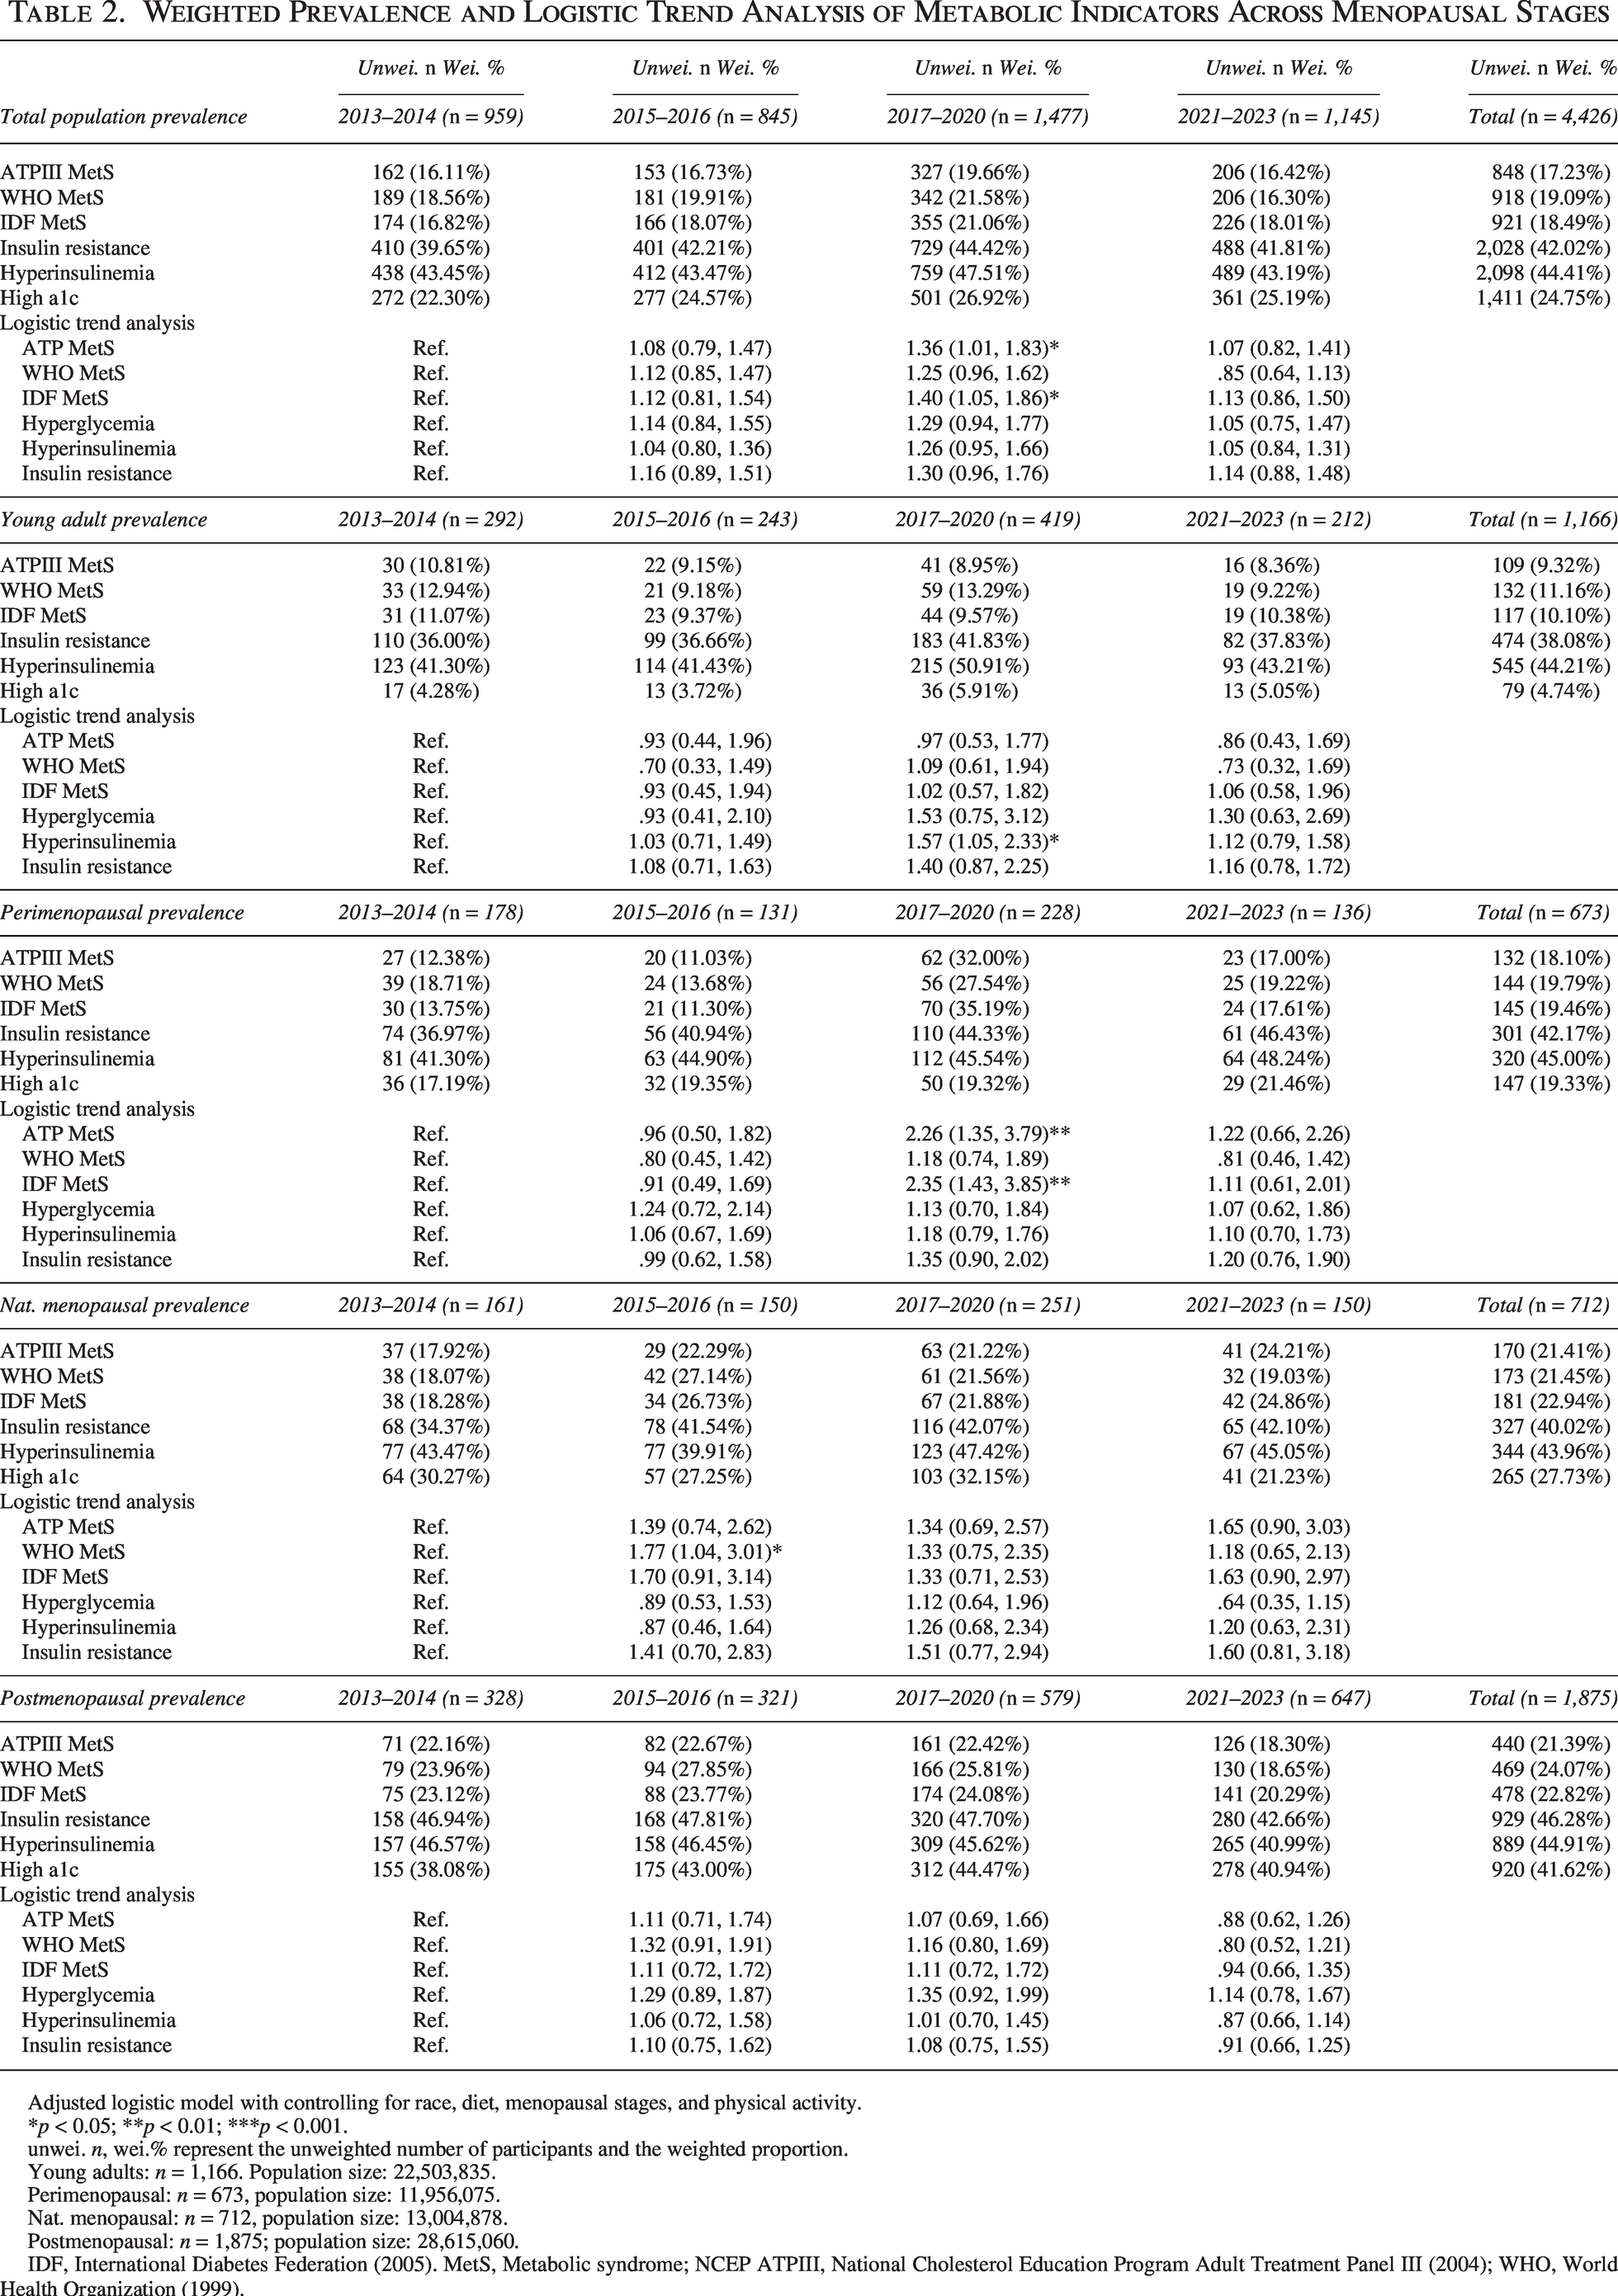
Adjusted logistic model with controlling for race, diet, menopausal stages, and physical activity.
*p < 0.05; **p < 0.01; ***p < 0.001.
unwei. n, wei.% represent the unweighted number of participants and the weighted proportion.
Young adults: n = 1,166. Population size: 22,503,835.
Perimenopausal: n = 673, population size: 11,956,075.
Nat. menopausal: n = 712, population size: 13,004,878.
Postmenopausal: n = 1,875; population size: 28,615,060.
IDF, International Diabetes Federation (2005). MetS, Metabolic syndrome; NCEP ATPIII, National Cholesterol Education Program Adult Treatment Panel III (2004); WHO, World Health Organization (1999).
Among young adults, the prevalences fluctuated across various markers without significance in any MetS definition. However, a significant upward trend was detected for hyperinsulinemia (adjusted OR = 1.57, 95% CI: 1.05–2.33) in 2017–2020, when compared with 2013–2014. Among perimenopausal women, MetS prevalence significantly rose from 12.4% in 2013–2014 to 32.0% in 2017–2020 (ATPIII) and from 13.8% to 35.2% (IDF) (ATPIII adjusted OR = 2.26, 95% CI: 1.35–3.79; IDF adjusted OR = 2.35, 95% CI: 1.43–3.85). In naturally menopausal women, prevalence estimates for all MetS definitions ranged between 18% and 27% across waves, with no clear temporal trend. The adjusted logistic models suggested a potential increase in WHO-defined MetS in 2015–2016, compared with 2013–2014 (adjusted OR = 1.77, 95% CI: 1.04–3.01). Among postmenopausal women, ATPIII-, WHO-, and IDF-defined MetS remained relatively stable, with prevalence consistently around 22%–24% until a modest decline in 2021–2023 (approximately 18%–20%). Similarly, the prevalence of insulin resistance, hyperinsulinemia, and hyperglycemia remained high (>40%). All adjusted trend tests were non-significant in this group. Lastly, overall, post-menopausal women had the highest prevalence among all menopausal stages. Compared to young adults, all other menopausal stages had increased odds of MetS and elevated HbA1c; the older one gets, the higher the odds (Table 4).
Prevalence in dietary intake (2013–2023)
Table 3 shows trends in dietary patterns and macronutrient intake among adult women across four NHANES waves. Total energy intake decreased slightly (1,798 to 1,720 kcal). Carbohydrate intake declined modestly but consistently from 48.5% in 2013 to 46.6% in 2023, and fat intake rose steadily from 34.9% in 2013 to 38.1% in 2023. Accordingly, the prevalence of HCDs (>45% energy) declined from 68.6% to 57.3%, whereas MCDs (26%–45% energy) increased from 30.1% to 41.5%. However, in 2017–2020, the prevalence of LCDs (1.04%) and fiber intake (3.38%) hit the lowest point, respectively; on the other hand, the Omega-6:3 ratio reached the highest point of 9.53.
Weighted Prevalence of Diet Types and Weighted Means (± SE) of Macronutrients Intake
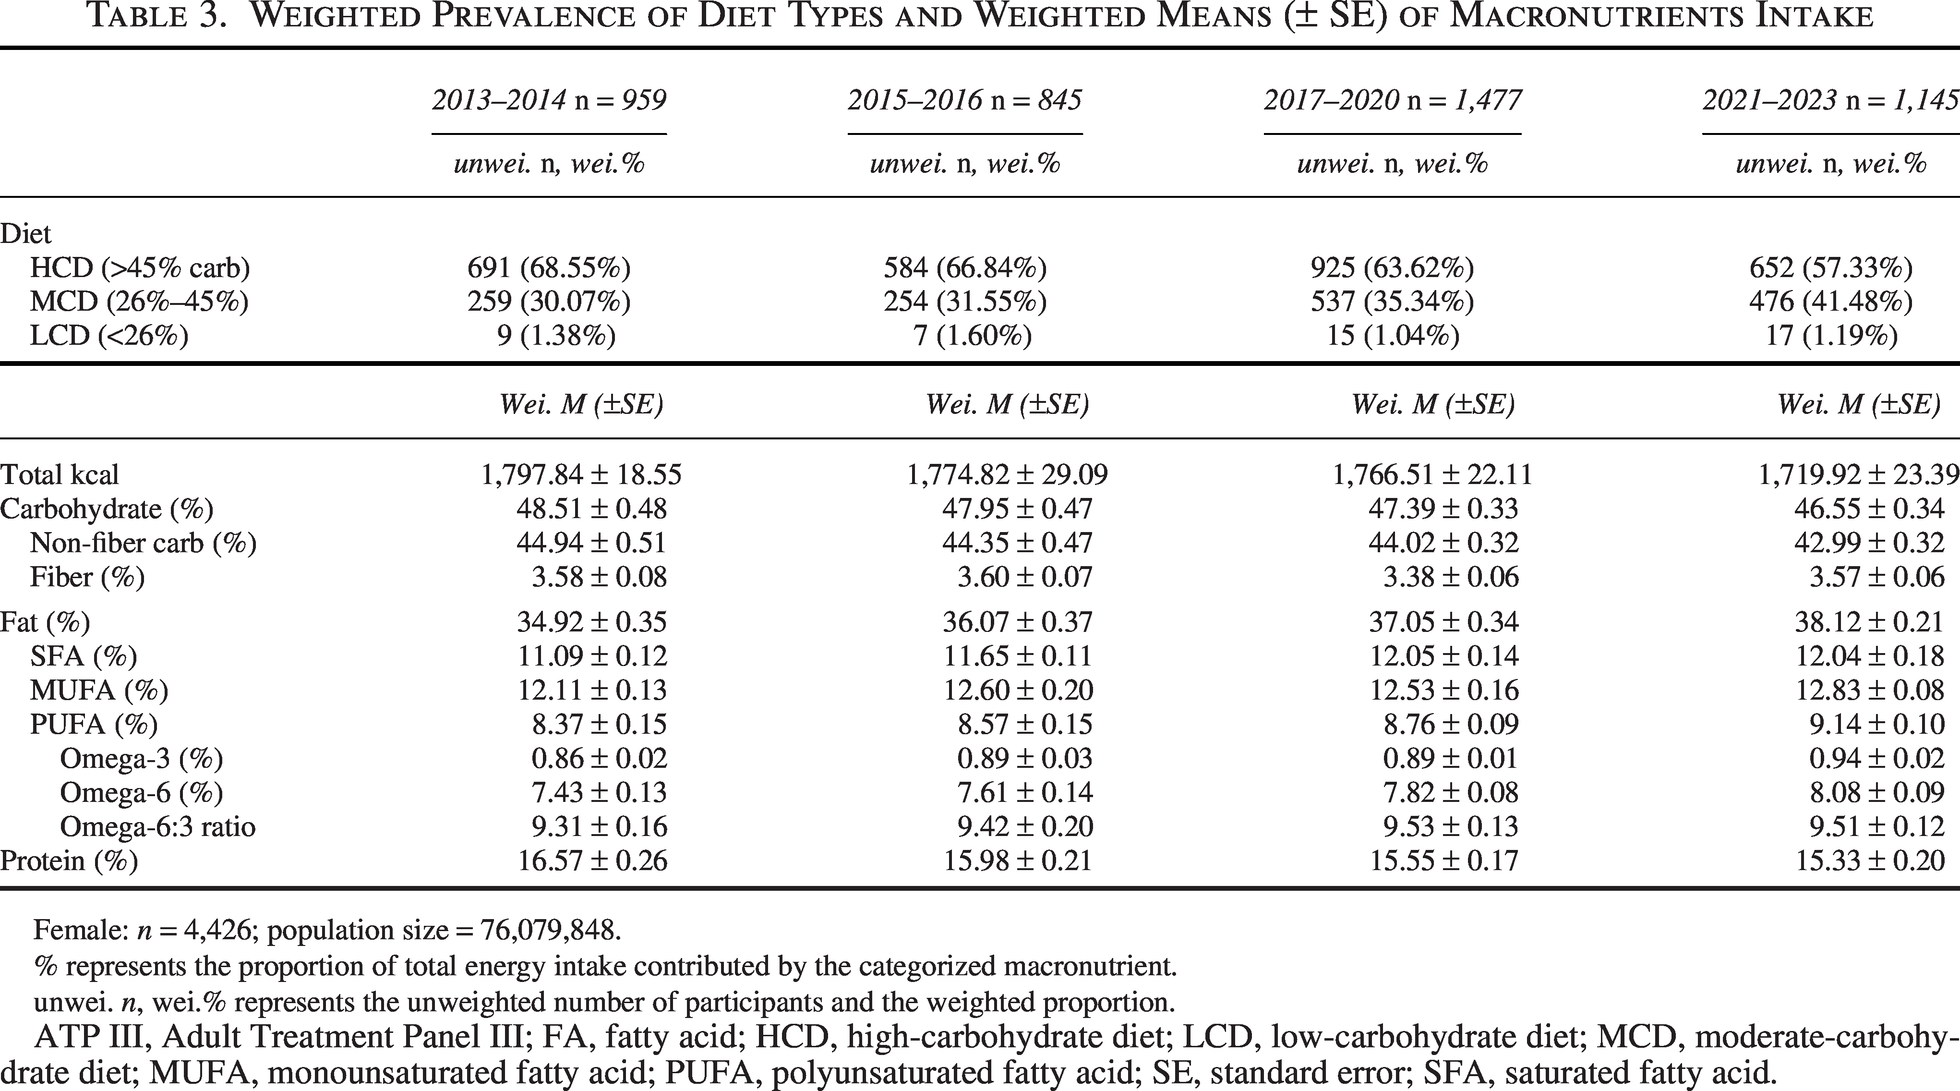
Female: n = 4,426; population size = 76,079,848.
% represents the proportion of total energy intake contributed by the categorized macronutrient.
unwei. n, wei.% represents the unweighted number of participants and the weighted proportion.
ATP III, Adult Treatment Panel III; FA, fatty acid; HCD, high-carbohydrate diet; LCD, low-carbohydrate diet; MCD, moderate-carbohydrate diet; MUFA, monounsaturated fatty acid; PUFA, polyunsaturated fatty acid; SE, standard error; SFA, saturated fatty acid.
Survey-Weighted GSEM Path Analysis of Dietary Patterns on Cardiometabolic Outcomes
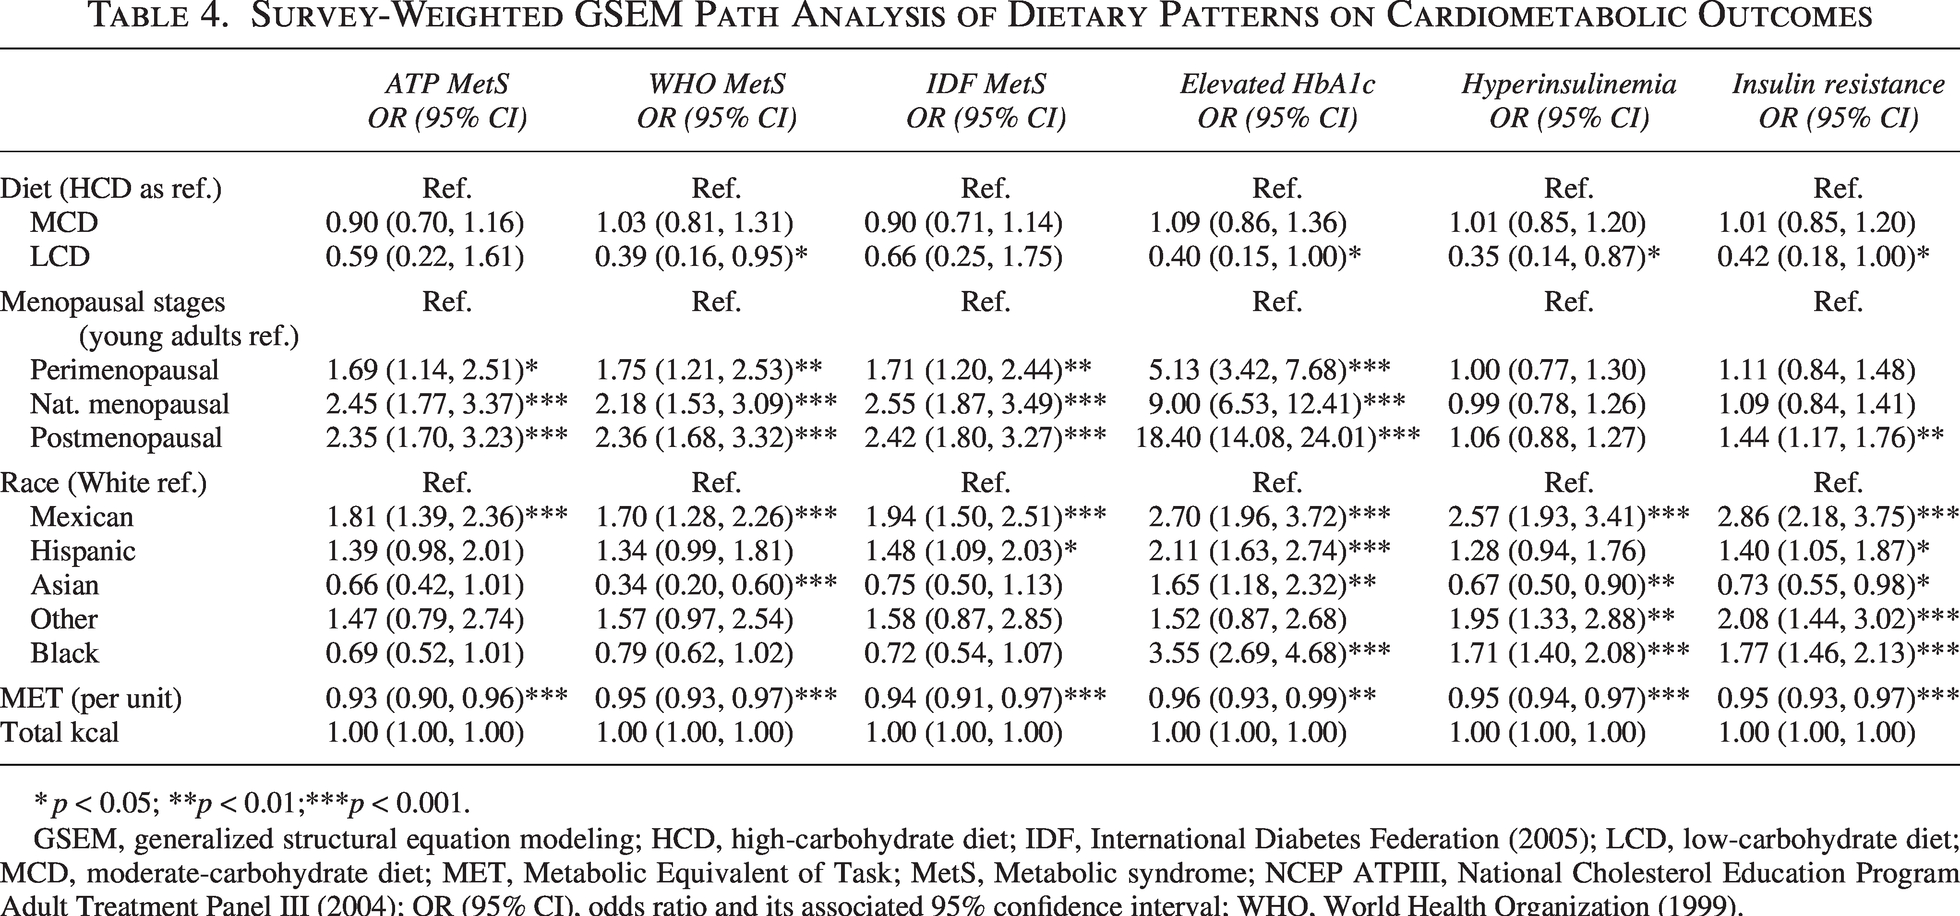
*p < 0.05; **p < 0.01;***p < 0.001.
GSEM, generalized structural equation modeling; HCD, high-carbohydrate diet; IDF, International Diabetes Federation (2005); LCD, low-carbohydrate diet; MCD, moderate-carbohydrate diet; MET, Metabolic Equivalent of Task; MetS, Metabolic syndrome; NCEP ATPIII, National Cholesterol Education Program Adult Treatment Panel III (2004); OR (95% CI), odds ratio and its associated 95% confidence interval; WHO, World Health Organization (1999).
The associations between dietary types and metabolic health
Survey-weighted GSEM analysis examined the associations between dietary patterns, menopausal stage, race/ethnicity, physical activity, and total energy intake with cardiometabolic outcomes among adult women. As shown in Table 4, using HCD as reference, MCD was associated with lower odds of low HDL (OR = 0.81, 95% CI: 0.68–0.97) but higher odds of hyperglycemia (OR = 1.22, 95% CI: 1.00–1.50) and central obesity (ATP III: OR = 1.22, 95% CI: 1.02–1.46). LCD was linked to reduced hypertriglyceridemia (OR = 0.23, 95% CI: 0.07–0.73) and lower odds of elevated HbA1c (OR = 0.40, 95% CI: 0.15–1.00) and hyperinsulinemia (OR = 0.35, 95% CI: 0.14–0.87).
The associations between detailed macronutrients and metabolic health
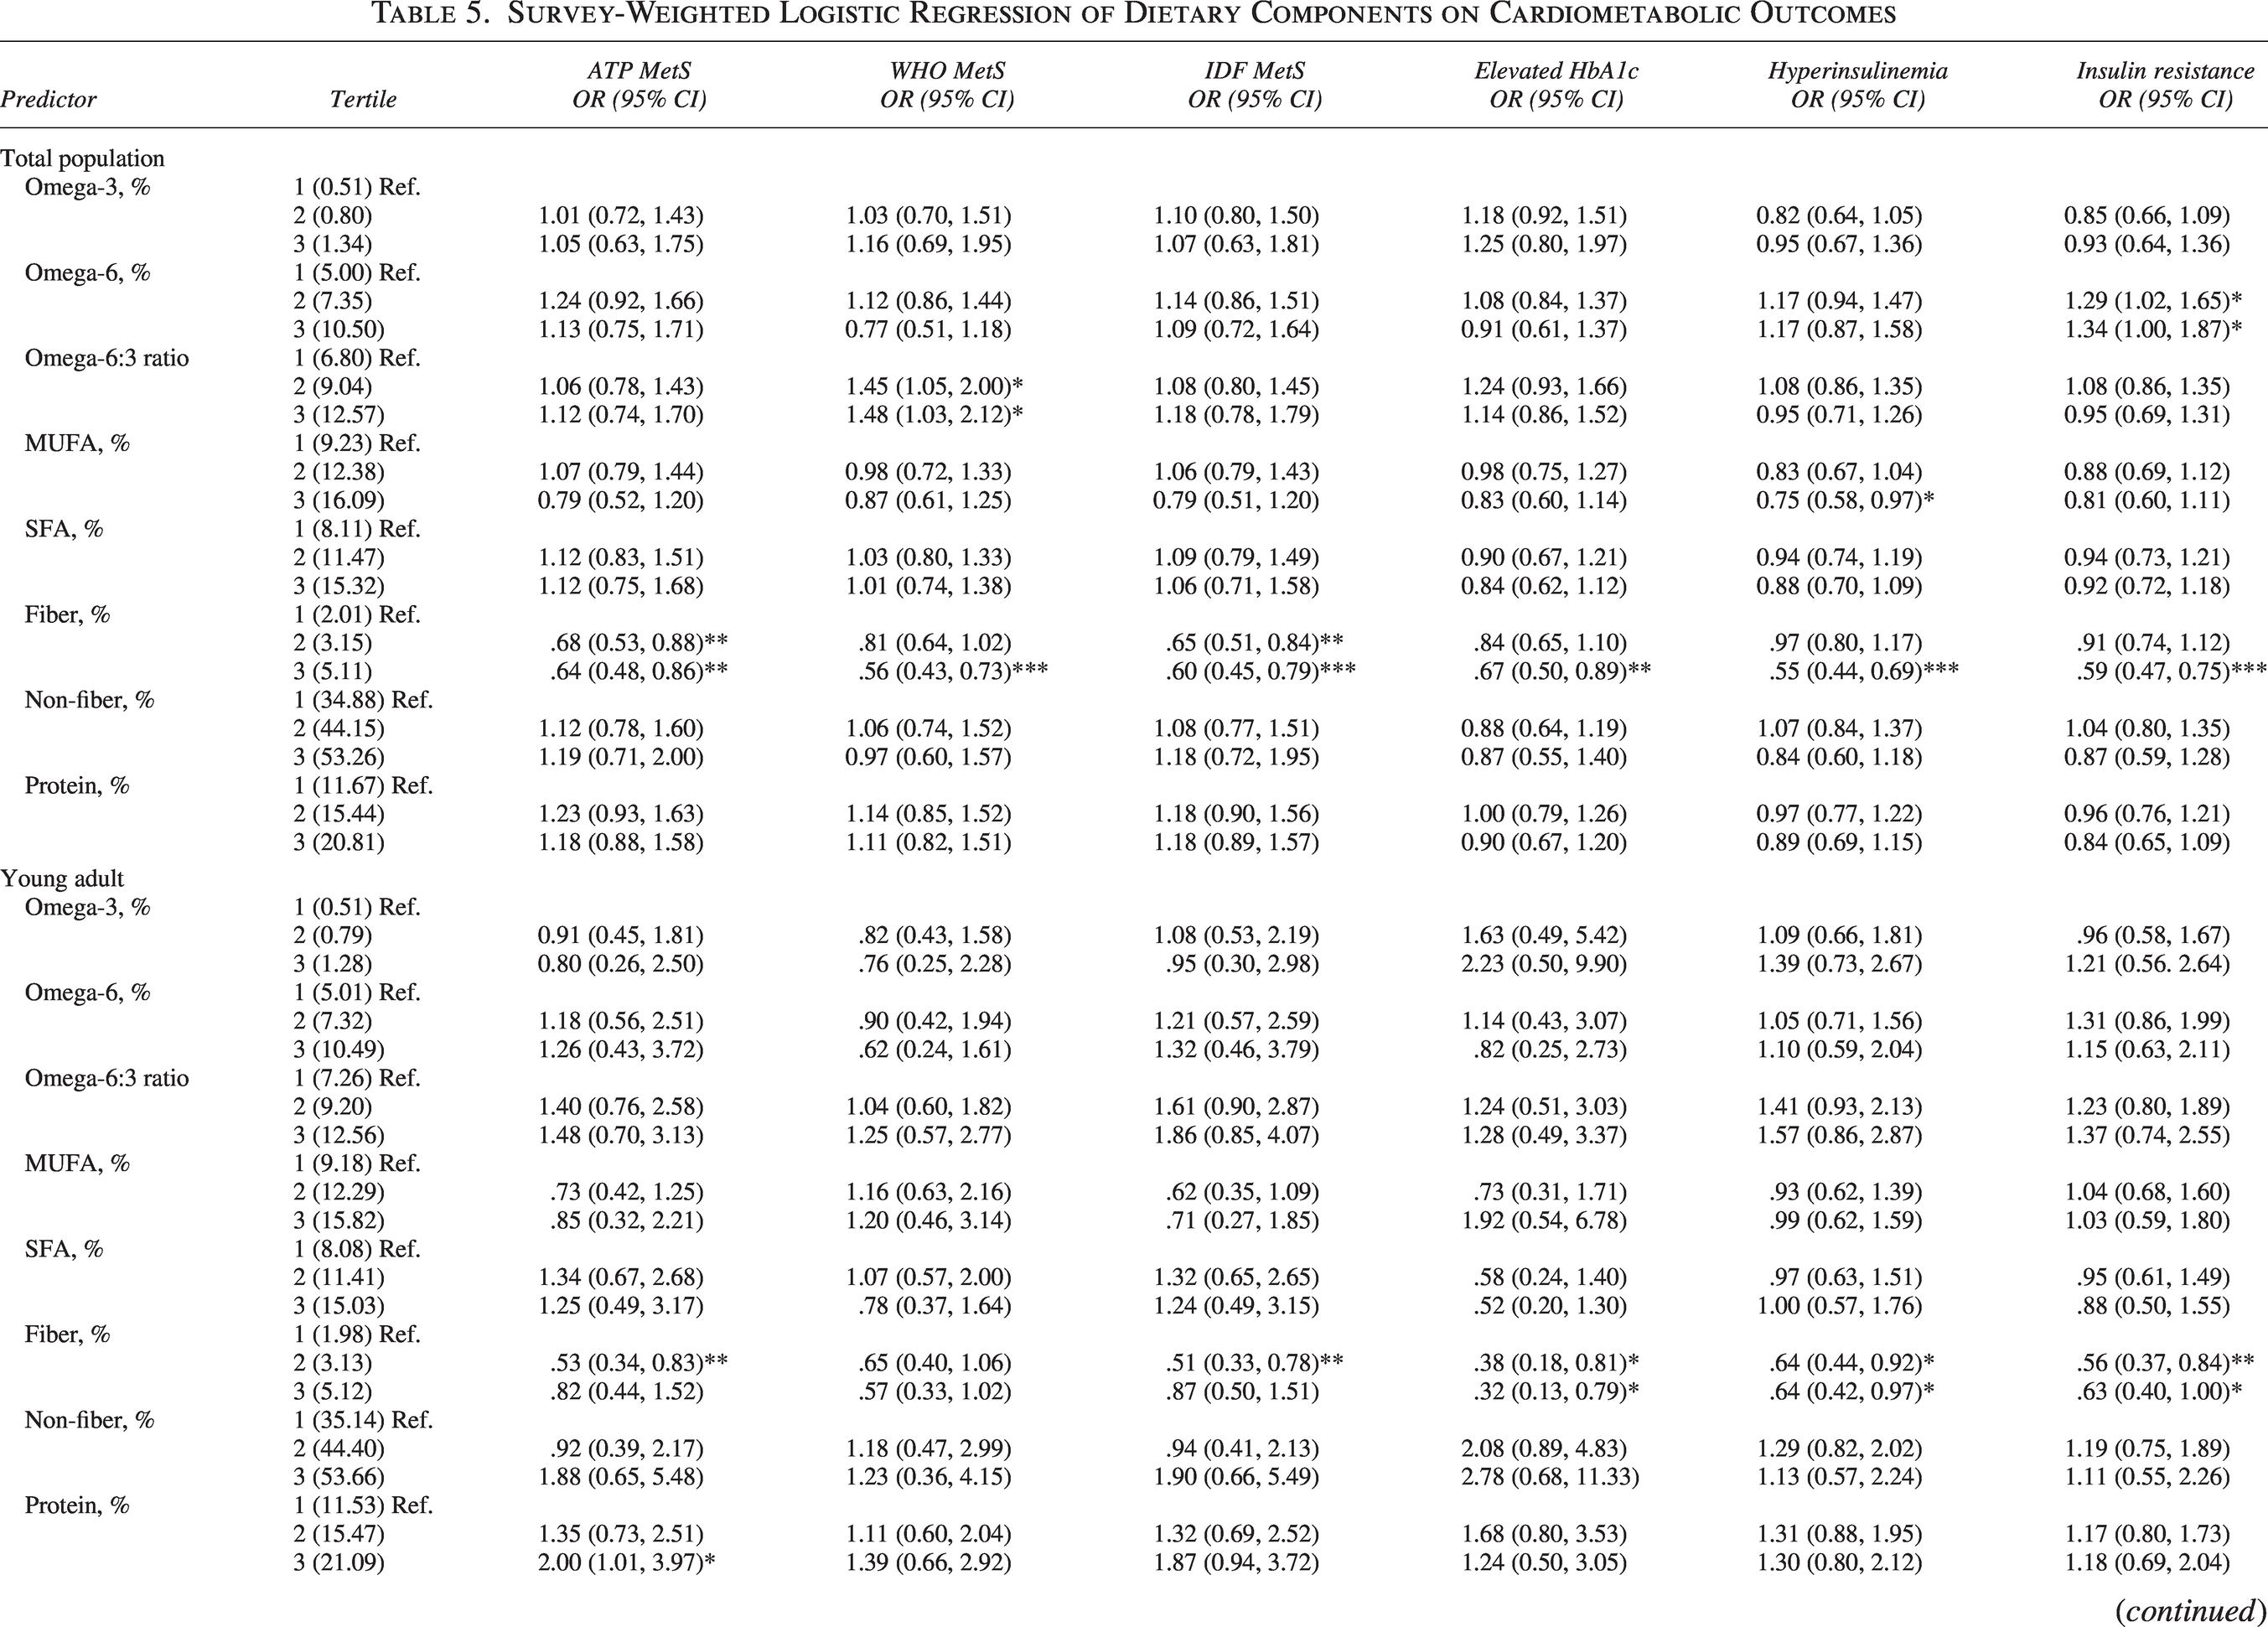
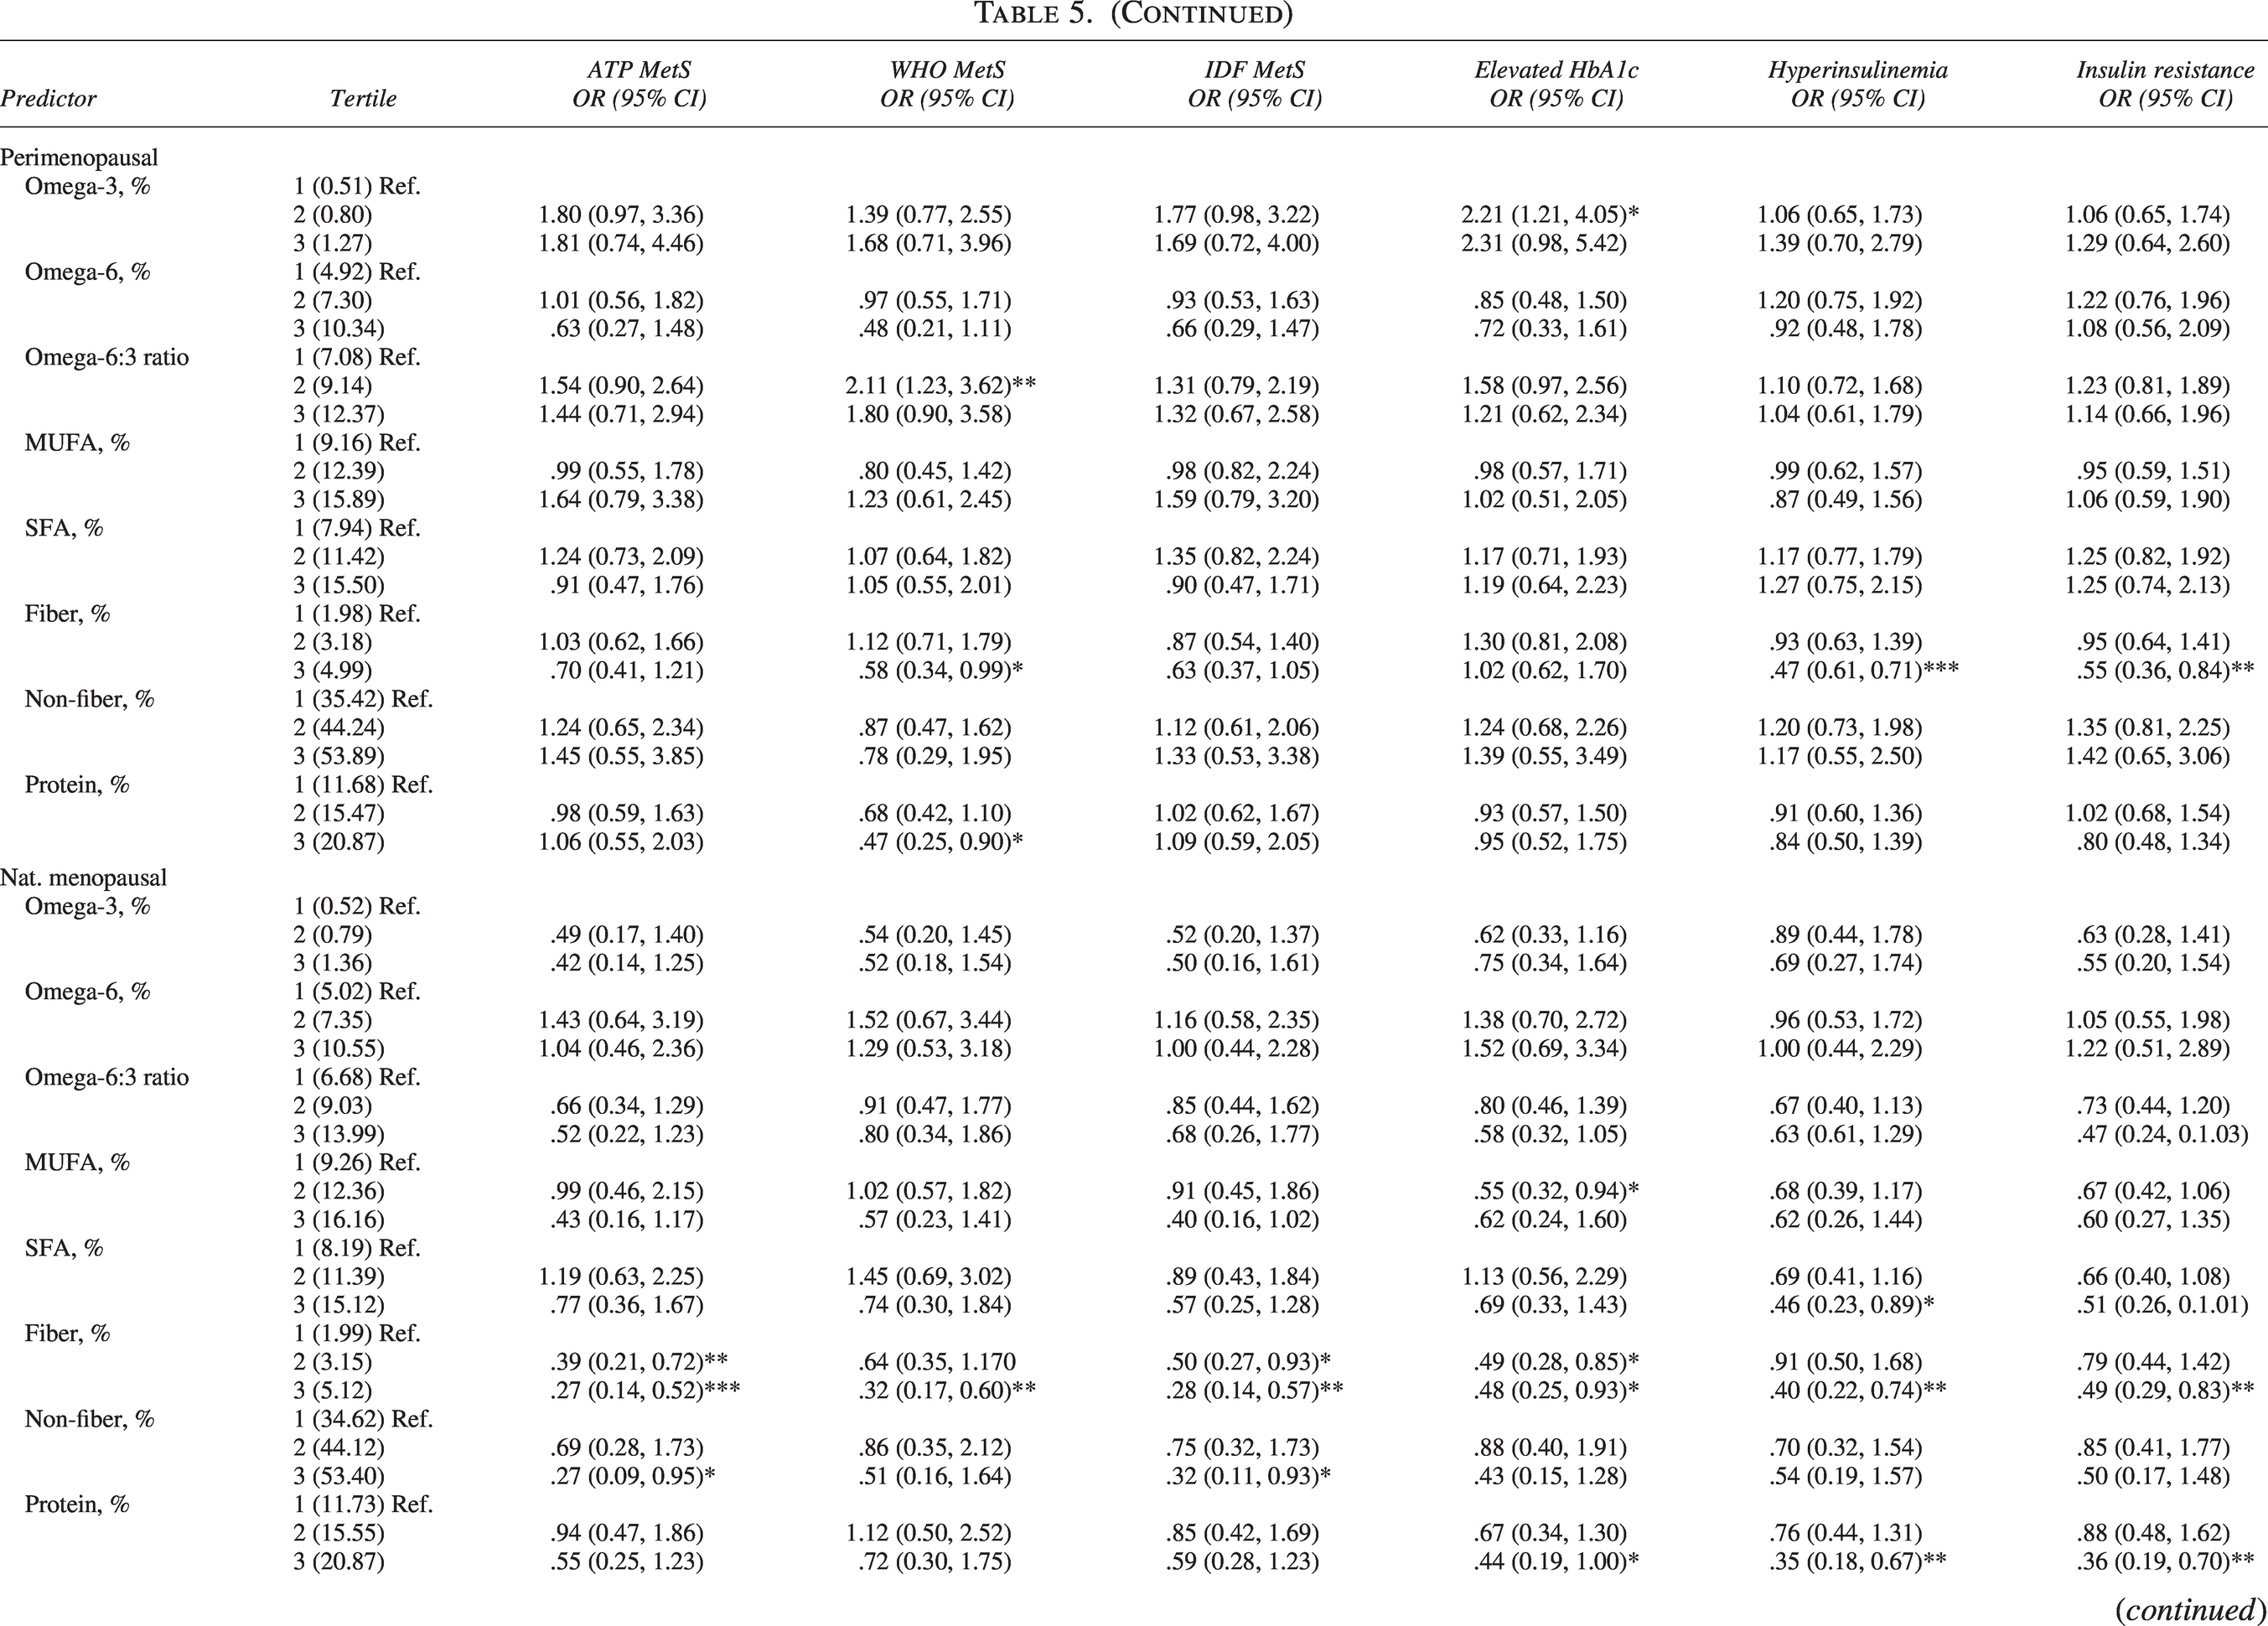
Table 5 shows the associations between detailed macronutrients and metabolic health indicators across each menopausal stage. Fiber intake was the most consistently protective. Women in the highest tertile of fiber intake had significantly lower odds of MetS (ATP OR = 0.64, 95% CI: 0.48–0.86; WHO OR = 0.56, 95% CI: 0.43–0.73; IDF OR = 0.60, 95% CI: 0.45–0.79), elevated HbA1c (OR = 0.67, 95% CI: 0.50–0.89), hyperinsulinemia (OR = 0.55, 95% CI: 0.44–0.69), and insulin resistance (OR = 0.59, 95% CI: 0.47–0.75). Protective effects were strongest among young adults and women in natural menopause. Conversely, non-fiber carbohydrate intake showed limited and inconsistent associations.
Survey-Weighted Logistic Regression of Dietary Components on Cardiometabolic Outcomes
Adjusted logistic model with controlling for race, diet, menopausal stages, and physical activity.
*p < 0.05; **p < 0.01; ***p < 0.001.
% represents the proportion of total energy intake contributed by the categorized macronutrient.
Young adults: n = 1,166. Population size: 22,503,835.
Perimenopausal: n = 673, population size: 11,956,075.
Nat. menopausal: n = 712, population size: 13,004,878.
Postmenopausal: n = 1,875; population size: 28,615,060.
IDF, International Diabetes Federation (2005); MetS, Metabolic syndrome; MUFA, monounsaturated fatty acid; NCEP ATPIII, National Cholesterol Education Program Adult Treatment Panel III (2004); OR (95% CI), odds ratio and its associated 95% confidence interval; PUFA, polyunsaturated fatty acid; SFA, saturated fatty acid; WHO, World Health Organization (1999).
Continued
Continued
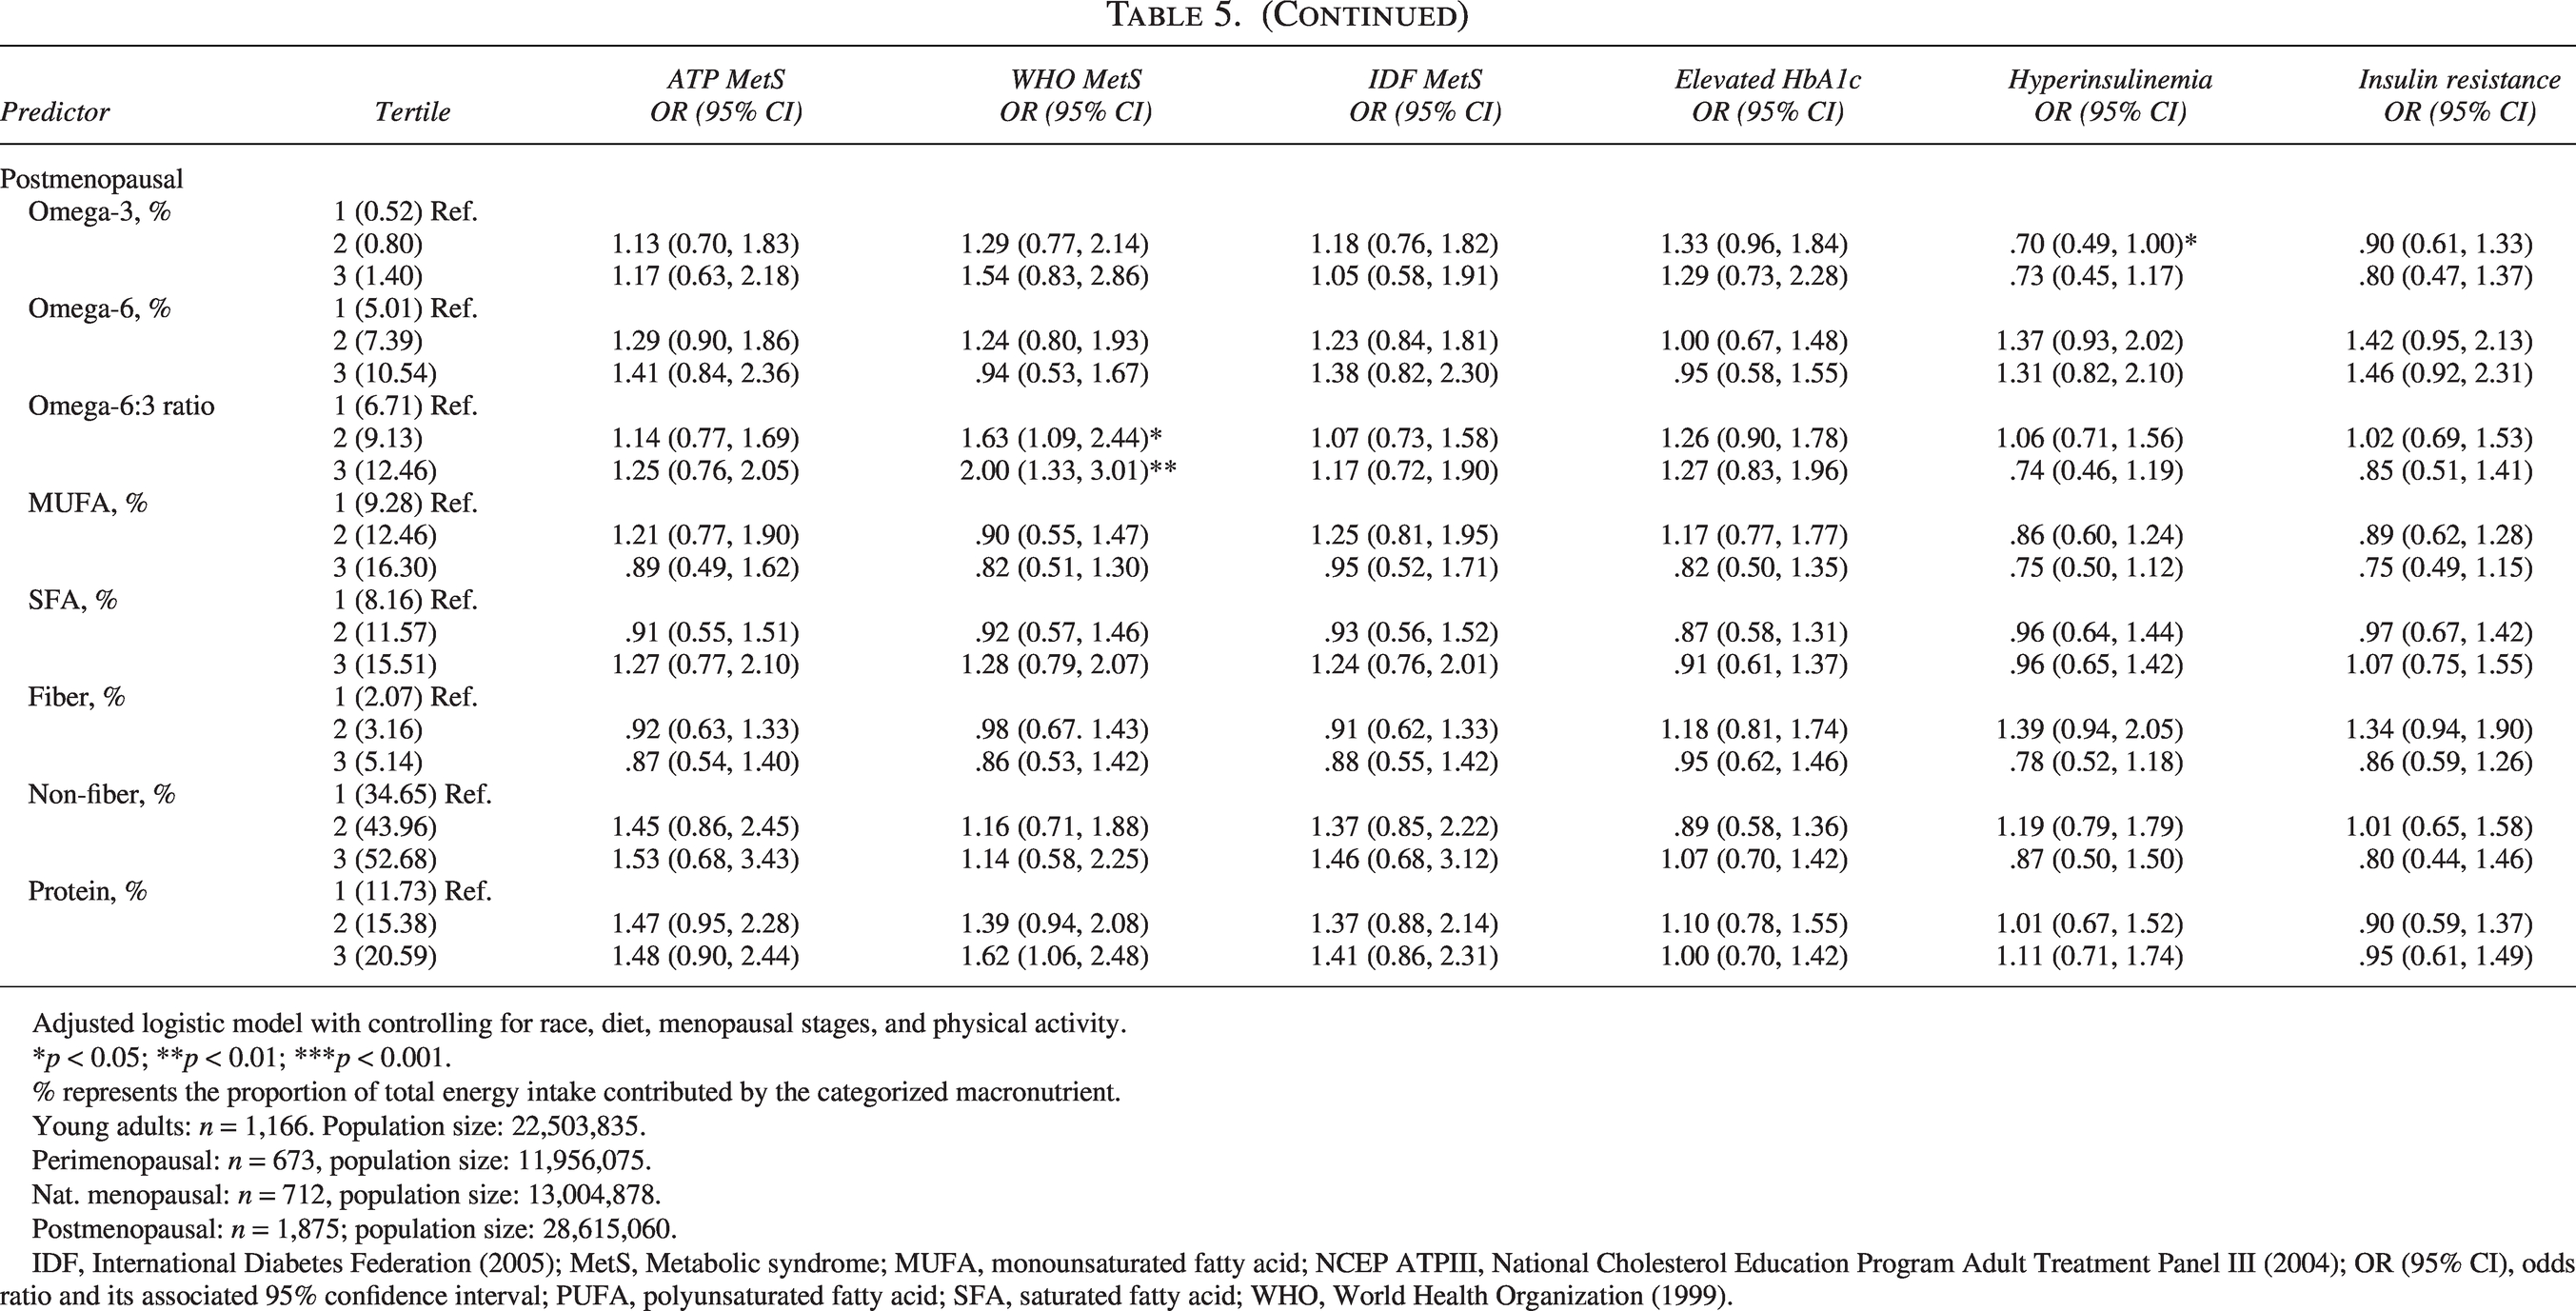
Fatty acids showed mixed patterns. Higher MUFA intake was associated with reduced hyperinsulinemia in the total sample (OR = 0.75, 95% CI: 0.58–0.97), whereas SFA intake was largely unrelated to cardiometabolic outcomes, except for a protective association with hyperinsulinemia and insulin resistance among natural menopausal women. Higher omega-6 intake and elevated omega-6:3 ratio were generally associated with increased odds of insulin resistance and WHO-defined MetS, particularly in perimenopausal and postmenopausal women. Omega-3 intake was not consistently associated with any outcome, except for elevated HbA1c in perimenopausal women (2nd tertile OR = 2.21, 95% CI: 1.21–4.05).
Protein intake displayed age-specific associations. Among young adults, high protein intake was linked to increased odds of ATP-defined MetS (OR = 2.00, 95% CI: 1.01–3.97), whereas in natural menopausal women, high protein intake was protective against hyperinsulinemia (OR = 0.35, 95% CI: 0.18–0.67) and insulin resistance (OR = 0.36, 95% CI: 0.19–0.70). Postmenopausal women with high protein intake had elevated odds of WHO-defined MetS (OR = 1.62, 95% CI: 1.06–2.48).
Overall, higher fiber intake emerged as the most robust protective dietary factor, MUFA intake offered moderate benefits on insulin-related outcomes, and associations of omega-6, protein, and omega-3 varied by age and menopausal status.
The associations between covariates and metabolic health
Menopausal stage showed strong associations with cardiometabolic risk: perimenopausal, naturally menopausal, and postmenopausal women had progressively higher odds of hypertension, hyperglycemia, central obesity, and MetS compared with young adults. For example, postmenopausal women had markedly higher odds of hyperglycemia (ATP III: OR = 9.17, 95% CI: 6.22–13.51) and central obesity (OR = 3.35, 95% CI: 2.60–4.31).
Race/ethnicity was also a significant predictor. Compared with White women, Mexican and Black women had higher odds of MetS and most individual components, whereas Asian women had lower odds of central obesity (OR = 0.25, 95% CI: 0.19–0.33) and related outcomes.
Higher physical activity (MET units) was consistently associated with lower odds of adverse cardiometabolic outcomes, whereas total energy intake was not independently associated.
The comparisons of demographics between included and excluded participants
Weighted percentages and design-based Pearson chi-square tests were conducted to compare demographic characteristics between excluded participants (n = 15,286) and included participants (n = 4,426) in the analytic sample (Supplementary Table S1). Compared with excluded participants, a higher proportion of included participants identified as White (66.16% versus. 59.17%, p < 0.001). Conversely, smaller proportions of included participants identified as Black (11.02% versus. 12.80%, p < 0.05), Asian (4.77% versus. 6.09%, p < 0.01), and Mexican American (7.34% versus. 9.89%, p < 0.001). The included sample had a lower proportion of young adults (27.28% versus. 44.31%, p < 0.001) but a higher proportion of pre-menopausal (15.82% versus. 14.30%, p < 0.05), naturally menopausal (17.41% versus. 13.17%, p < 0.001), and post-menopausal women (39.49% versus. 28.22%, p < 0.001). Overall, included participants were more likely to be White and older than excluded participants, indicating demographic differences between the analytic and excluded samples.
Discussion
This study, by using nationally representative NHANES 2013–2023 data, provided updated temporal trends in MetS, related metabolic abnormalities, and dietary patterns among U.S. adult women. The findings indicated that the prevalence of all three defined MetS was around 20%, and the prevalence of IR and hyperinsulinemia was over 40% for the total population across the past decade. In general, the prevalence increased till it peaked in 2017–2020. In addition, the later stage of menopause, the higher the likelihood of developing MetS and its related metabolic abnormalities. Concurrently, dietary trends revealed a gradual shift from HCDs to MCDs, and LCD remains low. Importantly, higher fiber and monounsaturated fat intakes were associated with favorable metabolic profiles, whereas omega-6 fatty acids and omega-6: omega-3 ratios were unfavorable to metabolic health. This study provides the most recent nationally representative evidence on MetS, insulin resistance, and dietary patterns among U.S. adult women. By linking temporal trends in MetS and metabolic abnormalities with menopausal stage and dietary intake, the study highlights modifiable risk factors that could inform public health strategies.
Trends in metabolic health and dietary intakes among U.S. women
The temporal fluctuations in MetS prevalence observed in this study extend prior findings from earlier NHANES cycles (1999–2016), which showed a steady increase followed by a plateau in MetS prevalence around 35%.2,3 The prevalence of MetS among women in this study was lower than that reported in previous studies. One possible explanation might be the potential selection bias, which significantly higher proportion of Whites and lower proportions of women of Mexican and Black descent being included, compared with those who were excluded. Previous studies,2,3 as well as this study, revealed a lower prevalence of MetS in Whites than those with Mexican and African descent. To extend the current studies, this study further explored the trend in the most recent years. Instead of consistently increasing, prevalence decreased in 2021–2023 after peaking during 2017–2020. The persistently high prevalence of IR and hyperinsulinemia underscores a substantial metabolic burden. This finding supported previous evidence that subclinical insulin dysregulation was widespread.5,6
As for the prevalence of dietary intake, from 2013 to 2023, there was an increasing trend of adopting MCD, accompanied by a decrease in HCD. This aligns with national dietary data showing declining carbohydrate and rising fat intakes. 21 However, LCD remained low and omega-6: omega-3 ratios remained high, with over 9:1, where scholars have suggested 2:1 as beneficial for metabolic health. 28 The ratio suggested a continued imbalance in polyunsaturated fat sources. Notably, as the metabolic problems peaked in 2017–2020, the prevalence of LCD plummeted to its lowest point in 2017–2020, as well as the percentage of calories from fiber intake; on the other hand, the Omega-6:3 ratio reached its highest point. The updated prevalence data allow policymakers and clinicians to track ongoing metabolic risk in women and identify periods (e.g., postmenopause) when interventions are most needed.
Dietary intakes and metabolic implications
Given the seemingly related trends between metabolic abnormalities and certain dietary intakes. This study conducted path analyses to examine the associations between metabolic health and diets, controlling for demographics, physical activity levels, and total calorie intake. Similar to the results of previous studies,16,17 LCD was associated with beneficial cardiometabolic outcomes. This study found lower occurrences of MetS (WHO-defined), elevated HbA1c, hyperinsulinemia, and IR among participants with LCD, compared with HCD. A meta-analysis of 25 randomized controlled trials (1980–2016) also indicated that LCDs (<26% of energy) led to greater reductions in HbA1c, whereas no significant differences were observed among MCDs (26%–45%). According to the carbohydrate-insulin model, carbohydrate, as the primary source of blood glucose, stimulates insulin secretion, which promotes MetS.29,30
For specific macronutrients, higher fiber intake (with an average of 5% of total kcal), compared with lower fiber intake (2% on average), had significantly lower frequencies in MetS, insulin resistance, and hyperinsulinemia, which is consistent with previous studies.31,32 Soluble fibers, such as β-glucan, pectin, and guar gum, form viscous gels in the gastrointestinal tract that slow carbohydrate absorption, leading to reduced glucose and insulin responses, 31 which improves insulin sensitivity. Fermentable fibers, in the colon, are metabolized by gut microbiota to produce short-chain fatty acids, which could enhance gut barrier function and improve lipid and glucose metabolism. 33
As for fats, MUFAs were associated with lower cases of hyperinsulinemia. Previous studies also indicated that MUFA-rich diets improve insulin signaling and glucose uptake in peripheral tissues, 34 and substituting carbohydrates or SFAs with MUFAs lowered fasting insulin.35,36 On the other hand, this study found that higher omega-6 intake and an elevated omega-6:omega-3 ratio were associated with increased odds of IR and WHO-defined MetS. The role of omega-6 FA on metabolic health remains uncertain. Some scholars stated that excessive omega-6 fatty acid intake can lead to increased synthesis of pro-inflammatory eicosanoids (e.g., prostaglandin E2, leukotriene B4), which disrupt insulin signaling and enhance hepatic gluconeogenesis, contributing to insulin resistance.28,37 However, other scholars claimed that omega-6 fatty acids do not increase MetS. 38 Regarding Omega6:3 ratios is less controversial; prior evidence also suggested that excessive omega-6 relative to omega-3 intake promotes pro-inflammatory pathways that impair insulin signaling and lipid metabolism.28,39 Overall, associations between fiber, monounsaturated fats, and favorable metabolic profiles reinforce dietary recommendations, whereas the adverse role of omega-6 and high omega-6:omega-3 ratios suggests potential targets for nutritional interventions.
Differences in menopausal stages on metabolic risk and dietary associations
This study also examined differences in metabolic health across menopausal stages and their associations with dietary factors. Overall, women in later menopausal stages exhibited higher prevalences of multiple metabolic abnormalities. Notably, the largest increase was observed in elevated HbA1c levels, which were approximately 5-, 9-, and 18-fold higher in the perimenopausal, natural menopausal, and postmenopausal stages, respectively, compared with young adults. This finding aligns with previous research showing that the prevalence of MetS significantly increases with advancing age. 3 Female metabolism is particularly susceptible to aging due to hormonal changes. The decline in estrogen beginning in the perimenopausal period is associated with increased central adiposity, atherogenic lipid profiles (e.g., elevated low-density lipoprotein and triglycerides, decreased HDL), and higher glucose and insulin levels, all of which correspond to components of MetS.40,41
Regarding temporal trends, some research reported that MetS prevalence among women increased significantly from 1999 to 2006 and from 2011 to 2016,1,3 whereas others observed a decline between 2007 and 2012. 2 The present study, by analyzing trends across menopausal stages, found a significant increase in MetS prevalence among perimenopausal women during 2017–2020 compared with 2013–2014. Conversely, among young adult women, the prevalence of MetS decreased from 2013–2014 to 2021–2023. Meanwhile, MetS prevalence among women in natural and postmenopausal stages remained relatively stable over time. This study further suggested that besides decreasing the omega-6:omega-3 FA ratio and increasing fiber intake, increasing protein intake also helps manage metabolic health, especially among women in perimenopausal and natural menopausal stages.
Key strengths of this study include the use of nationally representative, multi-wave NHANES data with standardized measures of metabolic biomarkers and detailed dietary assessment. The study also employed multiple MetS diagnostic criteria (ATP III, WHO, IDF), providing robust and comparative estimates. Additionally, stratified analyses by menopausal stage and macronutrient composition offer novel insights into age-specific dietary effects on metabolic health. Overall, this study bridges a critical gap between recent epidemiological trends and actionable dietary and metabolic insights, offering evidence to guide both clinical recommendations and population-level prevention strategies. However, several limitations should be acknowledged. The cross-sectional nature of NHANES can only provide associations and preclude causal inference relations. Self-reported dietary recalls are subject to recall bias and measurement errors. Additionally, unmeasured confounders such as medication use, dietary supplements, and hormonal therapy may influence metabolic outcomes. Another limitation of this study is the focus on carbohydrate intake and selected macronutrients, rather than considering overall dietary quality or dietary patterns, which may more accurately reflect habitual eating behaviors and their impact on metabolic health. The findings may be underestimated among individuals receiving pharmacologic treatment, and prevalence estimates should be interpreted as reflecting measured biomarker profiles rather than treatment-adjusted disease status. As for dietary intakes, this study only focused on carbohydrate intake and selected macronutrients, without the consideration of overall dietary quality or dietary patterns, which may more accurately and comprehensively reflect habitual eating behaviors and their impact on metabolic health. Furthermore, although we applied standard MetS definitions (e.g., NCEP ATP III, WHO, IDF), these criteria do not include hyperuricemia, which recent evidence suggests may improve risk stratification and prognostic utility when incorporated. 42 Lastly, whereas NHANES weighting improves representativeness, residual bias may persist due to differential nonresponse across waves. Notably, demographic differences (e.g., race/ethnicity and age) between included and excluded participants could introduce selection bias, potentially leading to underestimation of MetS prevalence, given the higher proportion of White women and lower proportions of Mexican and Black women included in the analytic sample.
Conclusions
This study, using nationally representative NHANES data from 2013–2023, revealed persistently high rates of metabolic abnormalities among U.S. adult women, peaking between 2017 and 2020. Later menopausal stages were associated with greater metabolic risk, especially in elevated HbA1c, insulin resistance, and hyperinsulinemia. Dietary trends showed a gradual shift toward MCDs, whereas LCDs remained uncommon despite their favorable associations with metabolic health. Higher intakes of dietary fiber and monounsaturated fats were associated with improved metabolic profiles, whereas elevated omega-6 intake and higher omega-6:omega-3 ratios were associated with adverse outcomes. Increased protein intake may further support metabolic health, particularly among women during perimenopausal and natural menopausal stages.
Author Disclosures Statement
The authors declare that they have no known competing financial interests or personal relationships that could have appeared to influence the work reported in this paper.
Data Availability Statement
Data described in the article, code book, and analytic code are publicly and freely available without restriction at https://figshare.com/s/816ebd46d0587102e321.
Authors’ Contributions
S.F.: Conceptualization, methodology, formal analysis, investigation, data curation, writing-original draft, writing—review and editing. B.C.: Conceptualization, supervision, validation, writing—review and editing.
Footnotes
Funding Information
This research did not receive any specific grant from funding agencies in the public, commercial, or not-for-profit sectors.
Supplemental Material
References
Supplementary Material
Please find the following supplemental material available below.
For Open Access articles published under a Creative Commons License, all supplemental material carries the same license as the article it is associated with.
For non-Open Access articles published, all supplemental material carries a non-exclusive license, and permission requests for re-use of supplemental material or any part of supplemental material shall be sent directly to the copyright owner as specified in the copyright notice associated with the article.