
Abstract
Gang and non-gang youth are often considered distinct for the purposes of prevention and intervention; yet, research shows there are areas of overlap in their risk profiles. This study examines areas of overlap and differences using a statewide representative sample of high school youth from the Youth Risk Behavior Survey. Gang membership is treated as a predictor variable rather than as an outcome. Results from a latent class analysis show that gang members do not form their own group in the school setting. These findings are discussed in relation to prevention and intervention strategies in the school realm and beyond.
Gang members are typically seen as a distinct segment of youth who engage in antisocial behavior, arguably because research consistently shows that youth who are gang members are more delinquent than non-gang members (i.e., Barnes, Beaver, & Miller, 2010; LeBlanc & Lanctôt, 1998; Thornberry, Krohn, Lizotte, Smith, & Tobin, 2003). Theory, prevention and intervention strategies, and public policy frequently address gangs and gang members as specific populations. For example, theoretically, distinct explanations of gang formation and gang membership have been developed and continue to be refined (Howell & Egley, 2005; Jankowski, 1991; Vigil, 1988), while targeted prevention and intervention programming has focused on those at risk and gang involved (see Howell, 2010, for a review). Finally, federal and state funding entities have specifically required their grantees to target gangs for prevention and intervention (i.e., Gebo & Bond, 2012). Collectively, given the focus on gangs from these arenas, it is important to learn more about gang members to help guide efforts to understand, prevent, and intervene as necessary.
Comparing gang and non-gang youth is an important line of inquiry in the continued refinement of understanding gangs and gang members and what works (and what does not) in prevention and intervention. Gang members tend to have more risk factors across more domains than non-gang youth, but seem to share similar risk factors with delinquent offenders (i.e., Esbensen, Peterson, Taylor, & Freng, 2010). Currently, there is no clear identification of specific risk factors across or within developmental stages that can accurately predict gang membership (Howell & Egley, 2005). Such findings may pose problems in the prevention and intervention arenas which ideally should be able to translate theoretical findings into practical applications.
Gang prevention programs generally have not achieved widespread success in terms of intended results (Fisher, Montgomery, & Gardner, 2008; Klein & Maxson, 2006). Program failure may be due to lack of enough theoretical knowledge to guide practices; an absence of theoretical grounding; a consequence of gang member misidentification; and/or because of fidelity and efficacy issues. Conversely, some programs not directly focused on gangs have been shown to have gang suppression effects, particularly in the school realm (i.e., Tremblay, Masse, Pagani, & Vitaro, 1996).
Jointly, these findings seem to indicate that there may be underlying similarities between gang and non-gang, particularly delinquent, youth. This, in turn, suggests a closer examination of the differences and similarities between gang and non-gang youth for the purposes of theoretical elaboration and program development. Given research that consistently shows gang youth are a part of the school population (Arciaga, Sakamoto, & Jones, 2010; Monti, 1993; Naber, May, Decker, Minor, & Wells, 2006), schools appear to be an important study location. The present study connects research strands from the risk factor field with school-based programming to better understand how to address the risks and needs of youth in school. Two research questions are asked: First, do youth who claim gang membership form a distinct risk group in the high school realm? Second, what implications do these findings have for prevention, intervention, and policy? Risk factor literature on gangs is reviewed first, followed by what is known about gangs and programming in schools. Descriptions of gangs in the study location and the data and methods are then presented, followed by results and implications.
Risk Factor Approach
Theoretical work has begun to tease out potential differences between gang and non-gang youth through an examination of risk factors. Risk factor approaches attempt to distinguish possible gang members from other youth particularly for prevention and intervention purposes (Hawkins et al., 1998; Hill, Howell, Hawkins, & Battin-Pearson, 1999; Howell & Egley, 2005). Research has found that there is a great deal of overlap between risk factors for serious delinquency and gang membership, however. In recent years, Howell (2012) and Klein and Maxson (2006) have comprehensively reviewed the risk factor literature related to gangs, while Decker, Melde, and Pyrooz (2013) have summarized these findings.
Howell’s (2012) overview examined risk factors identified in major longitudinal studies for delinquency, violence, and gang involvement. Looking at risk factors measured between ages 12 and 17, he isolated approximately 50 risk factors for delinquency across the individual, family, school, community, and peer domains, nearly two thirds of which also have been identified as risk factors for gang affiliation. Overall, his analysis reinforced the finding that the accumulation of risk factors, rather than the presence of specific risk factors, across ecological domains of youths’ lives (individual, family, peer, school, and community) is one key to understanding gang and non-gang differences (see also Hill et al., 1999).
Klein and Maxson (2006) considered risk factor studies conducted since 1990 that reported results for youth themselves and their immediate family members. Overall, deviant peer groups showed substantial support across studies. Only three risk factors in the individual domain were consistently supported as precursors of gang membership across studies: negative life events, such as illness, nondelinquent behavioral problems, such as impulsivity, and positive attitude toward delinquent behavior. These factors, however, also may apply to general delinquency. Further analysis of risk factors and concomitant links to delinquency continue to be examined, but two projects in particular have sought to utilize the risk factor approach in theoretical elaborations utilizing a developmental approach to explain gang membership and delinquency.
Research from the Seattle Social Development Project has used risk factor findings in combination with key concepts from social control and social learning theories to construct the social development model which attempts to explain delinquency and gang membership across developmental periods (Hawkins et al., 1992; Hill et al., 1999). Youth who are not attached, or committed, or who do not believe in conventional norms and activities are more likely to become delinquent. Behavior is then reinforced through interaction with others. Importantly, the social development model is an example of an integrated theory that seeks to incorporate several empirically identified risk factors into a comprehensive narrative detailing how youth might engage in antisocial behavior, including gang membership.
Similarly, Howell and Egley (2005) drew on findings from risk factor research as well as research on gang etiology to trace the process by which youth might become gang members. Risk factors from important developmental stages are categorized in the key domains of youths’ lives. Building on earlier work with the interactional theory of delinquency and gang involvement, Howell and Egley posited that the process that leads to gang membership begins with exposure to risk very early in the life course. Their developmental model of gang involvement, however, suggests that the processes leading to gang membership are fairly similar to those that would be expected to produce delinquency. Decker and colleagues (2013) distilled the risk factor literature from panel studies of gang-involved youth into three main points: (1) no risk factors exclusively predict gang membership; (2) gang-involved youth typically had many risk factors prior to involvement; and (3) accumulation of risk across domains is most predictive of gang involvement.
Schools play a progressively important role in the development of delinquency and gang membership in the models that incorporate risk factors across the life course. School factors that have been shown to significantly impact delinquency and gang membership include low academic achievement and aspirations, lack of attachment to school, bullying, labeling by teachers (see reviews by Howell & Egley, 2005; Klein & Maxson, 2006). What is known about gang prevention and intervention in schools is discussed below.
Schools, Gangs, and Programming
Schools are increasingly seen as important settings for the delivery of prevention and intervention programming for those at risk of gang membership and delinquency (Conchas & Vigil, 2010; Cook, Gottfredson, & Na, 2009). While this is especially true at the middle school level (Vigil, 1999), high schools represent a further point of intervention contact as most youth, even those who are gang members, have some exposure to high school (Decker & van Winkle, 1996; Hagedorn, 1998; Huizinga & Jakob-Chien, 1998; Vigil, 1988). The impetus for examining the school is further found in best practices research which points to schools as a crucial partner in a comprehensive approach to reduce gang and youth violence (Howell, 2010). That said, relatively little research has been conducted on gang members in the school domain (Sharkey, Shekhtmeyster, Chavez-Lopez, Norris, & Sass, 2011). Lack of attention may be due to the fact that while gang behavior has been found to vary by school, gang behavior often may not be overt, nor attempt to subvert the school culture (Howell & Lynch, 2000; Monti, 1993).
The traditional school response to gangs has been the development of gang definitions, banning of certain clothing and symbols, and creation of discipline strategies, with a lack of attention to prevention and intervention needs and programs (Cheng, 2003; Maryland State Department of Education, 2011). Discipline strategies are often subsumed under zero tolerance policies that target the delinquent behaviors exhibited by gang members and other youth using suppression-based techniques. Youth are given punitive sanctions, such as suspensions and expulsions for policy violations. These policies have been criticized because they do not address the criminogenic needs of youth; they negatively affect the school learning environment; and they are disproportionately applied to minority youth (Skiba & Knesting, 2002). Excluding youth from school reinforces the school-to-prison pipeline, and there has been a call from education scholars to address youth with behavioral challenges inside the traditional school setting (Morrison et al., 2002).
Interventions with gang members and those suspected of gang involvement, however, are unlikely to take place in the school setting. Research notes that school personnel lack the expertise in dealing with such youth, and frequently refer them to community entities, particularly the police (Larson & Busse, 1998). Given the mission of police, a suppression-based response that does not address the needs of youth is likely to follow a school referral. Similar to the evaluation results of school-based suppression techniques, it is unlikely that police suppression-based responses will be effective in dealing with the needs of at-risk youth (Decker, 2003). Unfortunately, collaboration between police and community agencies who do address the needs of gang members is not yet commonplace (Varano & Wolff, 2012).
Unlike school-based interventions, school-based prevention of gang membership and behavioral problems is an area of research that has shown promise. Three school-based preventive programs, evaluated with rigorous experimental designs and long-term follow-up periods, have demonstrated impacts on gang membership and delinquency. The first, the revised Gang Resistance Education and Training (G.R.E.A.T.), has reduced the likelihood of gang membership in a sample of middle school students and has increased prosocial attitudes on a number of dimensions as compared to a control group (Esbensen et al., 2011). G.R.E.A.T. is an ongoing program, typically implemented as a full coverage, primary prevention curriculum aimed at all students in high-risk, urban schools. Students are taught to resist the lures of gang membership, and they learn about the negative consequences of membership through this program.
Two other school-based prevention programs, the Montreal Preventive Treatment Program and the HighScope Perry Preschool Study, are noteworthy because gang prevention was not a manifest goal of either program, but each has shown reduced gang involvement in participants as compared to youth in control groups. The Montreal Preventive Treatment Program was created to address antisocial behavior among low-income boys aged 7 through 9 who had shown behavioral problems in kindergarten. Longitudinal results showed better school performance and reduced delinquency and gang membership (Gatti, Tremblay, Vitaro, & McDuff, 2005). The HighScope Perry Preschool Study provided low-income youth with a participatory learning program involving parents in the process and compared those youth with a group who did not receive the program. Superior quality of life outcomes, including better employment, higher education, and reduced crime and violence, including gang fights, were found (Schweinhart et al., 2005). Combined, the results from these successful prevention programs indicate that effective prevention can take place in the school setting and that there are shared risk factors and (some) behavioral patterns among groups of youth who have the potential to be gang members.
Finally, the movement toward comprehensive community strategies to address gang and youth violence indicates that schools need to be an active partner in these initiatives (Howell, 2010); yet, they are often missing from the table in discussions around prevention and intervention programming (Sharkey et al., 2011). Collectively, more must be known about the gang and non-gang youth who are in schools as well as research that can best guide effective policy and programming.
Classification Problems
The comparative approach to studying gang members is complicated by research that has shown that gang membership is fluid, and commitment to the gang varies between individuals and within individuals over time (Curry, Decker, & Egley, 2002; Thornberry et al., 2003). Gang membership may be more transitory during the middle school years and then solidify during the high school years (Curry et al., 2002; Decker & van Winkle, 1996; Monti, 1993). Gang membership fluidity is more likely to be found in loosely structured gangs, which characterizes many gangs in the United States (i.e., Decker & van Winkle, 1996; Hagedorn, 1998; Thrasher, 1927).
Even with these complications, an important addition to the literature on gangs is recent research that shows targeted prevention and intervention efforts have greater positive effects on individuals who most need such services (i.e., Brennan, 2012; Webster-Stratton & Taylor, 2001) and that deeper-end services provided to low-risk individuals are likely to have iatrogenic effects (Lowenkamp, Latessa, & Holsinger, 2006). Thus, it is important to identify subgroups of individuals who may be best served by particular types of programming (Sullivan, Childs, & O’Connell, 2010).
Classification based on validated, fourth generation risk assessments, such as the Youth Level of Service Case Management Inventory (Schmidt, Hoge, & Gomes, 2005), is a step in the direction of providing appropriate individuals with appropriate services. Research shows that, at this point, gang membership itself should not necessarily be the deciding factor in programming, though it is likely that gang members have elevated risk (Gebo & Tobin, 2012; Melde, Gavazzi, McGarrell, & Bynum, 2011). Many theoretical and practical approaches to the problem of gangs examine the issue as a gang/non-gang dichotomy and use methods, such as regression techniques, to try to predict who is in the gang category. At the same time, gang membership risk and delinquency, particularly serious delinquency overlap, and a research task is to sort out key differences.
The current study examines whether it may be useful to approach the issue in another way with available cross-sectional data. Specifically, we take an empirically grounded look at possible distinctions between gang members and other youth using a latent class analysis (LCA), rather than assuming a priori, as many current approaches do, that gangs are a distinct category unto themselves. Risk factors, which presumably would remain or be enhanced by gang membership, are first entered into a model to classify distinct youth groups, with gang membership added only after those groups have been established to better compare both similarities and differences among gang and non-gang youth.
Utilizing a different methodology with the same question is not a panacea, but it can be helpful in the quest to sort out differences and similarities to refine our knowledge of gang membership to better target appropriate prevention and intervention strategies. While validated risk and needs assessments are essential, investigation of possible latent classes can further research in this area (see Bailey, 1994; Meehl, 1992) and provide some information relevant to those who design, develop, and implement programs (Brennan, 2012).
Method
The Massachusetts Youth Risk Behavior Survey (MAYRBS) is used to examine whether or not gang members fall into a distinct category from other youth, delinquent or not. The Youth Risk Behavior Survey (YRBS) was developed by the Center for Disease Control to understand the risk of youth nationally by asking high school students about their behaviors (Eaton et al., 2012). The YRBS is administered to a representative sample of public school high school students in states every other year; thus, risk behavior trends can be compared across time and across states. Further, because the survey is representative of public high school students, it can provide important implications for school prevention and intervention strategies at the state and national levels.
Several other data sets have been used to examine gang issues across geographical locations in the United States and each has strengths and limitations. The G.R.E.A.T. data set, as discussed earlier, is comprised of a middle school-based sample of youth in high-risk urban neighborhoods (i.e., Esbensen et al., 2011). Students are followed over time, but it is not meant to be representative of all school youth. Beyond the school realm, both the National Longitudinal Study of Adolescent Health (Add Health; i.e., Barnes et al., 2010) and the National Survey of Youth (i.e., Elliott, Huizinga, & Menard, 1989) are national panel studies that allow for comparisons of participants across study waves utilizing more than just youth responses. At the city level, longitudinal youth studies in Rochester (i.e., Thornberry et al., 2003), Seattle (i.e., Hill et al., 1999), Denver (i.e., Esbensen & Huizinga, 1993), and Pittsburgh (i.e., Gordon et al., 2004) have significantly added to the literature on gangs, though gang membership is not defined consistently across all these data sets.
The 2009 MAYRBS data are used for this analysis, and the 2011 MAYRBS data are then used to cross-validate those results. States are allowed to add their own questions of interest to the YRBS survey. One of the questions that Massachusetts has added is “Have you been a gang member in the last year?” While this is only a single question that represents the construct of interest, prior research has found this to be a relatively robust indicator of gang membership (e.g., Esbensen, Winfree, He, & Taylor, 2001).
The MAYRBS was administered to a statewide representative sample of 2,707 students in public high schools in 2009 and 2,729 students in 2011 using cluster sampling, where schools were chosen with probability proportionate to size, then randomly selected classrooms within schools were chosen, and finally all students within that classroom were eligible to complete the questionnaire. 1 Trained researchers administered the questionnaire to students and were available to clarify and answer questions. Data were cleaned for response sets and missing values and then weighted. All analyses, beyond descriptive measures, incorporate weights in order to generalize to all Massachusetts public high school youth.
Variables in Analysis
Survey items were selected that best represent risk of delinquency and gang membership based on prior research. While MAYRBS questions fall primarily in the individual and school domains, comparing responses based on this representative sample of public high school youth can provide information relevant for practice and policy in the school realm. Survey items used in this study elicited information about violence, which were fighting and weapon carrying; victimization, both physical and sexual; alcohol and drug use; mental health state, including depression and suicide ideation; relationships with adults in the home and in school, learning disabilities, and sexual behavior. Items were dichotomized to represent an absence of risk (“0”) or one or more instances of risk (“1”) based on analysis of each variable which showed most students did not respond affirmatively to most risk factors. The decision also was grounded in prior research which promotes a standard cut point across variables (Arthur et al., 2007) and research which has shown that dichotomization is meaningful in criminological studies and is more understandable for diverse audiences (Farrington & Loeber, 2000). Covariates included in an elaboration of the classification model were age, sex, ethnicity, grades in school, and length of time in the United States. 2 The descriptives for the models included in the classification analysis as well as key covariates are shown in Table 1. 3 Table 1 also shows that approximately 7% of youth self-reported gang membership in the last year.
Percentage of Those With Riska (Unweighted).
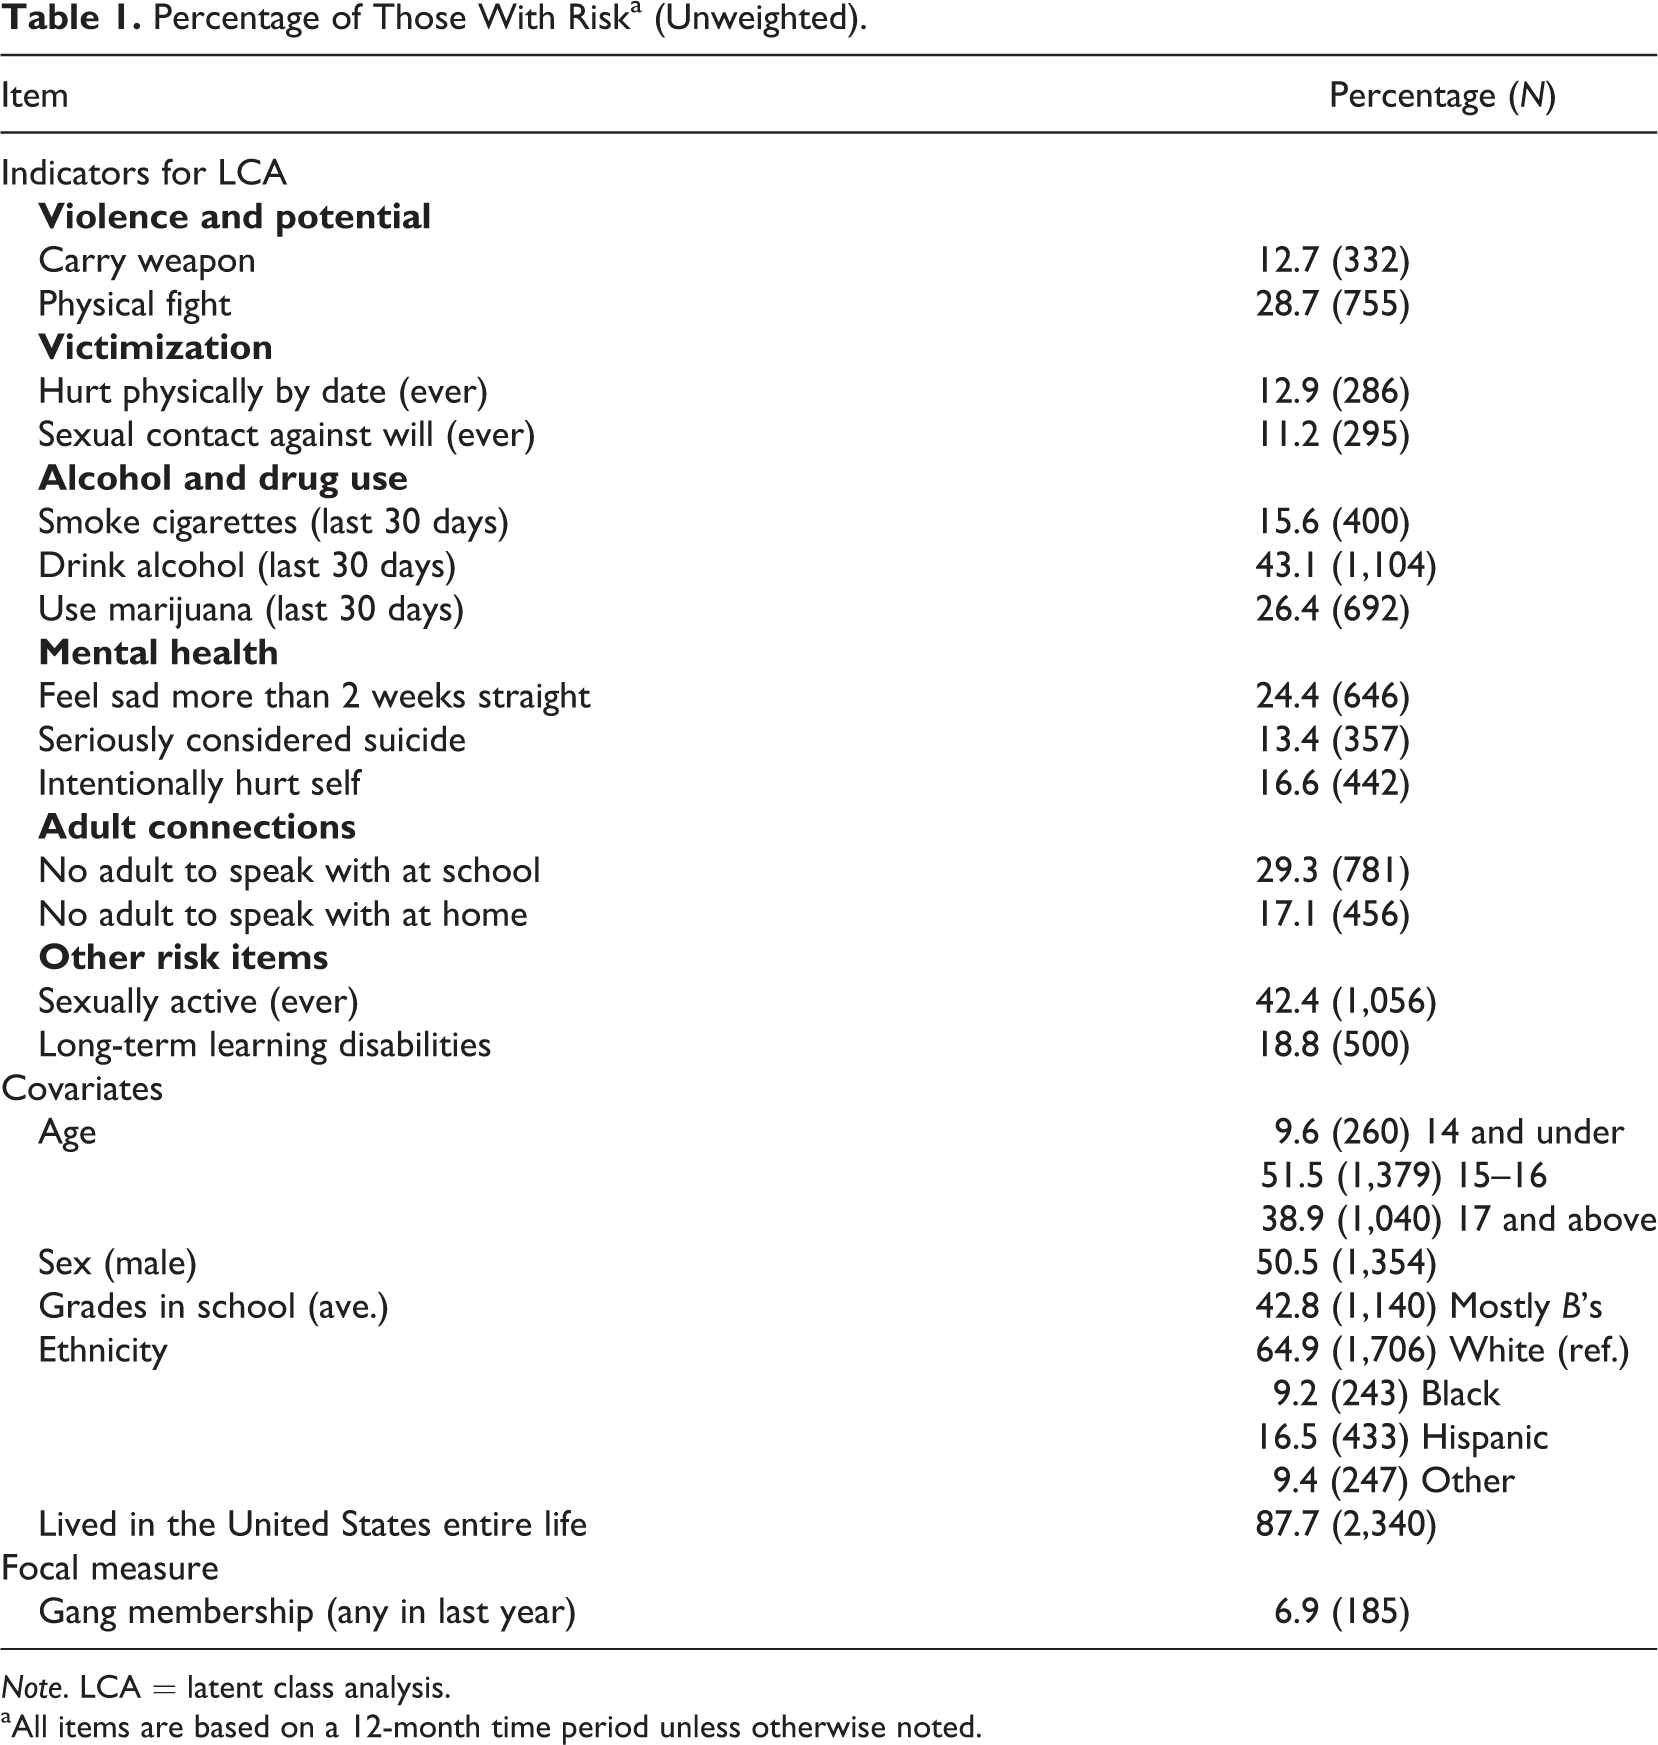
Note. LCA = latent class analysis.
aAll items are based on a 12-month time period unless otherwise noted.
Analytic Strategy
The analytic process involved the specification of a series of latent class models using MPlus Version 6.12 (Muthén & Muthén, 1998–2010). The LCA approach identifies latent subgroups based on an expectation that observed responses to the various items included in YRBS can be explained by underlying categorical groupings of individual youth respondents (Clogg, 1995; McCutcheon, 1987; Muthén, 2002; Vermunt & Magidson, 2004). Gang membership, or risk of such, was not established as a distinct category prior to analysis, but instead the response was incorporated in the model after initial latent classes had been established. 4 This ensured that there was some independence in the initial identification of the fit, size, and nature of latent class groupings prior to incorporation of this central measure. Additionally, rather than using gang/non-gang groupings, which rely on assumptions (Decker et al., 2013), LCA allows youths’ responses to provide the basis on which distinctions are made. We then add a gang membership variable to consider the appearance of these specific cases across the reasonably homogeneous subgroups identified through LCA, with the conditional probability of that item providing an indication of the degree to which gang members fall into one or multiple risk factor groups.
Several measures of fit and classification quality were used in order to evaluate these models where the key initial decision is to determine the likely number of classes. The Bayesian information criterion (BIC) is based on the log likelihood value of the fitted model (adjusted for the number of estimated parameters; Nylund, Asparouhov, & Muthén, 2007). Lower values on this index suggest a better fitting model. The Lo–Mendell–Rubin (LMR) and bootstrapped likelihood ratio tests (BLRT) compared the specified “k” class model to a “k–1” class version (e.g., three classes vs. two). Lower observed probability values associated with these tests indicate that the smaller model can be rejected in favor of the one with an additional class (Lo, Mendell, & Rubin, 2001; Nylund et al., 2007).
Another means of comparing models draws on the quality of classification emerging from the assignment of individuals to groups based on their actual responses and the model estimates. The “Entropy” statistic ranges from “0” to “1” with values closer to “1” suggesting clearer placement of subjects into classes (Vermunt & Magidson, 2004). Similarly, the agreement between predicted and actual classification (i.e., marginal values in a cross tabulation of the two) helps provide a sense of the quality of the classification results based on a particular model as it demonstrates the degree of uncertainty in the model-based assignments through the proximity of those values to “1.”
The estimates produced in the LCA process are (a) latent class probabilities and (b) conditional item probabilities. The former set of estimates identifies the number of extracted classes and their relative sizes. The conditional item probabilities identify the likelihood of a particular response on an item given assignment to that group. These are analogous to factor loadings in that they help in defining a category of the latent variable in a substantive sense. These estimates indicate how different response patterns fit together as a summary of the latent variable’s properties and are used in defining the latent classes comprising the overall variable (Nylund et al., 2007; Vermunt & Magidson, 2004). Following this process, the covariates mentioned above were added to a multinomial logistic regression with the previously identified latent classes used as an outcome variable. These regression coefficient estimates provide a sense of the likelihood that a youth would be placed in a given class (as opposed to a reference group) for a one-unit change in the covariate.
The items entered in the LCA did have some missing data. Missing data ranged from .1% (3) on some items, such as “How old are you?” to “hurt physically by a date” 17.4% (468). The majority of items had less than 5% of cases missing. In order to include as many cases and as much data in the modeling process as possible, all models were run using a Full Information Maximum Likelihood estimation approach (Schafer & Graham, 2002). The sampling weight and primary sample unit indicators were included to account for survey nonresponse and the complex survey design of the YRBS, respectively.
Results
A series of latent class models was estimated using the risk items without the covariates and the gang variable to establish the most appropriate number of risk marker classes in these data. Table 2 shows the results of this process using multiple fit statistics. The initial examination of the BIC statistic suggests a continual decline across the two- to six-class scenarios. The largest decline, however, occurred from Class 3 to 4, and the trend leveled off at that point. Much of the evidence from the ancillary tests in this case (e.g., LMR, BLRT) was equivocal on whether any other specification may be of superior fit to the four-class version. The four-class model, however, has a much better level of fit than the three-class model based on the Bayes Factor calculation of the exponentiated difference in BIC values (e BICi − BICj ; Nagin, 2005, p. 69). While both difference values are nontrivial (352 for four vs. three classes and 86 for five vs. four classes), the former showed a greater change in the BIC value from one specification to the next. In addition, the entropy statistic (.75) and lowest marginal value (0.80) for the four-class model demonstrated reasonably good class placement relative to the other models.
Comparisons of Iterative Latent Class Modeling Process for Risk.
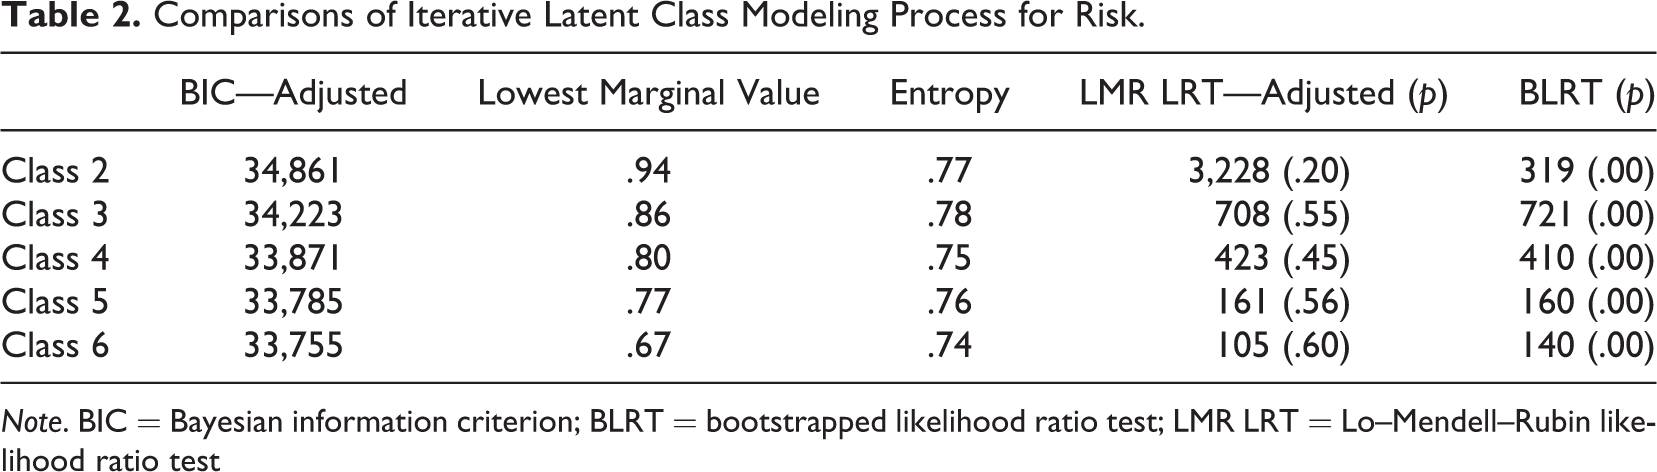
Note. BIC = Bayesian information criterion; BLRT = bootstrapped likelihood ratio test; LMR LRT = Lo–Mendell–Rubin likelihood ratio test
Table 3 displays the latent classes associated with the best-fitting model, which can be loosely labeled as Low Risk (44.9%), Mental Health Risk (18.8%), Intensified Risk (24.8%), and High Risk (11.5%), and their conditional probabilities on risk items in the survey (see Figure 1). The gang membership item was added to the analysis at this stage, as this model specification helps shed light on where self-identified gang members tend to cluster within groups, rather than using the responses to risk to predict gang membership, as regression techniques do, which implicitly assumes a causal ordering that cannot be verified with this cross-sectional data set. Overall, those in the Low Risk class generally had the lowest conditional probability estimates when compared to the other classes; conversely, those in the High Risk class generally had the highest probabilities of endorsement of risk items when compared to other classes. There are two important exceptions to this general point. The Mental Health Risk class had a slightly lower probability of using marijuana than the Low Risk category (p = .130). The Mental Health Risk class also had a slightly higher probability of not having an adult at school to speak with about problems than the High Risk class (p = .349).
Conditional Probabilities of Risk Across Latent Classes.
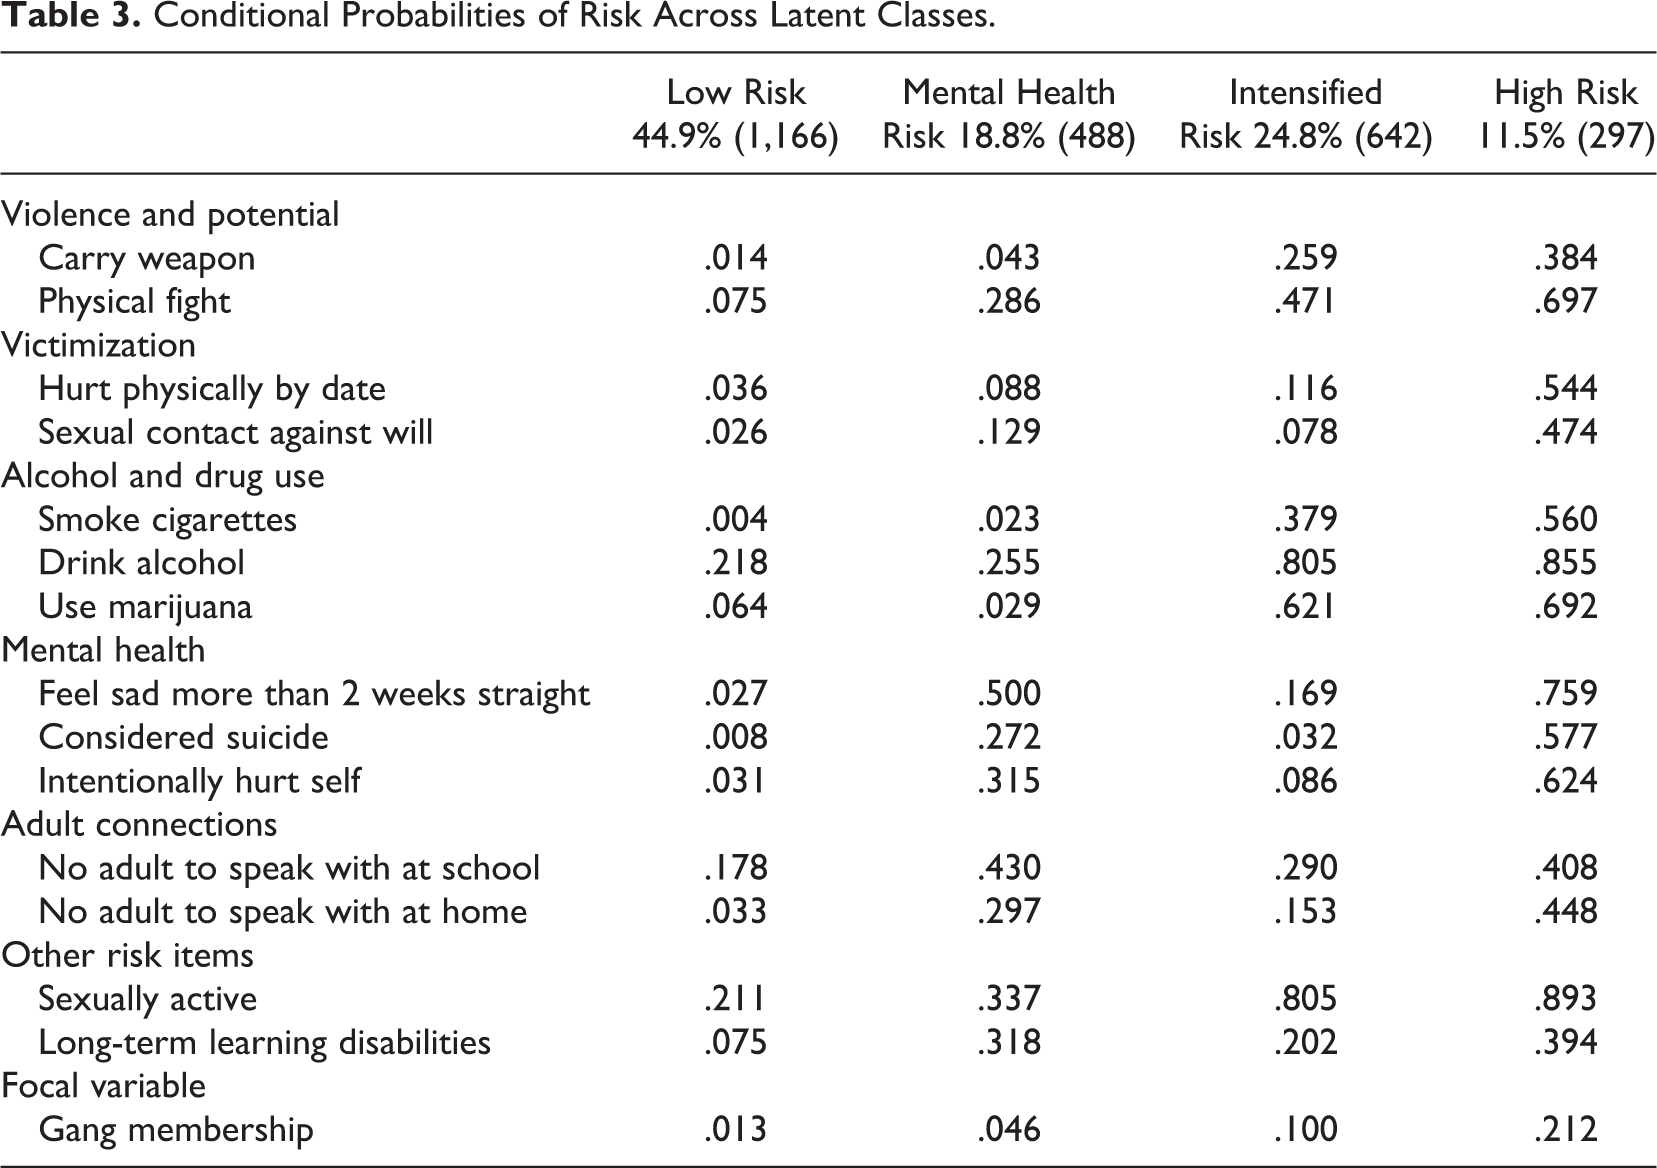
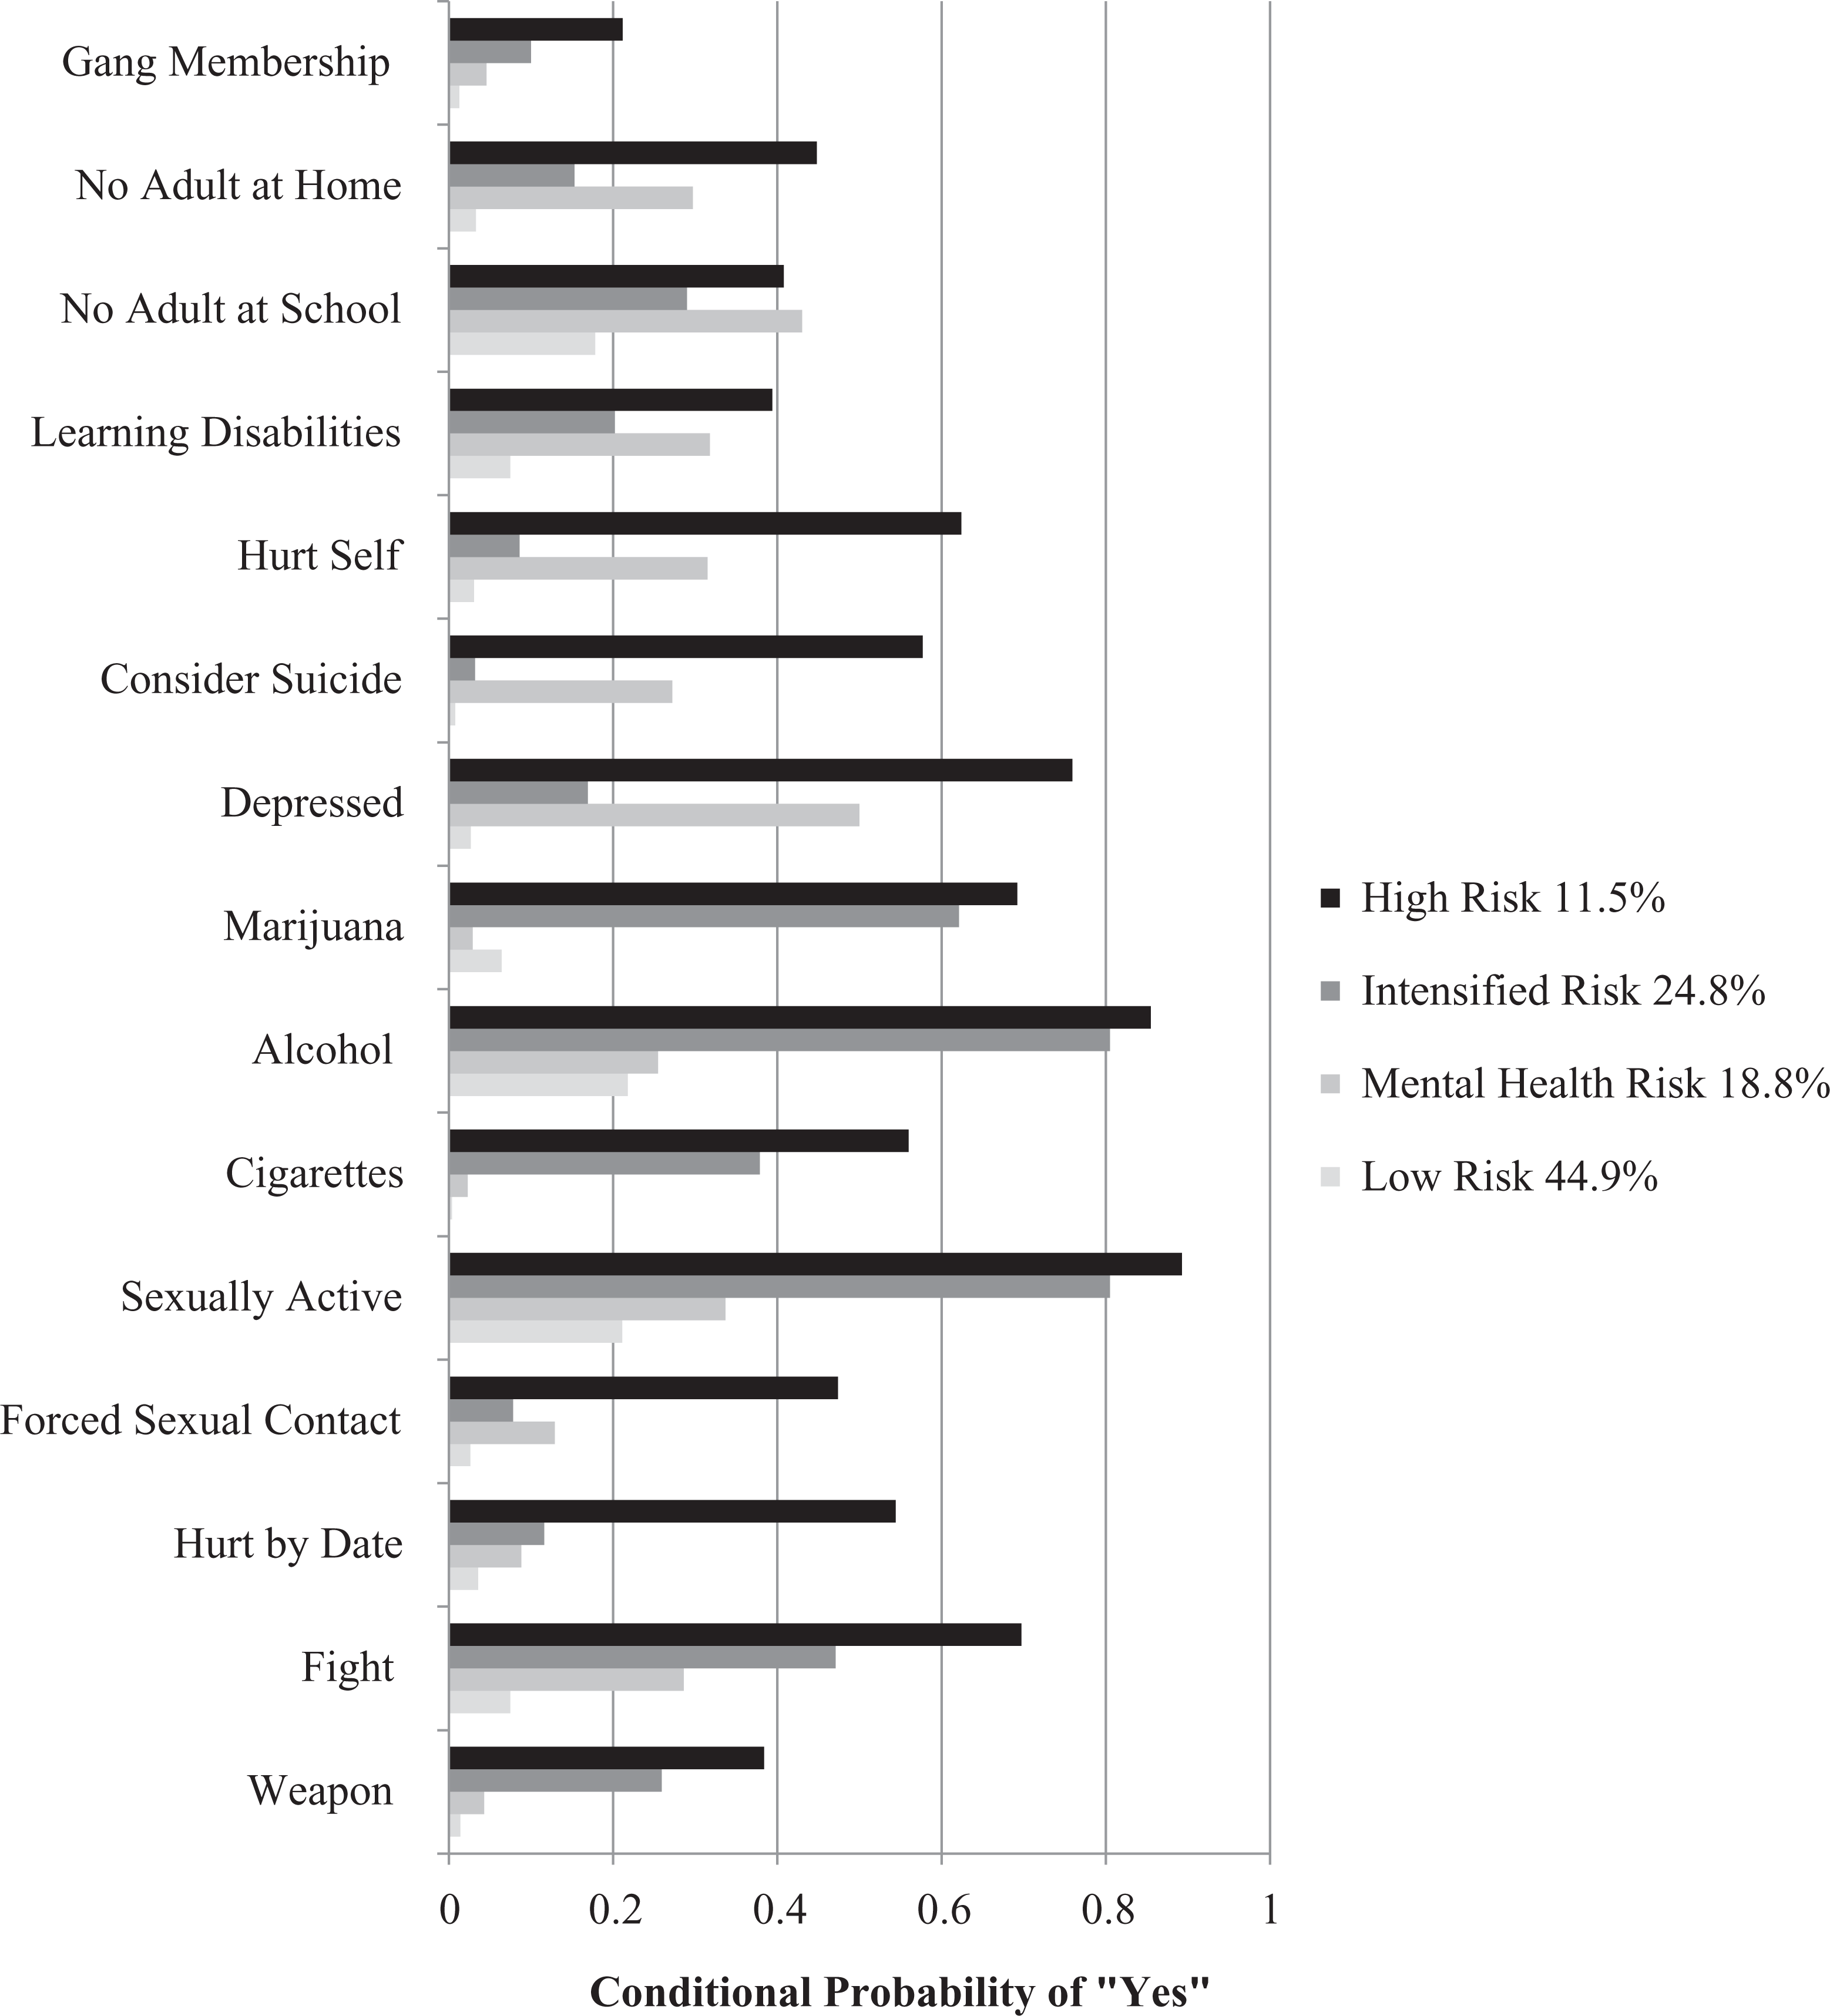
Risk across classes.
The largest class of youth is categorized as Low Risk. These youth demonstrated little to no probability of endorsing the various risk items. These youth had a very low probability (<.08) of violence, victimization, drug use, or mental health issues. There were only slightly higher conditional probabilities of being sexually active (.211) and drinking alcohol (.218) for youth in this class when compared to the other risks of this group. Their status as a low-risk group is affirmed by the fact that they had only a very slight probability of indicating that they had been a gang member in the previous year (.013).
Those in the Mental Health Risk category had higher violence, victimization, sexual activity, cigarette, and alcohol use risk probabilities than those in the Low Risk class. This class had higher probabilities of lacking adult connections than those in the Low Risk and Intensified Risk classes. The Mental Health Risk class also had a higher conditional prevalence of youth with long-term learning disabilities (.318) compared to the Low Risk or Intensified Risk classes. Those in the Mental Health Risk class had lower conditional item probabilities across all measures than those in the High Risk class. Finally, their probability of reporting gang membership was greater than that of the Low Risk group but still under .05. Thus, it appears that this group of youth had a constellation of problems, but they were somewhat distinct from those in the other classes.
Youth in the Intensified Risk class had higher endorsement probabilities for items that may be considered somewhat normative in the adolescent experience in the United States, such as alcohol and drug use and sexual activity (Reyna & Farley, 2006), than those in the Low Risk and Mental Health Risk categories. Compared to youth in the Mental Health Risk class, however, these youth had more adult connections and showed low probabilities of mental health concerns. They also had lower probabilities of indicating that they had learning disabilities. While youth in the Intensified Risk class had a higher probability of being hurt physically by a date than those in that Mental Health Risk class (.116 vs. .088), they were more likely to have had sexual contact against their will (.078 vs. .129). Interestingly, youth in this class had higher probabilities of gang membership (.100), weapon carrying (.259), and involvement in physical fights (.471) than either those in the Low or Mental Health Risk classes suggesting that this class is not solely comprised of those engaged in normative risk-seeking activities.
Finally, those in the High Risk class had the highest probabilities of responding affirmatively on the various risk items and also had the greatest likelihood of reporting gang membership (.212). They were more likely to partake in violence and to be victimized. They had mental health issues and lacked adult connections in and out of school. Overall, this class is distinct from others across most of the dimensions of risk included in the model; considerably so in many cases. They exhibited the greatest accumulation of risk factors (see Figure 1). That said, this class was similar to the Intensified Risk category in terms of alcohol and marijuana use as well as sexual activity, though the High Risk class had higher conditional probabilities on these measures. This class was similar to the Mental Health Risk category in terms of long-term learning disabilities and lack of adult connections at school.
Predictor variables were included in a multinomial logistic regression model with the four latent classes comprising the dependent variable to develop an enhanced profile of the students who fell into each of the classes (see Table 4 for results). The Low Risk class was used as the reference category for the main analysis. The intercepts for all classes (High Risk, Intensified Risk, and Mental Health Risk) were significantly different from the Low Risk class. This means that beyond the predictors and covariates included herein, these other classes are indeed different from the group with the least amount of risk. Relevant class comparisons are detailed below.
Multinomial Logistic Regression of Latent Classes on Covariates.*
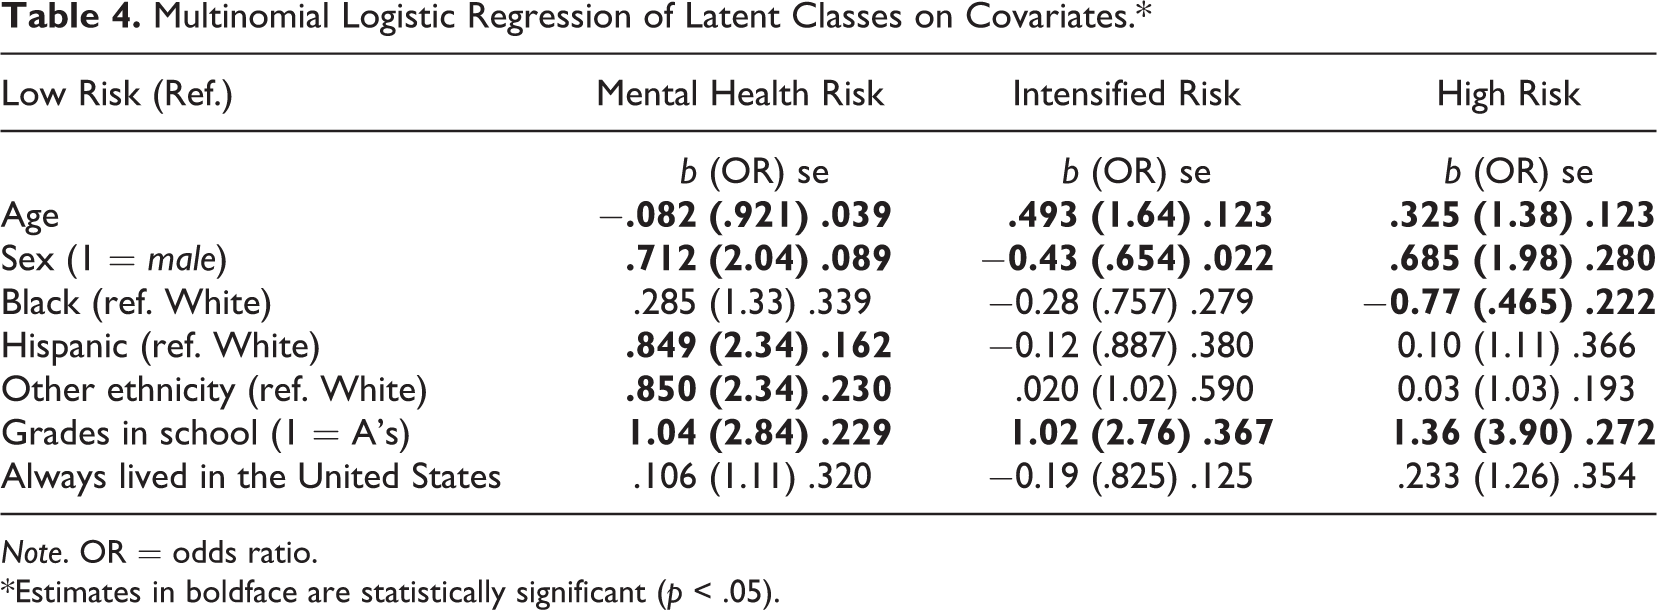
Note. OR = odds ratio.
*Estimates in boldface are statistically significant (p < .05).
Those in the High Risk class, which contained the majority of those reporting gang membership in the last year, can be distinguished from those in the Low Risk class in several respects. As youth increased by one unit in terms of reporting worse grades, they were 3.9 times more likely to be assigned to the High Risk as opposed to the Low Risk class. Males were almost twice as likely (odds ratio [OR] = 1.98) as females to be in that class as opposed to the Low Risk class; and as youth aged a year they had 38% greater odds of being in the High Risk class (OR = 1.38). Youth in the High Risk class tended to be White as compared to Black (OR = .465). 5
Older (OR = 1.64) youth and those who had worse grades (OR = 2.76) tended to be at greater risk of being placed in the Intensified Risk rather than the Low Risk class, but, interestingly, relative to females, males tended to be approximately 35% less likely to be in this class as opposed to the Low Risk class. Finally, when compared to those in the Low Risk class, those with worse grades were approximately 2.84 times more likely to be in the Mental Health Risk class. Compared to White youth, those who self-identified as Hispanic or other race/ethnicity also tended to have a greater likelihood of being in the Mental Health Risk class (OR = 2.34) as opposed to the Low Risk one. Males also appeared to be at greater risk than females for placement in the Mental Health as opposed to the Low Risk class (OR = 2.04). Finally, as youth increased a year in age, they had 8% lesser odds of being in the Mental Health Risk class as opposed to the Low Risk class.
Cross-validation is important in establishing the viability of conclusions from data-driven methods such as LCA (Bailey, 1994). Given this, we utilized the same LCA procedure with the MAYRBS 2011 data to validate these 2009 results. Findings show that a four-class model was appropriate and that the same class typologies (High Risk, Intensified Risk, Mental Health Risk, and Low Risk) were seen with approximately the same proportions, including self-reported gang membership. Covariate effects, including those related to race/ethnicity, were generally similar across the two data sets as well. 6 There may indeed be some clear trends across time with regard to risks and classes in that the 2009 results reported above can be replicated using this state’s subsequent 2011 YRBS data set.
Summary and Discussion
The self-reported gang membership was 6.9%, but the conditional probability of gang membership was greatest in the High Risk class (.212), as can be expected given prior research that shows gang members are more likely to have an accumulation of risk factors across multiple domains than delinquent and non-gang youth (e.g., Howell & Egley, 2005). There was, however, about half that probability of gang membership in the Intensified Risk class (.100); and approximately half of that in the Mental Health Risk class (.046). Although the highest risk youth had considerably higher probabilities of responding “yes” to the question of whether they had been in a gang in the previous year, endorsement of that item was not exclusively the province of those youth in the class that appeared to be most severe in terms of risk. Furthermore, even among the approximately 12% of youth who exhibited the highest levels of risk, a vast majority of youth did not report gang involvement.
Together, these findings suggest that gang members in this state’s public high school population are part of a larger class of youth which includes more than gang-involved youth. This study underscores the point that gang members, particularly those in public schools, cannot be set apart from others in terms of addressing their risks and needs. They are part of a larger group of high-risk youth with multiple problems, which need to be addressed in a larger well-being framework (Eccles, Brown, & Templeton, 2008), especially given the high probability of both mental health and victimization in this class.
Clearly, gang members are not monolithic. Those claiming gang membership did not fall solely in the highest risk category. In part, this may be due to the fact that gang members are diverse in terms of their levels of commitment to the gang, which may impact their risks or set them apart from other gang-affiliated youth, as previously discussed. These findings suggest the need for assessment at intervention stages to match programs to individual needs (Vieira, Skilling, & Peterson-Badali, 2009). It also indicates that research, while trying to understand possible distinctions between gang members, delinquent, and nondelinquent youth, should recognize and account for the fact that there can be considerable overlap in risk across groups.
There are several limitations to this study. Most notably, this data set includes public high schools in Massachusetts only. Middle schools and alternative schools are excluded, as are those who have dropped out or who have been expelled. It also is not a community-based sample, which precludes direct comparisons to some of the other studies in the risk factor and gang literature. Future work should incorporate youth from alternative school settings as more central gang members who may have a different risk profile were likely absent from this study. While this may be a special case of youth in schools, the report of approximately 7% of gang membership statewide in the last year is relatively consistent with a nationally representative probability sample that showed 5% of youth reporting gang membership (Barnes et al., 2010) as well as school-based samples in the United States and Europe (Esbensen & Weerman, 2005). Again, gang self-nomination alone is not the optimal method for defining gang membership, as that may dilute gang and non-gang differences, but prior research has shown it to be a robust indicator of behavior (Esbensen et al., 2001; Matsuda, Esbensen, & Carson, 2012).
From the standpoint of measurement and the ability to develop comprehensive latent classes, there were limited risk factors in the data set. Most of these pertained to the individual and school domains, though clearly risk factors across domains, including family, peers, and community, affect youth development generally and gang membership specifically (Howell & Egley, 2005), and those should be taken into account in future research. There were only two measures of violence, weapon carrying and fighting; yet, violence and the potential for violence can be distinguishing factors between gang members and others. Further, the YRBS has been shown to have good measures of self-reported violence (Coggeshall & Kingery, 2001). Measures of key protective factors were not included in this analysis despite the fact that they might provide a more comprehensive description of youth. It may be that there are some protective factors that distinguish gang and non-gang youth as well, but they are not included in the YRBS data set. Howell (2010) also has noted that there has generally been little development in the field of identifying and explaining protective factors in gang and delinquency research (also see Sharkey et al., 2011).
This cross-sectional data set is limited with regard to questions on youth ethnicity. The YRBS is not nuanced enough to unpack complex processes around varied immigration experiences of minority youth and it cannot account for broad-scale policies that may have a disproportionate impact on the presence of minorities in the school setting. There is a growing literature, for example, on the negative effects of zero tolerance and similar policies on students of color, academic outcomes, and school climate (McCord, Widom, & Crowell, 2001; Skiba & Knesting, 2002). These policies have implications for which types of students are present in typical school settings and their corresponding risk profiles. Thus, the implications of findings related to race/ethnicity comparisons may be quite bounded.
Finally, recent studies of gangs in Massachusetts show that gang membership may be diverse, and gangs may generally operate as loosely structured entities, rather than tightly organized groups (Gebo & Bond, 2012; Kennedy, 2011). Responses from youth who are less committed to their gangs as well as those from different geographical locations are combined, which may water down the gang/non-gang differences (Klein & Maxson, 2006). That said, from an intervention perspective, the classification of gang youth alongside their peers and the gradation in needs of gang youth stands out.
This work is significant because it examines the issue of gang membership with a large statewide data set in a general population as opposed to a high-risk sample. This analysis sought to uncover how gang membership fits within a larger risk context of the adolescent population, assessing risk based primarily on empirically identified latent classes. Most research assumes that gangs form their own distinct risk group and proceed from that assumption. This study looked first at risk and then overlaid gang membership. Results showed that gangs do not appear to form a separate risk profile in the public school setting at the statewide level, which is consistent with risk factor research showing overlaps between gang membership and delinquency.
Researchers have noted that schools can buffer gang membership, as they are the institution in which youth spend a significant amount of time in their formative years (Conchas & Vigil, 2010; MacDonald, Piquero, Valois, & Zullig, 2005). Most gang members, including those who heavily commit to their gangs, have had some exposure to high school (Decker & van Winkle, 1996; Vigil, 1999). Poor academic performance was a consistent indicator of likely placement in higher risk classes. Consequently, that should be a clear sign of the need for a more thorough and comprehensive assessment, which can then lead to broadly addressing other risks that may reduce the likelihood of gang membership and/or other problems from a preventive standpoint. Those in the highest risk groups lacked school connections to adults. Combined, school failure and lack of attachment to adults at school has been shown to increase negative outcomes for youth, including delinquency and gang involvement (Catalano, Haggerty, Oesterle, Fleming, & Hawkins, 2004).
Thus, prevention strategies should focus on those likely to be a part of gangs, but those efforts must engage in a whole child perspective, including addressing the core risks that have been identified here. Prevention efforts must go further than classroom instruction on how to resist the allure of gangs or the consequences of gang membership. Just as a holistic view of the youth must be incorporated for success in prevention, a comprehensive approach is needed to intervene with youth in and outside of school and to address important social relationships (Arciaga et al., 2010). Evidence against the use of behavioral segregation and zero-tolerance policies in schools continue to mount (Conchas & Vigil, 2010; Skiba & Knesting, 2002), and in the future, fewer youth may be completely removed from the public school setting. We need to know more about what works with this population, including more about them and the organizational dynamics of schools (Cook et al., 2009).
It is unrealistic to believe that schools alone can be the answer to preventing gang membership and serious delinquency. Community services located on school grounds mark a recent shift in some school districts to address the nonacademic needs of youth. Such an approach would reduce the burdens placed on the schools and ostensibly create a better link between the youth, the school, and the community, but as Gottfredson and Gottfredson (2002) note, for programs to work, schools must fully commit, integrate, and carefully implement programs based on best practices. There is a substantial portion of youth, and particularly gang youth, who may be in need of other services, and those types of creative collaborations are needed. In their gang ethnography over a decade ago, Decker and van Winkle (1996), stated, “Schools appear to be the one area where positive institutional experiences (i.e. not jail or police) penetrate their lives, and may be a fruitful arena for effective and innovative gang intervention and prevention efforts” (p. 204). Programs, such as G.R.E.A.T., have begun to make gang prevention inroads at the middle school level. Gang members are indeed in high schools and may resemble other high-risk youth, but what we do know about risk and gang membership needs to be systematically examined and applied in this setting.
Footnotes
Declaration of Conflicting Interests
The author(s) declared no potential conflicts of interest with respect to the research, authorship, and/or publication of this article.
Funding
The author(s) received no financial support for the research, authorship, and/or publication of this article.