
Abstract
The purpose of this study was to compare the predictive strength of a previously validated risk score across seven different operationalizations of juvenile recidivism. Drawing on data from the Florida portion of the Measuring Juvenile Reoffending Study, the study examines two research questions. First, do recidivism risk scores significantly predict a variety of measures of juvenile recidivism? And second, do risk scores exert statistically different effects on different measures of juvenile recidivism? The findings revealed that risk score significantly predicted all seven measures of juvenile recidivism. In addition, the only evidence of statistically different associations across measures of recidivism came from marker event (i.e., types of system contact) comparisons. Total risk score was a significantly stronger predictor of referral than of adjudication/conviction and a stronger predictor of adjudication and commitment. Altogether, our results highlight the importance of validating risk assessment scores on multiple different operationalizations of juvenile recidivism.
The prediction of juvenile recidivism has considerable policy and research relevance. Consistent with this, there has been a rise in the use of risk/needs assessment (RNA) tools by local and state juvenile justice agencies. Indeed, as of 2020, 42 states had implemented a single RNA tool statewide (Juvenile Justice Geography, Policy, Practice and Statistics [JJGPS], 2016). However, RNA tools typically are developed and scored on specific recidivism measures, and there is significant variability in the operationalization of juvenile recidivism across states and juvenile justice agencies. Despite federal legislation urging uniformity in the measurement of juvenile recidivism, extant research continues to document substantial differences in the measures used when assessing the effectiveness of RNA tools. In addition, despite calls for research comparing the predictive validity of RNA tools across different recidivism outcomes (Baglivio, 2009; Bechtel et al., 2007; Cottle et al., 2001; Schmidt et al., 2005), there exist few direct comparisons of these tools across outcome measures.
This study examines how strongly a previously validated recidivism risk score predicts seven different operationalizations of juvenile recidivism. The seven are those that are most commonly used by states, and they vary in terms of the marker event or type of system contact captured, the follow-up period used, and whether youth are followed into the adult criminal justice system (Andersen & Skardhamar, 2017; Deal et al., 2015; Harris et al., 2009). The results reveal how much conclusions about associations between the score and recidivism change when different measures of juvenile recidivism are used.
The Implications of the Operationalization of Recidivism for Risk Assessment
State-level assessments of measurement practices have revealed widespread variability across states in terms of the collection, analysis, and reporting of juvenile recidivism data (Walsh & Weber, 2014; Harris et al., 2009). The most recent national studies revealed that the most common marker event tracked by states was re-adjudication or reconviction, though only about half of states tracked it; states followed youth anywhere from 6 to 36 months post-supervision; and slightly more than half of states tracked youths’ recidivism into the adult system (JJGPS, 2016; Pew, 2014). There thus remains notable between-state variation in the operationalization of recidivism. In addition to making recidivism rates more comparable across systems, greater uniformity in measurement might also facilitate the cross-state translation of findings regarding risk factors for recidivism. Yet it remains unclear whether and how much those findings do indeed vary across operationalizations of recidivism.
It is plausible that measurement decisions will affect risk factors’ predictive power. First, different measures may capture different underlying constructs. Official recidivism measures are influenced both by behavior and by justice system processes (Vincent et al., 2012). For instance, referral or arrest data likely include more unsubstantiated cases than adjudication or conviction data (Harris et al., 2009; Maltz, 2001). Second, measures may vary in the extent to which they detect the outcome of interest. Shorter follow-up periods will miss more reoffending and will leave less time for system processing to play out (Deal et al., 2015; Harris et al., 2009). In addition, not tracking youth into the adult system may result in lower detection of reoffending among older youth (Deal et al., 2015; Pew, 2014).
Consistent with these expectations, recidivism rates vary considerably across operationalizations. A study of adult recidivism in Norway found rates ranging from 9% to 53% depending on how, among whom, and for how long recidivism was measured (Andersen & Skardhamar, 2017). Similar variability in rates has been found among juveniles (Harris et al., 2009). For example, among previously committed youth, reoffending rates range from approximately 20% to approximately 75%, depending on which stage of system contact is examined and how long youth are tracked (Annie E. Casey Foundation, 2011).
It also is possible that the predictors of recidivism vary across operationalizations. Three recent studies examined the predictors of different marker events. Wolff et al. (2020) examined whether gang involvement and behavior/cognitive disorders predicted rearrest and re-adjudication among a sample of previously committed youth. Both focal predictors appeared to have larger effects on rearrest. Similarly, Narvey et al. (2021) found that adverse childhood experiences appeared to be stronger predictors of juvenile rearrest than of re-adjudication. These two studies, however, did not conduct significance tests for differences in effects across the different outcomes. Most recently, Caudill and Trulson (2022) examined whether various risk factors differentially predicted the dates of new offenses, new referrals, and new adjudications. Eight of the 20 predictors—encompassing demographic characteristics, criminal history variables, and other individual-level risk factors—were significantly stronger or weaker predictors of referrals than of adjudications. As similar domains are included in RNA instruments, it is possible that by extension those instruments differentially predict different recidivism measures.
Additional suggestive evidence for this possibility comes from Schwalbe’s (2008) meta-analysis of the predictive validity of risk assessment instruments. In that study, conclusions varied by the follow-up period used in the study, though this finding was not consistent across different treatments of missing data and it is in contrast with earlier findings from Schwalbe’s (2007) previous meta-analysis. Later, Pusch and Holtfreter’s (2018) meta-analysis revealed possible differences in risk assessment predictive validity across marker events, though these differences were in opposite directions for males and females. Although meta-analyses can provide important insights into the consequences of choices of measurement, they do not constitute head-to-head comparisons of different measures of reoffending among the same sample. There thus are unanswered questions about exactly how much difference it makes if RNA instruments are used to predict one recidivism measure versus another.
The Current Study
The current study responds to calls for research that compares the predictive validity of existing RNA tools across different operationalizations—in this case seven—of juvenile recidivism. The analyses are guided by two questions: First, do recidivism risk scores significantly predict a variety of measures of juvenile recidivism? Second, do risk scores exert statistically different effects on different measures of juvenile recidivism? In testing these research questions, the study aims to reveal how much conclusions about the links between risk scores and juvenile reoffending change when different measures of reoffending are used.
Methods
Sample
The data came from the Florida portion of the Measuring Juvenile Reoffending Study. The Florida portion of that study collected archival data from the Florida Department of Juvenile Justice (FDJJ) and the Florida Department of Law Enforcement (FDLE) on a release cohort of youth leaving FDJJ supervision from July 1, 2012, through June 30, 2017. This study focused on youth completing residential placements. The data contained recidivism follow-ups for 13,196 spells of residential commitment; these spells were our analytic sample.
Focal Outcomes: Measures of Recidivism
Descriptive Statistics for Study Variables.
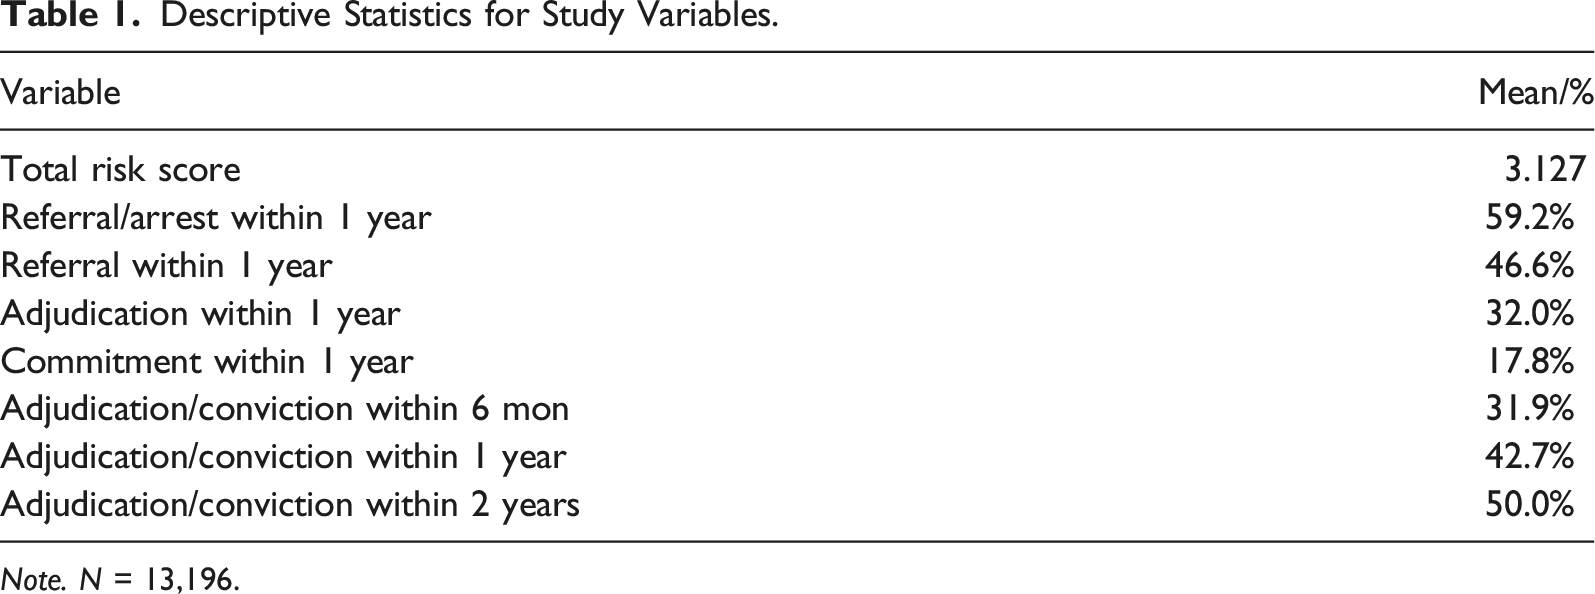
Note. N = 13,196.
Focal Predictors: Risk/Needs Assessment Scores
At the time that the data were generated, FDJJ used a validated risk/needs assessment instrument called the Residential Positive Achievement Change Tool (R-PACT; for examples of validation studies see Baglivio, 2009 and Hay et al., 2018). There were two versions of the R-PACT, specifically a 46-item screener and a 126-item full instrument; the latter contained all questions from the screener as well as additional questions. Both versions were multiple choice questionnaires that were completed by trained FDJJ staff during in-depth interviews with youth. FDJJ policy was to administer a R-PACT for each youth upon their entry (or reentry) to the system. In this study’s data, all R-PACTs were administered within 90 days of system entry.
The questions that were common to both the screener and the full version of the R-PACT produced total risk scores that were used by the department to classify youth in terms of their risks for recidivism. The risk scores were produced via proprietary algorithms and were identical across the two versions of the R-PACT. The total risk scores were based on two subscale scores: a criminal history score and a social history score. The criminal history score (range 0–31) was based on prior delinquent offenses, prior juvenile justice placements, escapes, and warrants for failure to appear before the court. The social history score (range 0–18) was based on youth characteristics and experiences such as school experiences, use of free time, peer affiliations, family history of criminal justice system contact, alcohol and drug use, mental health problems, attitudes, and aggression. Higher scores on both scales indicated higher risk for recidivism. Scores on the criminal history dimension were divided into four tiers (e.g., 0–5, 6–8) and scores on the social history dimension were divided into three tiers (e.g., 0–5, 6–9); the intersections of the tiers on these recoded subscale scores determined the total score. For example, youth in the second tier of both subscales were classified as being at moderate risk of recidivism. The total score was a four-point risk classification, with the points being low risk, moderate risk, moderate-high risk, and high risk. The risk scores were originally validated using FDJJ’s primary recidivism measure, adjudication/conviction within 1 year.
Analytical Strategy
A two-level multivariate multilevel model was conducted to estimate and compare the associations of total risk scores with each of the seven measures of recidivism. Multilevel models are extensions of regression that adjust for clustering by incorporating additional higher-order levels of analysis for the clusters. Multivariate multilevel models (MVMM) are variants of basic multilevel models that allow the joint analysis of multiple correlated outcomes in a single model (Snijders & Bosker, 2012). This is done through the addition of a lower-order level where the multivariate nature of the outcome is indicated. Here, the lower-order level contained the values of the recidivism outcomes, and the higher-order level was the original spell of system involvement. In addition, and especially relevant here, the models allow tests of whether specific predictors’ coefficients differ across the multiple outcomes (Baldwin et al., 2014). In our case, these tests indicate whether total risk score had statistically different associations with different measures of recidivism. We used the logistic version of MVMMs to account for the dichotomous nature of the reoffending variables.
Results
Multivariate Multilevel Logistic Regression Estimates for Total Risk Score in Predicting Different Measures of Juvenile Recidivism.
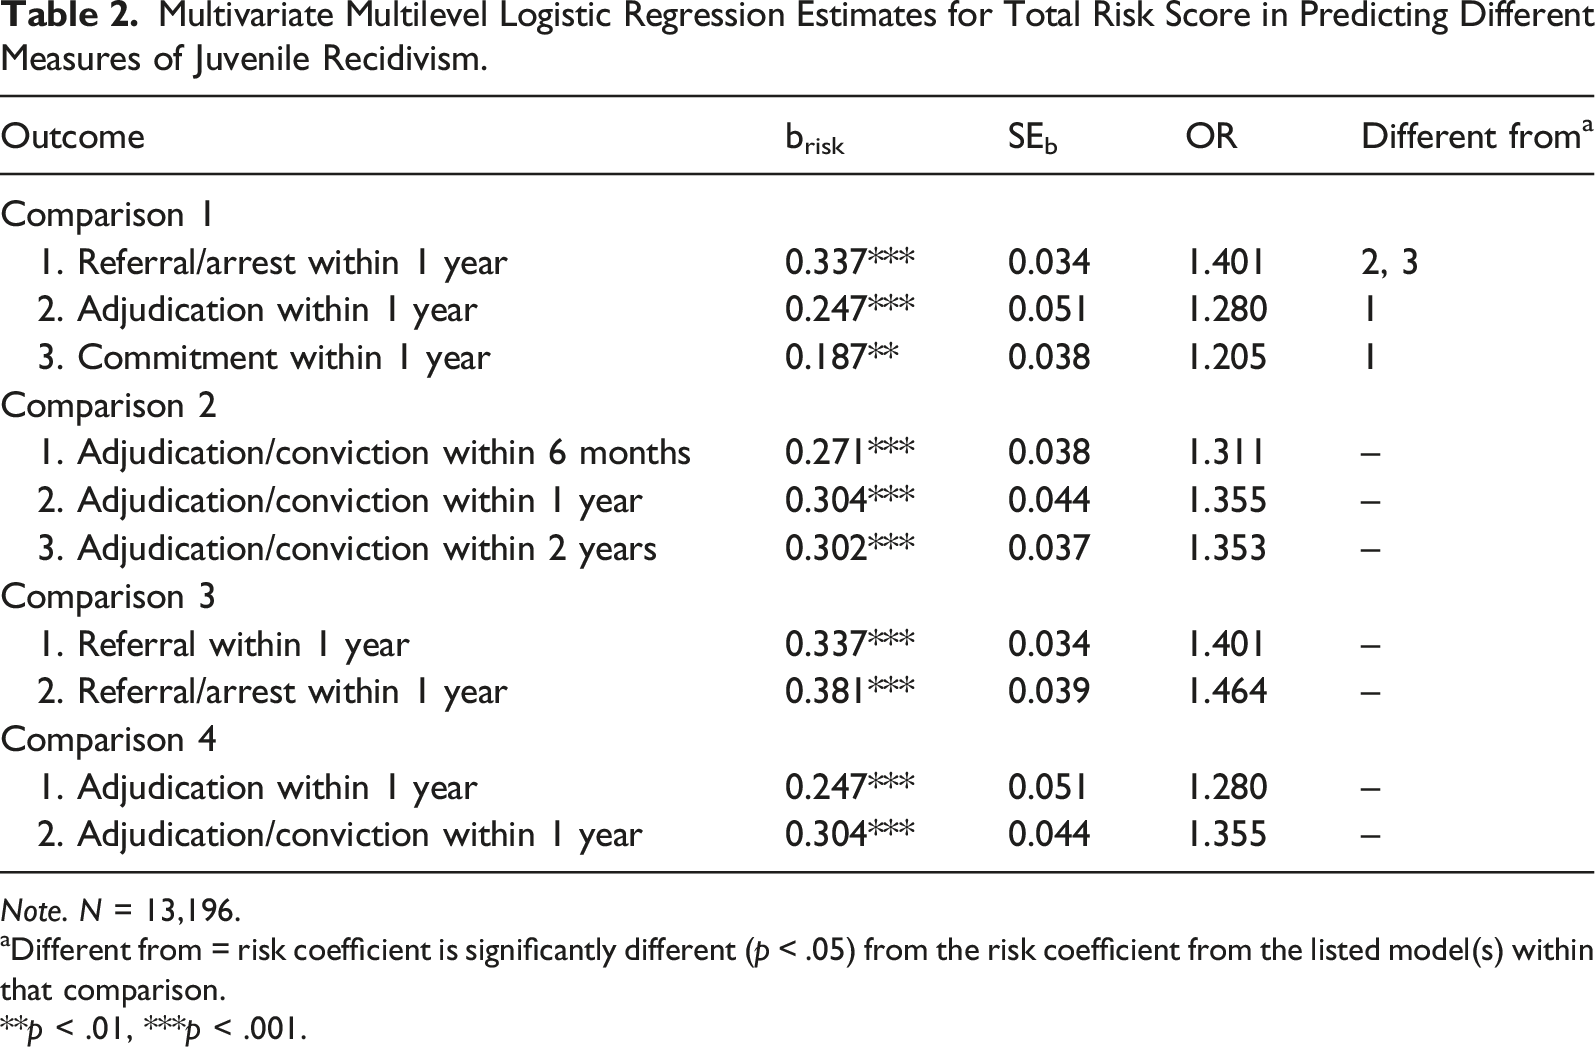
Note. N = 13,196.
aDifferent from = risk coefficient is significantly different (p < .05) from the risk coefficient from the listed model(s) within that comparison.
**p < .01, ***p < .001.
A second set of analyses predicted 6 month, 1 year, and 2 year adjudication/conviction from total risk score. The results for comparison two in Table 2 shows that total risk score significantly predicted all three measures. Here the odds ratios were similar across outcomes, and there were no significant differences between the three coefficients.
The final sets of comparisons examined whether total risk score was differently associated with recidivism solely in the juvenile justice system versus recidivism in either the juvenile or the adult criminal justice system. Comparisons three and four in Table 2 show that risk score had statistically indistinguishable associations with juvenile referral alone versus a combination of juvenile referral and adult arrest, and with juvenile adjudication alone versus adjudication or adult conviction. Thus, the only differential prediction was found for the different marker events.
Discussion
This study extended prior work on risk assessment and juvenile recidivism by examining the associations between a previously validated risk score and seven operationalizations of recidivism. The findings are important for two reasons. First, most state justice agencies use RNA tools, and it is important to understand how well risk scores from these tools predict different recidivism measures. And second, despite federal legislation calling for a national standard in measuring juvenile recidivism, states currently use a variety of operationalizations of juvenile recidivism. The current study aimed to shed light on whether existing RNA tools can be used to predict different forms of recidivism without losses of predictive strength.
The results yielded three key conclusions. First, total risk score significantly predicted all seven operationalizations of recidivism. The assessment tool thus had at least some predictive utility with respect to predicting a variety of types of system contact and at a range of follow-up periods. Second, the only evidence of variation in predictive strength was found across marker events. Risk score was a significantly stronger predictor of referral than of adjudication and commitment. This is consistent with the findings of Narvey et al. (2021) and Wolff et al., (2020) that some individual risk factors are more strongly associated with rearrest than with re-adjudication. These two studies, however, did not conduct significance tests for differences in effects across the different outcomes. Our study provides statistical confirmation of this pattern and extends it by incorporating commitment as an additional marker event.
Second, risk score had similar predictive strength for adjudication/conviction within 6 months, 1 year, and 2 years, respectively, and for measures of adjudication and commitment that did and did not include adult system data. This indicates that the R-PACT risk scores could be used to predict recidivism at varying times post-release and in either the juvenile system alone or the juvenile and adult systems combined with little impact on the conclusions. The predictive strength of the R-PACT thus appears robust to choices of follow-up period and systems considered, though it varies somewhat across choices of marker events.
The study findings have several implications for juvenile justice research and policy. First, the findings highlight the importance of considering the type of marker event when both evaluating the predictive validity of RNA tools and comparing reoffending rates across samples. Though total risk score predicted all three marker events, comparisons did reveal statistically significant differences in risk score effect sizes, with the risk score exerting stronger effects on the marker event indicative of an earlier stage of court processing. This is true even though the RNA tool was originally validated using adjudication, not referral, as the outcome. These differing effect sizes are consistent with the notion of predictive shrinkage—or “variations in predictive accuracy”—which can result from different operational definitions of recidivism and can affect RNA tool performance (Hamilton et al., 2021, p. 3). For researchers and practitioners, this suggests that it is crucial that RNA tools be developed and validated across multiple varying measures of juvenile reoffending. Policymakers considering the adoption of sophisticated RNA tools must similarly be cautious in adopting tools that have not been validated across different measures of reoffending.
Second, while it has been suggested that using varying recidivism follow-ups can impact RNA tool performance (Sullivan & Childs, 2022), our results suggest that the R-PACT predicts shorter follow-up durations (i.e., 6 months) equally as well as longer follow-ups (i.e., one and 2 years). From a policy standpoint, it appears that using a 6-month follow-up period may offer state and local juvenile justice agencies a more cost-efficient, yet equally reliable, option compared to a one- or 2-year follow-up. Given that few evaluations of RNA tools have been undertaken across varying follow-up durations, we recommend interpreting these findings with caution. Future research should continue to examine how using varying follow-up periods may affect conclusions about associations between risk scores and juvenile recidivism.
Lastly, the findings indicate that the predictive validity of the R-PACT risk score did not vary across operationalizations that incorporated juvenile court data, and a combination of juvenile and adult court data. As with our findings on different follow-up periods, we recommend caution in interpreting this conclusion. Prior research to our knowledge has not examined whether risk score predictions differ across recidivism measures that do and do not incorporate data from the criminal [adult] justice system. While additional replication of our analyses is needed, the findings here suggest that the R-PACT equally predicts youth recidivism whether or not adult offending is also tracked.
Although this study represented a rare head-to-head comparison of multiple recidivism measures in relation to risk assessment scores, it had limitations. First, it examined only a single RNA tool in a single state. This may limit the generalizability of the findings. Second, we did not examine all possible operationalizations of recidivism; for example, we did not have measures created using the 36-month follow-up window that is used by some states. There thus could be other variations in measures that have implications for the consistency of risk prediction. Third, it is possible that this consistency varies between subgroups defined along demographic, jurisdictional, or other lines; although we did not test this possibility, such a finding would be consistent with the results of Pusch and Holtfreter’s (2018) meta-analysis. We thus repeat past scholars’ calls for more research on this topic, both to confirm our findings and to extend them.
In sum, this study offers a unique contribution to the empirical literature on the consequences of using varying operationalizations of juvenile recidivism. The study also highlights how different marker events are differentially predicted by risk assessment scores. In doing so, the study draws attention to the importance of incorporating information on multiple marker events when evaluating the predictive validity of RNA tools. Future research should continue to assess how measurement variability affects conclusions about other well-known correlates of juvenile reoffending. In the end, such assessments will get us one step closer to identifying the most appropriate uniform measurement system of juvenile recidivism.
Footnotes
Declaration of Conflicting Interests
The author(s) declared no potential conflicts of interest with respect to the research, authorship, and/or publication of this article.
Funding
The author(s) disclosed receipt of the following financial support for the research, authorship, and/or publication of this article: This project used data from the Florida Department of Juvenile Justice and was supported by Grant No. 2020-MU-MU-0039 awarded by the National Institute of Justice, Office of Justice Programs, U.S. Department of Justice. Points of view in this document are those of the authors and do not necessarily represent the official position or policies of the U.S. Department of Justice or the Florida Department of Juvenile Justice.