
Abstract
The evaluation of margins of restorations in clinical trials relies on the subjective assessment of evaluators, with no instrument having been developed, let alone validated, to assist in the process. The purpose of the present study was to assess the quality of evaluations of marginal adaptation by analyzing the distribution of marginal steps rated according to clinical criteria. Replicas of 435 restorations, the marginal qualities of which had been evaluated according to modified USPHS criteria, were randomly selected from the Occlusin TM multi-center clinical trial program. The marginal step height in the most deteriorated area of each restoration was measured by means of a digital step-height instrument. An overlap between the steps in the restorations with A (Alfa; replacement unnecessary) and B (Bravo; replacement questionable) ratings was found to be in the range of 101 μm to 321 μm. When the steps with a height greater or less than one standard deviation of the mean were excluded, the overlap was reduced to a range of 168 μm to 173 μm. This finding indicates a marginal height boundary between A and B ratings for marginal adaptation of 170 ± 3 μm.
INTRODUCTION
Marginal deterioration may be observed in posterior composites following variable periods of time in clinical service. Despite the countless studies on the clinical performance of posterior composites, the relationship between marginal deterioration and failure remains uncertain. If restorations with marginal deterioration are more likely to fail than restorations with ideal margin, accurate evaluations of the marginal qualities are important for identification of the risk of future failure and decisions made with respect to the application of refurbishment or repair procedures.
The USPHS criteria (Cvar and Ryge, 1971; Appendix, Fig. A1, www.dentalresearch.org) have been widely used for the clinical evaluation of restorations. These criteria involve visual inspection and the use of a dental explorer for the evaluation of the marginal quality of restorations, which are graded into one of four ratings: A (Alfa), replacement unnecessary; B (Bravo), replacement questionable; C (Charlie), replacement for preventive reasons; and D (Delta), immediate replacement. However, the methods of evaluation seem to be open to question, since the detection of marginal steps relies on the individual examiner’s visual acuity, manual sensitivity, and technique and experience, let alone the sharpness of the dental explorer, which remains to be standardized for the purpose of clinical trial methodologies.
The purpose of the ongoing series of studies, an element of which is reported in this paper, was to establish an objective and reliable method to evaluate the marginal adaptation of restorations. The initial investigation, as reported in this paper, was to undertake retrospective analyses to clarify the prognosis of posterior composites with marginal deterioration and to evaluate the quality of marginal evaluations by analyzing the distribution of marginal step height rated by clinical criteria. The hypothesis tested was that the marginal adaptation evaluation of posterior composites in clinical trials may be precise and distinguishable between the steps with different clinical ratings.
MATERIALS & METHODS
The longitudinal five-year clinical data and the epoxy replica models obtained in the Occlusin TM multi-center clinical trial program (Wilson and Norman, 1991) were analyzed.
Failure Rate
Five-year failure rates were calculated by means of the following equation:
All dropped restorations were excluded from the equation. The overall failure rate and the failure rates for the restorations observed to have had some or no marginal deterioration at one, two, three, four, and five years were calculated. The failure rates for the restorations with marginal deterioration were then compared with those with ideal margin. The overall failure rates were also compared with the failure rates for the restorations found to have had less than ideal marginal qualities. Differences in the failure rates for restorations with and without observed deterioration in the qualities of their margins were investigated by means of the chi-square test at a 95% level of confidence.
Marginal Step Measurement
A total of 435 epoxy replicas was investigated. These were comprised of 200 restorations, selected at random, which at one- to five-year recalls had been given A (Alfa) ratings for marginal adaptation, 200 randomly selected restorations with records of B (Bravo) ratings for marginal adaptation, and the 35 restorations in the program found to have had C (Charlie) ratings for marginal adaptation.
Step height in the most deteriorated area of each of the 435 restorations was measured under standardized conditions by means of a digital step-height instrument (University of Manchester Dental School, UK) with a stylus of less than 100 μm at the measuring tip and a calibrated vertical sensitivity of 1 μm.
For the determination of step height, the stylus was placed at the highest point of a step along the marginal edge. The tip of the stylus was then placed at the lowest point of the step. The difference in height between the points was recorded in microns as the step height for that margin (Appendix, Fig. A2, www.dentalresearch.org). Ten measurements were made for each step. The maximum and minimum values were excluded. The mean of the remaining eight values was taken to be the step height of the restoration.
Step heights for the restorations with different clinical ratings, obtained at different centers, were compared by means of Kruskal-Wallis and Scheffé’s F tests with a 95% level of confidence (StatView Macintosh v4.5, SAS Institute Inc., Cary, NC, USA).
The distributions of step heights overall and in relation to the restorations with individual clinical ratings were analyzed mathematically by use of curve analysis software (Table Curve™ 2D Windows v4.07, SPSS Inc., Chicago, IL, USA). This incorporated a non-linear regression routine that ranked curve-fit equations according to goodness-of-fit.
RESULTS
Failure Rate
A total of 1018 of 1242 Occlusin TM restorations was reviewed at five years. Ninety-three restorations were known to have failed at five years. The calculation revealed that the overall failure rate was 9.1%. Using the data on marginal adaptation, we calculated the failure rates for restorations with (Bravo rated) and without (Alfa rated) deterioration in marginal adaptation and then compared them as set out in the Table. The restorations with B ratings for marginal adaptation at three-year review were 5.0 times more likely to have failed five years after placement than restorations with A ratings for marginal adaptation. The restorations with deterioration in marginal adaptation were between 2.0 and 5.0 times more likely to have failed by five years than the restorations with ideal margin. There were significant differences in the failure rates for the restorations with and without deterioration in marginal adaptation at the two-, three-, and four-year reviews (chi-square test, p < 0.01). When the failure rates for the restorations with deterioration in marginal adaptation were compared with the failure rates for all the restorations placed, the restorations with deterioration in marginal adaptation were found to be between 0.7 and 2.0 times more likely to have failed, with the differences at the two-year review being statistically significant (chi-square test, p = 0.015).
Marginal Step Measurement
Details of the numbers of restorations examined from different Occlusin TM clinical trial program centers are summarized in the Appendix (Table A1, www.dentalresearch.org).
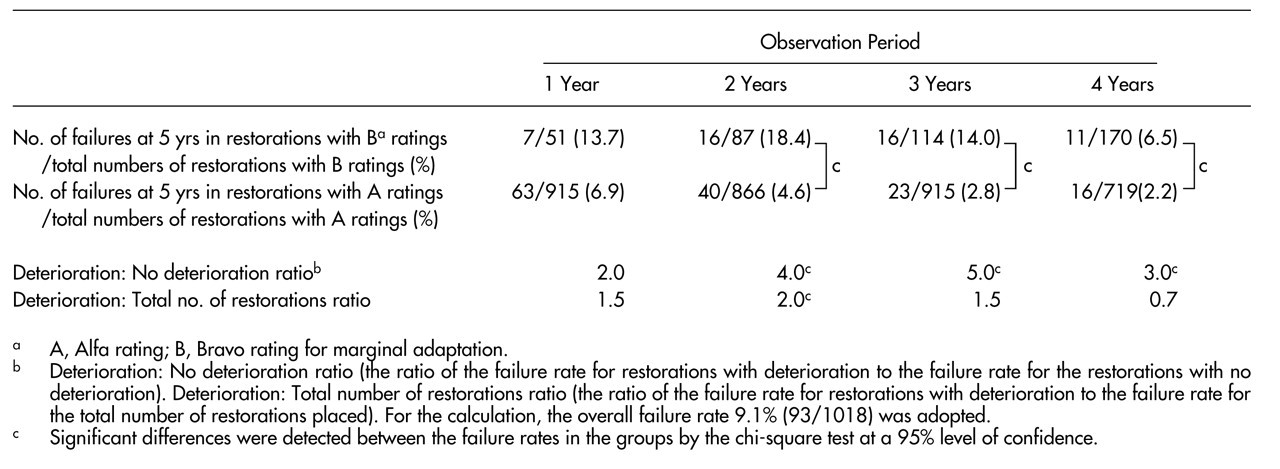
Marginal step heights overall were distributed over a range from 23 μm to 988 μm (Appendix, Table A2, www.dentalresearch.org). The distributions of step heights overall and in relation to the restorations with A and B ratings were represented by curves obtained by log-normal regression (Fig. 1). The regression equation was as follows:
where a, b, c, and d are adjustable parameters. Log-normal regression showed a high, typically greater than 0.98, coefficient of determinations (r2) for the steps in the restorations overall and in the restorations with A and B ratings. The distribution of the steps in the restorations with C ratings did not show a good fit to curves representing any non-linear regression equation with a high correlation coefficient.
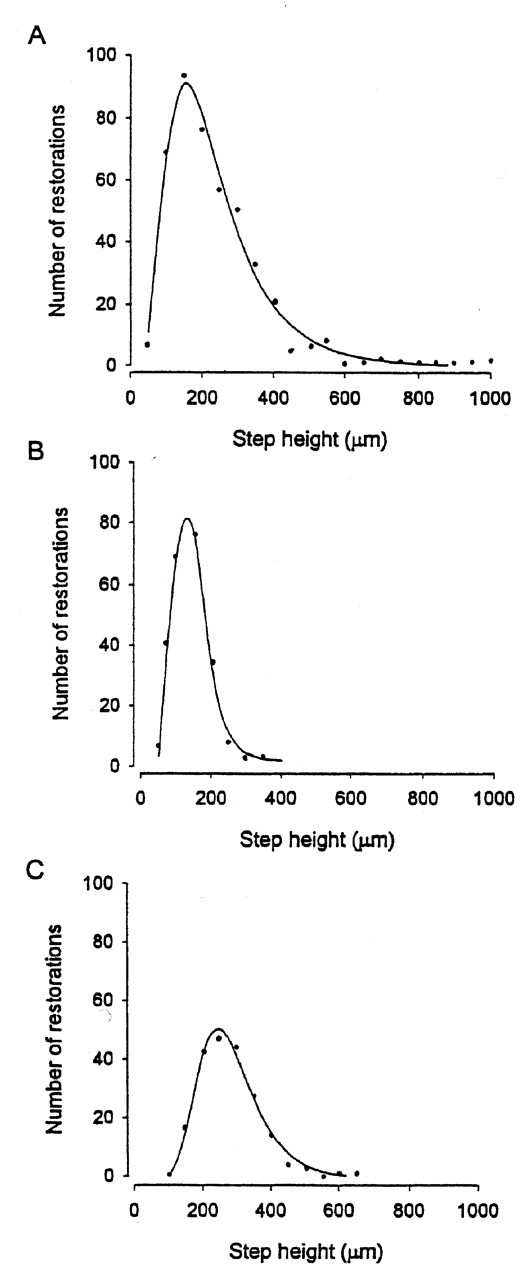
Mean marginal step heights were 122 μm for the restorations with A ratings, 253 μm for those with B, and 513 μm for those with C ratings. Significant differences were found to exist between steps with different clinical ratings (Scheffé’s F test, p < 0.0001) (Fig. 2).
An overlap between step heights in the restorations with A and B ratings was found in the range from 101 μm to 321 μm, in which 62% of the restorations with A ratings and 79.5% of the restorations with B ratings were included. When the steps with a height greater or less than one standard deviation of the mean were excluded, the overlap was reduced to a range of 5 μm between 168 μm and 173 μm (Fig. 3).
The consistency between centers in the measurement of margins with A and B ratings was generally excellent (Appendix, Fig. A3, www.dentalresearch.org). However, significant differences were found to exist in one of the 28 pair-wise comparisons between the steps in the restorations with A ratings obtained at different centers and in two of the 28 comparisons between those with B ratings (Scheffé’s F test, p < 0.05).
DISCUSSION
In the present study, the failure rates for restorations with marginal deterioration were generally higher than the overall failure rates and the failure rates for restorations with sound margins. The deterioration in marginal adaptation observed at two years could be considered to be a sensitive predictor of the failure of posterior composites, because the failure rate for restorations with deterioration was significantly higher than both the overall failure rate and the failure rate for restorations with sound margins. These results suggest that accurate evaluations of marginal qualities are important for identification of the risk of future failure.
In the present study, it was originally planned to measure up to 200 restorations with A ratings and 200 restorations with B ratings. We also hoped to obtain the same number of restorations from all the eight centers. However, only a limited number of restorations with B ratings were available from four centers, even though the replicas obtained at the one- to five-year reviews were available for selection. Therefore, the maximum number of restorations with B ratings available were obtained from those centers, and then a larger number of restorations from the other four centers were measured to attain the total number planned. This was the cause of unevenness in numbers of the restorations measured from the different centers.
The step heights measured in the overall set of restorations and in the several subsets of restorations with individual clinical ratings did not show normal distributions. Even after a logarithmic transformation had been performed, the distributions were far from normal. Hence, a non-linear regression analysis was performed by means of the Table Curve™ software. The distributions of step heights overall and in the restorations with A and B ratings were successfully represented by the curve obtained from log-normal regression with very high correlation coefficients (Fig. 1).
Only 35 restorations with C ratings were available for measurement and did not provide a sample sufficient for detailed analysis. Moreover, the distribution of the step heights in the restorations with C ratings did not show a good fit to curves represented by the non-linear regression. Therefore, the analysis of the data focused on the restorations with A and B ratings, which were the ratings given to most of the restorations examined.
The results in the present study show that the overlap for step height in the restorations with A and B ratings is substantial, with 62% of the restorations with A ratings and 79.5% of those with B being included in this range. It may be considered that the distinction between A and B ratings is insufficient when current evaluation methods are used. One of the reasons for this wide range of overlap may be an unacceptable lack of certainty in the evaluation methods. The USPHS criteria specify the use of visual inspection and a dental explorer for the evaluation of margins of restorations. However, the ability to detect marginal steps relies on the individual examiner’s visual acuity, manual sensitivity, technique and experience, and the sharpness of the dental explorer, which remains to be standardized for the purpose of clinical trial methodologies.
For many decades, dental explorers have been widely used for tactile examination in the diagnosis of pit and fissure caries (Chan, 1993). However, the use of explorers in such situations is no longer recommended, due to inaccuracies in the diagnosis of caries (Penning et al., 1992) and as a consequence of harmful effects to pits and enamel surfaces (Ekstrand et al., 1987). Although the use of an explorer has been replaced in the diagnosis of caries by a detailed visual examination (Dodds, 1993), an explorer is still considered to be useful in the assessment of marginal deterioration in restorations.
A significant correlation between the detection of steps and the sharpness of the tip of the dental explorer has been reported (Rappold et al., 1992). The results indicate that an explorer with a sharp tip could detect a small step with significant accuracy; however, the appropriate sharpness of the explorer remains to be established.
The current evaluation methods for marginal adaptation according to the USPHS criteria are clinically important and meaningful, even though it includes a wide overlap between ratings. This is because a restoration with a marginal step is more likely to fail than a restoration with an ideal margin, as confirmed in the present study. Standardization of the sharpness of the explorer to be used in assessments of marginal adaptation may be effective in minimizing the overlap between A and B ratings detected in the present study. This proposal was partly anticipated by Rappold et al. (1992).
For standardization of the sharpness of an explorer, a rational guideline for defining the delineation between steps with different clinical ratings is indispensable. The present study is an attempt to establish the step height which distinguishes A from B ratings. When the steps with a height greater or less than one standard deviation of the mean were excluded, the overlap was effectively reduced to 5 μm, in which only one restoration with A ratings and four with B ratings were included. This suggests that the range between 168 μm and 173 μm may be considered the borderline between marginal steps with A and B ratings.
Further investigation is needed to test the detection ability of standardized explorers by use of the models with steps rated as A and B. This could lead to the establishment of the reliable evaluation method for the marginal adaptation of restorations.
The importance of calibration of examiners is emphasized in the USPHS criteria (Char and Ryge, 1971). The evaluation of the restorations in the Occlusin TM multi-center clinical trial program was conducted according to the same protocol. The program’s principal investigator made three- to six-month visits to each of the centers throughout the program to ensure commonality of approach by the investigators. This effort was largely successful. The use of a standardized explorer, it is suggested, would have enhanced the inter- and intra-examiner agreement even further.
Based on the present analyses of the distribution of marginal step heights, it is concluded that a wide overlap was found to exist in the distribution of step heights in restorations with different clinical ratings. An Alfa/Bravo boundary of 170 ± 3 μm was apparent. The current evaluation method of the marginal quality of restorations should be improved to make a clear distinction between clinical ratings.
The distributions of marginal step heights. The distributions of step heights
were represented by curves obtained by log-normal regression. The regression
equation was as follows: y = a + b exp (−0.5(ln (x/c)/d)2), where a,
b, c, and d are adjustable parameters.
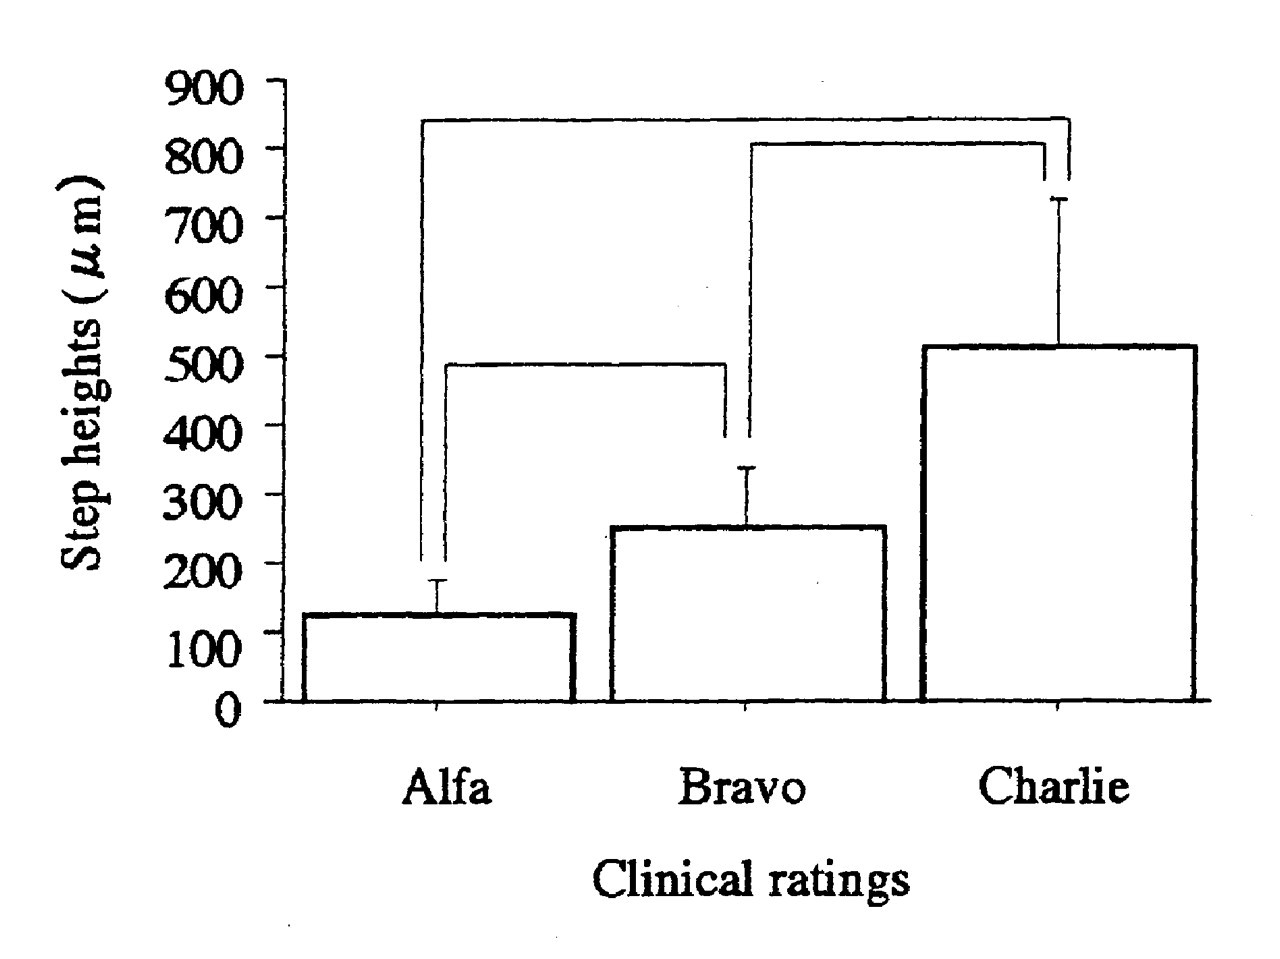
Comparisons between step heights in the restorations with different clinical ratings. Mean marginal step heights and standard deviations were 122 ± 51 μm for the restorations with Alfa ratings (N = 200), 253 ± 85 μm for those with Bravo (N = 200), and 513 ± 211 μm for those with Charlie ratings (N = 35). Significant differences were found to exist between the groups connected by lines (Scheffé’s F test, p < 0.001).
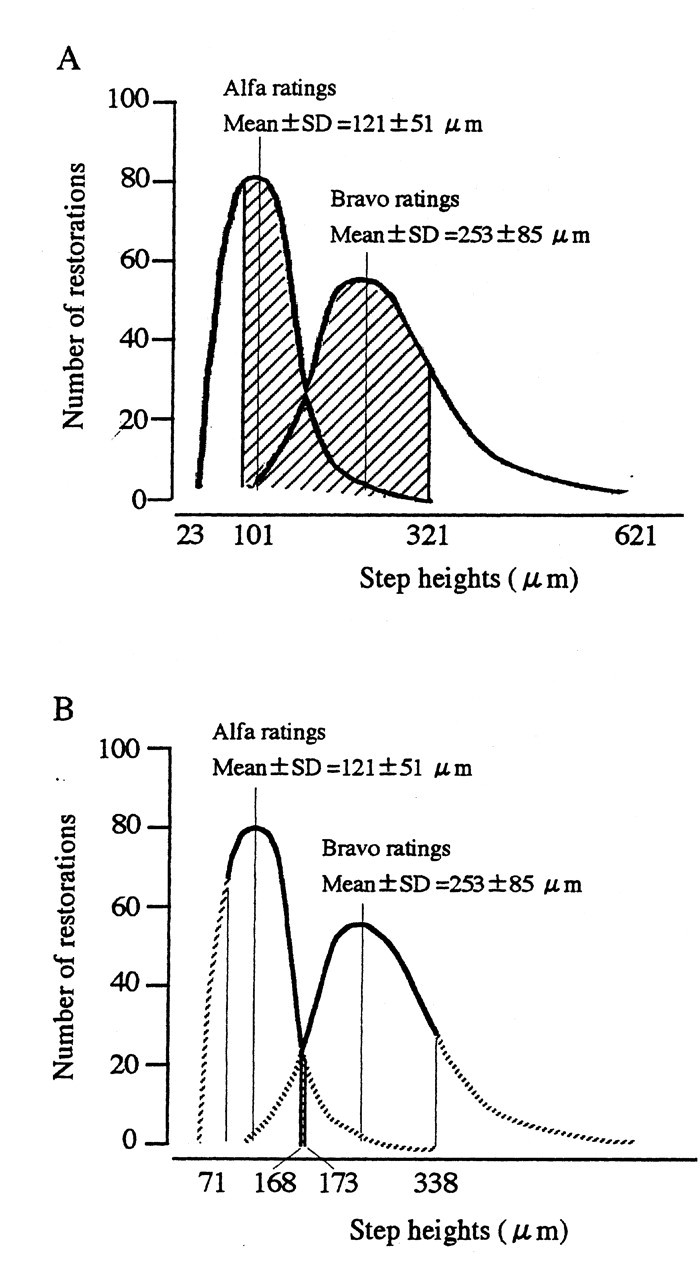
The overlap between step heights in the restorations with Alfa and Bravo
ratings. These Figs. show the superimposition of the distributions of step
heights in the restorations with Alfa and Bravo ratings.
Footnotes
References
Supplementary Material
Please find the following supplemental material available below.
For Open Access articles published under a Creative Commons License, all supplemental material carries the same license as the article it is associated with.
For non-Open Access articles published, all supplemental material carries a non-exclusive license, and permission requests for re-use of supplemental material or any part of supplemental material shall be sent directly to the copyright owner as specified in the copyright notice associated with the article.