
Abstract
We have evaluated the performance of pulse volume recording waveform averaging and the resulting transfer function index (TFI). The purpose of this study was to develop and validate diagnostic criteria for the use of TFI as a tool for the evaluation of patients with peripheral arterial obstructive disease (PAOD). The study prospectively evaluated 146 limbs for PAOD using previously validated criteria for conventional indirect testing and duplex ultrasound imaging and then correlated TFI measurements at multiple levels of each extremity. Of the 146 limbs evaluated, 61 were classified as having no hemodynamically significant disease, 46 as having mild to moderate disease, and the remaining 39 categorized as severely diseased. The mean value of the TFI for each category was 1.05 (±0.15) for limbs categorized as normal, 0.86 (±0.07) for limbs categorized as mild to moderate, and 0.76 (±0.06) for limbs categorized as severe (p < 0.001). The receiver operator characteristic curve showed that the best cutoff to differentiate between normal and abnormal limbs was a TFI of 0.94, with a sensitivity of 92% and a specificity of 90%. We conclude that the TFI could effectively be used for rapid and objective evaluation of patients for the presence of PAOD.
Introduction
Conventional means for evaluation of the presence of peripheral arterial obstructive disease (PAOD), in addition to segmental systolic pressures, include more subjective Doppler waveform analysis, pulse volume recording waveform analysis, and increasingly duplex ultrasound imaging.1,2 Though these methods remain a vital part of the assessment of patients with significant PAOD in determining appropriate course of treatment, they are operator dependent and may be time consuming. A skilled technologist is required, and the interpretation is subjective, making accuracy and reliability dependent on the skills of the interpreting physician. We have evaluated pulse volume recording waveform averaging, obtained simultaneously from multiple sites, to calculate the transfer function index (TFI) as an objective measure providing accurate and efficient assessment for the presence of PAOD and determination of the necessity for further evaluation.3,4
Methods
Patients presenting to William Beaumont Hospital Vascular Services Center with known or suspected PAOD had conventional noninvasive testing that included continuous wave (CW) spectral Doppler waveforms, pulse volume recording (PVR) waveforms, and segmental systolic blood pressures including ankle brachial indices (ABI) or toe brachial indices (TBI) as appropriate.5–7 Data was obtained using a microcomputer-based multicuff diagnostic unit (VasoGuard, Nicolet Vascular Inc., Madison, WI). Spectral Doppler waveforms were obtained routinely from the common femoral, popliteal, posterior tibial, and dorsalis pedis arteries bilaterally using either CW Doppler or Duplex ultrasound. PVR waveforms were acquired simultaneously and averaged from both arms and from either six or eight lower extremity sites. Further evaluation with duplex ultrasound imaging and spectral Doppler waveform analysis (Logiq 700, GE Medical Systems, Milwaukee, WI; Image Point HX, Philips Medical Systems, Bothell, WA) was performed to assess for hemodynamically significant obstructive stenosis or occlusion in specific vessel segments.8–10
The TFI is calculated using the PVR waveforms, which were obtained simultaneously from the upper and lower extremities. These sequential waveforms are first averaged (Figure 1). A mathematical analysis is performed on each averaged PVR waveform using a 128-point Fast Fourier Transformation (FFT) to produce a discrete spectrum for each waveform, known as a frequency response curve and displayed as a graph. For each vascular segment of interest, the proximal (inflow) frequency response curve (FTp) is compared with the outflow (distal) frequency response curve (FTd) by simple division to determine the transfer function (TF = FTd/ FTp). An outflow curve that is identical to the inflow curve is represented as a straight line and is equal to 1, a transfer function displaying a descending line is less than 1. and, inversely, a transfer function displaying an ascending line is greater than 1 (Figure 2). A resulting quantitative index of the transfer function (TFI) is produced by calculating the area under the transfer function curve and theoretically correlates with the relative patency of the intervening segments.3–4
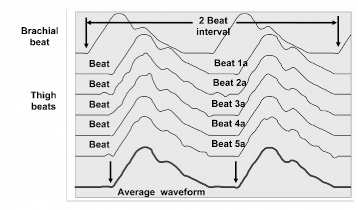
The graph above shows how beats are averaged; averaging is performed using a two-beat interval to allow for transit time differences between the segments. These waveform segments are compiled to create a single averaged waveform of all beats analyzed, then compared with an averaged brachial waveform to generate transit time and pulsatility index calculations.
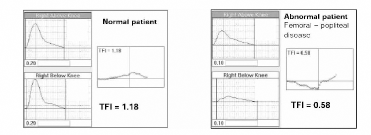
The figure above demonstrates how the relative pulsatility from adjacent waveforms is correlated to produce a frequency response curve and a transfer function index for each corresponding segment quantifying the relationship between proximal and distal PVR waveforms.
Using previously validated criteria, limbs were prospectively placed into three disease categories based on conventional indirect testing (waveform analysis and segmental systolic pressures), duplex ultrasound findings, and angiographic results when available.
Extremities were categorized as normal in the absence of a hemodynamically significant obstructive lesion identified on angiogram or duplex ultrasound and an ABI ≥ 0.94 or TBI ≥ 0.70.
Extremities were categorized as mildly to moderately diseased in the presence of a hemodynamically significant obstructive lesion visualized on angiogram or duplex ultrasound (PSV ≥ 175 cm/sec and/or PSV ratio ≥ 3.0) and an ABI between 0.50 and 0.93 or TBI ≤ 0.69.
Extremities were categorized as severely diseased in the presence of an occlusion or multiple sites with hemodynamically significant obstructive lesions seen by angiogram or duplex ultrasound (PSV ≥ 175 cm/sec and/or PSV ratio ≥ 3.0 at multiple sites) and an ABI < 0.50.
TFI and severity of disease data were correlated using receiver operator characteristic curve analysis based on the sensitivity and specificity of the TFI. 11
Results
Between January 2001 and January 2002, 146 limbs were evaluated. Sixty-one limbs were classified as normal (category I), 46 limbs as having mild disease (category II), and 39 as having severe disease (category III) (Figure 3).
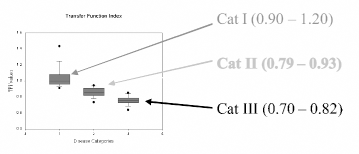
The box and whiskers charts above show the range of TFI values for each disease category. Very little overlap is demonstrated for individual categories indicating distinct differentiation between categories.
The mean value of the TFI was 1.05 (±0.15) for limbs in category I (Figure 4), 0.86 (±0.07) for limbs in category II (Figure 5), and 0.76 (±0.06) for limbs in category III (Figure 6) (p < 0.001). The receiver operator characteristic (ROC) curve indicated that the best cutoff to differentiate between normal and abnormal arterial segments to be a TFI of 0.94, with a sensitivity of 92% and a specificity of 90% (Figure 7). Further statistical analysis revealed any TFI value below 0.90 to be a true positive with a specificity of 100%; however, sensitivity dropped to 79%. A TFI of 0.91 yielded a sensitivity of 97%, specificity of 84%; 0.92 a sensitivity of 93%, specificity of 87%; 0.95 a sensitivity of 98%, specificity of 84%; and finally, 0.96 a sensitivity of 100% with a specificity of only 70%.
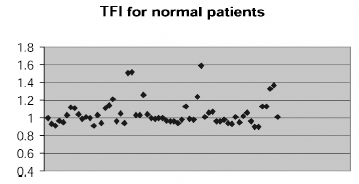
The above scatter chart displays TFI values for patients placed in category I indicating conventional physiologic testing and duplex imaging results were found to be normal.
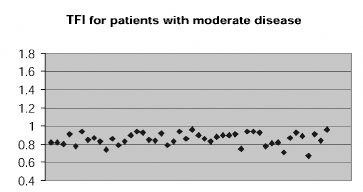
The above scatter chart displays TFI values for patients placed in category II indicating conventional physiologic testing and duplex imaging results demonstrated mild to moderate lower extremity arterial disease.
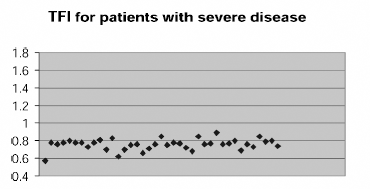
The above scatter chart displays TFI values for patients placed in category III indicating conventional physiologic testing and duplex imaging results demonstrated the presence of severe lower extremity arterial disease.
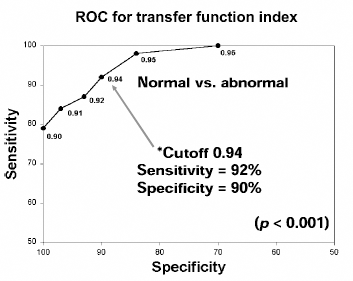
As illustrated above, the ROC curve indicates that a TFI of 0.94 represents the ideal cutoff for the differentiation of normal versus abnormal flow within any given arterial segment. Furthermore, a TFI value of <0.90 was indicative of a true positive with 100% specificity.
Limbs were also divided into subcategories determined by level of disease. Of the limbs previously placed in category II, 21 were identified as having inflow disease, 18 as having femoral-popliteal disease, and 9 with infra-popliteal disease. Two of the 46 limbs had multisegment disease. Inflow disease was identified in 15 limbs in category III; 21 were identified as having femoral-popliteal disease and 9 as having infra-popliteal disease; 6 limbs in category III had multisegment disease.
Discussion
Transfer function is a quantitative method for assessing the relationship between proximal/inflow and distal/outflow pulse volume recordings. A similar technology, noninvasive impedance analysis, has been studied since the 1990s and has shown effectiveness in graft surveillance; however, its use has been somewhat limited. This employs both Doppler and PVR waveforms taken simultaneously from the inflow and outflow segment simultaneously and compared over 20 cardiac cycles. 4 TFI has proven useful as well for infrainguinal vein graft surveillance, 3 and on a broader horizon promises to offer an objective means of lower extremity evaluation for PAOD. In cases of inconsistencies between TFI and conventional physiologic testing, TFI correlated better with duplex and angiography, indicating it to be a more sensitive tool for determining the presence of PAOD. It is proposed that TFI performed in concert with ABI/TBI could be used to evaluate patients rapidly for the presence of PAOD with equal efficacy as conventional physiologic testing of the lower extremities. Upon findings indicative of significant disease, such as TFI below 0.90 and reduced ABI, then duplex ultrasound or angiography could be used to confirm these findings and determine the appropriate course of treatment.
By including arm and ankle pressures as well as PVR waveforms from at least one lower extremity site to perform PVR waveform averaging and TFI, it complies with Medicare guidelines for a limited extremity arterial evaluation. PVR waveform averaging and TFI alone without any further information documented would then be considered a screening exam and not qualify for reimbursement under Medicare.
The generally accepted time spent in the performance of a conventional lower extremity physiologic study is approximately 1 hr, considering room cleanup, preliminary report preparation, and miscellaneous other tasks added to the normal vascular study. A generous approximation of the time needed to perform TFI and obtain ABI/TBI including wrapping cuffs on the patient would be 10 minutes. Adding in the miscellaneous extras mentioned previously, patient turnaround using this method could easily be doubled without compromising quality of care. The referring physician would then have the necessary information to determine if the patient should continue on for further evaluation (duplex ultrasound or angiography). This time savings would allow the technologists to focus on specific areas of disease with duplex ultrasound. Patients determined to have normal lower extremity exams or of minimal disease not warranting further evaluation would not have to endure a full exam and could be rescheduled for routine follow-up if necessary.
Changes in reimbursement necessitate increased cost effectiveness for diagnostic procedures. Medical professionals in many circumstances have been encouraged to diversify their skills and cross-train into new specialties. These changes have all been sought with the expectations that the quality of medical care and accuracy of diagnostic procedures not be compromised. TFI has proven to provide us with a means to reduce time per study thereby improving cost effectiveness for evaluating patients for the presence of PAOD. Its sensitivity to the presence and severity of peripheral arterial obstructive disease indicates it to be a useful tool in the evaluation of PAOD and to be a rapid test that is readily reproducible and minimally operator-dependent in comparison to continuous wave Doppler interrogation.