
Abstract
Introduction
The evaluation of abdominal vascular structures has become an increasingly important part of the testing services offered by the vascular laboratory. Improved transducer and signal processing technology have allowed greater access and accuracy in the performance of advanced techniques using duplex ultrasound to interrogate renal and mesenteric arterial systems. In addition to the acquisition of high-quality equipment for a laboratory to provide this service, it is imperative that the involved technologists and physicians acquire the skills and experience necessary to produce high quality results.
Background
Flow-reducing lesions in the renal arteries, identified as meeting criteria for ≥60% diameter reduction, may stimulate the renin–angiotensin system, which results in significant elevation of blood pressure. As diameter reduction increases to greater than 80%, kidney mass may be reduced and renal function impaired with concomitant increase in BUN and creatinine levels. These lesions most frequently are atherosclerotic in nature and found at the renal artery ostium or proximal third of the vessel. This disease process is the source of renal artery stenosis (RAS) in approximately 90% of patients with renovascular hypertension. Branch stenoses also may be present and, although they are more challenging to identify, are amenable to repair with angioplasty. Detection of these lesions requires the sonographer to use multiple approaches to the renal vasculature along with optimization of color Doppler settings and careful sample volume placement throughout their interrogation. As is true for the atherosclerotic process in general, risk factors include hypertension, smoking, diabetes, and hyperlipidemia. The incidence of bilateral disease approaches 50% with unilateral lesions affecting right or left renal arteries with equal frequency.
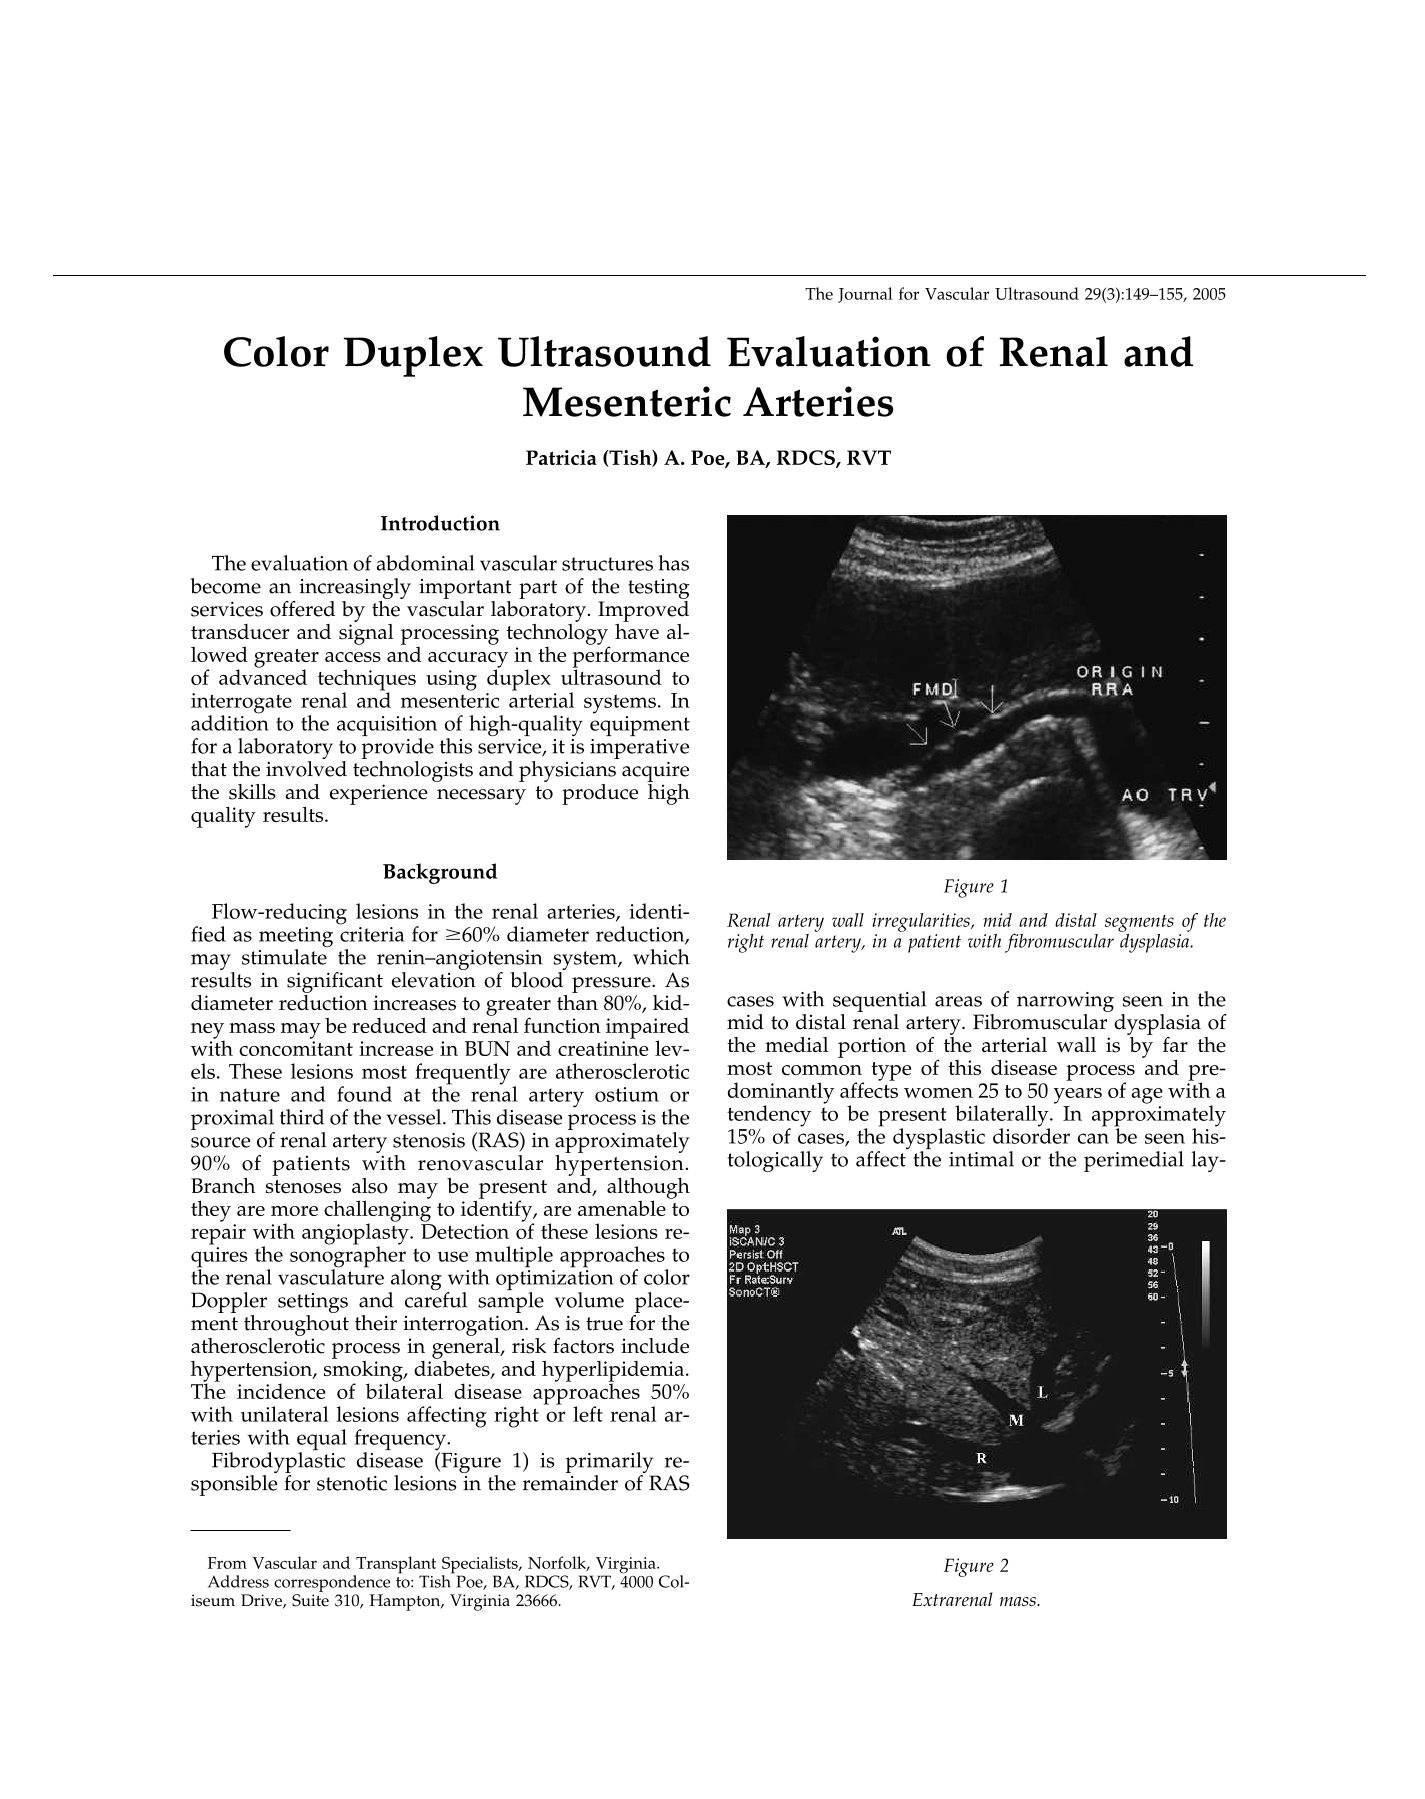
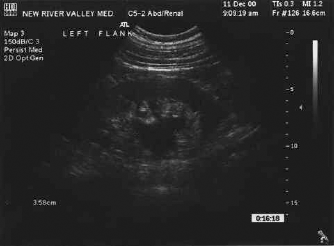
Fibrodyplastic disease (Figure 1) is primarily responsible for stenotic lesions in the remainder of RAS cases with sequential areas of narrowing seen in the mid to distal renal artery. Fibromuscular dysplasia of the medial portion of the arterial wall is by far the most common type of this disease process and predominantly affects women 25 to 50 years of age with a tendency to be present bilaterally. In approximately 15% of cases, the dysplastic disorder can be seen histologically to affect the intimal or the perimedial layers of the arterial wall. The characteristic distribution of fibromuscular dysplasia into the distal and segmental renal arteries creates flow disturbances appreciated in both color and spectral Doppler velocity waveform analysis and points to these lesions as being most likely non-atherosclerotic in nature.
Renal artery wall irregularities, mid and distal segments of the right renal artery, in a patient with fibromuscular dysplasia.
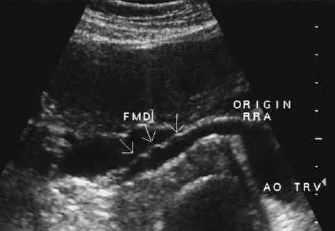
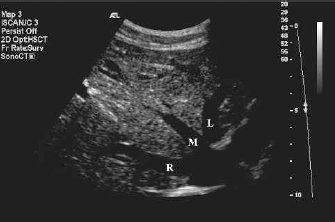
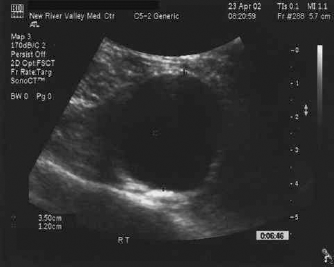
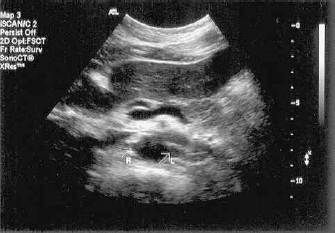
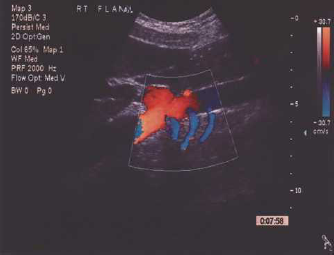
In addition to stenotic lesions, other abnormalities may affect the renovascular system, including aneurysmal dilatation of the renal arteries, arteriovenous malformation, arterial dissection, Takayasu's disease, trauma, and embolic events. During the evaluation of the kidney structure, the sonographer may also encounter renal or perirenal masses (Figure 2), hypotrophic to atrophic kidneys, cystic structures (Figure 3) or hydronephosis (Figure 4).
Extrarenal mass.
Large renal cyst.
Hydronephrosis.
Duplex evaluation is the imaging avenue of choice when chronic mesenteric ischemia is suspected and includes interrogation of the abdominal aorta and the three major avenues into the mesenteric circulation: the celiac artery, the superior mesenteric artery (SMA), and the inferior mesenteric artery (IMA). Patients with chronic mesenteric ischemia classically present with abdominal pain that occurs 15 to 30 minutes after eating and persists for 1–3 hr. These patients develop fear of food, experience weight loss, and may experience diarrhea or constipation. Although atherosclerotic lesions are common in the mesenteric system, the potential for an extensive collateral network in the abdomen that compensates for loss of flow from one vessel usually prevents patients from becoming symptomatic unless two or all three of the arteries are significantly diseased. Often a history of other vascular disease exists, and women are affected more often than men.
Acute mesenteric ischemia produces severe abdominal pain that is sudden and disproportionate to the physical exam. Embolic events or thrombosis at the site of chronic atherosclerotic lesions are the most common causes of this life-threatening situation. Duplex testing plays a limited role with arteriography or emergency surgery being the primary interventional routes.
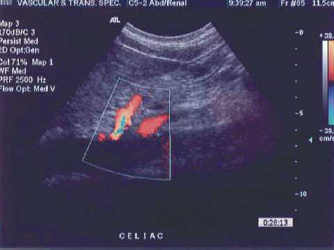
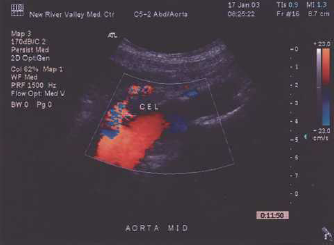
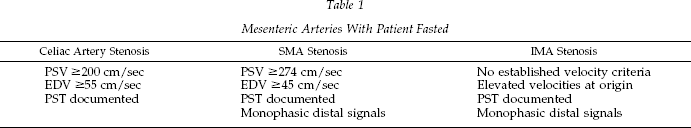
The appearance of stenosis in the celiac artery may be produced by compression of this vessel by the median arcuate ligament rather than by atherosclerotic disease. This is easily ascertained by re-examining the celiac artery with the patient in a sitting position or while the patient holds his or her breath after inhaling deeply. These maneuvers alleviate the compression syndrome, allowing velocity signals to normalize (Figures 5 and 6). This possibly should be considered, particularly, if celiac stenosis is the only lesion suspected on examination. If a mesenteric vessel is functioning as collateral pathway, the characteristic flow patterns normally seen in the vessels will change (Figure 7).
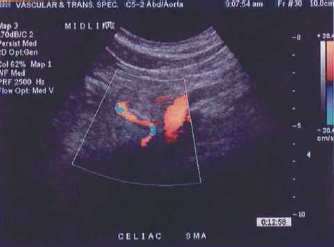
Celiac artery compressed by the arcuate ligament with the patient in supine position.
Celiac artery compression relieved when examination is repeated with patient sitting upright.
Elevated celiac artery flow in presence of mid-aortic occlusion.
Examination Technique
Patients should be scheduled for morning appointments and asked to fast after midnight before examination. The patient may be allowed to drink as much water as he or she pleases. The patient also should limit gas-producing food on the day before testing to minimize overlying air that interferes with sonographic access to the abdominal vascular structures. Smoking, chewing tobacco, or gum also introduces air and should be avoided by the patient. Renal artery evaluations may be attempted if the patient is not fasted, but mesenteric examinations require a fasted state to be performed (Table 1).
Mesenteric Arteries With Patient Fasted
The patient initially is placed in a supine position with the head of the stretcher slightly elevated. Mesenteric studies most often are completed from midline approaches; however, views of the aorta, celiac, SMA, or IMA may be obtained from more lateral approaches (with or without moving the patient to a left or right lateral decubitus position) if the midline attempts are nonproductive.
Routinely, multiple approaches are used to fully evaluate all segments of the renal arteries and will include midline, flank and posterior views that require the patient to be repositioned from supine to lateral decubitus or even prone positions. By incorporating a variety of “windows” into every renal examination, there is less likelihood of missing a segment that may be tortuous or obscured from view in a given plane of sight. Accessory renal arteries and branches can be missed on even the most diligent examination but will certainly be overlooked if efforts are not made to use all available scan planes to view their possible separate origins from the aorta or from a main renal trunk.
Sufficient scan time must be allowed for the technologist/sonographer to produce excellent results. Evaluation of the mesenteric vessels alone is more easily accomplished than is the case for renal artery interrogation. The schedule should allow 60–90 min for a renal duplex scan and its associated patient history and examination worksheet. In addition, there must be an opportunity to perform the test often to obtain the needed experience and confidence for each sonographer/technologist assigned to this type of work within the vascular laboratory.
Ongoing efforts must be made to correlate duplex findings with other imaging modalities and patient outcomes as part of the laboratory's quality assurance program. The standard for ICAVL Visceral Vascular accreditation is for correlation to be reported for 20 vessels.
It should be recognized that high-resolution duplex technology is required for this challenging type of examination. Both curved linear and phased array transducers will need to be available to accommodate varying depths introduced by various scan approaches and presenting body habitus. Importantly, note that the Doppler transmit frequency varies with each transducer selection. Lower Doppler transmit frequencies are needed to access greater depths and also to increase the Nyquist limit to accurately display high velocity signals from diseased vessels. A given transducer selection may permit the organ of interest to be displayed in gray scale without permitting adequate Doppler insonation depth.
Color Doppler is a very important adjunct to the successful completion of abdominal vascular testing. When appropriate color Doppler settings are used, the examination is much more likely to reveal the presence of multiple renal arteries, segmental areas of stenosis in vessels outside or within the renal tissue. The controllable color parameters to consider when optimizing the display during each portion of the examination include:
Wall filter
Gain
Transmit frequency
Pulse repetition frequency (PRF)
Size and angulation of the color box
Examination Protocol
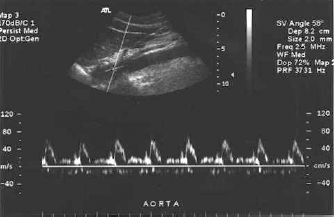
The aorta is examined in sagittal and transverse planes from the level of the xiphoid process to the bifurcation of the common iliac arteries. Note any evidence of aneurysmal dilatation or stenosis. As the aorta is scanned, the color box size and position should allow for identification of multiple renal artery origins that may arise from any segment of the abdominal aorta. Occasionally, a renal artery will begin from an iliac vessel. Record the aortic velocity just below the level of the SMA using a sagittal view, appropriate angle correction of 60 degrees or less to the vessel wall and sample volume placed mid-stream. This value will be used as the denominator for calculation of the renal-to-aortic ratio (RAR). Velocities in the aorta, for adults, are typically 60–100 cm/sec. Higher velocities are found in children and in high flow states, including stenotic areas. Lower velocities are encountered in patients with low cardiac output or aneurysmal disease. Caution should be used in employing RAR diagnostic criteria if abnormal aortic velocities are present. The suprarenal aortic signal normally displays diastolic flow above the baseline, reflecting low resistance pattern of the renal arterial bed it feeds (Figure 8). Infrarenal aortic signals are typically biphasic to triphasic, reflecting the distal peripheral arterial hemodynamics (Figure 9).
Normal Doppler velocity waveforms from the suprarenal aorta.
Normal Doppler velocity waveforms from the infrarenal aorta.
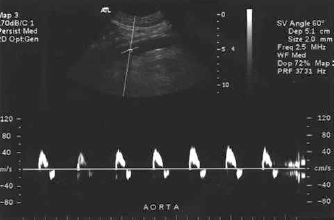
The celiac artery is the first abdominal branch from the aorta. This vessel is typically 2–3 cm in length, may be tortuous and gives rise to the splenic, hepatic and left gastric branches. Velocity waveform pattern displays low resistance characteristics with forward flow throughout diastole (Figure 10). As is true for all vessels with diameters that are relatively small in comparison with the smallest sample volume size that can be set, spectral broadening is expected because the full wall-to-wall range of flow velocities across the vessel are included in the display.
Normal celiac artery Doppler velocity waveforms.
The SMA originates 1–2 cm distal to the celiac artery. The take-off is often at a sharp angle and care must be taken to use appropriate angle correction. The SMA parallels the aorta as it courses distally. In the fasted patient the waveform pattern is high resistance with flow reversal noted in early diastole (Figure 11). Note that the SMA can arise from the celiac axis in some patients. If this is the case, the initial celiac signal will reflect both the higher and lower resistance characteristics of the multiple end-point vascular beds and the more classic waveform patterns will be seen distal to the branch point of the mesenteric artery.
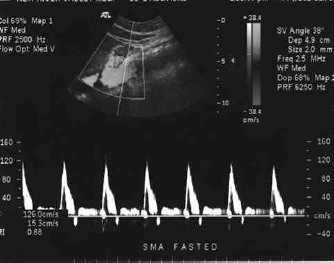
Normal superior mesenteric artery Doppler velocity waveforms.
The IMA originates from the anterior aspect of the distal abdominal aortic wall. To identify this vessel, use a transverse scan plane at the level of the iliac bifurcation and move cephalad. The IMA typically curves to the left and then courses inferiorly (Figure 12). The waveform pattern will normally be high resistance in nature. Failure to identify this vessel does not imply occlusion with any degree of confidence as it is normally a small vessel that is frequently masked by overlying structures or air. With practice, the vessel becomes more easily identified. The IMA may be seen as an enlarged collateral pathway in the presence of more proximal significant mesenteric disease.
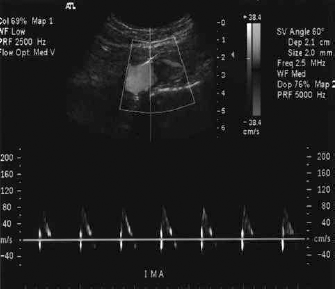
Normal inferior mesenteric artery Doppler velocity waveform.
Renal arteries are identified from midline with the aorta in a transverse view. Using the landmark of the left renal vein as it normally courses anterior to the aorta, the left and right renal arteries arise from the posterolateral aspects of the aorta (Figure 13). Note that the left renal vein may rarely appear in the retroaortic position and will be displayed inferior to the aorta. Again, diligence is required to appreciate the potential presence of multiple renal arteries (Figure 14). All vessels must be interrogated along their entire length to evaluate for disease that can occur in any segment. Begin with the sample volume placed in the aorta and sweep it through into the proximal segment of each renal artery. Multiple approaches should be undertaken to be able to sample all segments of the arteries. Appropriate angle correction must be used to obtain accurate velocity readings (Table 2). Velocity at the proximal renal artery, or the highest velocity obtained in a stenotic segment, is used to calculate RAR. Hilar and parenchymal (interlobar and arcuate) signals are obtained using 0°. Elevated intrarenal artery velocities may be detected as a result of stenosis in the branch vessels. Color Doppler is very useful to point to these lesions. Spectral Doppler is used to document peak systolic velocity (PSV), end-diastolic velocity (EDV), and any areas of poststenotic turbulence (PST).
Typical Peak Systolic Velocities From the Renal Arteries
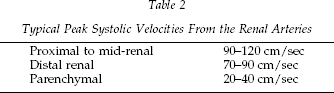
Right and left renal arteries from midline approach, aorta transverse.
Multiple renal arteries.
The right renal artery (RRA) originates from the anterolateral aspect of the aorta at approximately a 10- or 11-o'clock position. From a midline, transverse scan orientation it frequently is seen arching superiorly and then curves under the inferior vena cava as the RRA courses distally. Using flank approaches, the RRA may be identified with the aorta in sagittal or transverse orientation and transducer placed in subcostal or intercostal positions. The orientation of the kidney, overlying structures and body habitus will dictate how many views are possible for each patient.
The left renal artery (LRA) typically originates from the posterolateral aspect of the aorta at approximately 3- to 5-o'clock position. A midline, transverse orientation will often display the vessel coursing posteriorly. This vessel also may have a tortuous take-off or sections. As described for the RRA, flank views are used as well to interrogate all sections of the LRA vessel(s).
Hilar and parenchymal vessels are sampled from multiple sites with attention to any differences in waveform morphology that can indicate a “missed” stenotic vessel or segment. Waveforms are evaluated for systolic rise time (SRT) either qualitatively or quantitatively. If this value is calculated, an SRT of >10 ms (>0.10 sec) is considered abnormal. Note that even in the presence of significant renal artery stenosis (≥60% diameter reduction) SRT may remain normal if there is concomitant medical renal disease. Evaluation of distal renal or hilar waveforms alone is not sufficient to rule in or rule out RAS. SRT is calculated by identifying the time from end diastole to the initial peak of a waveform (Figures 15 and 16).
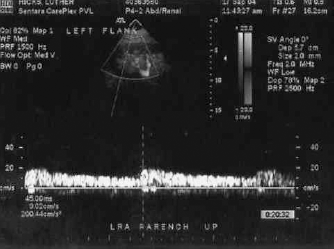
Normal SRT.
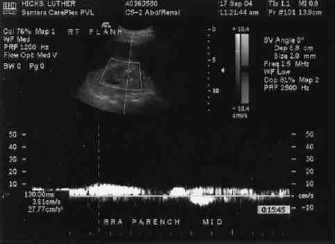
Abnormal SRT.
Resistive index (RI) or diastolic to systolic ratio (DSR) may be calculated using PSV and EDV values. Please note that RI and DSR calculations are simply the inverse of each other. Peak systolic and end-diastolic velocities are used in the ratios.
Example: PSV = 120 EDV = 20
RI 120 - 20 / 120 = 0.83
DSR 20 / 120 = 0.17
Medical renal disease may be indicated by decreased diastolic flow velocities: Normal RI < 0.70; borderline RI 0.70 to 0.80; abnormal RI > 0.80. Normal DSR > 0.30; borderline DSR 0.20 to 0.30; abnormal DSR < 0.2
SRT and RI (or DSR) values should not show significant differences when taken from different branches or poles within the kidneys in the absence of RAS. The sample volume size may be increased and the sweep speed increased to obtain and display the waveforms more clearly for analysis.
Kidney pole-to-pole length is measured from the best sagittal view of the kidney and normally is >9 cm.
Renal vein signals may be described as spontaneous, continuous, pulsatile or absent.
Classification of RAS is summarized in Table 3.
Renal Artery Classification (Stenosis Defined as Diameter Reduction)
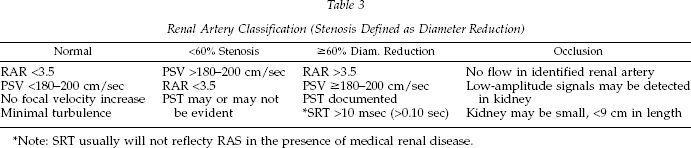
Note: SRT usually will not reflecty RAS in the presence of medical renal disease.
General Guidelines for Spectral Doppler
Small sample volume (SV) size for arterial interrogation
Spectral broadening expected in vessels that are small relative to SV size
Appropriate angle correction is crucial to obtaining accurate velocities
Pre, peak, and post-lesion signals required when documenting an area of stenosis
Poststenotic turbulence (PST) must be documented along with elevated PSV
Tortuosity can produce elevated velocities and turbulence
Resistance patterns reflect the vascular bed distal to the sample site
Decreased angle correction values decreases velocity estimation; increased angle correction values increase velocity estimation
Never use angles >60° for velocity measurements
Postintervention Guidelines
Renal or visceral artery stenosis may be treated by means of percutaneous transluminal angioplasty, without stent or with stent placement; more rarely the patient may present after arterial bypass or endarterectomy of these vessels. The same diagnostic criteria as listed for untreated vessels are used for postintervention follow-up examinations. Establishment of differential criteria for stented vessels remains under investigation. It is most helpful to know the immediate post-procedure results of the percutaneous transluminal angioplasty or stent treatment when the patient is referred for follow-up evaluation in the vascular laboratory. The best result obtainable at the time of intervention may be associated with a known degree of residual stenosis.
After angioplasty
Obtain procedure report, if possible
Lesions identified on duplex examination may represent residual disease versus re-stenosis
Note changes in aortic condition/velocities
Changes in vessel angulation may occur after the procedure
Overall effect of stents on PSV still under investigation
After bypass
Obtain operative report if possible
Material used may be prosthetic or saphenous vein
Position of the renal artery will be altered with inflow vessel being aorta, iliac, splenic, mesenteric or hepatic
Anastomotic areas the most common sites for stenosis
After endarterectomy
Procedure used for atherosclerotic ostial lesions
Most often done in concordance with aortic reconstruction
Conclusion
Renal and mesenteric artery duplex examinations are challenging, interesting and are of utmost importance to our patients and our referring physicians. Vascular laboratory sites that successfully offer this type of testing exist in both small and large treatment centers. The requirements for sufficient time allotted in the laboratory daily schedule and the educational support for the technologists and physicians providing this service are well worth the investment in both hospital-based and private office settings.