
Abstract
Objectives
Current imaging techniques have limited ability to quantify thrombus burden in patients with acute deep vein thrombosis (DVT). There is limited ability to objectively measure clot progression or clot resolution over time and with treatment. These critical measures are important determinants of optimal treatment and therapeutic success for thrombolysis or thrombectomy treatment of DVT. In this study, we evaluated the feasibility and reliability of a method of quantifying thrombus volume using freehand three-dimensional (3D) ultrasonography and compared it to a commercially available four-dimensional (4D) transducer for acquiring and analyzing 3D ultrasound images to measure thrombus volume.
Methods
We studied 10 consecutive patients with a first episode of acute DVT to compare the performance of freehand 3D with 4D transducer imaging (group 1). In addition, we studied five patients with thrombus length >3.8 cm to evaluate the performance of freehand 3D imaging in larger clots (group 2). Scanning was performed with routine grayscale, color-flow, and power-Doppler imaging; followed by freehand 3D and 4D transducer volumetric imaging. Postprocessing was performed using the Stradwin software to measure thrombus volume after each scan.
Results
The age of patients was 54 ± 13 years (mean ± SD), 73.3% of DVTs were in the upper extremity, and 60% of the patients received anticoagulation. The mean thrombus volume in group 1 measured by freehand 3D and 4D probes was 0.49 ± 0.40 cm3 and 0.52 ± 0.46 cm3, respectively, and there was no significant difference between the measurements (t = −1.57, p = 0.15). Regression analysis demonstrated good agreement between the two imaging modalities (R2 = 0.99, regression slope = 1.13, p < 0.001). The freehand 3D technique was also successfully used to quantify thrombus volume (4.71 ± 3.28 cm3) in five patients with DVT >3.8 cm in length (group 2).
Conclusions
The described freehand 3D imaging protocol reliably measures thrombus volume in patients with acute DVT when compared with the commercially available 4D transducer. The freehand 3D method has the additional benefit of measuring thrombus volume in DVTs >3.8 cm in length. The method is convenient and can be used in clinical practice.
Introduction
Venography is the traditional gold standard for the diagnosis of acute deep vein thrombosis (DVT). 1 However, venography is an invasive procedure with attendant risks. Therefore, the accepted clinical test of choice for the diagnosis of acute DVT is duplex ultrasonography (DUS).2,3 B-mode grayscale imaging in combination with color-flow Doppler imaging and compression testing achieves sensitivity, specificity, positive predictive value, and negative predictive value of >90% in the diagnosis of acute DVT.2,3
Currently used DUS protocols have limitations and cannot provide a volumetric quantification of thrombus burden. Conventional two-dimensional (2D) ultrasound techniques calculate volume from simple measurements of height, width, and length in two orthogonal views, assuming an idealized (e.g., ellipsoidal) shape, or are used for qualitative categorization as low, moderate, or large volume in specific venous segments. 4 . These methods have low accuracy and are observer dependent. Other clinical imaging modalities such as magnetic resonance or computed tomographic venography, while more specific, are not convenient or cost-effective to use serially in the clinical setting.
During the last two decades, there has been rapid development in three-dimensional (3D) ultrasound technology. Numerous studies have demonstrated that 3D ultrasound can be used to accurately measure volumes for a variety of organs such as liver,5,6 uterus, 7 bone, 8 skeletal muscle,9,10 tendons, 11 and the fetal heart. 12 However, there have been few attempts to measure venous thrombus volume using 3D ultrasound technology. Our group has recently reported on the reliability parameters of a commercially available, mechanical four-dimensional (4D) ultrasound transducer to assess thrombus volume. 13 However, a major limitation of this transducer is that it can only measure a field of view of ≤3.8 cm at one time. Regions of interest longer than 3.8 cm require sequential imaging and complex image-processing algorithms to stitch the images together to view the entire target. Therefore, for larger thrombi, we implemented a freehand 3D image capture technique using a standard clinical ultrasound machine and an external tracking system to monitor transducer position. 14 This approach allows complete freedom for the operator to acquire 3D images from anatomical structures of any size. 15 In the present study, we compared thrombus volume measurements obtained by the freehand 3D method versus the commercial 4D technology.
Methods
Patients and Study Design
We studied 15 patients at the University of Maryland Medical Center with a first episode of acute DVT. A routine clinical duplex ultrasound was performed before enrollment to confirm the diagnosis. Patients included in the study had thrombus within the femoral or internal jugular veins. Ten patients had a thrombus length ≤3.8 cm, and these patients underwent freehand 3D and 4D scanning (group 1). Five patients with thrombus length >3.8 cm were scanned with the freehand 3D method alone (group 2). Patients with recurrent or chronic DVT were excluded from the study. All participants provided informed consent, and the study protocol was approved by the institutional review board of the University of Maryland School of Medicine.
Demographic information, clinical risk factors for DVT, and treatment details were recorded at the time of enrollment in the study. Treatment decisions regarding the use of short- or long-term anticoagulation and placement of an inferior vena cava filter were made by the treating physician and the patient and were not influenced by the study protocol. All participating patients underwent an ultrasound examination that included standard 2D grayscale, color-flow, power-mode, and 3D volumetric imaging using both freehand 3D and 4D transducer methods. Postprocessing was performed using the Stradwin software (Cambridge, United Kingdom) 16 to measure thrombus volume.
3D Ultrasound Image Capture from the 4D Probe
The sonographer used the following imaging protocol for each patient. The study was initiated by obtaining routine images of the DVT in grayscale, color-flow, and power-Doppler modes using a L9-4/38 linear probe with the SonixMDP ultrasound system (Ultrasonix Medical Corporation, Richmond, Canada). Once the routine 2D scans had been completed and the thrombus was localized (Figure 1A Figure 1C), the 4D transducer was placed over the region of interest. We used a dedicated 4DL14-5/38 transducer attached to the Ultrasonix machine (Figure 1F). The 4D probe acquires data by moving a linear transducer within a housing in the shape of an arc; the scan shape is similar to that of a handheld fan. Sequential 2D images are captured as the transducer moves within the housing (Figure 1D), thereby collecting the prescan-converted 3D volumes, which allows for saving and postprocessing of the volumes (Figure 1E). Care was taken to position the 4D scan-head such that the swing and sweep of the probe would capture the thrombus in all frames. Image quality was maximized using image depth and zoom features; the focal zone was positioned at the midpoint of the vein; and the angle of insonation was maintained at 90° with respect to the longitudinal axis of the vein. Once the scan was initiated, the scan-head acquired a set of sequential 2D images while the operator's hand and the patient were held still to reduce movement artifacts.
Freehand 3D Ultrasound Image Capture
This scanning initially followed the procedure described above. Once the routine 2D and volume images from the 4D probe had been obtained (Figure 1), freehand 3D ultrasound scanning was performed using the SonixMDP with a L9-4 transducer (Figure 2A Figure 2C). The transducer had an external tracking system attached to it (trakSTAR; Ascension Technology Corp., Burlington, VT) (Figure 2F), which enabled tracking of the transducer position in 3D space (X, Y, and Z coordinates). Stradwin software running on the Windows-based Sonix ultrasound machine was used to simultaneously acquire the images and the associated location data. 17 The image quality was maximized by choosing the optimal calibrated depth, adjusting time gain compensation, and maintaining the insonating angle at 90 degrees with respect to the longitudinal axis of the vein. Once the scan was initiated, a stack of 2D B-mode ultrasound images was acquired by manually moving the ultrasound transducer through the length of the thrombosed vein in a transverse orientation at a slow and steady speed.
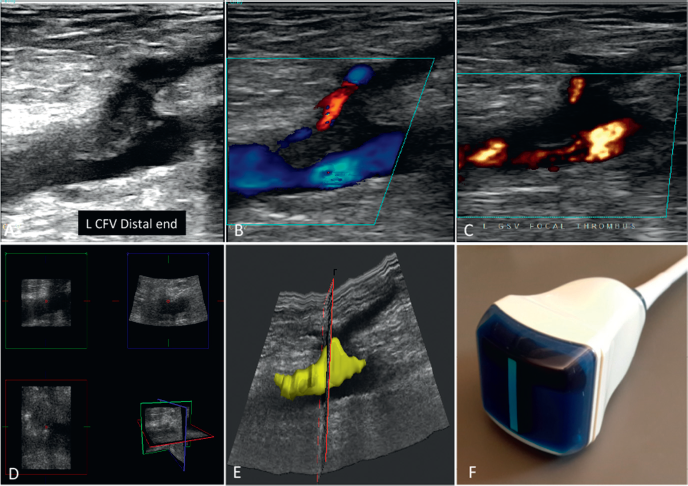
The standardized image acquisition technique and computerized image analysis algorithm to calculate thrombus volume using a commercial four-dimensional (4D) duplex ultrasound system. Routine two-dimensional (2D) imaging using a 9-MHz linear transducer to identify the thrombus in longitudinal views in (A) grayscale, (B) color-flow, and (C) power Doppler modes. (D) The 4D B-mode scan-head moves inside the housing of the transducer and acquires a set of sequential 2D images. The 2D images are reconstructed in three dimensions and reformatted for viewing in cross or longitudinal planes to facilitate the outlining of thrombus. (E) A volume output is obtained at the end of processing. (F) The 4D L14-5/38 transducer used in the study to obtain thrombus volume measurement.
Thrombus Volume Measurement from 4D Transducer
All segmentations were performed using Stradwin software. 16 The raw prescan-converted volume images were converted from the Sonix format to a Stradwin-suitable volume format using MATLAB (Mathworks, Inc., Natick, MA). As part of the conversion to Stradwin, the images were histogram equalized using an adaptive histogram equalization method with a Rayleigh distribution. 18 This process helps to enhance boundary identification across all image slices in all patients. After this postprocessing step, the entire clinical 2D B-mode, color, and power Doppler images were first reviewed to facilitate the outlining of the thrombus (Figure 1A Figure 1D). Then the thrombus was segmented from where it started until where it ended in one slice every 1 mm, and the total thrombus volume was calculated automatically from the reconstructed 3D image (Figure 1E).
Freehand 3D Thrombus Volume Measurement
After the B-mode images showing thrombus were identified in the serial cross-sectional images collected for the 3D scan (typically 200–600 images per data set), an algorithm within the Stradwin software 19 was applied to the dataset to correct for any misregistration caused by operator-induced variations in transducer pressure or position. From representative B scans through the data set, the outline of the venous thrombus was manually segmented (Figures 2A–D and 3A–C), producing a series of outlines of the thrombus (Figure 2A). Surface interpolation from these outlines was used to produce a surface-rendered reconstruction of the thrombus (Figure 2E). The total thrombus volume was calculated automatically from the reconstructed 3D image (Figures 2E and 3C).
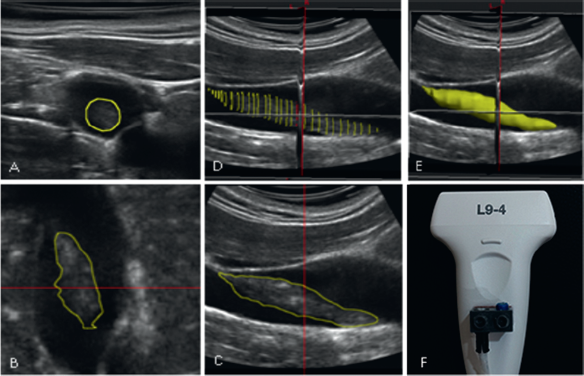
The standardized image acquisition technique and computerized image analysis algorithm to calculate thrombus volume using the freehand three-dimensional (3D) ultrasound method. After acquiring a series of cross-sectional grayscale views, the images were moved to an analytic software where they could be observed in (A) cross, (B) coronal, and (C) sagittal views. (D) The thrombus was outlined starting from proximal to distal ends. The coronal and sagittal views were used for reference to assist the outlining process. (E) 3D volume rendering of the 3D ultrasound scan after segmentation allowed total thrombus volume measurement automatically from the reconstructed 3D image. (F) The linear transducer attached to an external tracking sensor that was used for this freehand 3D imaging protocol.
Statistical Analysis
Patient characteristics such as age, sex, thrombus location (upper versus lower extremity), and use of anticoagulation (yes versus no) are reported as means ± standard deviation and percentage, as appropriate. Statistical analyses were performed using SAS version 9.3 (SAS Institute, Cary, NC). The paired t test was used to test for difference of measures using freehand 3D and 4D probe methods. A regression of measures from the two methods was performed using a simple linear regression model. Two-sided tests and a 5% significance level were used in the analysis.
Results
The mean age of the 15 patients with a first episode of acute DVT was 54 ± 13 years. Four patients were women and 11 were men. The majority (73.3%) of DVTs assessed were in the upper extremity. Nine of the patients were prescribed anticoagulation therapy. The patients had the following risk factors for acute DVT: brain pathology (n = 3), cancer (n = 3), cardiac disease (n = 4), gastrointestinal bleeding (n = 2), liver disease (n = 2), and aortic dissection (n = 1).
In the 10 patients with thrombus length ≤3.8 cm, the mean thrombus volume measured through freehand 3D and 4D probes was 0.49 ± 0.40 cm 3 and 0.52 ± 0.46 cm 3 (mean ± SD), respectively (Table 1), and there was no significant difference between the measurements using the 4D probe versus freehand 3D (t = −1.57, p = 0.15). Regression analysis showed good agreement between the 4D probe and freehand 3D methods for venous thrombus volume measurement (R 2 = 0.99, regression slope = 1.13, p < 0.001) (Figure 4).
Patient Characteristics
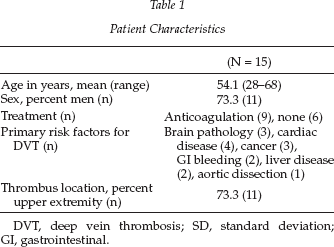
DVT, deep vein thrombosis; SD, standard deviation; GI, gastrointestinal.
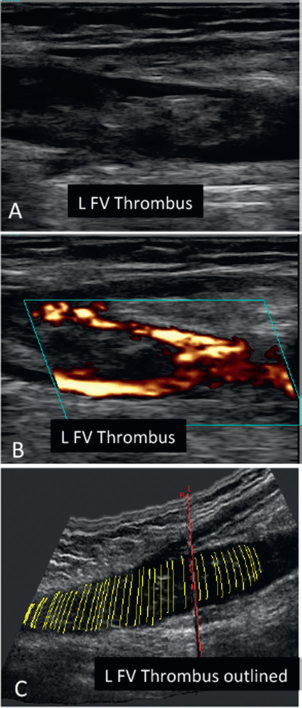
Steps in the image acquisition technique and computerized image analysis algorithm to calculate the volume of a long (>3.8 cm) thrombus in a lower extremity deep vein using the freehand three-dimensional (3D) ultrasound method. Routine two-dimensional (2D) imaging using a 9-MHz linear transducer is used to identify the thrombus in the femoral vein in (A) longitudinal grayscale and (B) power Doppler modes. (C) 3D volume rendering of a scan of the same thrombus. The composite of stacked outlines in sequential cross-sectional images of the thrombus in 3D provide a volumetric rendering of the thrombus.
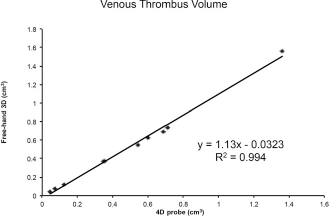
Regression analysis showing extent of agreement between the two three-dimensional (3D) methods for venous thrombus volume measurement (R 2 = 0.994, regression slope = 1.13, p < 0.001).
We also scanned five patients with larger DVT (length >3.8 cm). The range of thrombus length was 4.21–11.43 cm, and the freehand 3D technique successfully quantified the volume of each thrombus (mean 4.71 ± 3.28 cm 3 ; Table 2).
Characteristics of Patients with Larger (>3.8 cm in length) Deep Vein Thrombus

DVT, deep vein thrombosis; 3D, three dimensional; RFV, right femoral vein; LCFV, left common femoral vein; RCVF, right common femoral vein; LIJV, left internal jugular vein.
Discussion
In this study, we proposed the use of a freehand 3D ultrasound method to measure venous thrombus volume that is not limited by the size of commercially available transducers that can perform 3D imaging. We also demonstrate that our 3D method does not differ in volume measurement when compared with a commercially available 4D transducer. The freehand 3D method has the additional benefit of measuring longer thrombus segments and can be used in clinical practice.
Until recently, clinical methods of quantifying thrombus burden in patients with acute DVT were highly subjective. Within the last decade, options have emerged that allow for more objective and quantitative measurement of thrombus burden. Unfortunately, these protocols developed for volumetric quantification of target structures using 2D ultrasonographic imaging are complex, inconvenient, and have therefore remained restricted to the research laboratory. These protocols use a standard 2D linear transducer that captures sequential cross-sectional images, which are then stacked together to form a 3D reconstruction. The transducer must be physically moved over the patient at a standardized rate to allow temporal and translational measurements to be made. This has been achieved by using a motorized device that attaches to the transducer. However, the motor is bulky, uncomfortable to patients, and therefore impractical for routine clinical use.
The recent introduction of 4D transducers into the clinical market has allowed accurate and reliable volumetric assessment of liver lesions, ovaries, uterus, fetuses, and other intra-abdominal structures.20,21 Vascular targets are much smaller and respiratory and cardiac cycle movement may further complicate quantification, but we recently tested the use of a commercial 4D transducer to image venous thrombosis and to measure thrombus volume. Inter- and intraobserver variability was low, and correlation coefficients of repeated observations were high 22 ; however, there was a serious limitation to the method. The target lesion to be imaged must be within the size of the transducer (≤3.8 cm). DVT is frequently longer than that size, and such targets would need to be imaged sequentially and then stitched into a composite 3D image. Since the precise location of the transducer is not recorded by commercial software, there is no automated methodology to identify the exact location where each set of images overlaps to create a composite image. With these limitations in mind, we implemented a freehand 3D imaging system that can be used with any commercially available linear transducer. The transducer can be moved freely by the technologist over any region of interest of any size to capture sequential cross-sectional images that are registered in 3D space and can therefore be stacked and reconstructed to enable volumetric measurements. The results of the present study demonstrate that volumetric testing of venous thrombosis using this approach has a high correlation with the commercial available 4D probe for less than probe width size thrombus and has the added advantage of allowing for volume measurement in longer thrombus segments.
Pharmacologic, mechanical, or combined pharmacomechanical thrombus removal is being increasingly used in patients with severe iliofemoral DVT. A simple, noninvasive but accurate method of measuring thrombus burden at baseline and follow-up is critical for evaluating procedural success in these patients. Thus, our results provide a clinically useful and relatively inexpensive method for obtaining this assessment on a routine basis. We believe that 3D ultrasonography in this and other aspects of vascular evaluation will become routine in the coming years and that its use will become critical in patients after thrombolysis or thrombectomy treatments. Accurate, quantitative measures of thrombus volume will also prove invaluable for clinicians in deciding when to stop anticoagulation in DVT patients. Reimbursement will clearly be tied to how rapidly the clinical value of this ultrasound protocol can be demonstrated.
Although we have established an effective protocol for quantifying thrombus volume, the limitations of this study deserve attention. The study sample was small, and a type II error cannot be ruled out. The protocol depends on high-quality B-mode images, and results will be adversely affected by poor image quality of the thrombus. The tracker system uses medical grade electromagnetic signals that may be subject to interference from other electromagnetic sources such as cathode ray tube monitors or from metallic objects such as intravenous poles. Proper positioning of such objects a few feet away from the transmitter can easily prevent this.
In summary, this freehand 3D imaging protocol reliably measures thrombus volume in DVT patients with a wide range of thrombus lengths. The method is convenient and could easily be disseminated across hospitals and clinics for use in clinical practice. It is potentially less expensive to install since it can be added on to preexisting linear transducers as opposed to 4D transducers that must be purchased separately. We anticipate that 3D imaging to quantify venous thrombus volume will progressively become incorporated into regular clinical practice in the coming years. It has the potential to improve selection of best treatment options as well as evaluate the efficacy of various treatment approaches for acute DVT.
Footnotes
Acknowledgments
This research was supported by a Veterans Affairs Merit Review Award (B. K. L), a Paul B. Beeson Career Development Award in Aging (K23-AG040775) and the American Federation for Aging Research (S. J. P), and the Baltimore VA Medical Center Geriatric Research, Education, and Clinical Center (GRECC).