
Abstract
The optokinetic response (OKR) is a reflexive behavior in which the eye intends to fixate the surrounding image in motion on its retina. The two important components of the OKR visual stimulus are the spatial frequency (SF) and the temporal frequency (TF). Zebrafish (Danio rerio) is considered an important model animal for visual physiology research. As a result, several works have been performed recently on zebrafish OKR in terms of their visual acuity or eye velocity. In the present study, a novel data pattern has been reported in terms of the relationship between ocular movement frequency (OMF) and TF of the visual stimulus in the presence of two types of SF of the optokinetic visual stimulus. The results indicated that at the basal SF (0.05 cycles per degree [cpd]), the OMF significantly increased (p < 0.05) with the corresponding elevation in the TF (till 240 deg.s−1). On the contrary, at a higher SF (0.29 cpd), there was a significant decrease (p < 0.05) in the OMF with the increase in TF.
Introduction
The perception of motion involves two attributes, one is perceiving motion of the object and the other is self-motion. 1 When an observer views an image in motion, the eyes’ usually move in pursuit of it so that the object’s image is stabilized on the retina, which in turn helps to retain a high level of resolving power. 2 When a significant section of the visual field moves, the eyes move smoothly along the field (slow phase) intervened by saccades (fast phase) in the opposite direction. This rhythmic oscillatory movement of the eye is termed as the optokinetic response or OKR. 3 The OKR is thus a type of reflexive eye movement by means of which the surrounding image in motion gets stabilized on the retina, resulting in enhanced visual resolution, that is, visual acuity (VA). 4 The underlying objective is to keep the visual image of the external world stationary on the retina despite movements of the head and body because even slight movements of this image across the retina (i.e., retinal slip) cause considerable visual blur.
It is known that the OKR consists of two categorical phases—first of which is the slow smooth pursuit eye movement (SPEM) phase that occurs in the same direction and at almost the same speed as that of the image in motion and the second being the fast corrective nystagmus phase that occurs in the contralateral direction. 5 For this reason, animals that use vision need image stabilization strategies and reflexes, and for vertebrates, this principally involves extraocular muscles that rotate the eyeball within its bony orbit so as to cancel or minimize the retinal slip consequent to movements of the head. 6 The ocular muscles are innervated by oculomotor cranial nerves of midbrain. 7 OKR is a highly conserved behavior across all vertebrates and is also found in some insects such as Drosophila. 8 Furthermore, the anatomical and physiological substrates of image stabilization eye movements are remarkably similar across vertebrate species, from fish to apes. 6 In terrestrial vertebrates, both horizontal and vertical OKR can be elicited, which allows modification of several other components of the stimulus such as orientation, contrast, location, and so on.9–11 However, in most aquatic animals, such as fish only, the horizontal OKR can be effectively studied. 12 In laboratory, to induce horizontal OKR in the model animal, the standard stimulus used is a cylindrical screen with vertical black and white gratings (alternating black and white bars/stripes) that revolve around the subject.13,14 As a result, the two most important components of the grating stimulus are the spatial frequency (SF) and the temporal frequency (TF). 15 Each set of black and white gratings is known as one cycle. SF is the number of cycles per unit distance. A higher SF indicates a higher number of gratings with a smaller width. TF is the number of cycles per unit time and is thus a measure of angular velocity (the rate of stimulus rotation). 15 The Danio rerio (Hamilton, 1822), a freshwater teleost, commonly known as zebrafish, is now considered a standard animal model to study visual physiology owing to the similarity of its retina to other vertebrates.16,17 More recently, as adult visual behavior in zebrafish has become an important topic of research, the development of research methods to measure specific responses in zebrafish is on the rise.18,19 Till date, several studies on OKR have been performed on both larval and adult zebrafish. However, most of the works have studied OKR either in terms of VA or in terms of eye velocity or change in visual angle before and after stimulus presentation.20–22 Since the long-term objective of the work is to study the influence of several biophysical stimuli on the OKR of the model fish, quantifying the frequency of the ocular movement in the presence of the surrounding visual stimulus remains an important area of concern.
In the mentioned backdrop, the present study was undertaken to quantitatively study the OKR of adult zebrafish in terms of the frequency of ocular movement during the stimulus presentation time by manual tracking of the SPEM phase. The highest TF (angular velocity) studied in larval zebrafish until now is 108 deg.s−1. Here, we studied the effect of higher values of TF, ranging from 60 to 240 deg.s−1 on OKR of adult zebrafish. In the present study, for the first time, a relationship between ocular movement frequency (OMF) and an increase in TF of the visual stimulus has been reported under two different SFs of 0.05 and 0.29 cycles per degree (cpd). The OKR has been studied using a customized Optokinetic Response Recording Apparatus developed in the laboratory. 23
Materials and Methods
Maintenance of fish
Adult zebrafish (Wild-type and Wild Indian Karyotype strain) were procured from a registered fish breeder and maintained in the Animal House—Experimental Facility for Zebrafish Research as per the guidelines of the Institutional Animal Ethics Committee of the Indian Statistical Institute, Kolkata (Approval No. ISI-IAEC/2022/01/01). The animals were acclimatized for a period of 7 days after procurement. A light–dark cycle of 14:10 h was maintained in the Animal House. The fish were fed thrice daily (morning, afternoon, evening) with dry food pellets. The range of housing water temperature was maintained between 26.4°C and 27.8°C.
Experimental procedure
For the present study, 10 healthy adult zebrafish were randomly chosen. The average age range of the adult fish used in the study was around 5–6 months (150–180 days). The whole experiment was performed during the daytime between 11:00 a.m. to 3:00 p.m. for five consecutive days. Therefore, on each day, two fish were tested for the study. The luminance of the experimental arena was maintained at 140 lux. 24 The direction of the moving field visual stimulus was from right to left, that is, anticlockwise (Fig. 1e3).
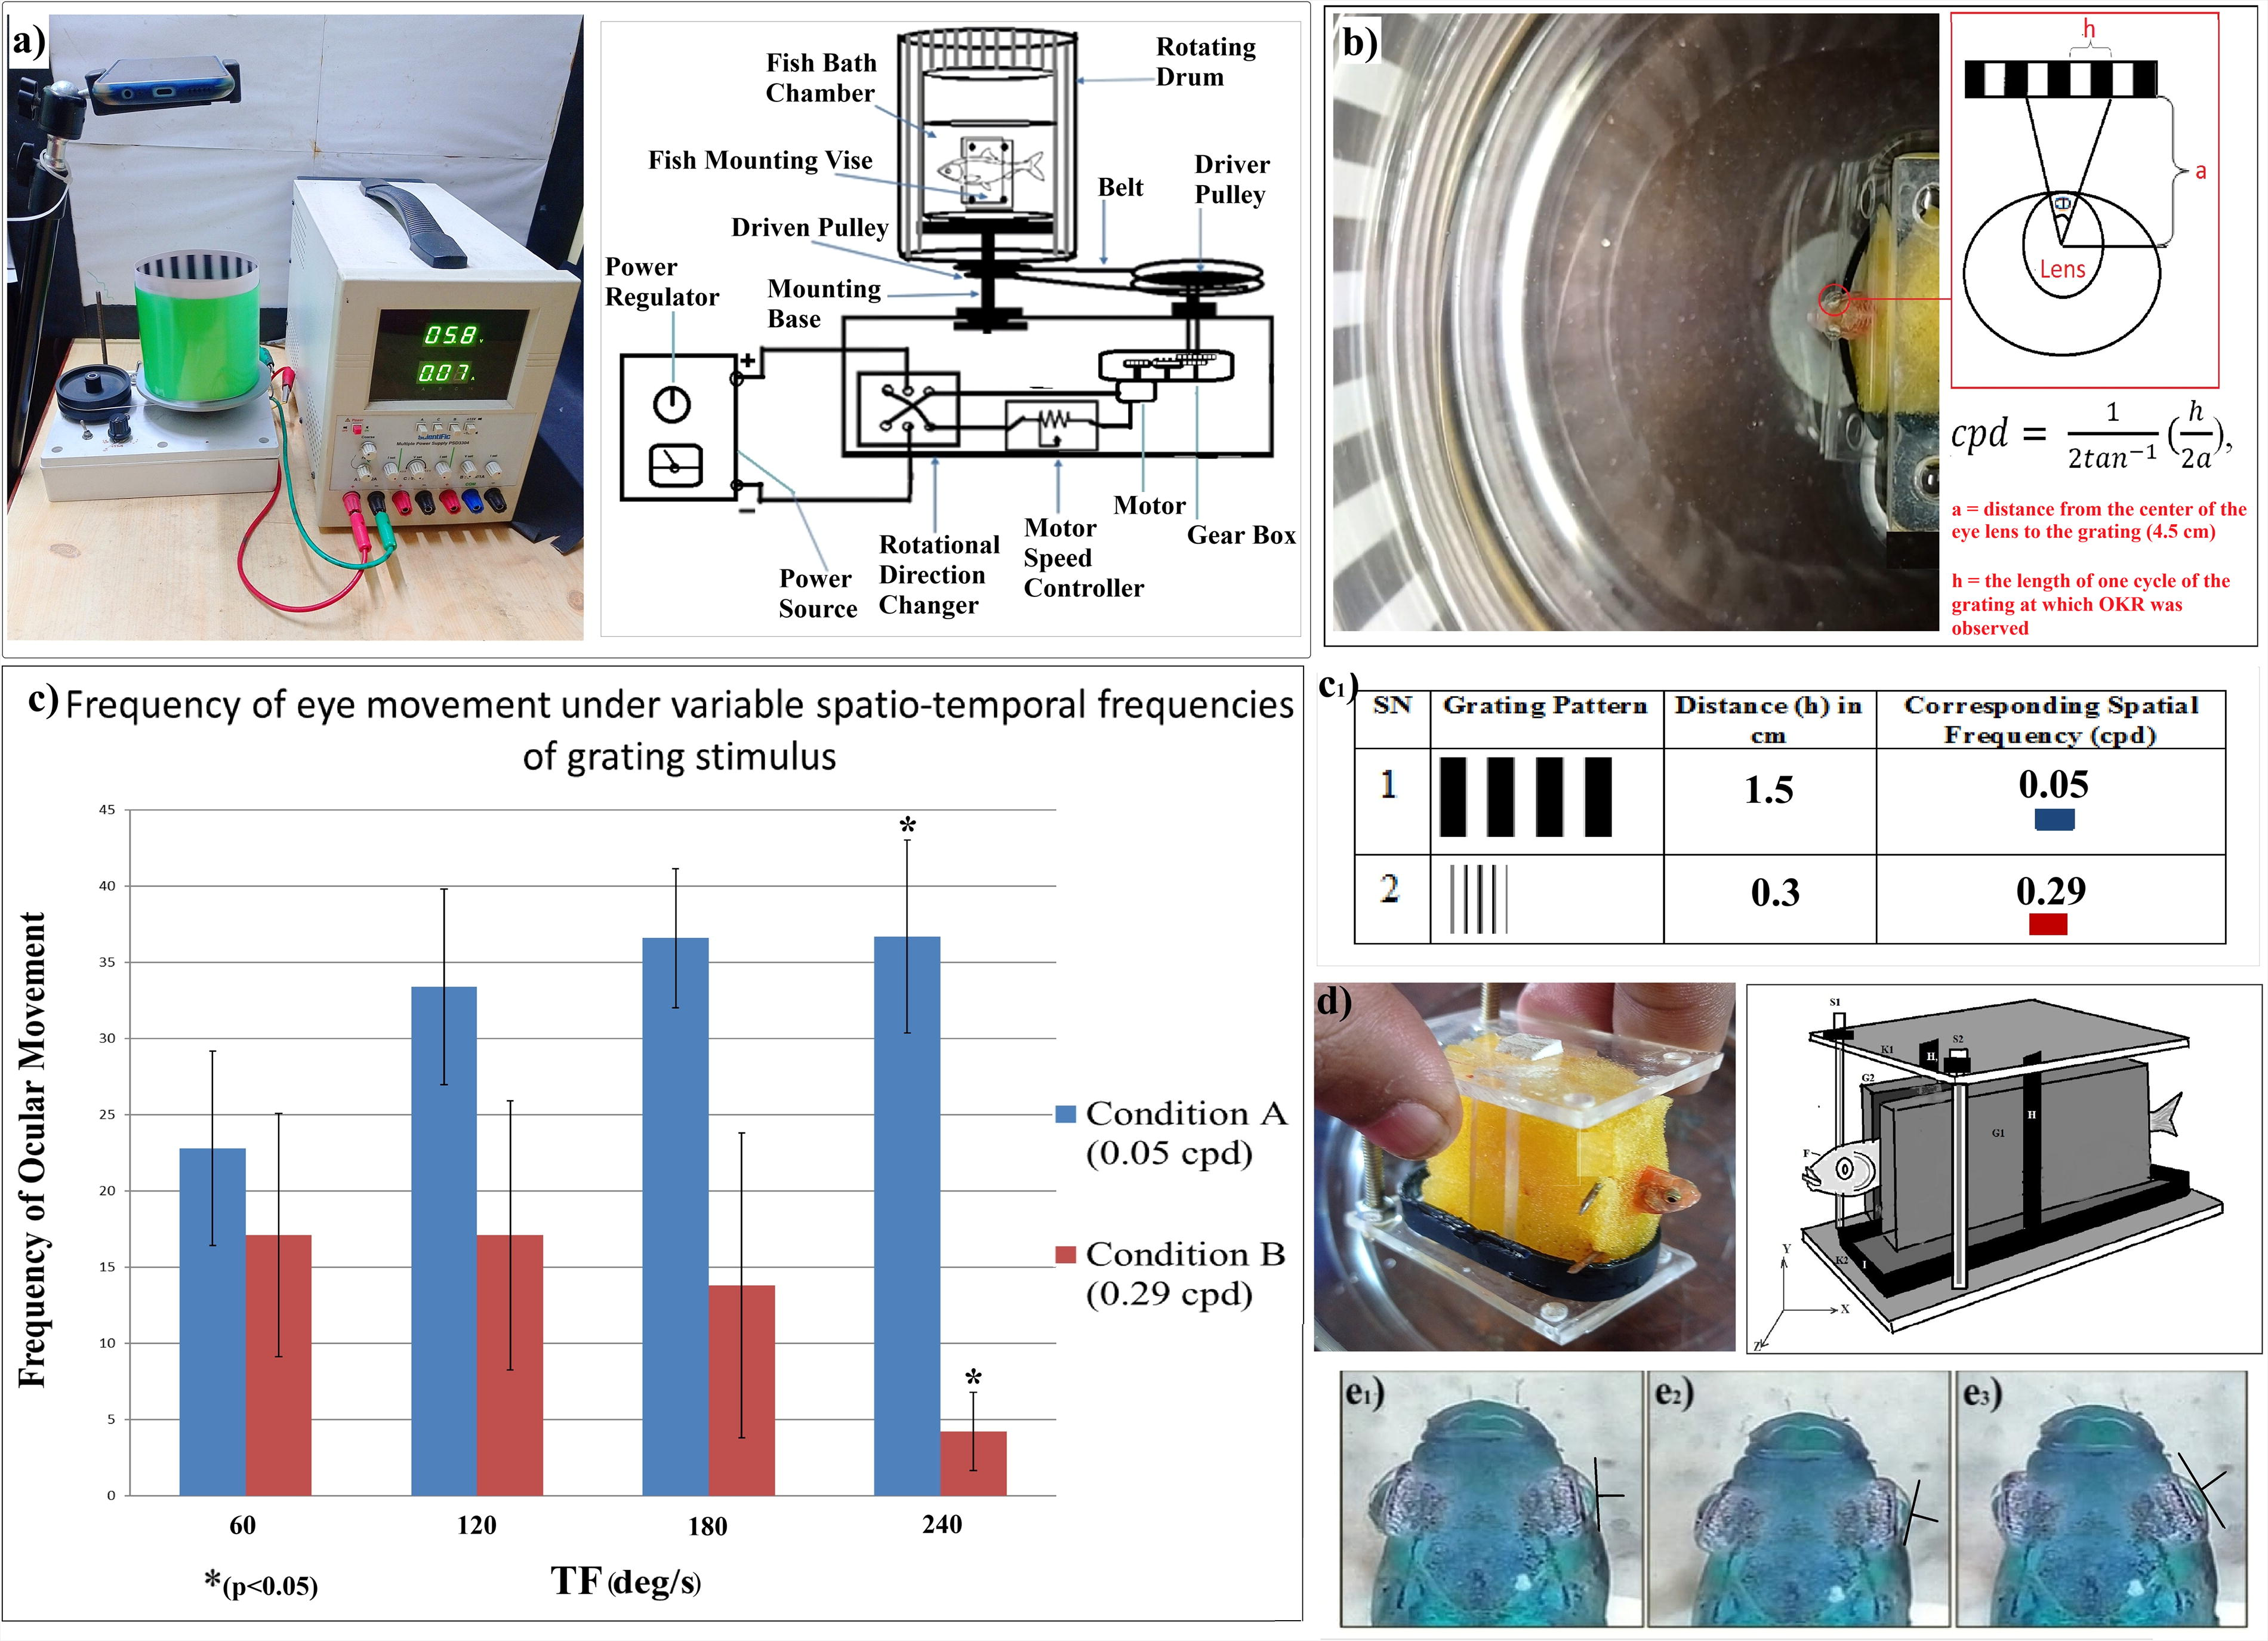
For eliciting OKR, a customized OKR recorder was developed in the laboratory, and the type of visual stimulus used was a standard grating stimulus of alternate black and white stripes (vertical) with 100% contrast (Fig. 1c1). The developed apparatus consisted of four main units—mechanical unit, stimulus display unit, electrical unit, and recording unit (Fig. 1a). The mechanical unit was used for creating a center-fixed surround-rotating platform using a combination of gear and pulley system, driven by a motor. In the stimulus display unit, the interchangeable grating pattern was inserted manually during experimentation. The direction and speed of the motor were regulated using the electrical unit of the apparatus. The recording unit consisted of an overhead camera (mobile phone camera) mounted on a tripod.
Before starting the experiment, each of the fish was immobilized using hypothermic anesthesia (inside a lab-built anaesthetizing chamber) and was securely mounted using a customized and delicate fish mounting vise (Fig. 1d), assembled in the laboratory. The vise comprised a rounded-rectangular frame, which served as the base, two vertical acrylic strips that acted as a channel guide, and two water-soaked sponge blocks, which prevented any mechanical injury to the fish and also maintained a moist environment, essential for fish breathing. Following this, the mounted fish was carefully placed inside a water-filled (having normal housing temperature) glass cylinder. The cephalic portion of the fish was positioned at the center of the cylinder in order to maintain an equidistant field of view of the surrounding wall (Fig. 1b). The fish revived from anesthesia within 10 min as noted from the recovery of normal opercular movement and random eye movements. The whole setup was then aligned on the center-fixed stage of the mechanical unit in a manner so that the cephalic portion of the fish remains at the center of the rotational axis of the surrounding wall. The grating stimulus was then aligned vertically in the stimulus display segment. Following this, the system was switched on using a standard power source (Scientific PSD3304) connected to the electrical unit of the apparatus.
The two different SFs considered for the study were 0.05 cpd and 0.29 cpd (Fig. 1c1). The values of the variable TFs (in deg.s−1) used were 60, 120, 180, and 240. The SF was kept fixed each time while increasing the TF of the rotating grating stimulus. Thus, the experimental design comprised two conditions—Condition A and Condition B. In Condition A, the SF value was 0.05 cpd, and the TF value was increased in the order of 60, 120, 180, and 240 deg.s−1. Similarly, in Condition B, the SF value was 0.29 cpd, and the TF value was increased in the same order as that of Condition A.
The duration of the presentation of the stimulus was 10 s. The nature of the presented stimulus was random. This means for fish 1, under Condition A, if the TF began with 60 deg.s−1, for fish 2, it did not always begin with TF 60 deg.s−1. Therefore, for fish 1, under Condition A (a lower SF of 0.05 cpd), if the order of TF was 120, 60, 240, 180 deg.s−1, for fish 2, under the same experimental condition, the order of TF was 60, 240, 120, 180 deg.s−1. Thus, both the presented SF and TF were deliberately kept to be random, in order to avoid any possible adaptation to the stimulus. Since the same fish was tested for both experimental conditions, a resting period of about 5 min was maintained in between, during which the fish was not exposed to any visual stimulus. However, during this period, the fish was kept mounted using the delicate vise within the water-filled cylinder of the experimental setup. The frequency of the smooth pursuit eye movement was then recorded, and the video graphic recordings were later used for analysis.
Statistical analysis
The frequency of ocular movement was manually computed using the frame-by-frame feature of an open-source video processing software (VideoLAN Client). The computed values were then subjected to statistical analysis to examine any significant difference in the mean values of the computed OMF between Conditions A and B. The difference in the mean values was computed using one-way analysis of variance (ANOVA) testing through Python language-based library function. In addition, for obtaining better results, two-way ANOVA and repeated measures ANOVA were also computed using the data analysis package of MS-Excel. The number of tested individuals for both Conditions A (low SF) and B (high SF) was 10 each. Thus, the total number of fish used for experimentation was 10, and the total number of observations were
Tabular Representation of the Fish Ocular Movement Frequency Under the Two Experimental Conditions A and B
Fone-way = 12.04075, pone-way = 0.000013; Frepeated measures (column) = 16.13013, prepeated measures (column) = 3.32E-06.
Fone-way = 5.99142, pone-way = 0.002021; Frepeated measures (column) = 8.151894, prepeated measures (column) = 0.000504; Ftwo-way (sample) = 152.539, ptwo-way (sample) = 1.86E-19; dfb = 3, dfw = 36.
cpd, cycles per degree; OMF, ocular movement frequency; SD, standard deviation; AM, arithmetic mean; SF, spatial frequency; TF, temporal frequency.
Results
In the present study, the OMF was calculated in terms of the frequency of the slow movement phase, that is, the SPEM of the right eye only (Fig. 1e3). From the results of the study, it was noted that in Condition A (SF 0.05 cpd), the OMF increased with the increase in TF. It was also found that the mean OMF at TF 240 deg.s−1 was significantly higher (p < 0.05) in comparison to that of 60 deg.s−1. On the contrary, in Condition B (SF 0.29 cpd), the OMF decreased significantly (p < 0.05) with the corresponding increase in TF.
It was also noted that the mean computed OMF value, between both of the experimental conditions, was highest in the case of Condition A (SF 0.05 cpd) at TF 240 deg.s−1 and lowest in the case of Condition B (SF 0.29 cpd) at TF 240 deg.s−1. The counted OMF of the fish from the video graphic data and the computed mean values of the OMF under Conditions A and B have been represented in Table 1 and Figure 1c, respectively. Based on the data pattern, two optimal curves (TF vs. OMF) based on the TF values under the two fixed SFs 0.05 and 0.29 cpd have been presented. From the curve, it may be seen that for 0.05 cpd, the optimal TF was 240 deg.s−1, and for 0.29 cpd, the optimal TF was 120 deg.s−1 (Fig. 2).
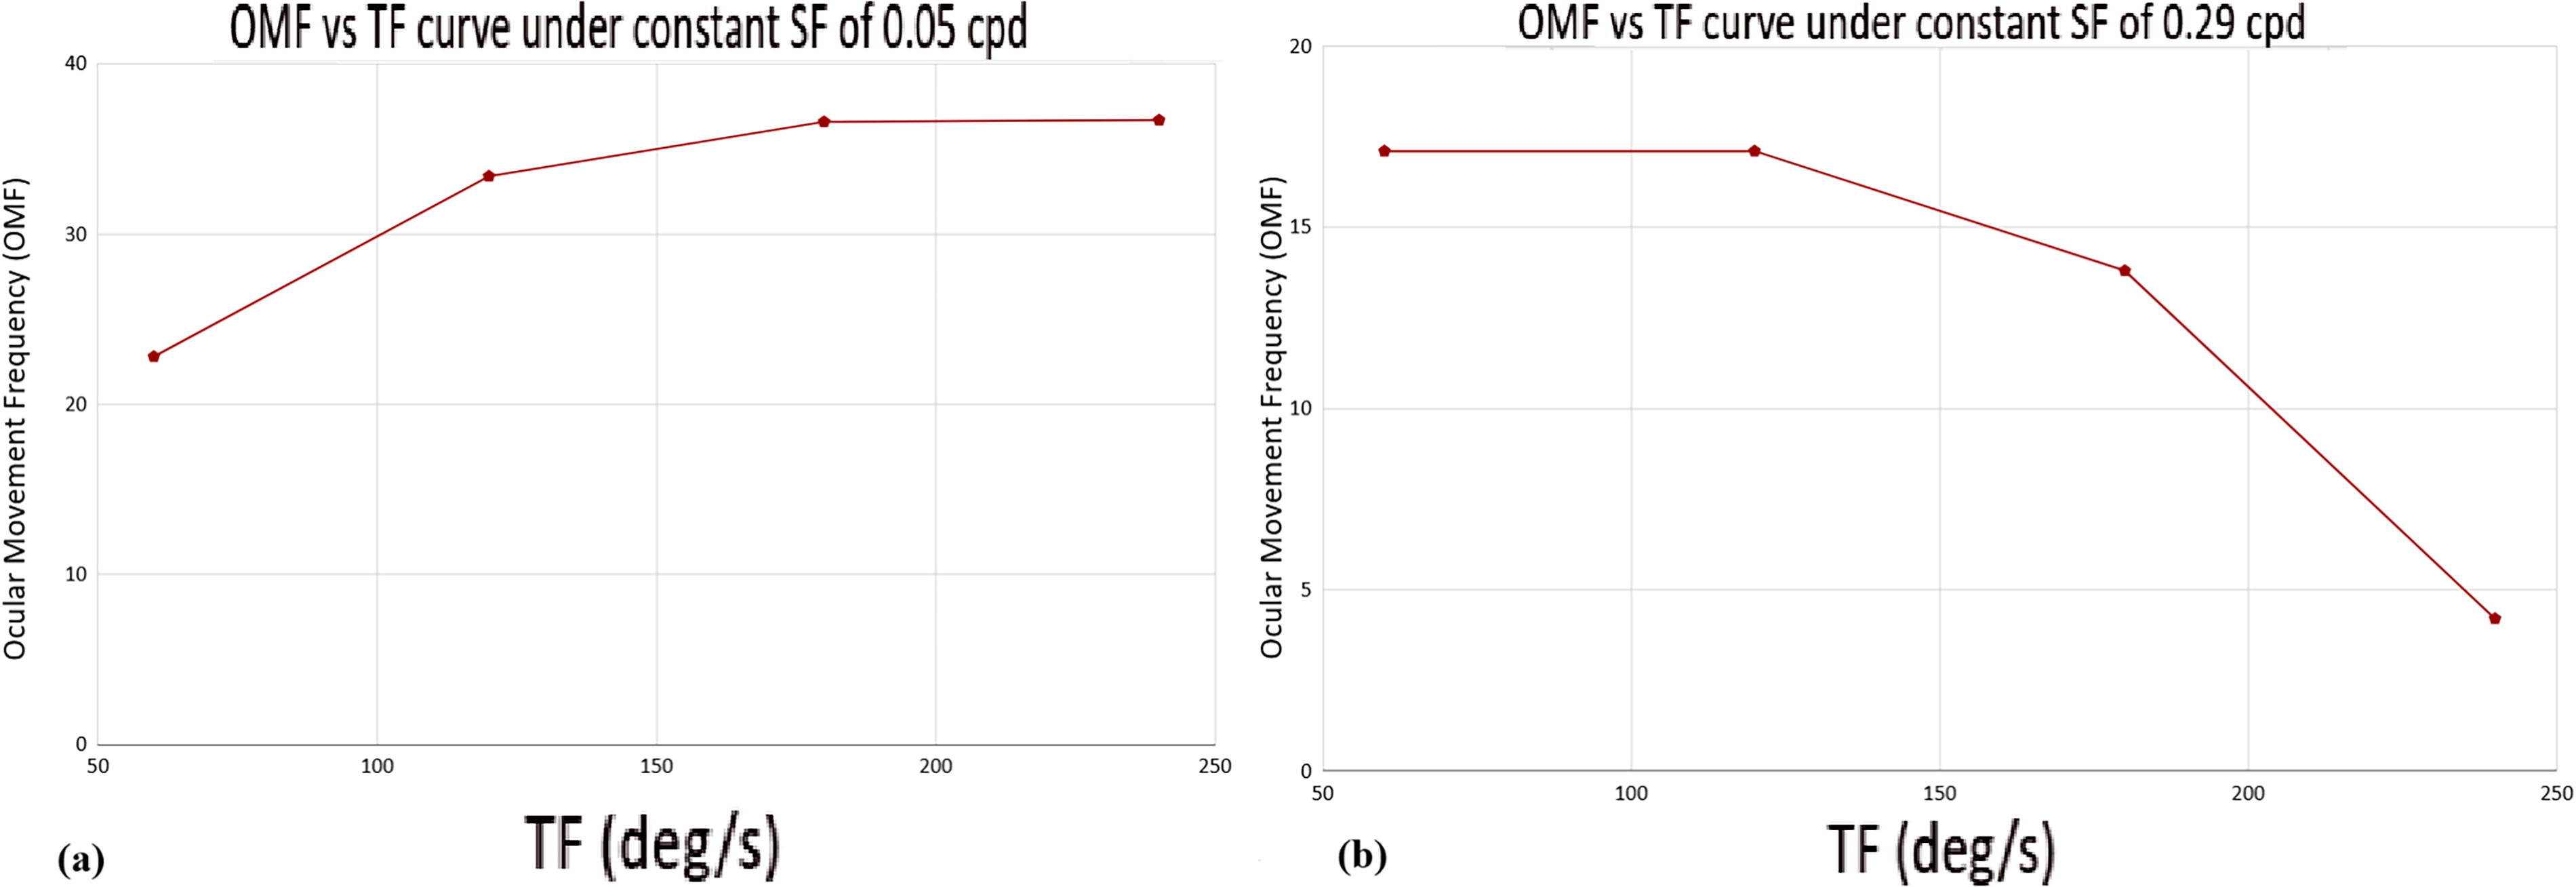
Graphical representation of TF versus OMF optimal curves under
Discussion
In the present work, the change in OMF following variation in SF and TF of the surrounding stimulus was studied. In nature, there are several instances where the fish may encounter such wide variability in SF and TF of the surrounding objects in motion—for example, in the presence of water current in streams or rivulets, the fish would need to maintain its visuomotor responses (OKR) as well as its sensorimotor responses such as rheotaxis. 25 Under such a scenario, the fish will be exposed to several moving objects such as algal particles, gravels, potential feeding elements, and the like, which it may encounter in its swimming path and which may influence its orientation response. 26 Another important condition where the TF and SF of the surrounding object in motion play a crucial role is during catching of prey, in the case of underwater hunting. 27 Other relevant natural situations include navigation and migration, where using visuospatial cues is likely to be important. 28
It has already been reported that OKR comprises two distinct phases (Fig. 1e)—a slow phase in the same direction of the moving stimulus (Fig. 1e3) and a fast corrective phase in the opposite direction (Fig. 1e2). 5 For the ease of manual tracking, the slow phase, also termed as the smooth pursuit eye-movement phase, was considered for computing the OMF. From the graphical representation as shown in (Fig. 1c), it was clearly noted that when a grating stimulus with a low SF of 0.05 cpd was presented, the frequency of ocular movement increased significantly (p < 0.05) with the corresponding elevation in the TF of the grating stimulus in motion. Figure 1c also indicates that when a higher SF of 0.29 cpd was presented, the frequency of ocular movement exhibited a significant decrease (p < 0.05) with the corresponding increase in the TF. Thus, the data pattern indicates that when the SF of the grating stimulus was low, the ability of the fish to stabilize the grating image in motion was retained even at a high TF value, 240 deg.s−1. However, when the SF of the stimulus was high, the fish’s ability to stabilize the image in motion gradually faded with a corresponding increase in the TF. Similar studies have been performed on other visuomotor responses of zebrafish like, the optomotor response (OMR), where the animal tries to stabilize its position by evoking locomotion along the same direction as that of the moving visual stimulus.29,30 Such studies have reported that the spatiotemporal frequency of the stimulus pattern influences the strength and direction of OMR. For the OMR, a range of 0.01–0.08 cpd and 5–103 deg.s−1 was found to be functional, in case of adult zebrafish. 30 Thus, it indicates a relatively lower range of values in comparison to the findings in the present study on OKR of the adult zebrafish. Research on OKR using mice has reported a similar optimal SF value of 0.125 cpd, like that of the findings in the present study on adult zebrafish. 11 But other studies have demonstrated a much higher TF value of 540 deg.s−1 for the highest responses in mice. 31
In the present study, the two SFs used are 0.05 cpd and 0.29 cpd, of which 0.05 cpd resembles a basal (low) SF and 0.29 cpd resembles a higher SF (Fig. 1c1). It is known that the perceived SF (cpd) is also an indicator of VA. VA is the angular resolution of the eye, that is, the ability of the eye to distinguish between two closely spaced objects in terms of visual angles. 32 The highest number of white and black stripes that an eye can resolve is its VA measurement. In the present study, after analyzing all the recorded video data, it was seen that the adult zebrafish exhibits OKR at both 0.05 and 0.29 cpd, as evident from the correct reflexive response. Earlier studies have reported that the ocular response will be considered as correct if there is a presence of three or more consecutive saccades in the correct direction to that of the presented stimulus. 33 The highest SF that an eye can still resolve has been described as the “optical cutoff frequency.” 34 After analysis, it was found that at 0.05 cpd, all the fish exhibited correct response till the highest TF value of 240 deg.s−1. However, at 0.29 cpd, all the fish exhibited correct response only till TF of 120 deg.s−1. Thus, it may be noted that in the present study, the upper limit of VA was found to be 0.29 cpd when the TF (also termed as angular velocity) of the stimulus was kept at 120 deg.s−1 or 0.04536 g. The finding coincides with other experimental studies that have reported 0.24 cpd as the physical limit of VA in adult zebrafish.18,34
On the contrary, other studies using larval zebrafish have reported maximum OKR in the range of 0.06–0.02 cpd and 60–100 deg.s−1.18,35
Conclusions
From the findings of the present study, it may thus be concluded that at lower spatial frequencies, the ability of zebrafish (adult) eye to perceive the gratings as two distinct objects in motion (VA) is maintained even when the TF of the moving field visual stimulus is increased to a value as high as 240 deg.s−1. However, when the SF of the stimulus used is high (0.29 cpd), the ability is maintained till a TF of 120 deg.s−1 only. The study also indicated a characteristic pattern between an increase in TF of the moving field visual stimulus and the OMF. An increase in TF resulted in an increase in OMF when the SF value was low and the reverse when the SF was high. Thus, it may also indicate that with an increase in SF of the visual stimulus, the ability of the fish to elicit proper OKR is also reduced.
Footnotes
Authors’ Contributions
Ba.Bh.: Study design, writing—original draft, and conceptualization. S.R.: Methodology and study design. Bi.Ba. and S.M.: Supervision. A.B. and K.G.: Article editing and supervision.
Data Availability
Disclosure Statement
No competing financial interests exist.
Funding Information
This work was supported by the Cognitive Science Research Initiative (CSRI), Department of Science and Technology (DST), Government of India, for funding the project (award no. DST/CSRI/2021/566).