
Abstract
Purpose:
Progressive disability occurs in persons with amyotrophic lateral sclerosis (pALS), but change over time across phenotypes remains understudied, limiting clinical decision-making. This descriptive study describes functional motor change with detailed measures across ALS phenotypes to enhance clinical decision making.
Materials and Methods:
Electronic health record data from an interdisciplinary ALS clinic (n = 109 pALS, 2018-2022) including demographics, disability (ALS Functional Rating Scale-[ALSFRS-R]), and functional motor scores (10 m Walk, Handheld dynamometry [grip and ankle]) was utilized. Phenotype groups were defined by site of onset (bulbar, limb onset; upper limb or lower limb). Analysis was conducted using R and included changes scores and measures of central tendency in 3-month intervals.
Results:
PALS included n = 43 bulbar, n = 32 upper limb, n = 34 lower limb onset, age 65, 60 to 71 (median, interquartile range). ALFSRS-R decline was greatest in bulbar, and similar in upper and lower limb. Patterns of change within motor scores suggest greatest loss of grip strength in bulbar and upper limb, ankle strength in upper limb, walking speed in lower limb, and preservation of community ambulation in upper limb.
Conclusion:
While ALSFRS-R scores were similar in upper and lower limb, detailed functional motor measures indicated differences in groups. These patterns provide insight to guide clinical decision making and future research to enhance care in pALS.
Introduction
Primary symptoms in amyotrophic lateral sclerosis (ALS) that limit participation in valued daily activities and life roles include muscle weakness, spasticity, dysarthria, dysphagia, and dyspnea. 1 Despite these commonalities in presentation, there is significant variability in the disease course and its observable characteristics based on phenotypic subtype. One important phenotype classification is site of onset, bulbar versus limb onset; upper limb or lower limb. 2 Little is known regarding the variability and granularity of functional motor change over time within these phenotypes for people living with ALS (pALS). This knowledge is needed to aid the interdisciplinary team in making clinical decisions to maximize function and overall quality of life (QOL), and to provide a baseline for comparison for much needed advancements in intervention. Regularly collected and analyzed rehabilitation-based outcomes may fill this void and are needed 3 across all stages of ALS as a significant decrease in participation occurs even in initial stages of the disease. 4
Multidisciplinary ALS clinics are the best care environment for pALS, showing improved QOL and survival time compared with those who do not have access. 5 However, clinics face challenges in measurement of and activity prescription for pALS.6,7 Many standardized clinical measures are utilized in multidisciplinary clinics to evaluate progression but not consistently or wholistically due to barriers, for example, fast pace, short re-evaluation visit time, differences in practice, and rapid change in pALS.2,8,9 Objective impairment and functional standardized measures may help address the limitations of the more commonly used measures, such as the ALS Functional Rating Scale-Revised (ALSFRS-R) 10 providing increased prognostic power and insight for clinical decision-making. 2 The ALSFRS-R is a reliable and frequently used measure correlated with survival in ALS, but it is a clinician proxy measure based on patient self-report that is not a linear or unidimensional scale, thus it has limitations in capturing accurate performance and interpretation of change. 11 A literature search of articles in pALS published in PubMed from 2005 to 2025, found 1500+ studies utilized the ALSFRS-R as a primary outcome measure including Schmitt et al 12 and more13,14 but only 18 studies concurrently used standardized performance-based rehabilitation measures such as the 10 m Walk Test (10MWT) in Inam et al 9 or quantitative strength testing with handheld dynamometry as in Shefner et al. 15 Increased knowledge about the potential predictive value of rehabilitation measures used would aid ALS clinicians in delivering quality relevant care. The spectrum of impairments seen in pALS requires that several measures be available for each deficit or participation area, to capture the various levels of function.
A case-series by Held-Bradford et al 16 explored how phenotype classification combined with movement system diagnosis could impact clinical decision-making. Clinicians seeking to tailor their recommendations for daily activities and exercise may benefit from utilizing baseline data from movement and strength outcome measures, however more information is needed on the patterns of change on these measures in pALS by phenotype. This may enable the goals of exercise to slow progression, improve comfort, and impact strength and mobility for participation in other daily activities. 17 Specifically, more information such as normative data and rate of change over time for pALS across these outcomes could help improve care and establish priorities and measurement of interventions. 18 It would be valuable to illustrate how therapy services can slow progression in degenerative conditions like ALS instead of solely a focus on improvement on standardized measures. 17 Comparing progression in ALS to patterns of phenotypic progression could add value for decision-making for effectiveness of interventions and potential prediction of change over time for equipment recommendations. Given the variability in phenotypes of ALS, a comparison of functional motor change over time is warranted to maximize patient centered care, outcome measurement, and QOL for pALS. The purpose of this study was to describe with granularity the commonalities and variability in the natural history over time of functional motor change across phenotypes of pALS to guide future research and enhance clinical decision making.
Methods
Study Design and Setting
This descriptive cohort study utilized electronic health record patient data from 2018 to 2022 from an interdisciplinary ALS clinic participating in a multisite study on the natural history of ALS. Standard of care health data was collected and submitted to the national ALS repository on the NeuroBANK platform as part of the study. Data was then requested and downloaded from the ALS repository for all variables of interest to address the study aim. Only data from 1 midwestern interdisciplinary clinic was requested and utilized, as functional motor measures were not collected regularly at other sites during this time period. All participants provided informed consent in accordance with Saint Louis University Institutional Review Board study # 28018.
As part of standard of care, participants/pALS were seen by occupational therapy (OT), physical therapy (PT), speech language pathology, dietetics, respiratory therapy, social work, nursing, medicine (neurologist) and an ALS Association care coordinator at each clinic visit. Visits included PT/OT initial baseline evaluation, followed by re-evaluation, intervention, and care coordination recommendations every 3 to 6 months. Rehabilitation interventions included recommendations for functional activities, exercise/physical activity, and equipment. Exercise recommendations include moderate intensity exercise for working muscle groups (ability to move against gravity) 2 for strength (extremity, spine, and respiratory), aerobic capacity, and balance to help maintain function for as long as possible. Equipment recommendations include least restrictive device to enhance function and safety while looking ahead to the next layer of needs as disease progresses.
Participants
Inclusion criteria for this study were confirmed diagnosis of ALS based on El Escorial criteria 19 ; site of onset designated as “bulbar,” “upper limb,” or “lower limb”; and age 18 years or older seen at the ALS clinic from 2018 to 2022. Exclusion criteria included those with an ALS site of onset designation of “general,” other motor neuron disorders such as primary lateral sclerosis (PLS) or hereditary spastic paresis (HSP), and pALS with only 1 ALS clinic visit in the 2018 to 2022 period.
Measures
The PT and OT evaluations consisted of a neurologic assessment based on best practice recommendations and ability to track change over time in ALS.1,20 Select measures from that comprehensive evaluation reported here include 10MWT and strength measured by handheld dynamometry (grip and ankle). The 5 Times Sit to Stand test 20 data collected was examined, but due to limited data (only 17 pALS across all subgroups [n = 9 bulbar, n = 5 upper limb, and n = 3 lower limb] could complete it more than 1 visit), it was not included in this analysis. Demographics on age, gender, race, ethnicity, site of onset, care delivery (number of visits), and survival data (date of death) were collected and included. Additionally, the ALSFRS-R is reported for comparison purposes.
Functional Mobility
The 10MWT was used to capture walking speed9,20 -22 with higher scores representing greater function. It is reported here as meters/second (m/s) for the average of 2 trials where available, or of a single first trial, for comfortable steady state walking. It is a reliable and valid measure 20 and has been proposed as a functional biomarker for pALS. 9
Strength
Capturing changes in strength is essential as loss of muscle strength is the main source of functional decline in ALS. Grip handheld dynamometry (HHD) progression in ALS 23 has documented decline over time in pALS.15,24 Handheld dynamometry for grip (Jamar Hydraulic) and ankle dorsiflexion (Lafayette Manual Muscle Tester, model 01165) was used to capture strength of the upper extremity (UE) and lower extremity (LE), respectively. Roberts et al 25 established a standard testing protocol for grip HHD and report reliability and reproducibility of grip dynamometry to be good to excellent. Shefner et al 24 reported the dorsiflexion strength testing protocol with acceptable reliability as well as a high correlation of identical muscles tested contralaterally. Data is reported in pounds (lbs), with the average of 3 trials for grip, 25 and 2 trials for dorsiflexion, 24 for left and right sides. Lower scores indicate greater weakness.
Disability
ALSFRS-R 10 was used to capture overall ability and disability across gross motor, fine motor, speech, and respiratory domains. It was completed as a clinician proxy report by the neurologist based on clinical interview with the pALS and care partners present. It is a 12-item ordinal scale rated 0 to 4 with a total score of 0 to 48. Lower scores reflect greater disability. 10 It is reliable and correlates with survival. 11
Analysis
Continuous variables of interest were assessed for normality using the Shapiro–Wilk test. Next, demographic information at baseline was compared across site-of-onset groups (median, interquartile range [IQR], and percentage). Walking speed (10MWT in m/s), grip strength (right and left, HHD in lbs), ankle strength (right and left, HHD in lbs), and ALSFRS-R (total score) were analyzed at 3-month intervals and are presented as a median score across trials conducted at each visit. Given the progressive nature of ALS, not all but most functional tests were completed at each visit; a zero value was recorded if pALS unable to complete a test due weakness.
For the 10MWT, grip HHD, ankle HHD, and ALSFRS-R measures, the following descriptive statistics were calculated: median, min–max baseline (initial) visit score, median change score between visits, and median percentage change between visits. Change score and percentages were calculated between visits in sequential order, (second visit − first visit)/first visit × 100 and so forth. Change over time was visually represented with a spaghetti plot for each variable, where each patient trendline is represented in a different color. A smoothed average line with a shaded 95% confidence interval was applied to each plot where more than 10 participants were included. Comparative cut-off scores and norms were added to figures. The European Working Group on Sarcopenia in Older People established the cut-off points for weak grip strength to be less than 27 kg/59.9 lbs for men and less than 16 kg/35.3 lbs for women. 26 Normative dorsiflexion strength scores from healthy controls are 38.03 lbs for right and 38.46 lbs for left dorsiflexion strength. 24 Age-referenced normative gait speed is 1.24 m/s. 27 An adverse event line was added at 0.7 m/s, given increased risk for falls, hospitalizations, need for a care partner, or fractures for the 10MWT. 28 An “x” symbol was recorded on the graph indicating a patient’s death. A Kaplan Meier survival curve was constructed, contingent upon community ambulator status, where a walking speed of greater than 0.8 m/s determined the patient had community ambulation. 29 The survival curve was stratified based on the site of onset. This comprehensive analysis was carried out in R version 4.2.2 leveraging the functionalities of the “dplyr,” “tidyverse,” “ggplot2,” “survival,” and “survminer” packages.
Results
Demographics
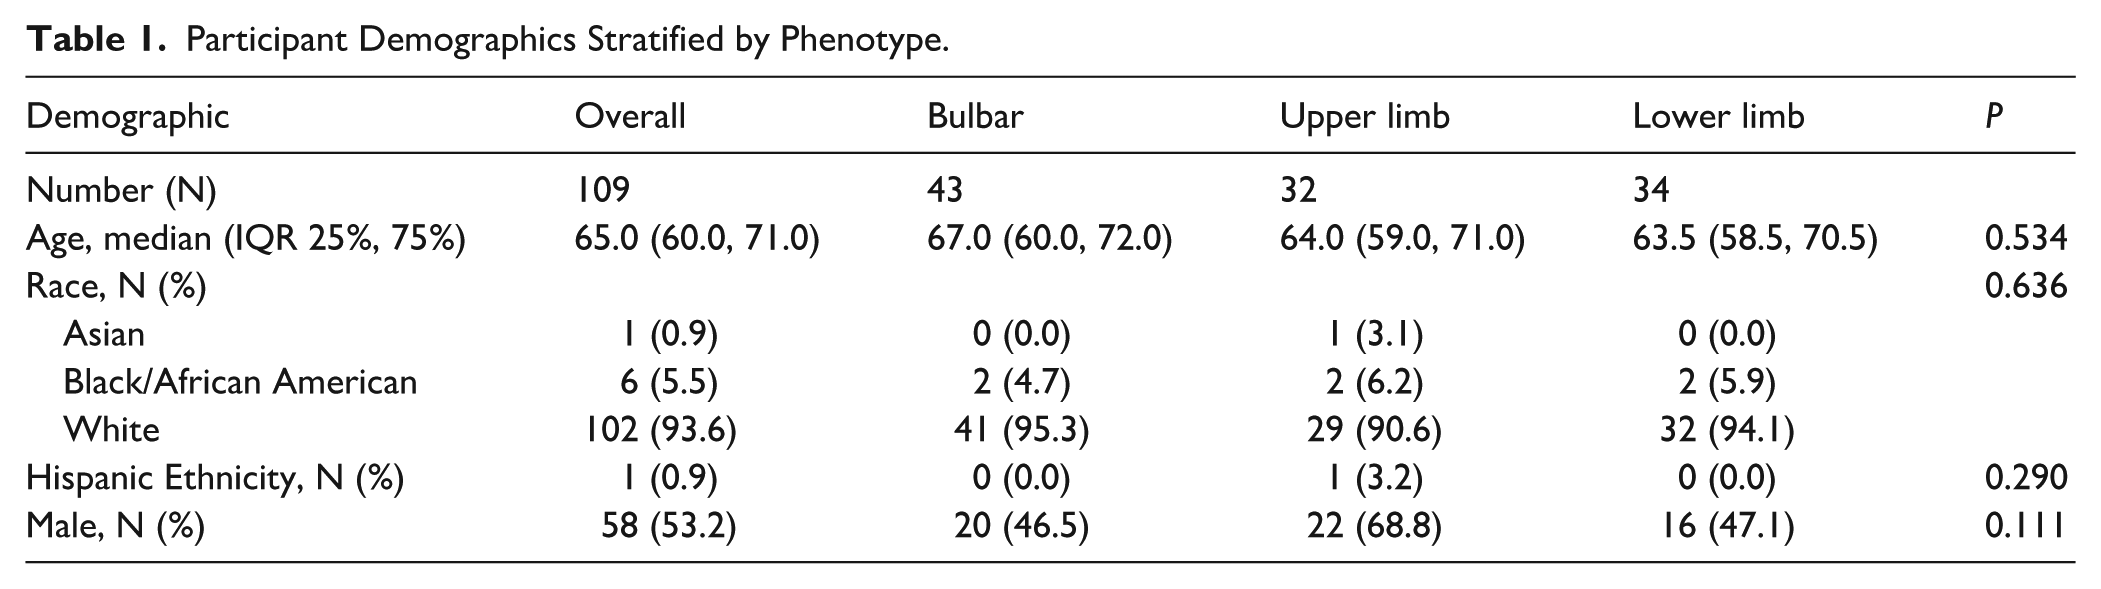
Out of the 119 unique pALS seen at the ALS clinic during 2018 to 2022, 109 participants with a bulbar, upper limb, or lower limb site of onset ALS met the inclusion criteria. Two pALS declined study participation, 6 did not have a confirmed diagnosis of ALS (3 were diagnosed with PLS and 3 with HSP), 1 had site of onset classified as “general” and 1 only came to 1 visit. Demographic data was examined across site of onset groups (Table 1). Most of the participants reported their race as white and their ethnicity as not Hispanic or Latino (Table 1). The average age was 65 years.
Participant Demographics Stratified by Phenotype.
Clinic Visits and Change Over Time
The average number of visits per patient was 6; average time between visits was 3 months. Median, min, and max scores for baseline scores and change and percent change scores ([second visit − first visit]/first visit
Median Baseline and Change Scores at ALS Clinic Visits across Phenotypes.
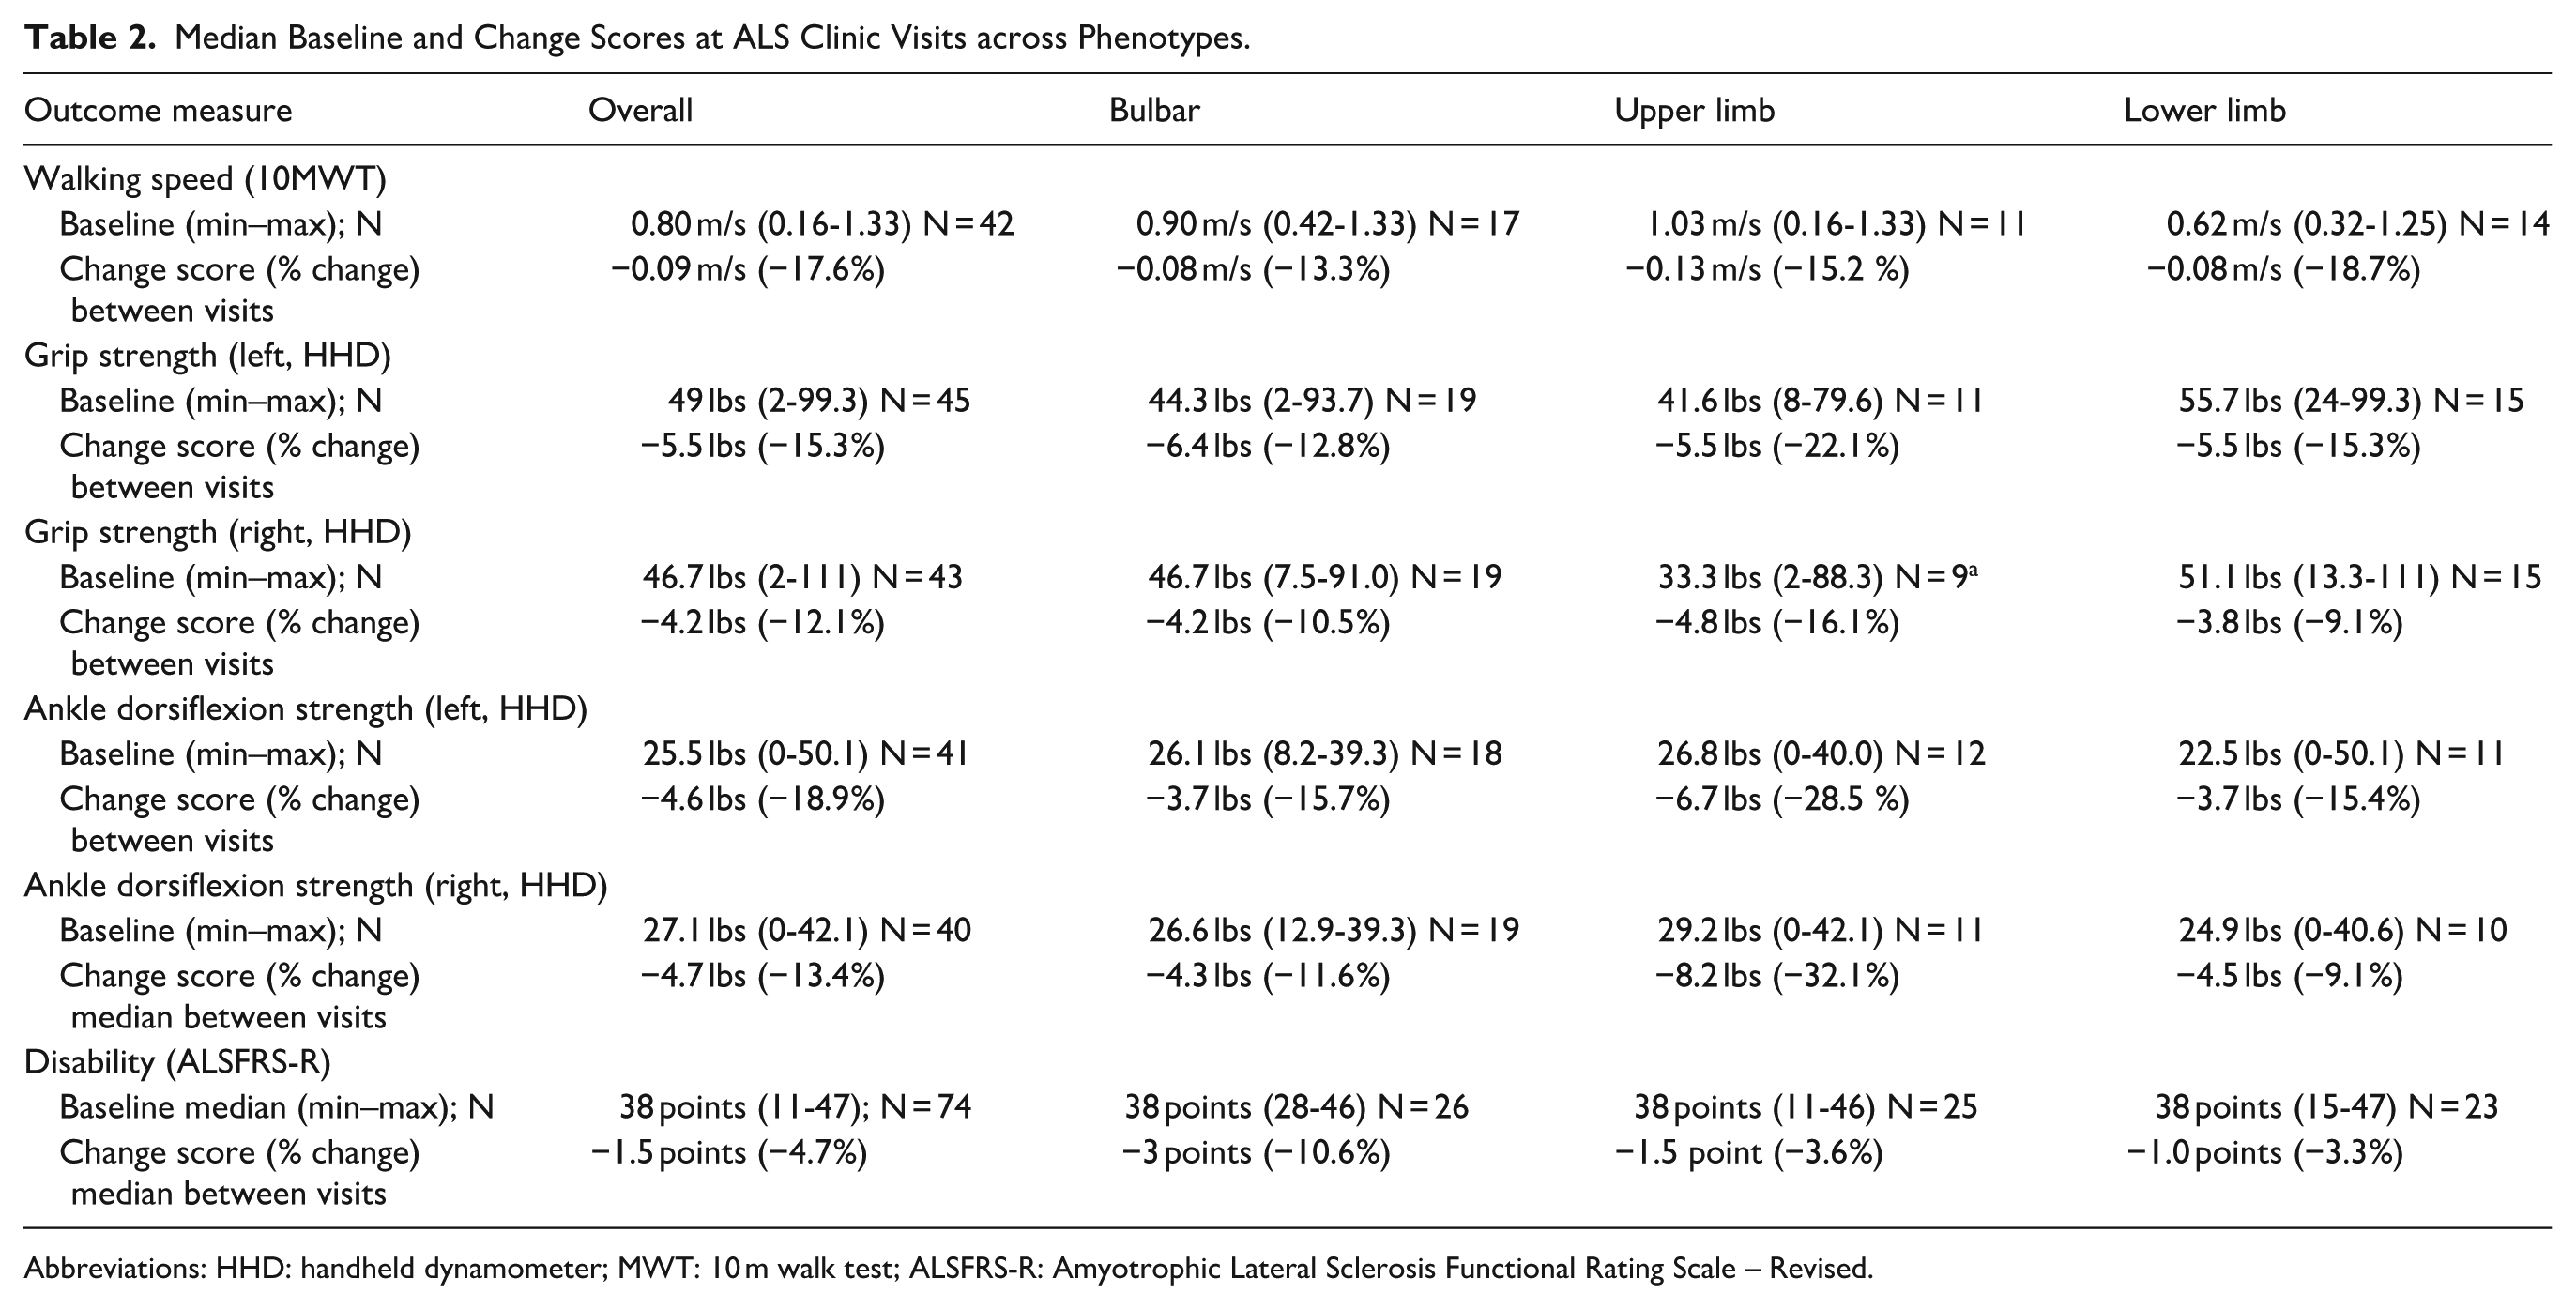
Abbreviations: HHD: handheld dynamometer; MWT: 10 m walk test; ALSFRS-R: Amyotrophic Lateral Sclerosis Functional Rating Scale – Revised.
Walking Ability (10MWT)
Patterns of change in walking speed varied within and across groups (Table 2, Figure 1, n = 42). The 10MWT yielded a median (min–max) baseline visit walking speed for all phenotypes of 0.80 m/s (0.16-1.33 m/s) and median walking speed change and percent change between visits of −0.09 m/s (−17.6%). The smooth average lines on the spaghetti plots (Figure 1) for each phenotype were above the adverse event/fall line 0.70 m/s at baseline except for lower limb onset, but below the age referenced norm of 1.24 m/s.27,28 The rate of decline was steepest for the upper limb onset, occurring within the first one and a half years post diagnosis, noting upper limb also had the highest initial baseline score of 1.03 m/s. Lower limb onset had the greatest percent change between visits over time and the lowest baseline walking speed.
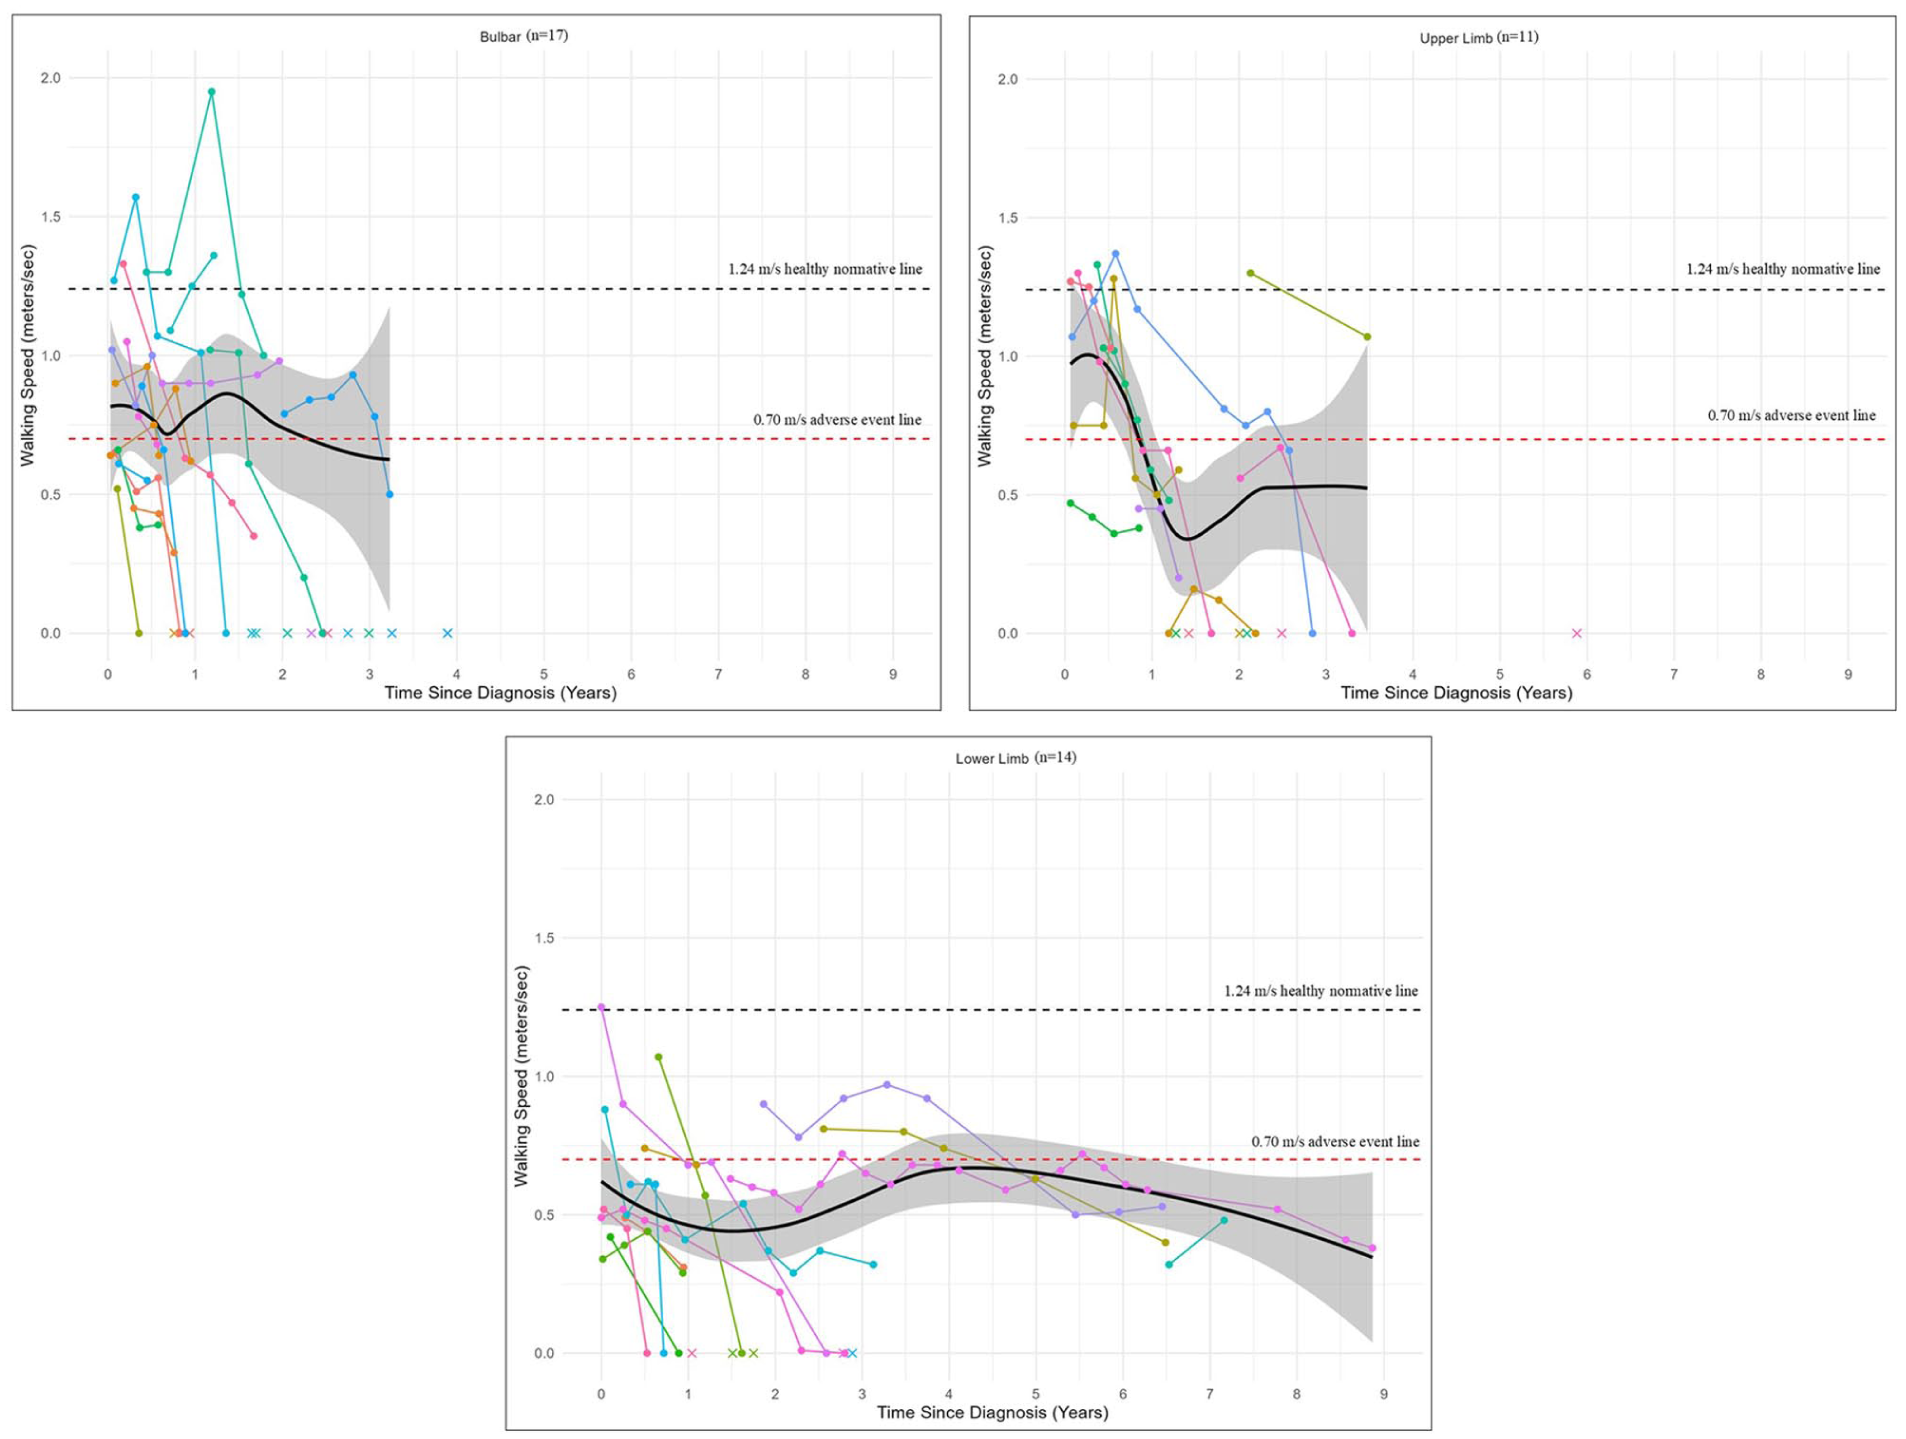
Change in walking speed over time by phenotype.
Individual variability on the spaghetti plots shows several pALS were at or above the normative walking speed at baseline or a follow up visit in each phenotype group (n = 4 bulbar, n = 5 upper limb, and n = 1 lower limb). No pALS maintained normative walking speed ability two and a half years post diagnosis, and none in the lower limb onset group maintained normative walking speed more than 6 months post diagnosis. Only pALS with lower limb onset had data for walking greater than 3 years post diagnosis.
Upper Extremity Strength (Handheld Dynamometry – Grip)
Patterns of change in grip strength were compared across phenotypes (Table 2, Figure 2). Median left and right grip strength was highest at baseline for lower limb onset. Median percent change between visits across all phenotypes for grip was left, −15.3% or −5.5 lbs and right, −12.1% or −4.2 lbs Median grip strength percent change/decline was greatest in the upper limb onset for both left (−22.1%) and right (−16.1%), followed by the lower limb onset on the left (−15.3%) and then bulbar onset for the left (−12.8%) and right (−10.5%).
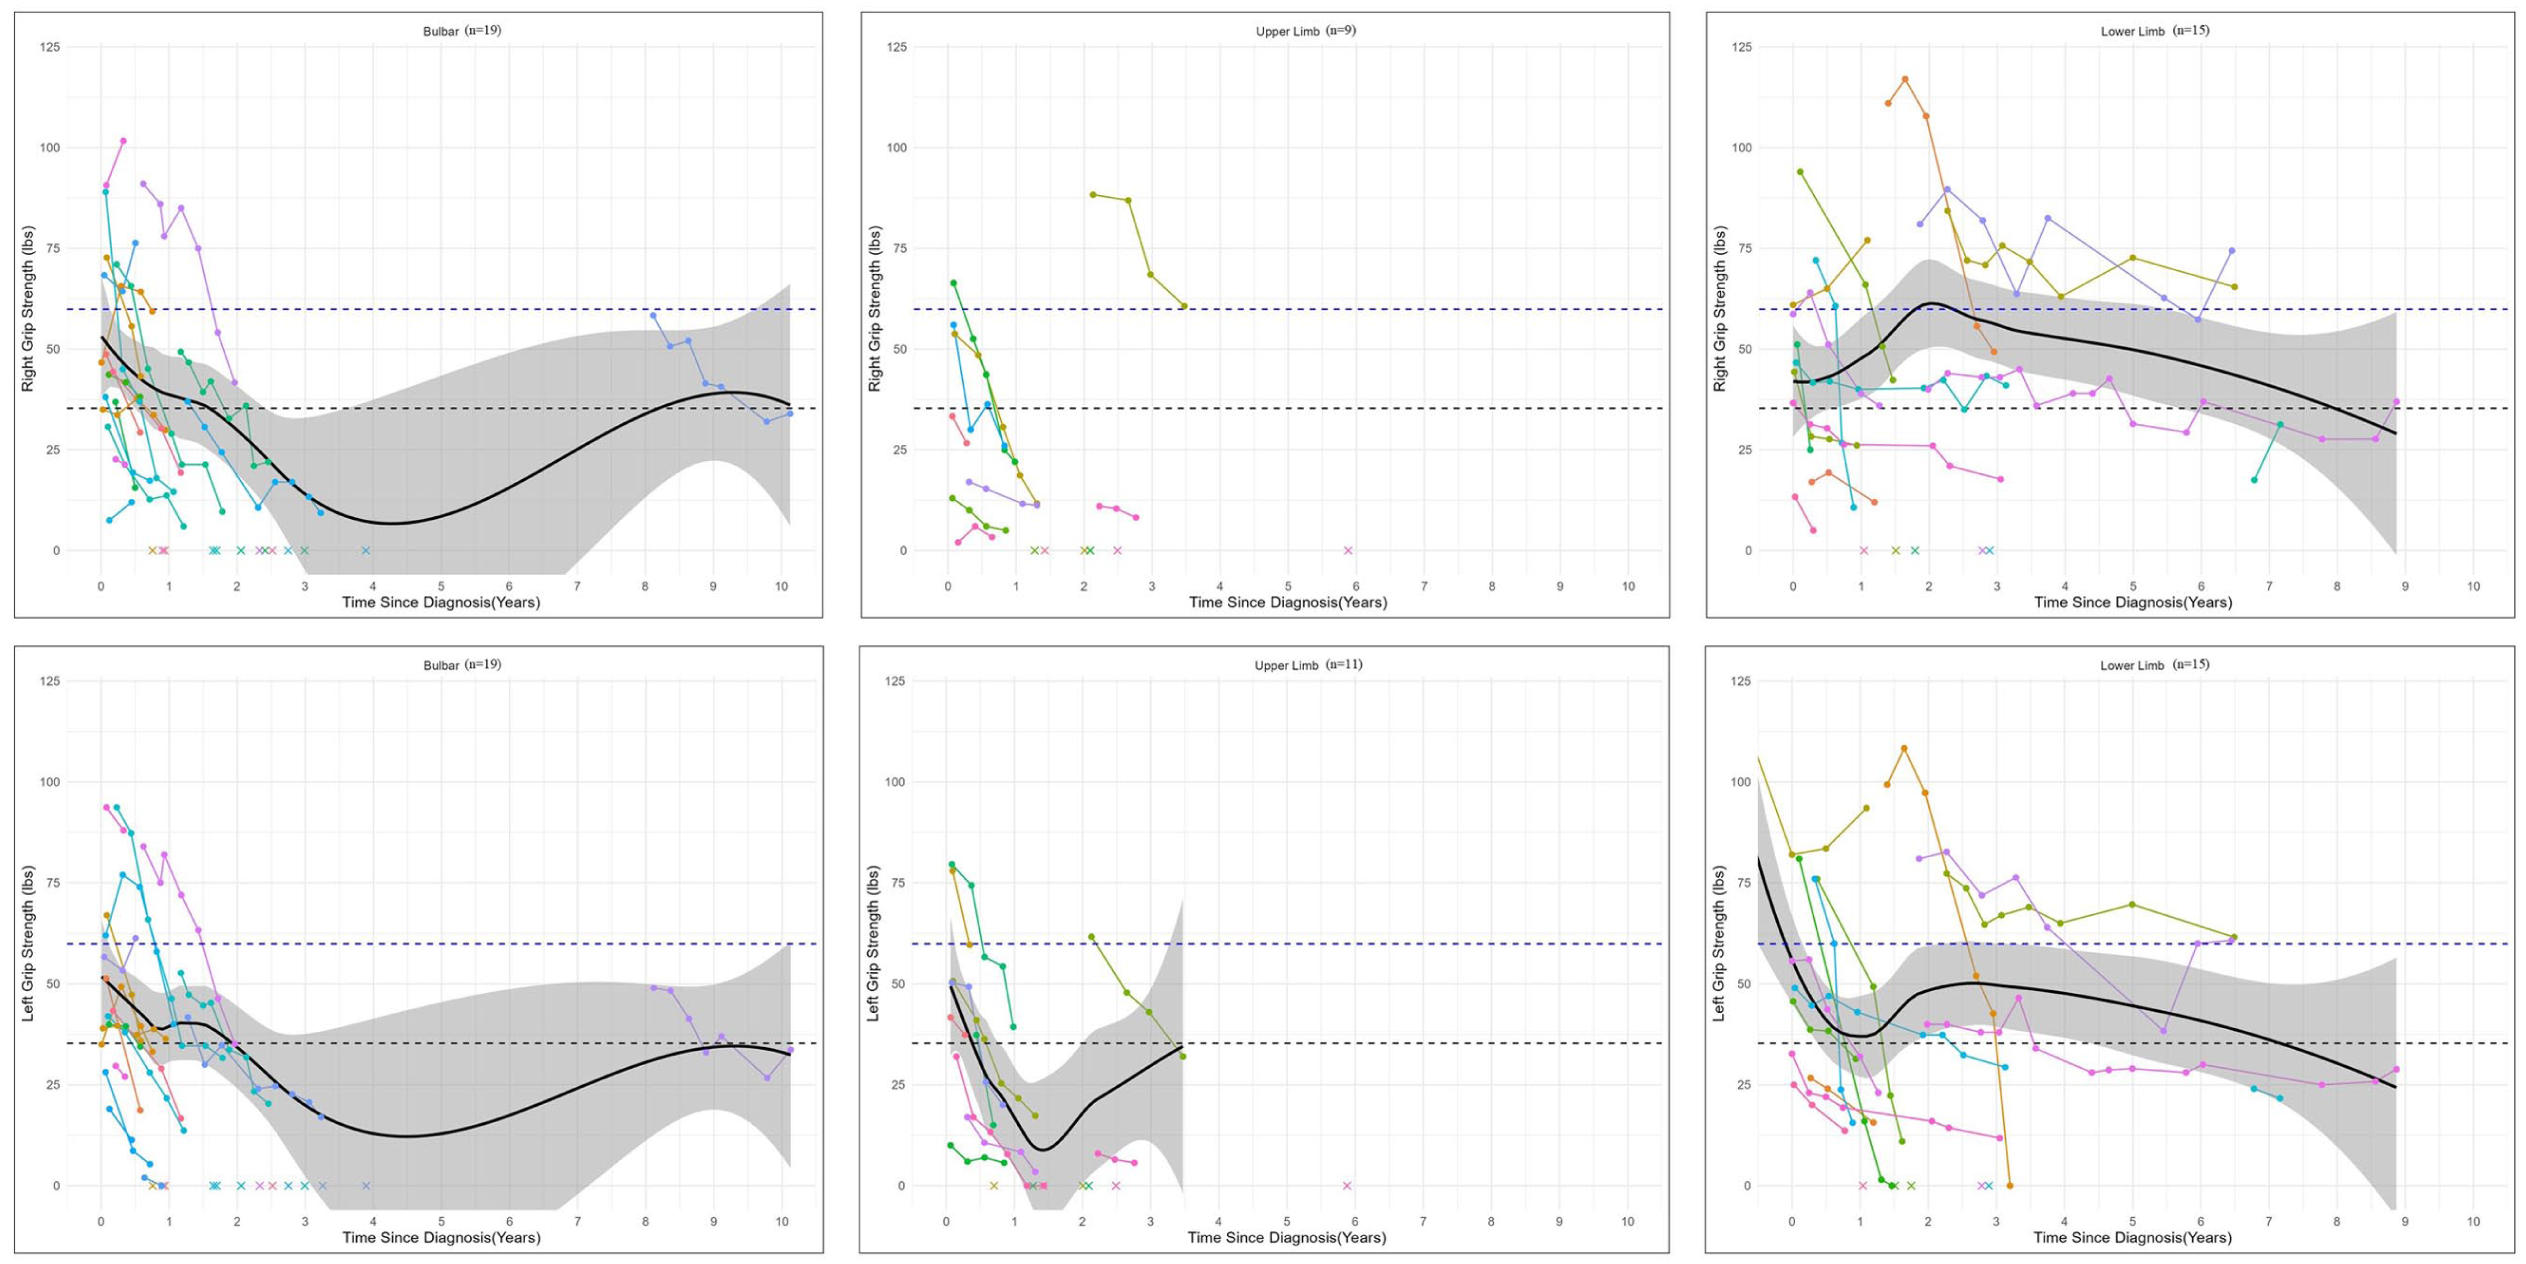
Change in grip strength over time by phenotype.
The smooth average lines of the spaghetti plots show varying rates of decline in strength (Figure 2) across pALS. Grip strength shows bulbar and upper limb onset with a greater change compared to lower limb onset. Individual variability on the spaghetti plots includes the average (in lbs) cutoff for sarcopenia in women and men. Seven of 19 pALS with bulbar onset presented with greater than 59.9 lbs of right grip and 6 with left grip greater than 59.9 lbs; 5 pALS in the bulbar group presented to clinic below the 35.3 cutoff for left grip and 4 for right grip. One outlier pALS with bulbar onset had grip data recorded between 8 and 10 years past diagnosis which affected the smoothed average line but highlights the variability. The lower limb onset group shows relatively equal numbers of participants who present above and below the cutoffs, showing great variability in the initial presentation and rate of change with some demonstrating quick decline of grip strength with death prior to 3 years while others have a gradual decline in grip over several years.
Lower Extremity Strength (Handheld Dynamometry – Dorsiflexion)
Patterns of change in ankle dorsiflexion strength (Table 2, Figure 3), showed both similarities and differences to patterns of changes seen in walking speed with the 10MWT. The highest baseline dorsiflexion strength was in upper limb onset and lowest in lower limb onset, reflecting the same pattern across phenotypes seen in walking speed. Conversely, dorsiflexion strength percent change was greatest in upper limb onset, (left) not in lower limb onset as seen with walking speed. Median baseline dorsiflexion strength for all participants was left 25.5 lbs (n = 41), right 27.1 lbs (n = 40; Table 2). Median change and percent change between visits across all phenotypes was left −18.9% (−4.6 lbs), right −13.4% (−4.7 lbs).
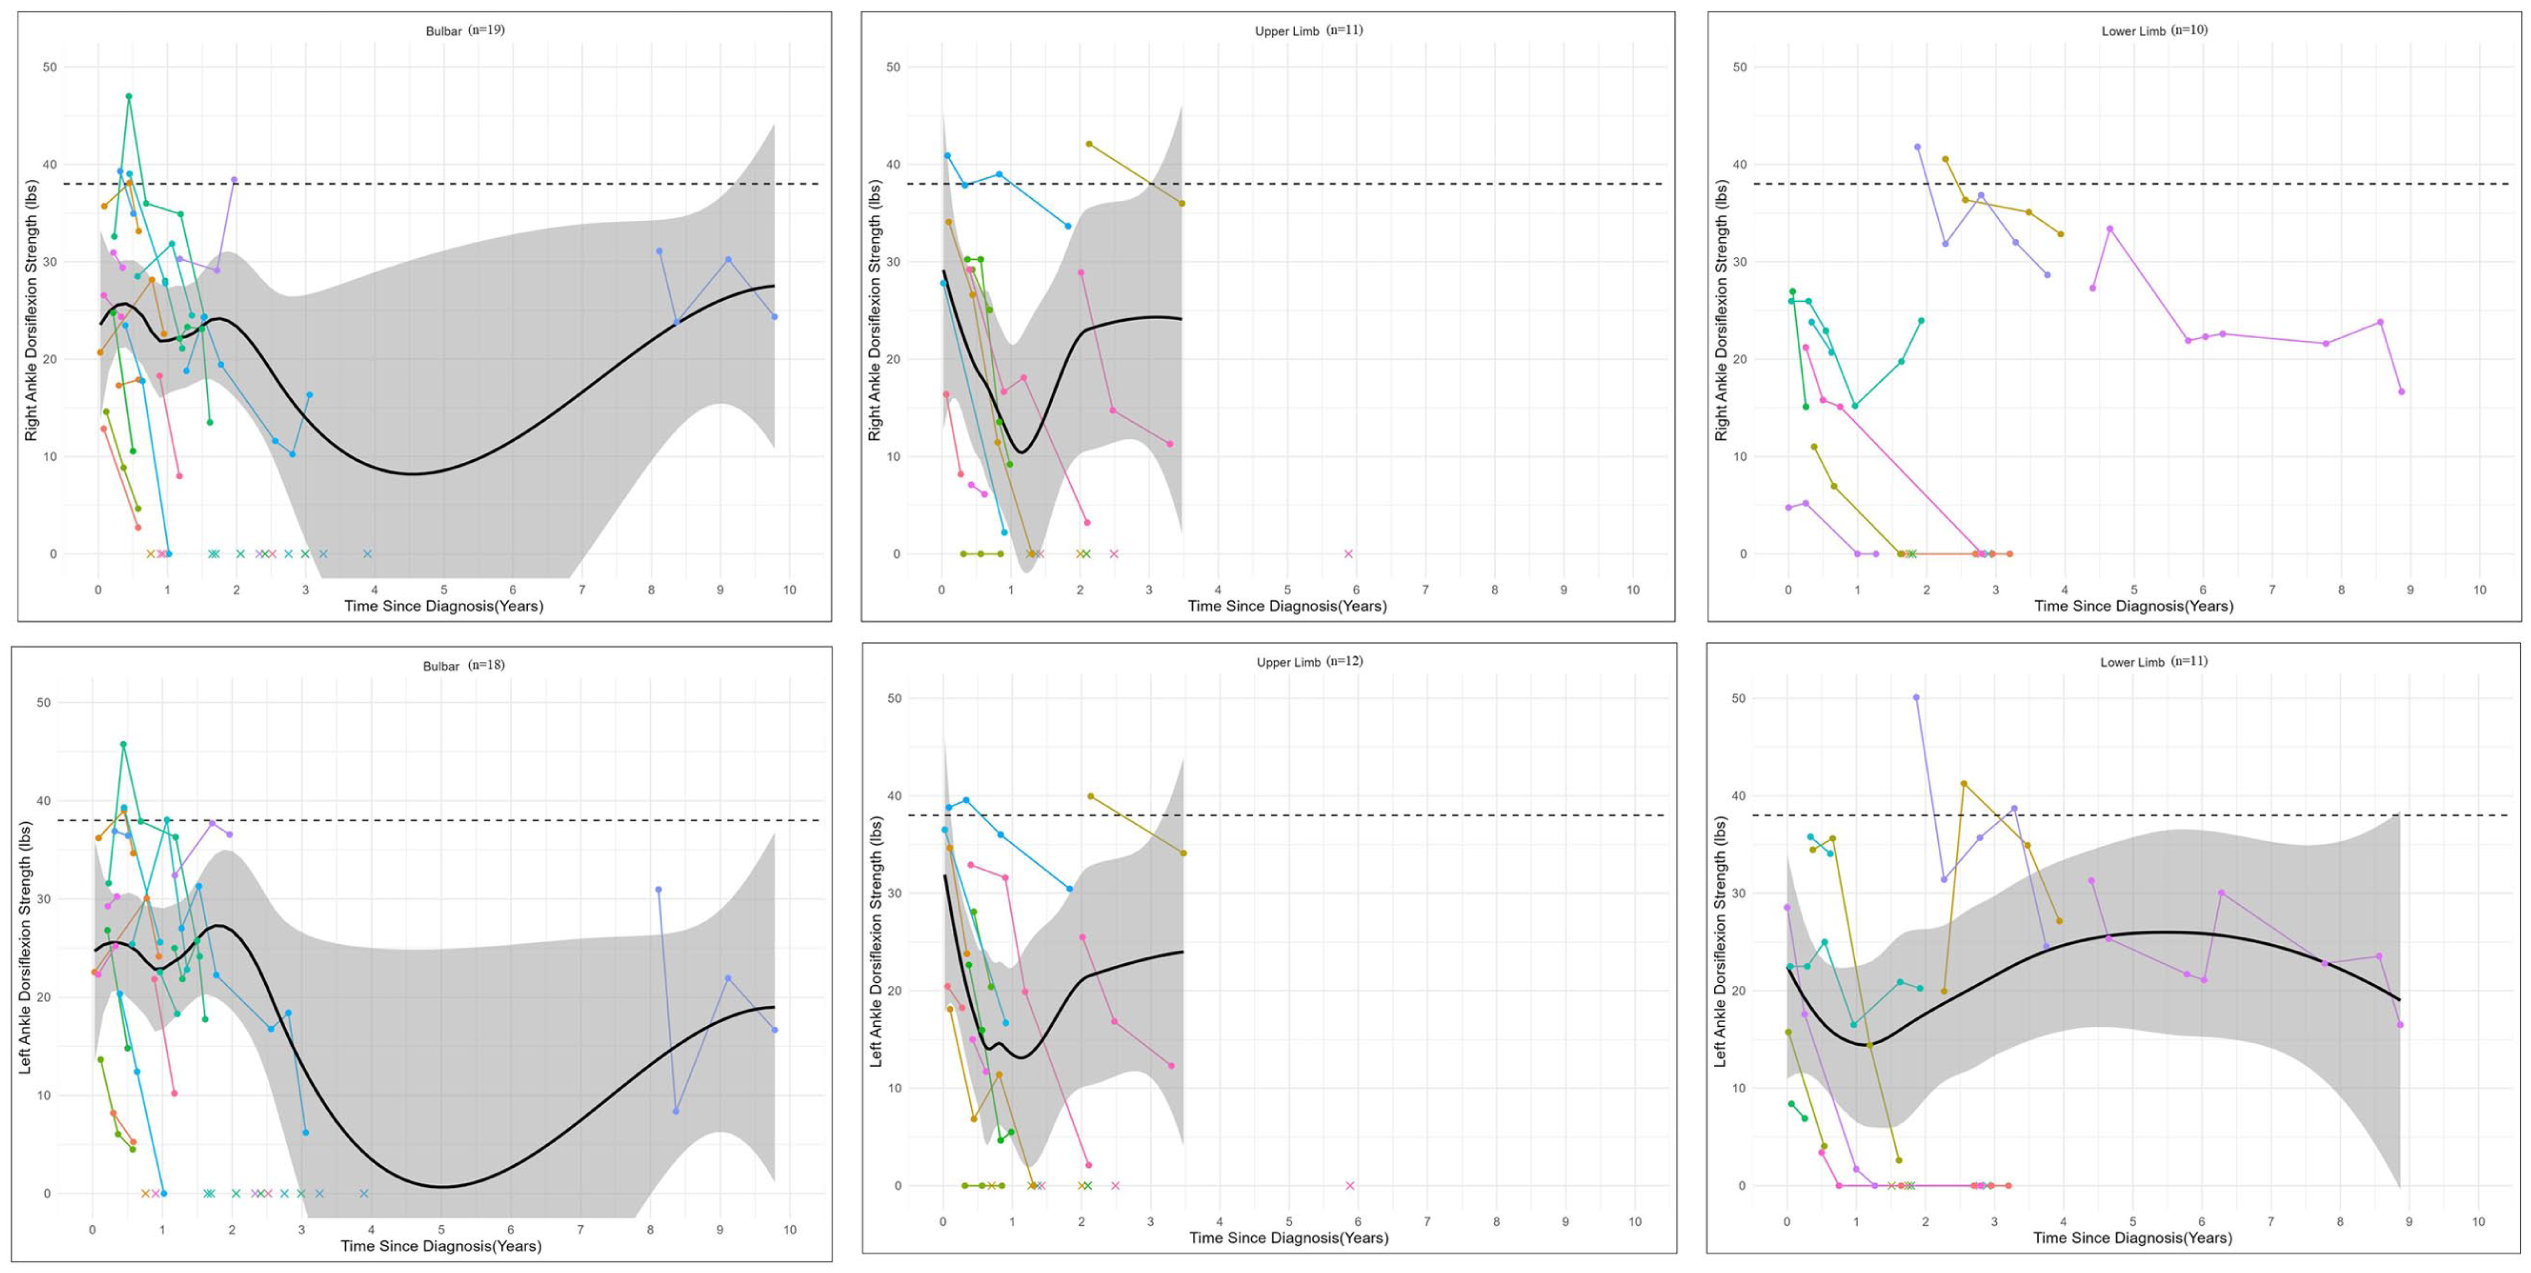
Change in ankle dorsiflexion strength over time by phenotype.
The smoothed average lines on the spaghetti plots (Figure 4) for each phenotype group were below the healthy adult norm of 38 lbs at baseline. 24 In both left and right ankle dorsiflexion, upper limb onset had the most drastic decline in the first one and a half years after diagnosis. Individual variability on the spaghetti plots (Figure 3) though shows several pALS were at or above the normative 38 lbs for dorsiflexion strength in each phenotype (n = 4 bulbar, n = 3 upper limb, and n = 2 lower limb). Unfortunately, none maintained normative dorsiflexion strength 3 years post diagnosis.
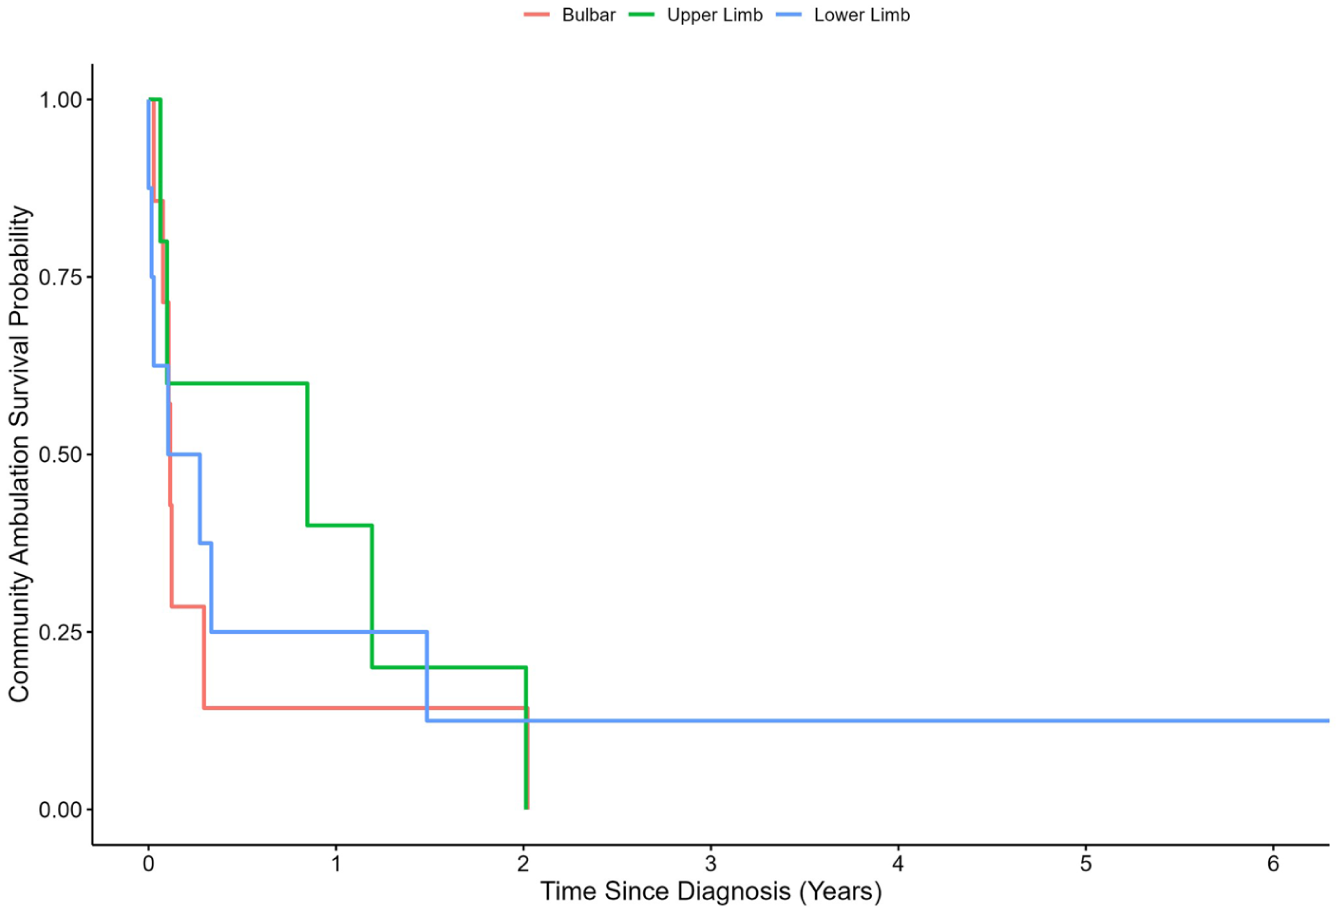
Survival curve of community ambulation over time by phenotype.
Community Ambulatory Ability (Walking Survival Curve Based on 10MWT)
Those with bulbar onset and lower limb onset appeared to progress to non-community ambulation ability more quickly than those with upper limb onset (Figure 4). Here survival probability, representing maintenance of community ambulation ability (walking speed of greater than 0.80 m/s) 29 at 1 year post diagnosis, was seen in greater than 0.50 (50%) of those with upper limb onset, compared to less than 0.25 (25%) of those with bulbar and lower limb onset at 1 year. This difference attenuated across phenotypes at 2 years. This finding is consistent with the 10MWT walking speed data, illustrating lowest baseline walking speed was in limb onset (0.62 m/s). Regarding change over time, upper limb had greater change than bulbar. This is likely due to the higher baseline walking speeds of upper limb (upper limb 1.03 m/s vs bulbar 0.90 m/s). The statistical significance of these observations was not determined due to limited sample size and primary descriptive aim of this study and thus must be interpreted with caution.
Overall Disability Status (ALS Functional Rating Scale – Revised)
Baseline median ALSFRS-R scores were 38 points for all 4 groups (Table 2). Patterns of change in median scores showed more rapid decline in bulbar, followed by upper limb onset, then lower limb onset. Median change and percent change between visits was −1.5 points (−4.7%) for all pALS, −3 points (−10.6%) for bulbar onset, −1.5 points (−3.6%) for upper limb onset, and −1.0 points (−3.3%) for lower limb onset. This is below the clinician reported “somewhat meaningful change” of 20%. 30 Additional ALSFRS-R data can be viewed in Supplemental Figure 1. The smoothed average lines for all phenotypes showed the sharpest decline within the first one and half years for each phenotype. Afterwards upper limb showed steady decline over 5 years, while lower limb demonstrated greater maintenance of function for pALS who lived more than 3 years after diagnosis. Individual variability shows 1 pALS with bulbar onset who maintained relative stability above an ALSFRS-R score of 20, consistent with outlier presence for strength measures. Of note, this pattern of preservation of ability in bulbar onset greater than 3 years was not seen with carry over to function with walking speed (10MWT).
Discussion
These results begin to fill the knowledge gap on functional motor change over time and variability within this change based on 3 phenotypes of ALS. Outliers in our sample highlight the variability commonly missed in comparative studies. The granularity of change seen over time illustrates the potential importance of distinguishing upper from lower limb onset ALS. While clinically bulbar versus limb onset has been an important part of an initial intake for healthcare providers, the patterns seen here with upper limb onset retaining community ambulation status one year longer than bulbar and lower limb (Figure 4) but greater decline in strength and overall disability than lower limb, emphasize the importance of noting specific site of onset to guide prognosis and clinical decision-making. The rate of decline in our sample showed relative stability, in that it was greater than 10% but less than 20% between visits/every 3 months for most measures.
This concept of relative stability (less than 20% change) over a 3-month period may be compared conceptually to the minimal clinically important differences (MCIDs) for walking speed in healthy older adult patients (0.13 m/s) 31 and the minimal detectable change (MDC) of other diseases like Parkinson’s Disease (0.18 m/s). 32 Upper limb onset demonstrated a 10MWT decline equal to the MCID of −0.13 for healthy older adults and a greater than 20% decline in left grip and in bilateral dorsiflexion strength indicating it was an exception to the relative stability seen across pALS in this sample. This pattern of higher rates of decline in strength but the overall greater preservation of walking ability in upper limb onset ALS may be due to their highest baseline score for ankle dorsiflexion strength and 10MWT compared to lower limb onset and bulbar onset; and their hypothesized higher respiratory function than those with bulbar onset. This observation is consistent with mechanistic models of disease spread in ALS that show upper limb onset is most likely to demonstrate horizontal spread to the opposite upper limb (64.2%), before vertical spread to the lower limbs (27.5%), and then finally to the bulbar region in the brainstem (8.3%). 33
Overall, across our measures, percent change/decline was greatest in strength, followed by 10MWT and ALSFRS-R. This finding may indicate greater sensitivity to capture change in motor function over time in HHD strength and 10MWT than the gold standard ALSFRS-R. Fournier explores the strengths and weaknesses of the ALSFRS-R which include its limited responsiveness, capture of domains versus functional status, and difficulty with its non-linear weighted nature. 11 The total score and subdomains of the ALSFRS-R provide important data used by healthcare providers for care decisions such as timing of hospice, or when to consider loaner versus insurance ordering of durable medical equipment and power wheelchairs. However, the ALSFRS-R alone is not sufficient to guide OT/PT practitioners in their clinical care of pALS; in this sample the total score was nearly identical (28) across phenotypes. The multidisciplinary team should consider use of the ALSFRS-R and objective measures of strength, mobility, and respiratory status to make holistic recommendations for next steps in patient care.
Strength
Our data shows that capturing HHD strength data in upper and lower limbs is critical to capture disease progression and is clinically feasible. Grip dynamometry specifically was quick and easy to record, captured changed over time in our results across phenotypes, and is associated with disease progression in ALS.15,23 Hand grip strength is associated with functional independence, 34 disability and frailty, 35 and mortality 36 in healthy and older adults. Use of HHD on an interval scale allows greater granularity and sensitivity than traditional ordinal manual muscle testing. While critiques of HHD note its operational challenges with training and reliance on clinician strength, utilization of only grip and dorsiflexion strength minimizes these barriers. 37 Grip strength testing is not influenced by the clinician and the smaller relative size of the dorsiflexors compared to other LE muscles reduces the influence of clinician strength variability. Our study confirms prior studies 38 that ankle dorsiflexion was the most consistently recorded value among all the LE muscle groups tested and had the most data available to compare over time. Ankle dorsiflexion strength has been correlated with falls, 39 gait abnormalities, 38 and overall physical function. Collectively, this is important as it supports the feasibility and acceptability of implementing 2 quantitative HHD measures of strength, upper and lower, in a busy clinical environment as standard of practice. Additionally, use of the HHD allows comparison to norms 24 and hopefully, to function in future projects. For example, is 20 lbs of grip truly what is needed for most activities of daily living? 26 We know strength correlates with progression in ALS,15,23,24 but further work is required to understand how strength correlates to function, predicts progression, and, most critically, how it can be modified with intervention.
Activity-Based Outcomes
Our data support the 10MWT utility in capturing walking speed change over time, allowing comparison to normative data,18,27 adverse event risk, that is, falls, hospitalization, need for a care partner, fracture, etc., 28 and MCID and MDC in other populations.21,32 We hypothesize that the retention in walking speed seen in upper limb onset may be due to the relative higher baseline strength and relative slower rate loss of overall function of upper limb onset compared to bulbar onset (potentially impacted by respiratory status on ALSFRS-R), and higher baseline walking scores allowing longer retention of walking. Alternatively, our sample may have had a larger than typical presentation of those with upper limb onset ALS fitting the criteria for flail arm syndrome, which has documented slower overall disease progression. The slower progression in flail arm syndrome (aka brachial amyotrophic diplegia) is theorized to be due to higher percentages of lower motor neuron involvement in the upper extremities and higher percentages of upper motor neuron involvement in the lower extremities impacting disease progression with a predominance of horizontal versus vertical spread. 40 Newer classification models such as the “OPM classification” indicate prognosis is best explained by the combination of the region of onset (O), propagation of motor symptoms/spread (P), and prevalence of upper versus lower motor neuron involvement (M). 41 Given our sample demonstrated slightly faster overall progression per the ALSFRS-R by upper limb onset (−1.5 points [−3.6%]) versus lower limb onset ALS (−1.0 points [−3.3%]), a higher prevalence of flail arm syndrome is less likely, but conceptually speaks to the complexity and variability in ALS making clinical decision making and prognosis challenging. 41
While collectively across all groups pALS had baseline median walking speed of 0.80 m/s which is below the healthy norm of 1.24 m/s 27 and consistent with previous literature in ALS, 18 several pALS in our sample with bulbar and upper limb onset were above the norm at 1.33 m/s at baseline, signifying the clinical importance of outliers. Based on our sample, previous literature9,20 and comparing to other measures, we feel the 10MWT has the best overall utility for capturing performance-based functional mobility in ALS clinics. While the Timed Up and Go Test also has established utility in ALS,18,42 it is limited by its inclusion of independence with sit to stand. In our sample, the 5 Times Sit to Stand Test 20 could not be completed over successive visits independently for most pALS. Finally, the 6 Minute Walk Test which measures community-level ambulation has demonstrated established utility in ALS but takes significantly longer to complete and requires more aerobic capacity and strength. Given these considerations, we feel the 5 Times Sit to Stand Test and 6 Minute Walk Test are helpful measures but may not be priority measures in ALS clinics to capture change over time across disease stages in busy clinic environments.
Clinical Practice Implications
Implications for clinical practice can be drawn, with caution, from these results for utilizing percent change on measures to guide clinical decision making for treatment and physical activity prescription. Using client ALS phenotype and results from these outcome measures repeated at regular intervals allows for setting realistic and more individualized goals across settings as well as decision-making around the treatment approach as restorative (in the short term) or compensatory for specific activities (long-term). Castrillo-Viguera 30 found that 20% to 50% changes in decline on the ALSFRS-R were clinically relevant, with 10% less so. This model for percent change is also seen in Parkinson’s Disease and Multiple Sclerosis.32,43 If the percent change on HHD or 10MWT is less than 10% in pALS, it may indicate that either the curve of progression is slowed, or that they gained some strength or mobility through exercise, practice, and/or use of adaptive equipment or mobility devices. For example, when provided with a new cane or walker, pALS may perform better on the 10MWT. Additionally, progressive strength training has shown good tolerability in pALS early in disease course. 44 Conversely, a decrease of 30% on grip HHD could guide the therapist to suggest adaptation of activities with compensations such as an electric kitchen appliance or smart home feature like key fob door locks. Connors et al examined adaptive equipment use 45 and assistive technology use 13 by people with motor neuron disease, the majority of which had ALS, and found different patterns of device use by phenotype and increasing use with decrease in ALSFRS-R scores.13,45
Practice implications for exercise prescription and prevention of falls can also be drawn cautiously from our data. Moderate intensity physical activity has been shown to be safe and beneficial for pALS, even potentially slowing disease progression.17,46 Regular measurement of HHD could assist practitioners with physical activity and exercise program prescription, utilizing rate of change as a guide. Tracking the impact of these interventions would allow the therapist to view any changes or protective effect, if continuing to administer measures at regular intervals. Identification of pALS at risk for falls also aids in treatment plan development. The median baseline score for all pALS on the 10MWT was 0.80 m/s, with lower limb onset having the lowest baseline score of 0.62 m/s. This indicates that lower limb phenotype pALS group had a risk of falls (below the cut-off of 0.70) 28 prior to their first visit to a multi-disciplinary clinic per the 10MWT.
The rehabilitation field continues to move toward the goal of precision medicine, with use of normative data, MCID, and MDC thresholds critiqued in patient care documentation. Currently there is a greater focus on improvement rather than slowing progression when using rehabilitation outcome measures with little available on the application of MDC and MCID to illustrate clinical service value.47,48 More information such as MCIDs, normative data, and rate of change over time for pALS across outcome measures in this study could help establish priorities and measurement of interventions and aid decision-making of OT/PT practitioners.
Limitations
Several limitations should be noted and considered in interpreting our findings. First, statistical testing for group differences regarding patterns of change was not performed. While this decision was appropriate given the study’s descriptive aim, additional study is needed to confirm or refute patterns observed. Given the small subgroup sizes in this descriptive project, we were not powered to evaluate the influence of certain factors on individual trajectory differences, including genetic predisposition, environmental influences, and treatment-related factors but the importance of these factors is noted. Non-parametric measures of central tendency (median scores) were presented in Table 1 and 2 as data was non-normally distributed but given the limits of median scores to show variability, the mean trend and 95% confidence interval was deemed necessary and used in the spaghetti plots (Figures 1-4). We believe this diversity of presentation enriches the lens with which to view the data. Second, percent change was calculated starting with the initial visit to the ALS clinic, not from time of diagnosis or symptom onset, as not all first visits correlated with diagnosis/symptom onset. This is common in clinical practice and may enhance generalizability. Missing data did occur due to pALS fatigue, pALS inability to complete the test due to disease progression, clinician time constraints, and impact of COVID-19 pandemic between 2020 and 2021, but most pALS had data for at least 6 visits over one and a half years. Third, we did not stratify by hand dominance 49 or laterality of onset of disease progression in the grip strength data analysis due to limited sample size. Strength testing was always completed bilaterally at each clinic visit.
Future Directions
It is crucial to implement outcome measures that hold prognostic value in ALS. There is a need to establish a MCID for HHD to enhance its utility as an outcome measure in assessing muscle strength in ALS patients. Further research will enable clinicians to interpret changes in strength more accurately and effectively monitor disease stability/progression. Investigating the impact of structured exercise programs on disease trajectory utilizing these outcome measures can provide valuable insights into interventions to improve functional and QOL for pALS. Measures such as time to first fall and mobility device usage can serve as important indicators of disease progression and functional decline. Some measures are missing in this data set that hold potential value for comprehensive evaluation: UE functional testing, trunk control, QOL, and additional activity/participation measures. Research is needed to determine which measures should be considered best practice to improve clinical decision making in ALS through correlational studies. These rehabilitation measures should be included in data repositories like NeuroBANK to facilitate more comprehensive data collection across research projects.
Conclusion
This study helps address the gap in ALS knowledge on detailed changes over time and the variability in that change based on 3 phenotypes, bulbar, upper limb, and lower limb onset. Outliers in our sample highlight the importance of maintaining a focus on individual change. Further research is needed to address important implications for device and equipment provision, the impact of a quick rate of decline on activity and participation, and guidelines for physical activity and exercise prescription.
Supplemental Material
sj-jpg-1-nnr-10.1177_15459683261445435 – Supplemental material for Functional Motor Change Across Time and Phenotypes in Patients With Amyotrophic Lateral Sclerosis: A Descriptive Study
Supplemental material, sj-jpg-1-nnr-10.1177_15459683261445435 for Functional Motor Change Across Time and Phenotypes in Patients With Amyotrophic Lateral Sclerosis: A Descriptive Study by Elissa C. Held-Bradford, Elisabeth DeMarco, Samantha Zocher, Kate Weaver, Kathryn Forsman, Ghazala Hayat, Divya S. Subramaniam and Meghan Doherty in Neurorehabilitation and Neural Repair
Footnotes
Acknowledgements
Thank you to Ashley Sahu, Briana Pinto, and Andrea Davis who worked on data collection, entry, and management for this project. Thank you also to the ALS consortium and NeuroBANK for their assistance in data storage and retrieval.
Author Note
Meghan Doherty was faculty at the University of Missouri at the time of submission of this work. Kathryn Forsman was faculty at the University of Illinois at Chicago at the time of submission of this work. Samantha Zocher was a data scientist at Ascension Data Science Institute at the time of submission of this work. Kate Weaver was a physical therapist at Encompass Health at the time of submission of this work.
ORCID iDs
Ethical Considerations
This project (IRB #28018) received ethical review by the Saint Louis University Institutional Review Board.
Consent to Participate
All participants provided informed consent in accordance with Saint Louis University Institutional Review Board study #28018.
Author Contributions
Elissa Held Bradford: Conceptualization; Data curation; Funding acquisition; Investigation; Methodology; Project administration; Supervision; Visualization; Writing – original draft; and Writing – review & editing. Meghan Doherty: Conceptualization; Data curation; Funding acquisition; Investigation; Methodology; Project administration; Supervision; Visualization; Writing – original draft; and Writing – review & editing. Elisabeth DeMarco: Data curation; Formal analysis; Methodology; Writing – original draft; and Writing – review & editing. Samantha Zocher: Data curation; Visualization; Writing – original draft; and Writing – review & editing. Kate Weaver: Data curation; Writing – original draft; and Writing – review & editing. Kathryn Forsman: Data curation; Investigation; and Writing – review & editing. Ghazala Hayat: Investigation and Writing – review & editing. Divya Subramaniam: Formal analysis; Methodology; and Writing – review & editing.
Funding
The authors disclosed receipt of the following financial support for the research, authorship, and/or publication of this article: This study was funded by the Saint Louis University Irma Ruebling Endowed Research Fund.
Declaration of Conflicting Interests
The authors declared the following potential conflicts of interest with respect to the research, authorship, and/or publication of this article: The authors, Held Bradford E, Doherty, M, DeMarco E, Zocher S, Weaver K, Forsman K, and Subramanian D, declared no potential conflicts of interest with respect to the research, authorship, or publication of this article. Dr. Ghazala Hayat reports she is a consultant to the Speakers Bureau for MTPA, Argenx, and Alexion, companies that may be affected by the research reported in the enclosed paper. She has an approved plan for managing any potential conflicts arising from this involvement.
Supplementary material for this article is available on the Neurorehabilitation & Neural Repair website along with the online version of this article.
References
Supplementary Material
Please find the following supplemental material available below.
For Open Access articles published under a Creative Commons License, all supplemental material carries the same license as the article it is associated with.
For non-Open Access articles published, all supplemental material carries a non-exclusive license, and permission requests for re-use of supplemental material or any part of supplemental material shall be sent directly to the copyright owner as specified in the copyright notice associated with the article.