
Abstract
Representing causal social science knowledge in models is difficult: much of the best knowledge is qualitative and ambiguously conditional, unlike the knowledge in “physics models.” This paper describes a stream of RAND research that began with qualitative models providing a structured depiction of casual factors creating effects. That has subsequently been extended to an unusual kind of uncertainty sensitive computational modeling that enables exploratory reasoning and analysis. We illustrate the approach with applications to counterterrorism, detection of terrorists, and nuclear crises. We believe that the approach will complement other approaches that can reflect social science phenomena [see other papers in this special issue of JDMS] and that the approach has broad potential within and beyond the national security domain. We also believe that it has the potential to inform empirical work—encouraging a transition from the step-by-step empirical testing of simple discrete hypotheses to the testing and refinement of more comprehensive causal models.
Keywords
1 Introduction
For about a decade we and RAND colleagues have been evolving methods to represent social science phenomena in national security research. The need to do this is evident in an era with such missions as counterterrorism, counterinsurgency, and stabilization. Success in such missions often depends on understanding human and social considerations (see the Army-Marines counterinsurgency field manual introduced in 2006 by General David Petraeus and General James Mattis 1 ). Although often unrecognized, the need exists also to represent social science in modeling of such traditional missions as large-scale ground combat. Results of such combat depend on such “soft” factors as the sides’ morale, cohesion, and fighting effectiveness.2–4 At the strategic level, effectiveness of strategy may depend on understanding the adversary commander, the collective character, and style of adversary forces, or both. This is true in both war and peacetime competition, but is far easier to proclaim than to accomplish.5,6
Great military commanders have long studied history and understood such matters. An example was dramatized in the 1970 movie Patton. Patton walks the prospective battlefield attempting to get into the mind of General Erwin Rommel. He exclaims, referring to Rommel, “You magnificent bastard, I read your book.” Analysis organizations, however, often treat human and social matters poorly, if at all. Even for analysis of strategic nuclear deterrence in a frightening crisis, analysis often reduces to a mathematical exercise with limited explanatory power for leaders, who often reason about but misunderstand adversary intent.
What kinds of models are needed to do better? In the stream of work described in this paper, we focus on the pursuit of models that reflect aspects of human and social behavior; are relatively simple and intuitive; and that are causal, semi-quantitative, and able to deal with deep uncertainty. Deep uncertainty includes what others call scenario uncertainty, or “real uncertainty.” Great progress has been made in dealing with such uncertainty.7,8,9 A definition given in a noteworthy report on long-term social planning is that deep uncertainty is the condition in which “analysts do not know or the parties to a decision cannot agree upon (1) the appropriate models to describe interactions among a system’s variables, (2) the probability distributions to represent uncertainty about key parameters in the models, and/or (3) how to value the desirability of alternative outcomes.” 10 These attributes are particularly important for higher level planning. 11
Our purpose in this paper is to (1) summarize a body of recent RAND work seeking models with the desired character; (2) note what may be new and unusual features; and (3) suggest some directions for the analytic community. The paper is organized accordingly. Sections 2–5 review our past work with pointers to more detailed publications; Section 6 notes briefly other approaches and makes some limited comparisons; and Section 7 looks to the future. Other papers in the special issue for which this paper was prepared illustrate and/or discuss a number of other methods.
2 Qualitative factor trees as thinking models
2.1 Background, objectives, and challenges
In 2007 the Department of Defense (DoD) requested a study to review comprehensively the social science knowledge base bearing on terrorism. After seeing unsatisfying modeling efforts for several years, senior officials in DoD’s analysis branches saw the need to take a deep breath, step back, and understand the underlying science that should be modeled before proceeding. That is, they concluded that modeling and programming had gotten well ahead of understanding. The resulting 500-page study 12 had chapters on the root causes of terrorism, 13 why individuals become terrorists, 14 why the public supports terrorism, 15 the economics of terrorism, 16 organizational decision-making by terrorist groups, 17 how terrorism ends, 18 and how terrorists sometimes disengage and do or do not deradicalize. 19 The study benefited from extensive interactions with some of the nation’s most knowledgeable experts on terrorism.
A major challenge became evident early in the study. Although the scholarly knowledge base was rich, it was also fragmented. Different scholars had focused largely on different aspects of terrorism with relatively little attention on linking these factors together systematically. That was a shortcoming in both the social science and its value to policymakers and planners. Thus, the subtitle for the eventual book became “Putting the Pieces Together.” But how?
2.2 Approach
As an unpretentious first step toward systemic theory, the study introduced qualitative conceptual models in the form of “factor trees,” as illustrated below. These factor trees stemmed from long familiarity with influence diagrams, causal-loop diagrams, fault trees, and other techniques, but were simplifications to be understood at a glance and debated by people with varied backgrounds. 20 (Some of the relevant literatures deal with system dynamics, as introduced by MIT’s Jay Forester in the 1960s 21 ; qualitative modeling and multi-modeling 22 ; fuzzy-logic methods23,24; and Bayesian networks. 25 ) Factor trees proved effective in both small project-level meetings and large assemblages. They have been used in a number of studies and in graduate-level policy analysis courses in the Pardee RAND graduate school. A primer exists on their use and has been reprinted as an appendix of a later report. 26
To illustrate factor trees we draw on a later research project that studied the particular issue of public support for terrorism in greater detail. 27 That built on the earlier work15,28 but added insights (primarily from colleague Eric Larson) from social-movement theory. Further, it had a strong empirical component. Figure 1 shows the study’s factor tree.
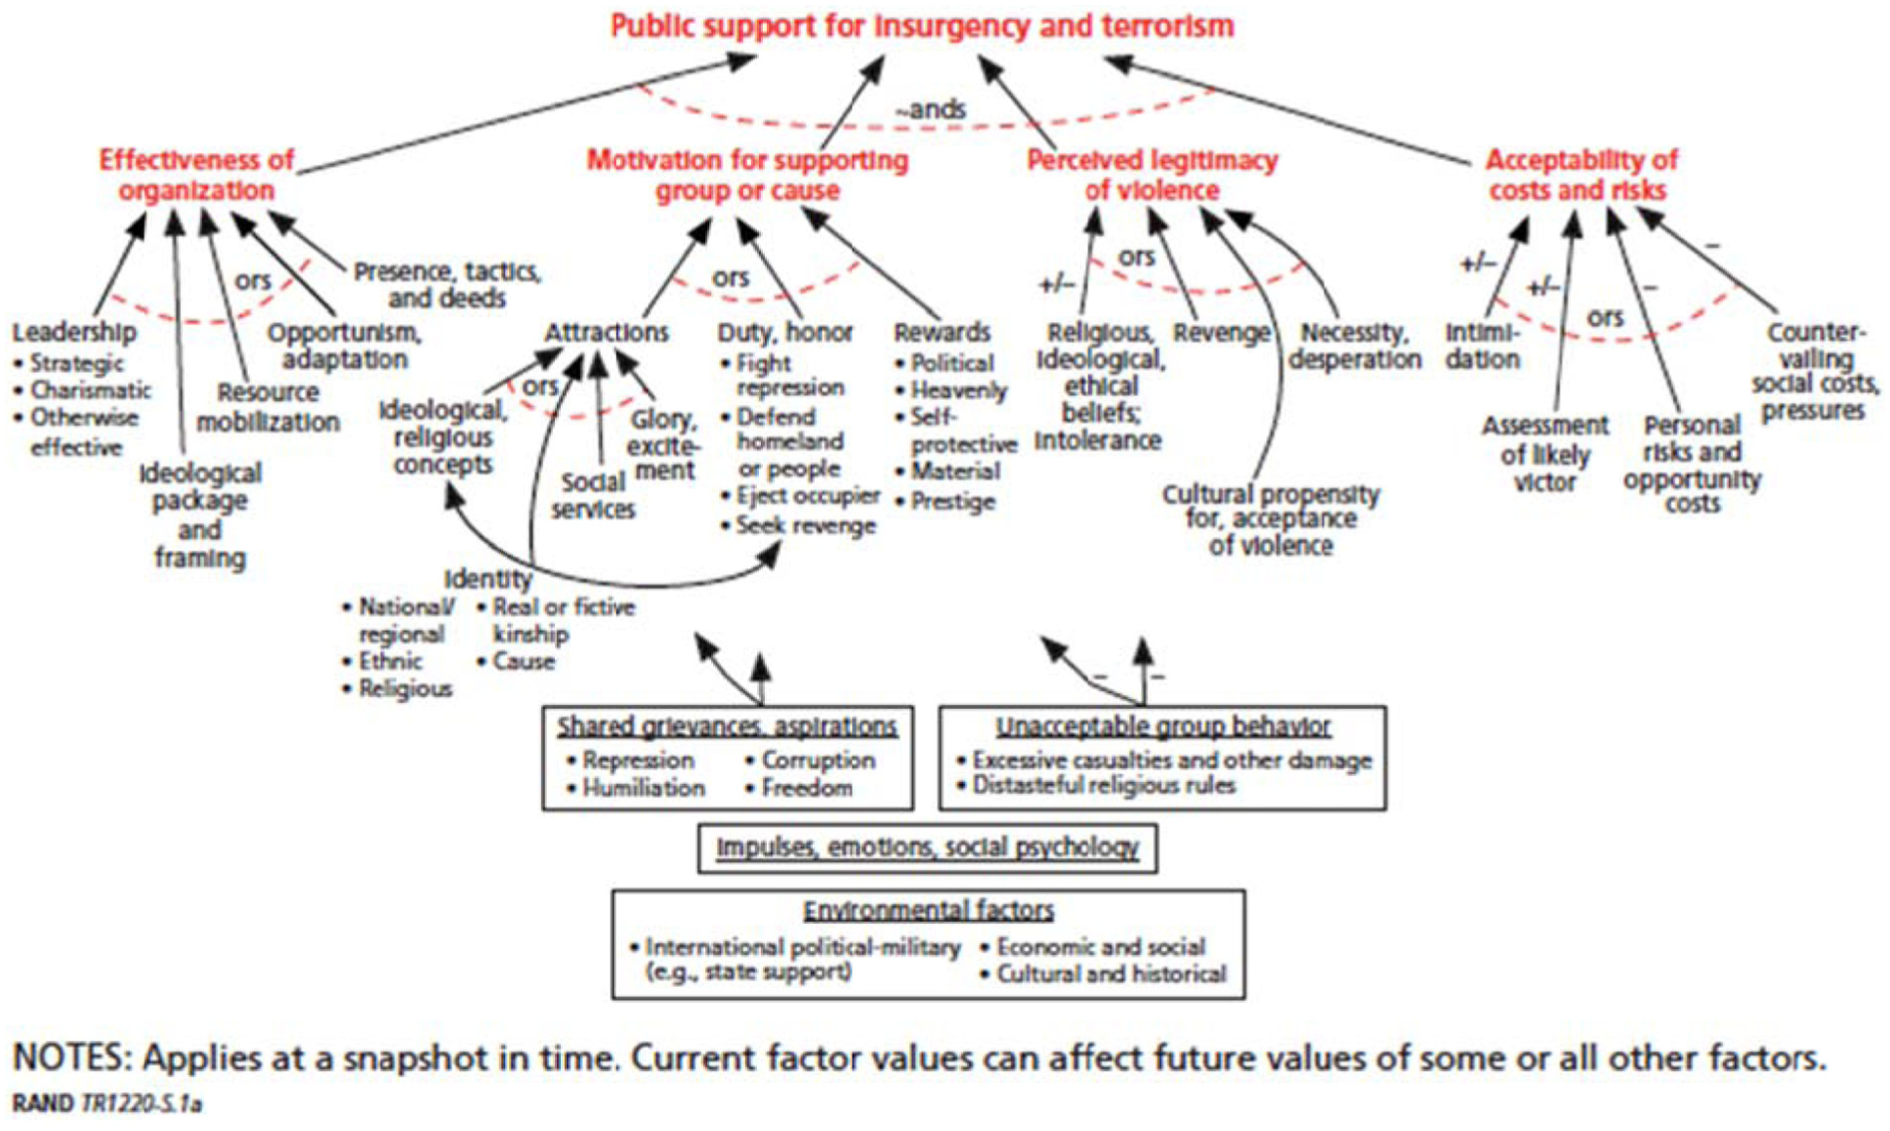
Factor-tree model for public support of insurgency and terrorism.
The arrows of the diagram indicate influence: more of the variable at the beginning of an arrow will tend to cause more of the variable at the end of the arrow (the actual influence depends on the values of the other variables pointing to the same node and its current value). Variables connected by “~ands” are—only to a first approximation—separately necessary for the higher level variable to be significant. Variables connected by “ors” may be substitutable or may combine in a number of other ways. The +/– sign indicates ambiguity, where even the direction (valency) of influence is uncertain.
Although this paragraph is a detour, it is important because many subtleties are involved in using factor trees. Their appeal is due in large part to describing causality at a point in time with a tree structure prominent. Note, however, that Figure 1 includes an example of a lower level node influencing multiple higher level nodes. Further, at the bottom of the figure, some variables (in rectangles) exist that may have influences throughout the tree’s structure. A depiction with all connections explicit would be more bushy, distractingly so. A factor tree suppresses some of the complexity of a more general directed acyclic graph. Further, by representing a snapshot in time, it suppresses information about dynamics and feedbacks. A fuller description would look more like a system dynamics causal-loop diagram. Whether the simpler factor-tree depiction “cuts through the fog” to illuminate, obfuscates, or is good only if supplemented by depictions of other considerations (such as dynamics) depends on the application and precisely what one is attempting to do. In our work we have frequently found it useful to separate discussion of snapshot causality and system dynamics (including feedbacks), to suppress some cross-linkages that are relatively weak, and to define variables of a tree left to right so that the higher level factors can be treated as logically independent. 29 Reality is complex; tricks are required to glimpse various aspects in seemingly simple ways.
Returning now to the main flow of this paper, the narrative that goes with Figure 1 is that public support for insurgency and terrorism depends on four top-level factors: effectiveness of the organization; motivation; perceived legitimacy of terrorist violence; and acceptability of costs and risks.
2.2.1 Organizational effectiveness
Public support for an insurgent organization requires that the organization exists and has some level of effectiveness. This effectiveness may be the result of leadership, ideological package and related framing, the mobilization of resources, opportunism and adaptation to circumstances, and tactics and deeds.
2.2.2 Motivation
Most people who support insurgency and terrorism believe that they are doing something positive, such as contributing to a worthy cause, fulfilling a duty, or maintaining honor. Some attractions are rooted in religion or another ideology, a sense of identity, appreciation of social services provided by the organization, the glory and excitement of the cause or activity, or some combination. Identity is a cross-cutting factor. Other motivations may involve financial payments, gaining power or prestige, or—often very important—self-preservation (failure to support the activity will mean their death).
2.2.3 Perceived legitimacy of terrorism
Terrorist violence may be perceived by the public as legitimate for reasons that may be religious or otherwise ideological; amount to intolerance rooted in ethnic prejudices that denigrate “others”; reflect a sense of legitimate personal revenge or, in a culture with endemic violence, a belief that legitimacy is a non-issue. In addition, even if terrorist violence is seen as deplorable, it may be seen as necessary. Significantly, a public may deplore terrorism (e.g., attack of noncombatants or essential infrastructure) but approve of other forms of violence as necessary for the cause. Or, in an important variant, a public may support what amounts to terrorism, but only against those seen as “others.” One arrow in Figure 1 for Perceived Legitimacy has an ambiguous sign +/– because religion and ideology can either support or undercut the notion of legitimacy. Both influences may be present simultaneously.
2.2.4 Acceptability of costs and risks
The fourth branch is expressed as acceptability, given motivations, of costs and risks. This formulation is deliberately not like that of the economist’s rational actor. In the real world, behaviors are often not the result solely of sober cost–benefit calculations. Rather, they stem also from such emotions as the excitement of battle alongside comrades or the horror of having witnessed slaughter. As for “calculations,” young men and women are often famously insensitive to risks (or fail to recognize them), but most people consider them. Sources of perceived risk include intimidation and a projection of the likely victor. These can work in either direction as indicated by the ambiguous, +/– signs. Both government and insurgent organization may practice intimidation, and—depending on events—either side may be seen as likely to prevail. There may also be personal-level risks and opportunities to consider, and a variety of countervailing social and cultural pressures against support.
2.3 The factor tree as a kind of model
Factor trees are “qualitative.” By this we mean that they use words rather than numbers, define the variables only roughly, and give only rough information about the relationship among variables and how they combine. Despite these limitations, qualitative models can be powerful and—as we discuss in the following sections—qualitative models can provide the conceptual basis upon which to build computational models.
Factor trees are also multi-resolution causal models. Figure 1 has four top-level factors, each determined (caused by, not just correlated with) lower level factors, which are determined by still lower level factors. Superficially, the result is a hierarchical tree. For many purposes, it is appropriate to reason in terms of just the higher level factors, but for other purposes it is necessary to go deeper, to understand why the public is motivated or why it might conclude that its support was desirable despite costs and risk. Models to support such multi-level reasoning must allow inputs to be entered at the different levels of detail; models that impose the requirement to think bottom up are imposing trees when forests may be more important Multi-resolution modeling is discussed elsewhere.30–34
Technically, the factor tree diagram is not truly a tree. The top-level factors affect each other over time, as would be evident in a system dynamics diagram. Also, cross-cutting factors exist, which include shared grievances and aspirations, unacceptable behavior by the insurgent organization that can undercut public support (e.g., al Qaeda’s 2003 attack in Riyadh, which killed many innocent Muslim civilians), psychological and emotional factors, and such environmental factors as international relations, economics, instability, and culture. These complications are downplayed in the graphical factor tree so as to focus attention on the factors causing effects at a snapshot in time.
2.4 Scientific method and validation revisited
Seeing factor trees as qualitative models meant having to address the scientific issue of validation. The study 27 made the following conclusions.
Such models cannot be validated by computing predictions to real-world behaviors in controlled quantitative experiments. Classic validation methods do not apply.
Falsification, however, is possible and case studies can test the model. Validation testing should establish whether (1) the factors and rough relationships of the initial factor tree show up in the new cases, (2) whether the new cases indicate that significantly different factors show up, and whether—all things considered—(3) the factor tree proved useful and insightful in understanding the new cases.
Testing should not be seen as a yes/no, pass/fail proposition, but rather—if the initial theory is broadly right—as part of an ongoing process of theory enrichment and refinement.
The last item is consistent with a great deal of historical scientific progress in the hard sciences, to what engineers refer to as a model-test-model process, and— in social science–to the kind of work pioneered by Alexander George, which uses structured case studies to enrich “causal pathways.” 35
The factor tree of Figure 1 was tested with new case studies on al Qaeda thought leaders, the Taliban in Afghanistan, the PKK in Turkey, and the Maoists in Nepal. The factor tree (Figure 1) worked well across all of these, but—as expected—the relative importance of the factors varied a good deal by case. This was particularly true at the second level of detail. For example, motivation was always important, but the source of the motivation varied. Religion mattered greatly for al Qaeda and the Taliban (as it does for some in ISIS today) but mattered much less for the PKK and Nepalese Maoists.
Interestingly, the relative significance of factors also varied with time within a given context, precisely as theory would suggest. Insurgents and governments are in a competition for public support. They constantly look for “new” ways to advance their interests. Thus, insurgents that begin with a secular approach may come to emphasize convenient aspects of religion. Those who begin with a religious or ideological orientation may later appeal to nationalism, ethnic identity, or material self-interest. Figure 2 summarizes our point. We respect the emphasis of social scientists on context (left-hand side of figure, indicating a common anti-theory attitude), but believe that this emphasis has sometimes gotten in the way of seeking systemic theory. Good systemic theory does reflect context.

Change of perspective about theory.
Factor trees have limitations. What, really, is meant by the ands and ors in Figure 1? And how do the factors combine? What is the value of public support as a function of the four primary variables? Further, a factor tree does not allow us to depict trends, sensitivities, expectations, and possibilities. A question, then, was whether we could do better, to reflect more of the social science that exists. We attempted to do so, albeit with trepidation. Having successfully exhorted our policymakers and analysts to give more attention to qualitative social science, and to be skeptical of quantitative statistical models, 36 we were now attempting to move toward the semi-quantitative ourselves.
3 Uncertainty sensitive computational modeling
3.1 Objectives and challenges
In the next phase of research we sought to move from the conceptual, factor-tree model to a fully specified, uncertainty-sensitive, computational model. 26 We hoped to improve rigor and nuance, lay the basis for meaningful albeit soft analysis, and improve prospects for peer review, sharing, reuse, and model composition. By “computational model” we mean simply a model that calculates outputs from inputs; that is, a model than “runs.” Other authors use the term differently, referring to complex models, as in a large agent-based model generating a system’s behavior over time.
3.2 Approach
Our approach recalled a classic modeling principle and gave it a new form. The traditional principle urged developing and validating a conceptual mathematical model first, and only then implementing it as a computer program.37–39 Separating the conceptual model and implemented model (program) was a natural idea when the hard intellectual work was mathematical and tedious programming was merely a necessary practical step. Metaphorically, it was akin to drawing up detailed blueprints and handing them over for construction. Intellectually, the separation continues to be attractive: the science is in the abstractions that underlie modern computer programs, rather than in the computer code itself, much of which is devoted to making recalcitrant machines do the bidding of humans.
This said, the distinctions among theory, modeling, and programming have broken down. Creative modeling is a combination of thinking, mathematics, doing, observing, tinkering, and iterating. Today’s modelers would be incredulous if told that they had to defer programming until they had solved their problem mathematically. That said, computer models are often opaque with no distillation of the underlying concept. We see this situation as unacceptable as science: it makes peer review and reproducibility difficult, fails to improve coherence, and makes it difficult to incorporate new knowledge cleanly. We also see this situation as unacceptable as the basis for advising policymakers, who want to understand what they are doing and distrust opaque models. 34 This distaste for opaqueness underlay the DoD’s decision, in 2011, to discontinue emphasis on campaign modeling. 11
A related problem is that the best subject-area experts may not understand or interact with the models when embedded in opaque programs. We believe the following.
It should be possible for the professor of political science, sociology, or social psychology to play with the model, discuss it with graduate students, debate alternatives at a conference, and otherwise pursue the scientific process in traditional ways, which includes the responsible scientist sometimes personally working through the details before publishing. This is not feasible with a chasm between concept and computer model.
It should be possible for the practicing analyst to understand and have a similarly close relationship with the model, without being pulled into programming details.
It should be possible for consumers (e.g., policymakers) to receive comprehensible explanations of assumptions and model logic, rather than to hear “Well, the model said…” (a good basis for discharging the briefer). Moreover, when consumers are told what the model does, that description should be true, rather than an idealization different from what the computer program actually does.
As an additional consideration, suppose that a “modular” subject, such as public support for terrorism, can be separately vetted. We would then want it to be readily reused or adapted to be in larger models. That is, we would want such separable models to be composable. (Great progress has been made in the technology of interoperability. Achieving meaningful composition is not a computer science challenge alone, however, but rather a challenge involving the subject-specific scientific issues, mathematics, and the semantics and pragmatics of cross-discipline cooperation.40,41 A literature exists on subsequent work,8,42–44 although a new review is needed.)
With these considerations in mind, we wanted our computational model to be in a high-level language that would sharpen the scientific and mathematical ideas, be accessible to researchers and analysts other than expert programmers, and be usable in or readily reprogrammed for a specialized environment. That is, we sought to develop a specification model (see the relevant chapter in a book written in tribute to computer scientist Tuncer Ören 45 ). For the purpose of problem-specific analysis, however, the model should also be directly suitable for convenient, transparent exploratory analysis on a professor’s or analyst’s desktop. Figure 3 describes the overarching concept.
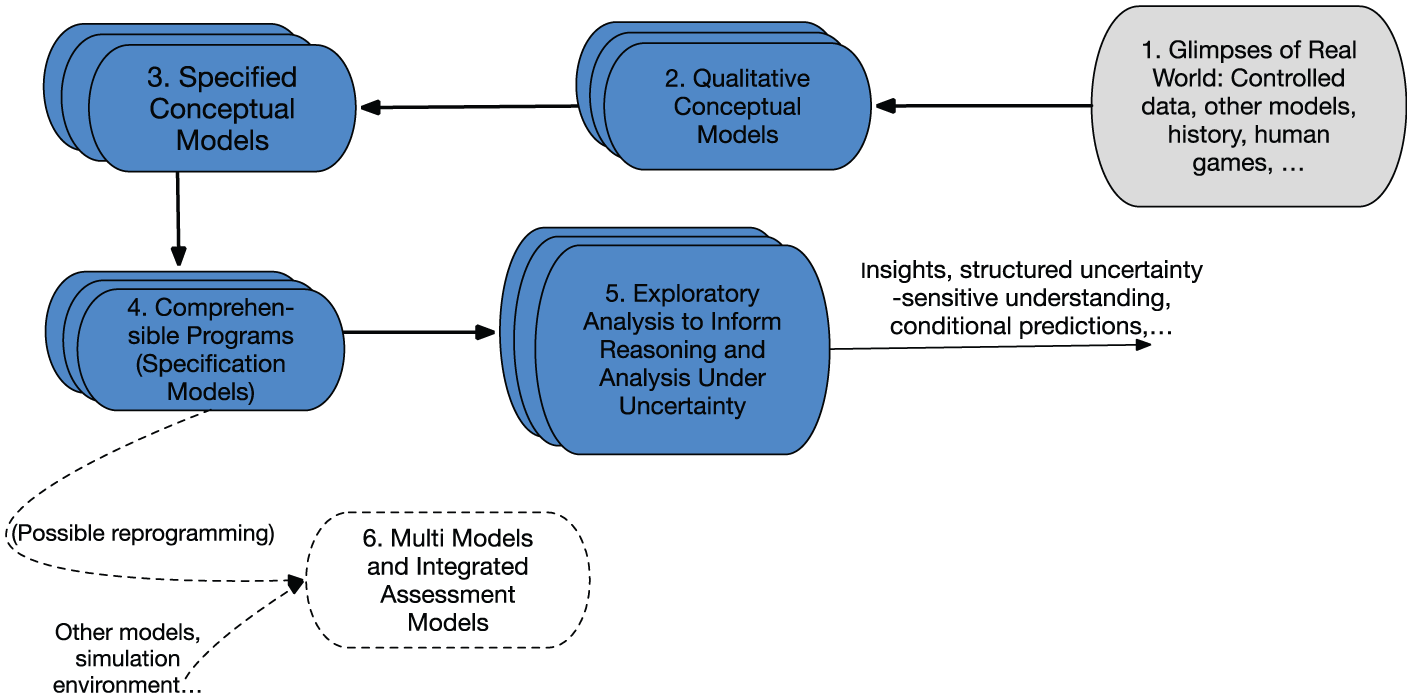
Overarching concept.
3.3 Mathematical methods for specifying social science counterterrorism models
Specifying our conceptual model raised deep issues, as itemized in the first column of Table 1. Some issues appear straightforward in retrospect, but all were the subject of considerable discussion and debate. The second column indicates briefly how we addressed the challenges. We give two terse examples, pointing the reader toward the original report for details, including formal specification. 26
Methods adopted in addressing challenges.
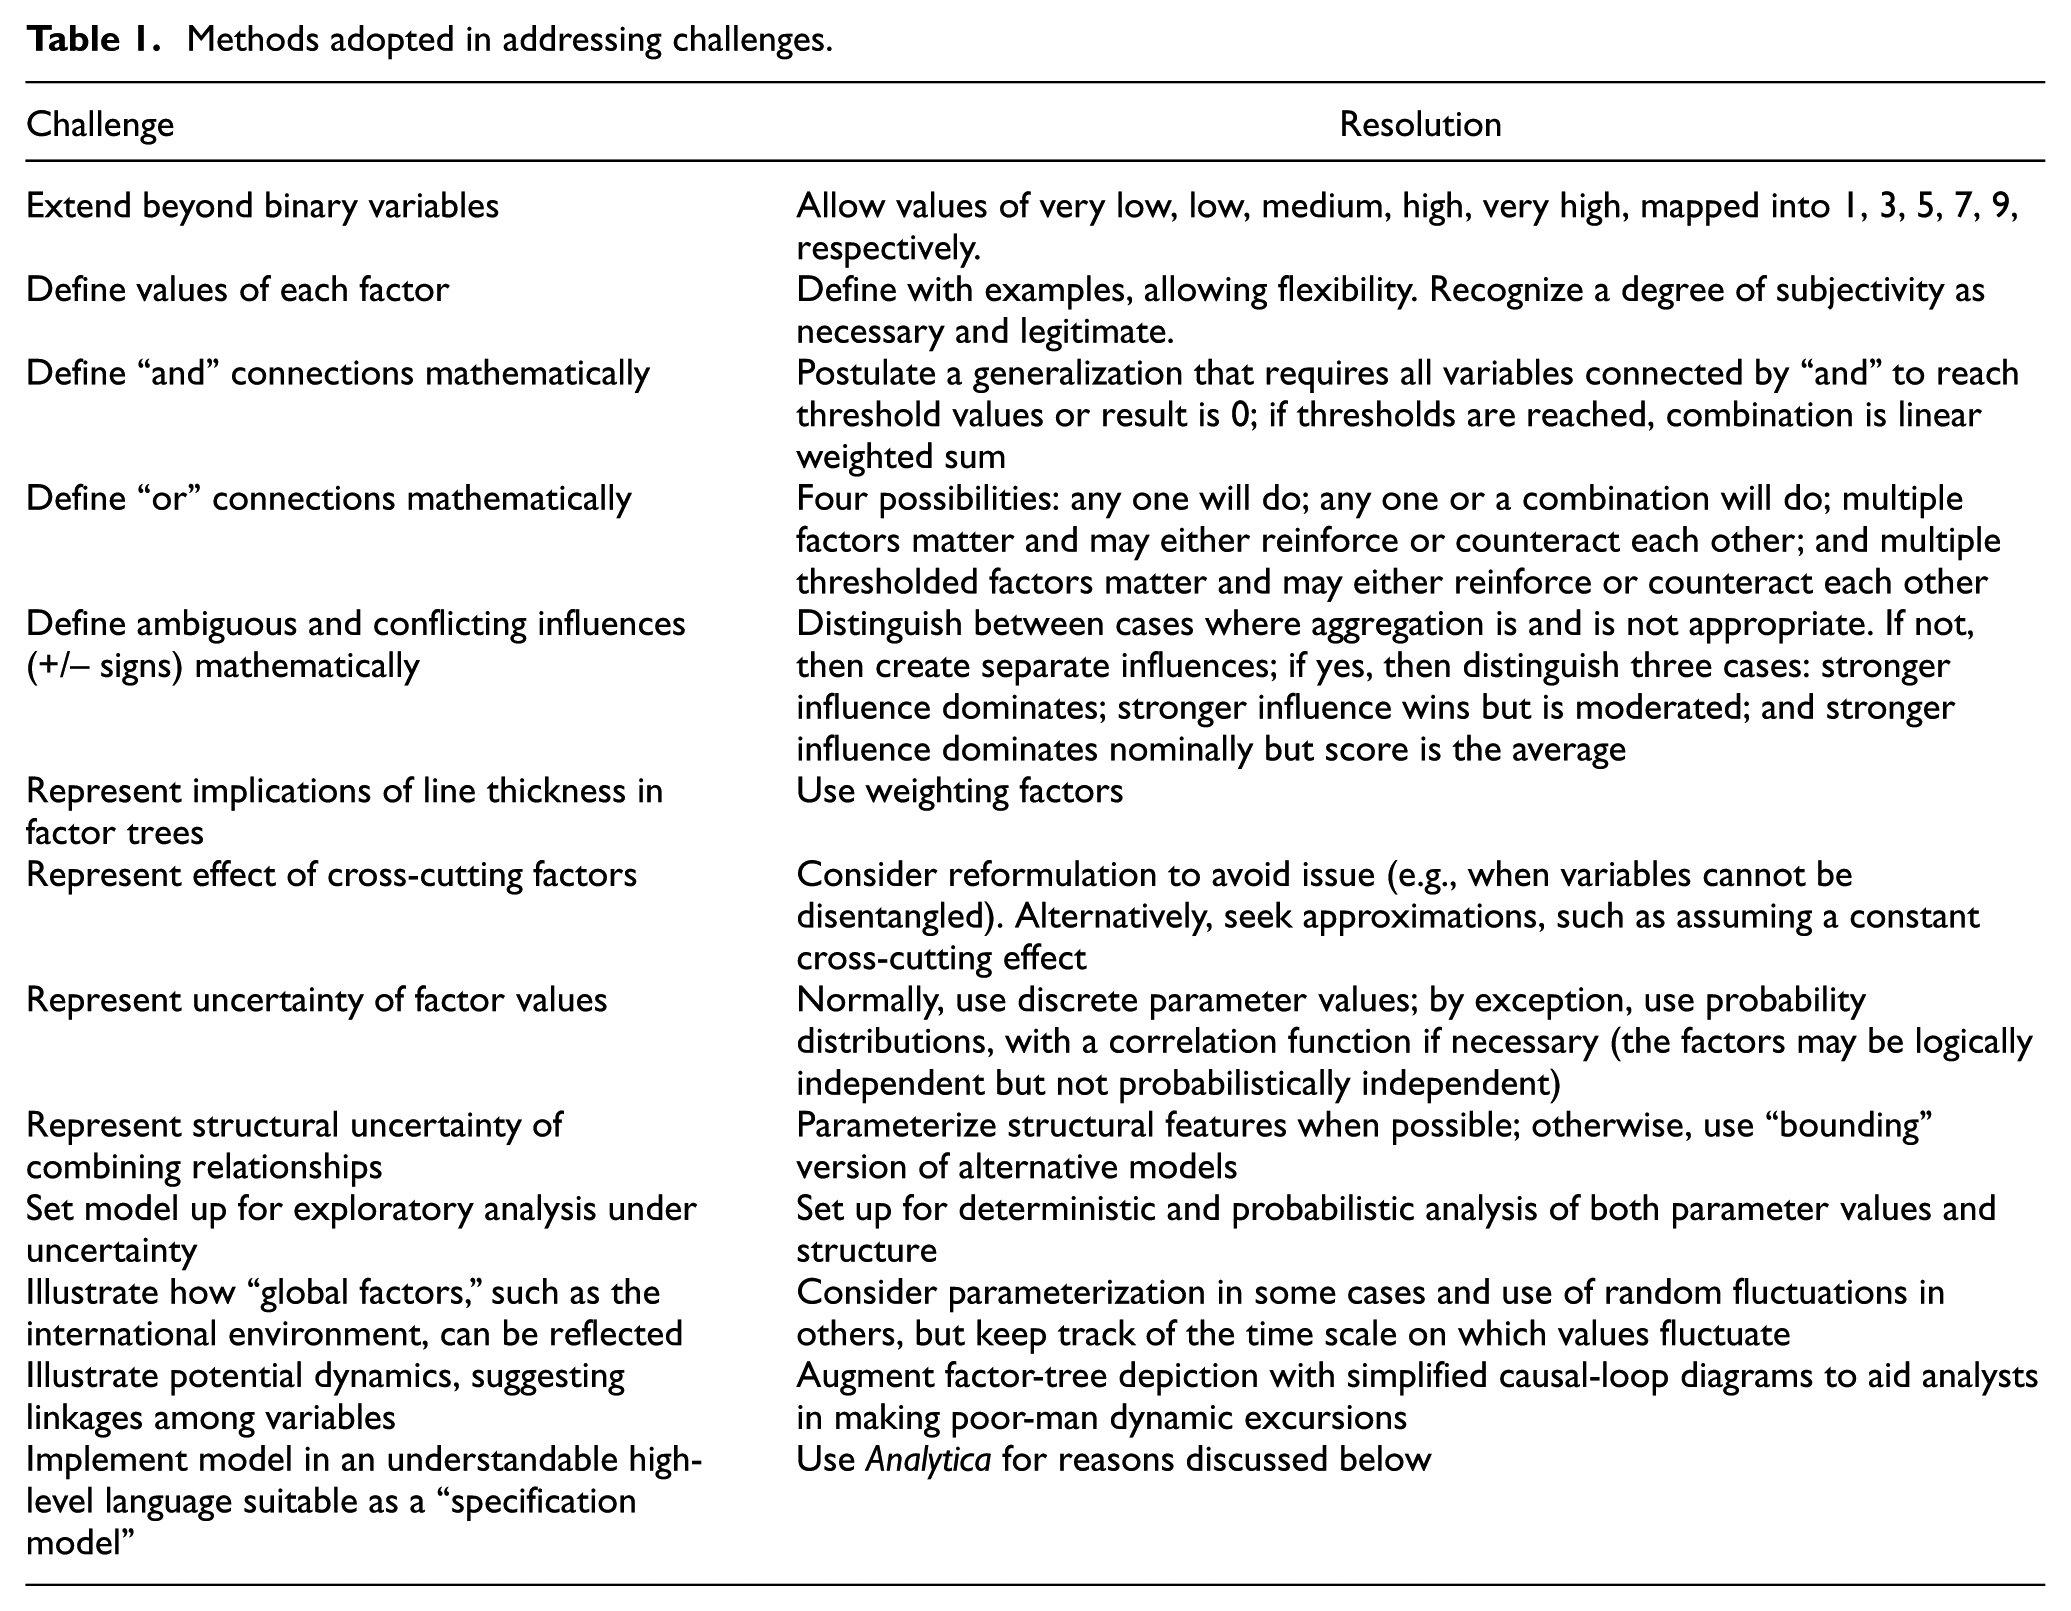
The first issue was how to move from qualitative to numerical variables. We did so by giving the variables equally spaced values {very low, low, medium, high, and very high}, which mapped into {1, 3, 5, 7, 9}, respectively. It was necessary to convince ourselves that social scientists would find the distinctions comfortable and be able to recognize when different values applied. For example, could they distinguish among publics with medium, high, or very high motivation? If so, what tangible indicators would they be using? We concluded that the approach worked reasonably well, but that it would necessarily remain “soft” despite the seeming precision of numbers. Thus, we refer to the work as semi-quantitative.
To note some subtleties here, consider that what people in a given context would agree constitutes a “high” level of motivation in support of a cause may be rather stable in a given context, but the same behaviors (e.g., hate speech) might mean much less in a culture in which fiery and insulting language is the norm. Another subtlety is that the values of the factors relate to perceptions rather than reality. Whether someone feels a high sense of oppression can depend on long-standing norms in his or her environment, and personal history.
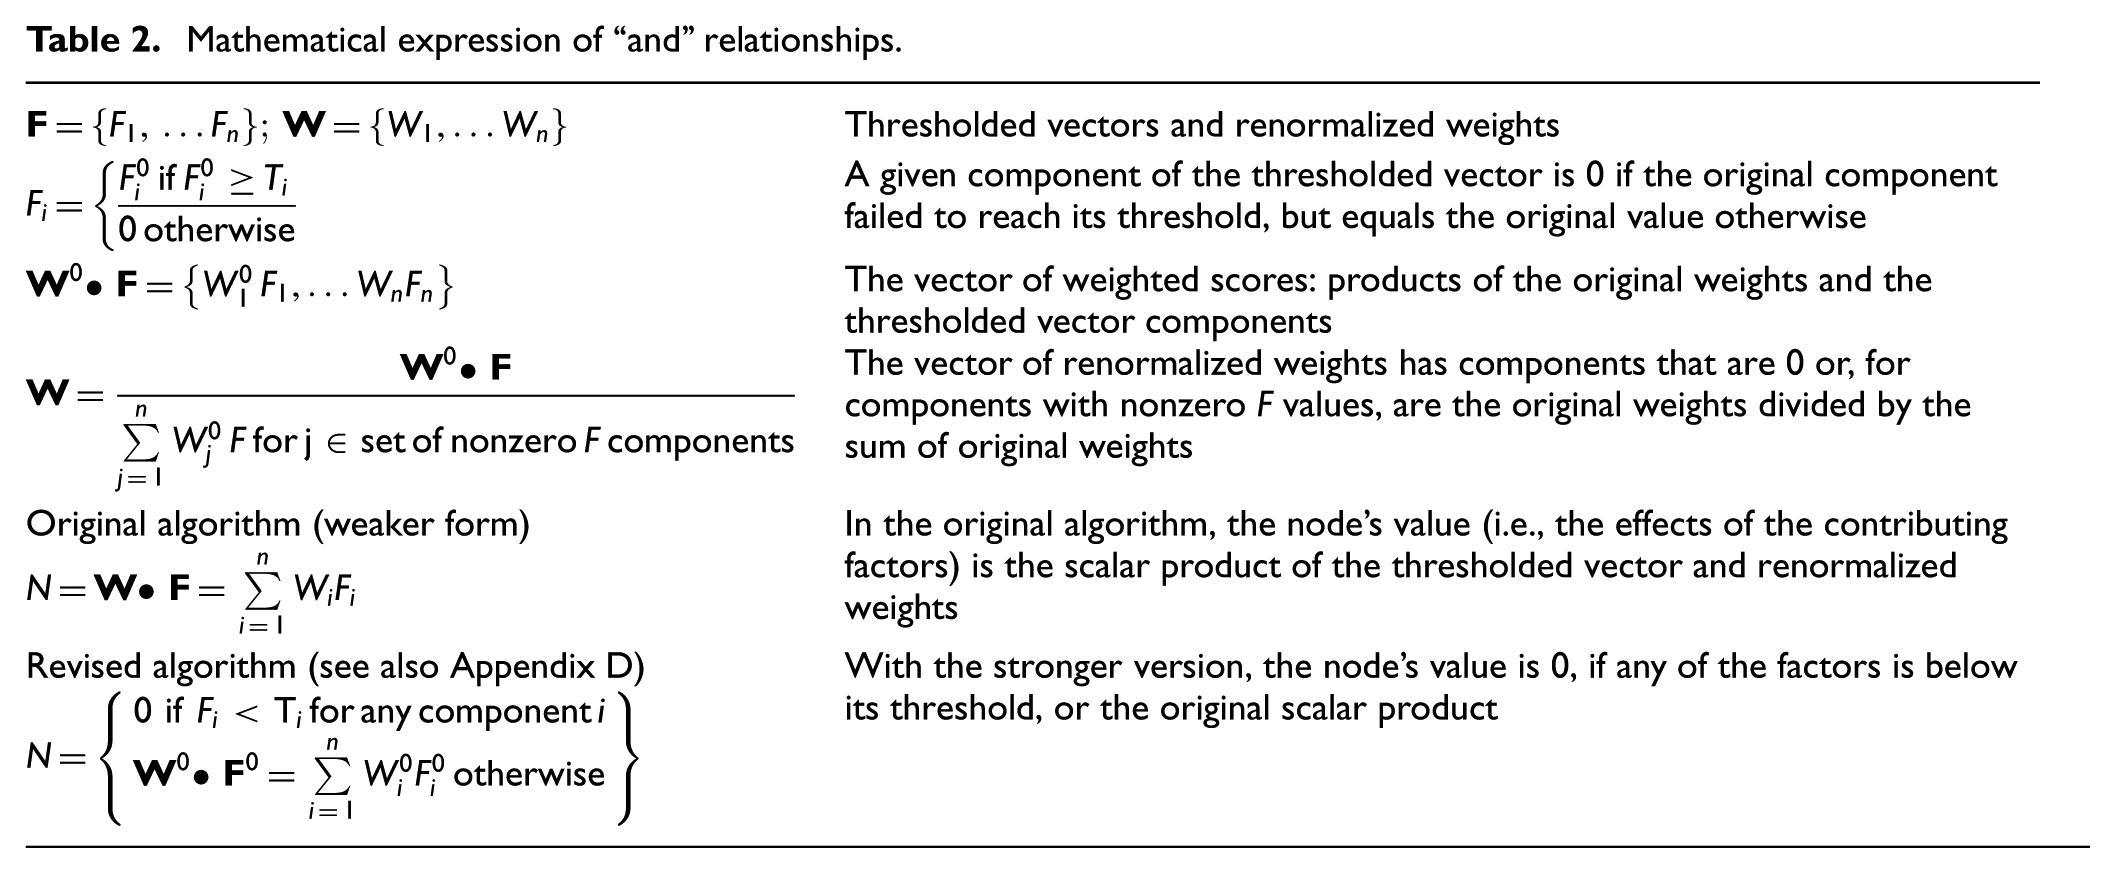
A number of Table 1’s challenges amount to defining the mathematics of combining rules for factors. A common assumption, although typically implicit, is that combination is by linear weighted sums. Social system phenomena, however, are often more complex. Rather than just postulating assumptions while writing computer code, we developed and recorded our assumptions mathematically, as illustrated in Table 2 for the challenge of defining “and” connections. The “and” relationship implicitly suggests a binary variable, which is common in empirical work and Bayesian network theory. We, however, were allowing the factors to have five values. How, then, could we capture the soft notion that—to a first approximation “all” the factors have to be present to have a big effect? We did this by establishing threshold values for each factor. If any of the factors connected by an “and” relationship is below its threshold, then the overall result is low. If all thresholds are reached, the effect (the value of the higher level factor) is a linear weighted sum. In a weaker variant of the rule, linear weighted sums apply, but with any sub-threshold factor treated as having minimum value. We called the method Thresholded Linear Weighted Sums (TLWS). 26 The two versions were presented in an earlier report on portfolio analysis. 46 Some relationships exist with work on artificial neural networks, 47 including the perceptron concept. For other combining rules, it was necessary, for example, to deal both with exclusive versions and non-exclusive versions of “Or” relations, and to represent instances in which factors connected by “Ors” in Figure 1 aggregate in a way corresponding to “the stronger side wins” and instances in which, instead, the aggregation is more of an average (both familiar in social phenomena). Similar issues arise in artificial neural networks and Bayesian network domains. The related syntaxes that we use are defined in our earlier report, but we have not yet had the opportunity to compare with the other literatures in the detail needed to address subtleties.
Mathematical expression of “and” relationships.
3.4 Implementation as the Public Support for Terrorism (PSOT) program
To implement our conceptual model we sought a language that would reflect the logical and mathematical features in a way that is comprehensible to social science and other researchers, while providing a specification model as indicated in Figure 3. The primary features that we sought were as follows:
visual multi-resolution modeling with influence diagrams (our influence diagrams are not the same as those in Bayesian networks; they need not be binary, probabilistic, or governed by Bayesian rules);
intuitive use of array mathematics, which expresses mathematical relationships well;
appropriateness for system modeling (a system of factors, rather than entities);
effective multi-dimensional uncertainty analysis (not just sensitivity analysis);
user friendliness for people other than programmers;
enablers for self-documentation;
clear specification enabling reusability and composability; and
reasonable cost.
We chose to use the Analytica modeling system of Lumina Decision Systems Inc. because it met these criteria.
We did not require other features that are sometimes desirable, such as discrete-event simulation, easy compatibility with agent-based modeling, efficient handing of multiple coupled differential equations, inductive reasoning, optimization, coupling with geographic information systems, built-in Bayesian network functions, or ready access via the internet to open-source library functions. Some of the other languages that we considered, each with its own advantages, included Excel and Visual Basic, Vensim (system dynamics), NetLogo (agent-based modeling), Netica (Bayesian networks), @Risk (risk analysis), R (statistics and great availability of on-line libraries), and Python (relative readability and extensive libraries).)
Figure 4 illustrates “visual modeling.” It shows a screenshot of the top level of the PSOT model and, below, a screenshot of the Motivation module, obtained by double-clicking on the Motivation module. This is a view of the actual program, which is reasonably isomorphic with the conceptual model. That is, the structural elements of the conceptual model appear as structural elements of the computer program. To be sure, the program also has a good deal of additional “plumbing” necessary to make the program work with all the various flexibilities and uncertainties intended, but much of that can be ignored by the analyst.
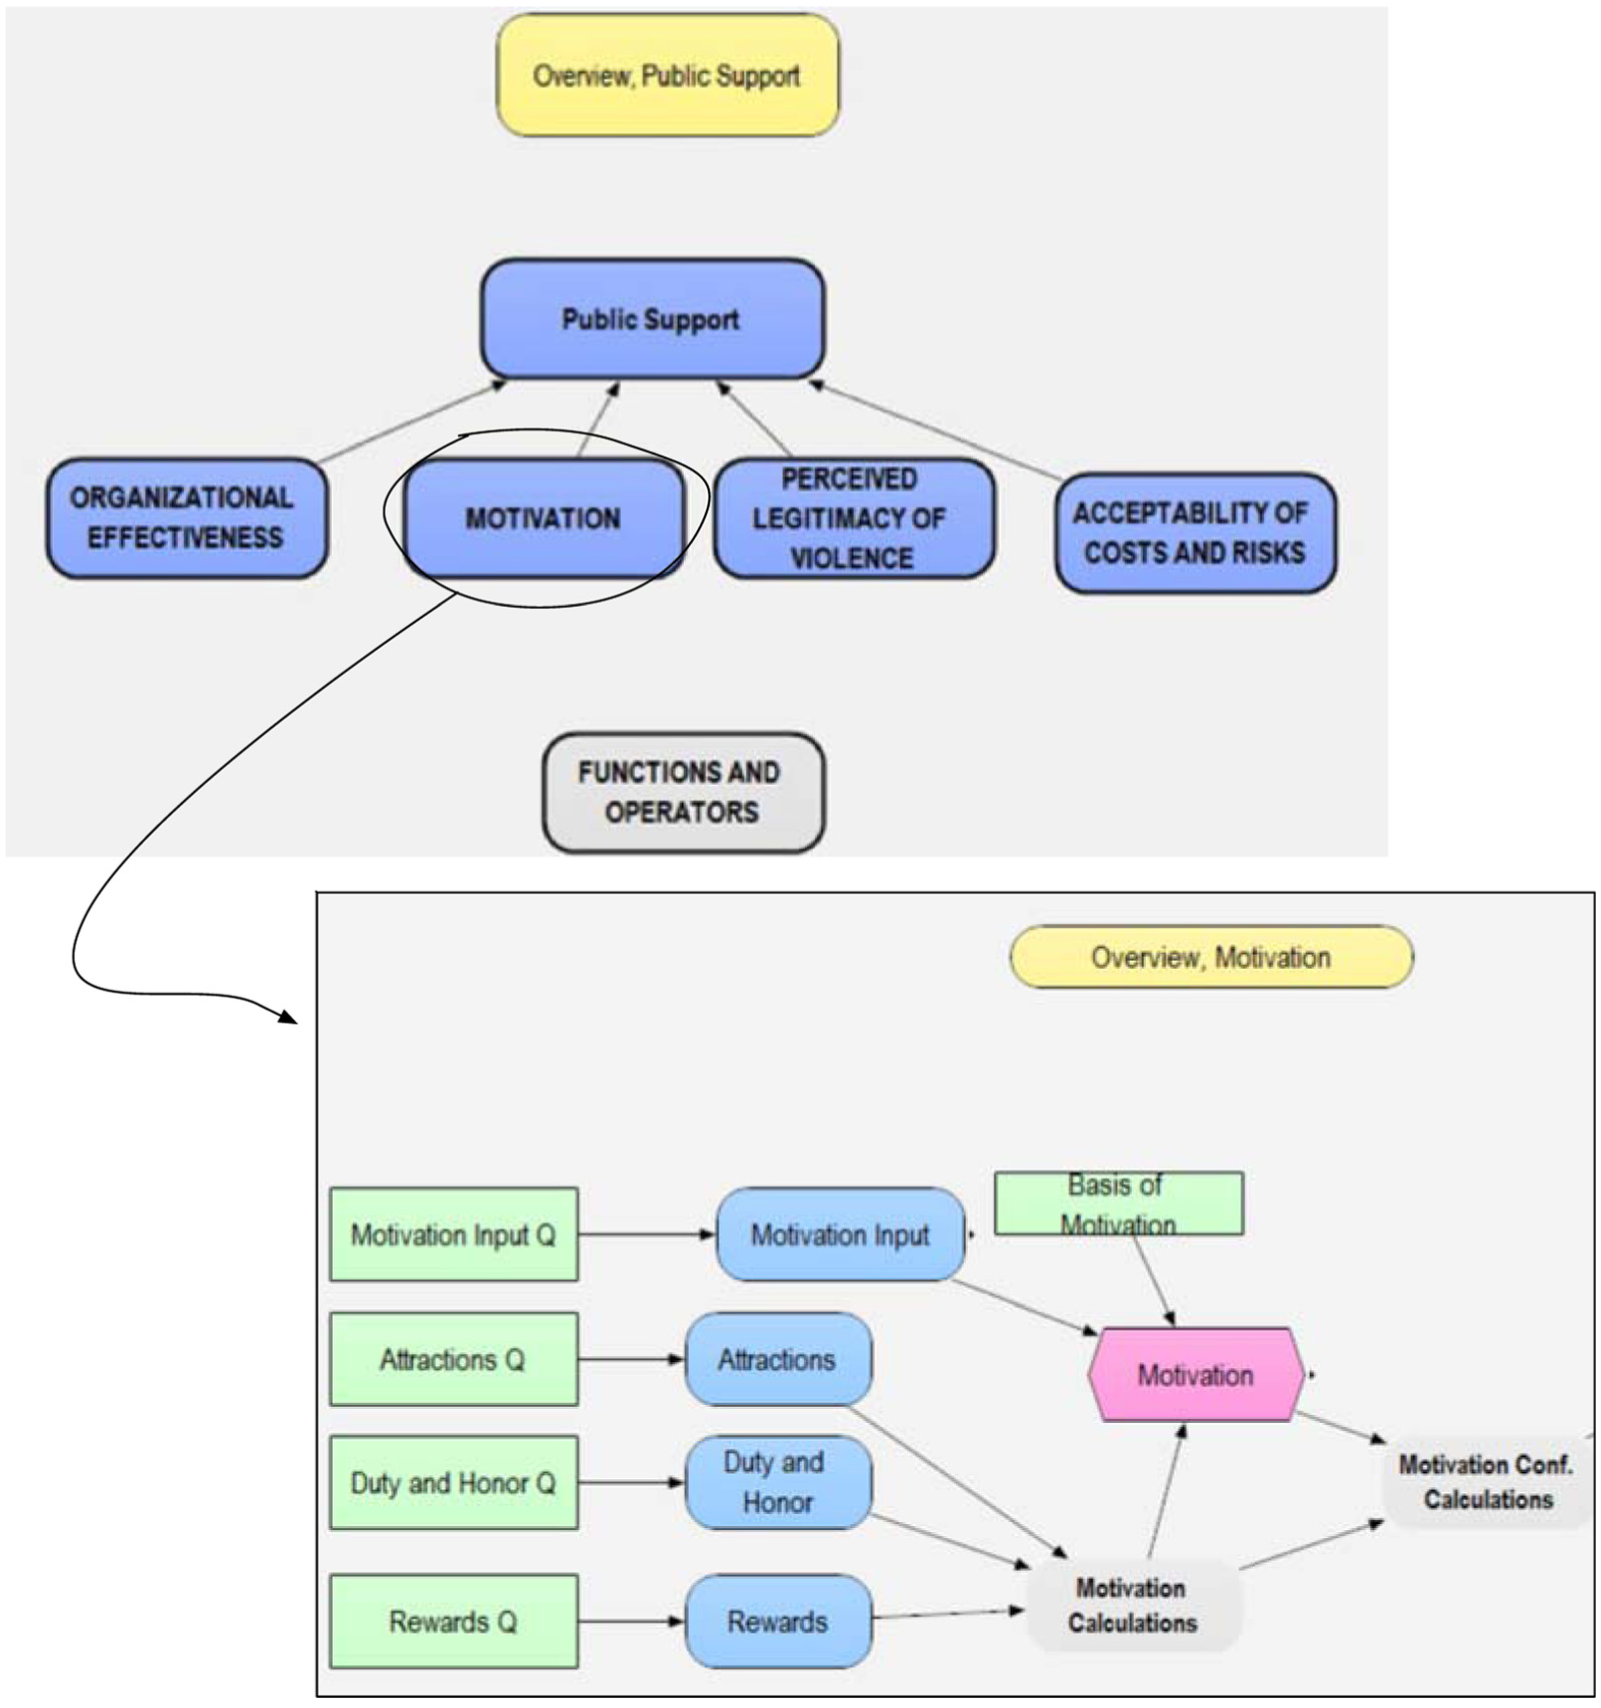
Visual programming of the PSOT model.
Visual programming is powerful, but the concrete algorithms must still be expressed somewhere. Figure 5 illustrates this by showing what an individual node of the model looks like if opened. It includes the node variable’s identifier (PS_Calc), title (Public Support), an optional description providing some self-documentation, a definition (the algorithm), and a list of inputs and outputs to the node. The definition field is nearly equivalent to the mathematics in Table 2 (the definition is slightly different to avoid nonintuitive behavior for cases in which one or more of the factors is below threshold). For example, the sum appearing in the definition is computing the relevant scalar product. Figure 6 shows a screenshot of the user interface. Again, it is structured much like the original factor tree.
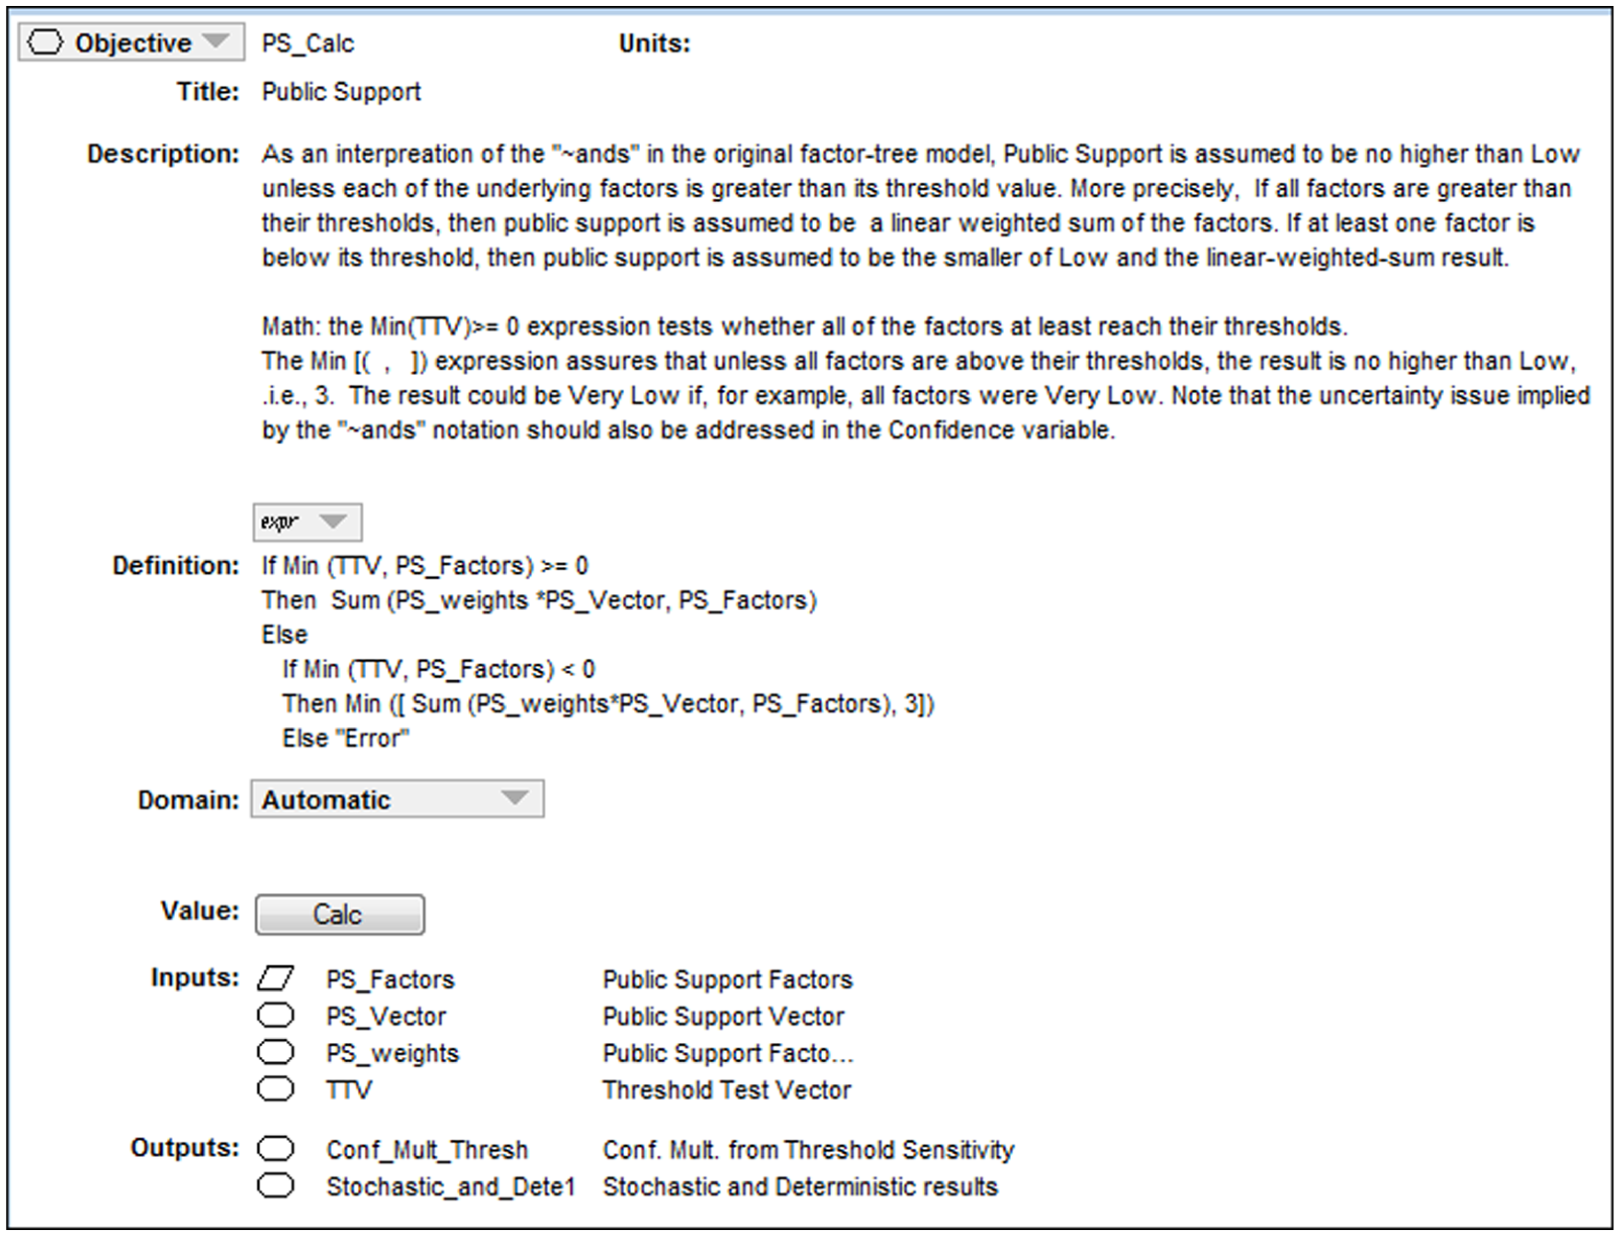
Illustrative node-level detail.
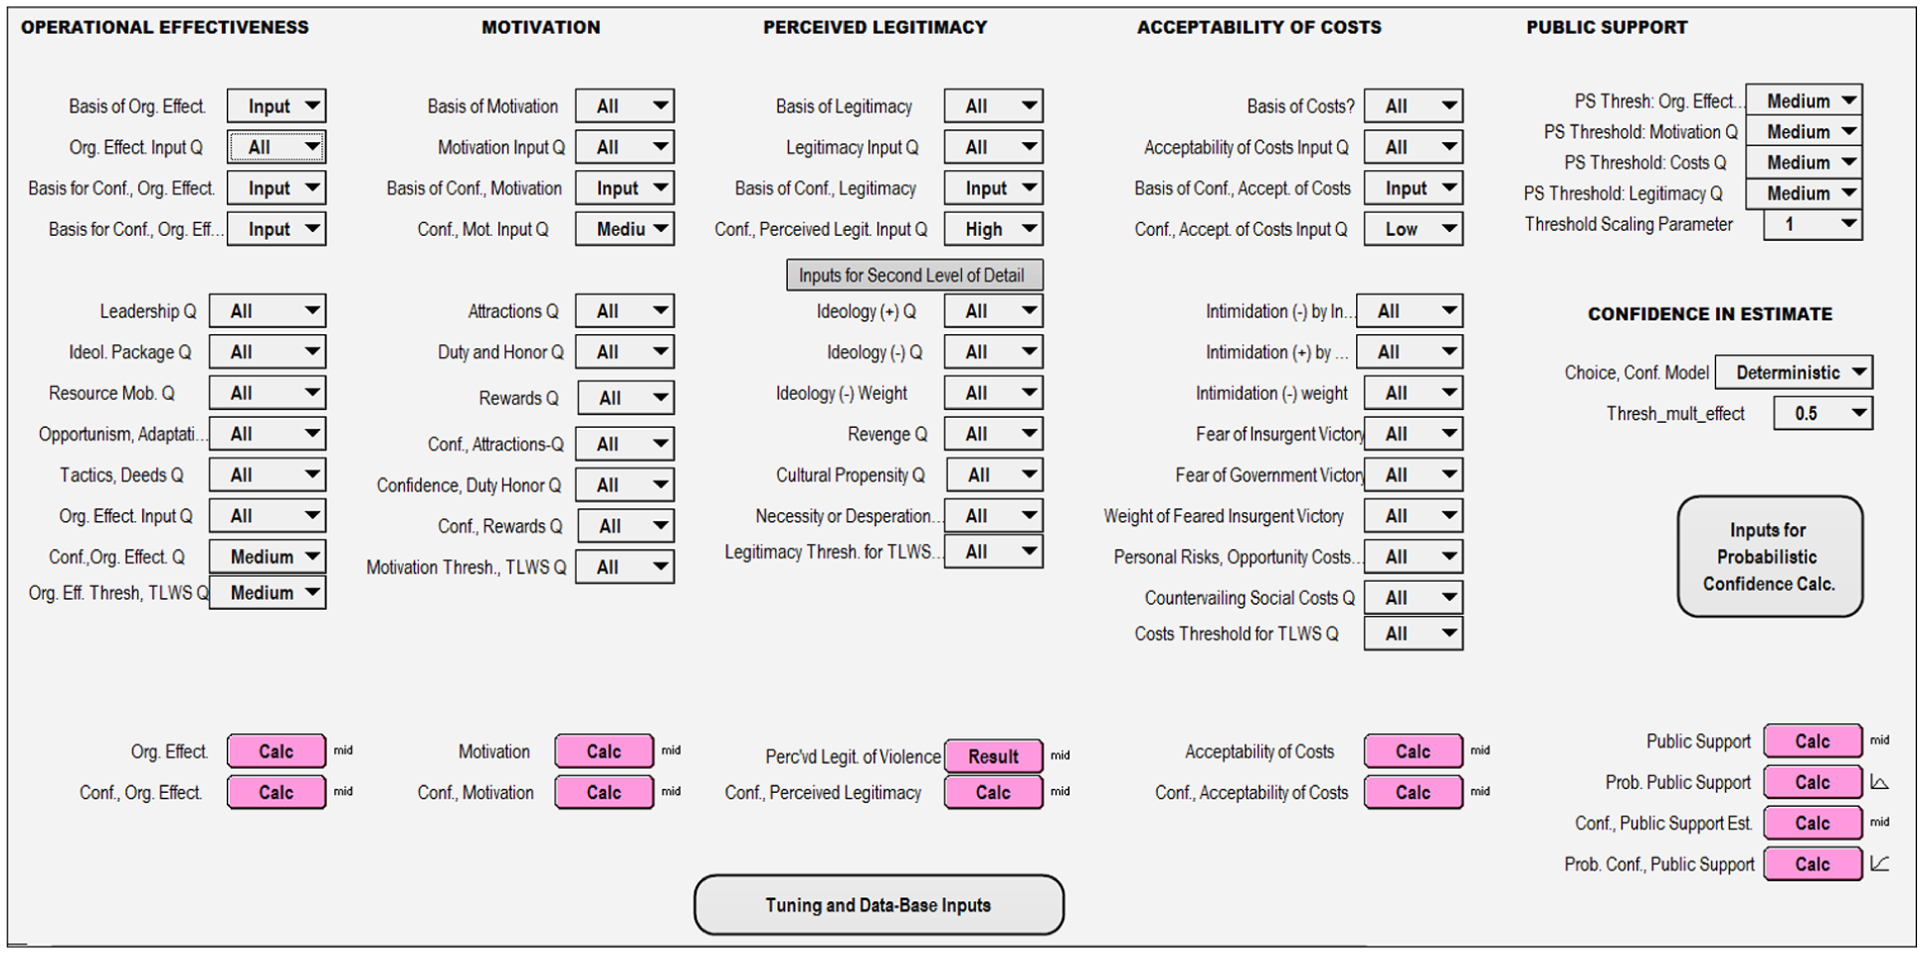
User interface.
Substantial effort is needed to build a program such as PSOT and some program details will not be easily understood by a non-programmer. However, the social science content is understandable from the documentation and program. Further, we believe that any good programmer familiar with linear algebra can understand the program with less effort than if it were written in a lower level language. This is important for reusability, composition, or reprogramming.
3.5 Exploratory analysis across uncertainty
We intended that the model be used to understand the consequences of uncertainty. It is usual for models to allow sensitivity analysis that changes input variables one by one. For nonlinear problems common in social system modeling, however, we need “exploratory analysis” to understand the results as many input variables are changed simultaneously. This is feasible with multi-resolution designs in which comprehensive exploration can be done with a relatively small number of high-level factors, with subsequent zoom into detail as necessary.
Figure 7 illustrates this with a PSOT display of public support as a function of attractions (a composite of, e.g., ideology and religion) on the horizontal axis, duty and honor (the differently colored bars), and four other variables shown at the top of the screen with specific values. These values can be altered in real time by merely selecting from their menus (akin to the slider bars used in other visual programming systems). Thus, by varying menu selections, an analyst can navigate through a six-dimensional output space while sitting at his or her desk. In the course of testing and analysis with similar models, we sometimes have as many as 10 or 20 such variables, although such complex displays are not suitable for broader communication. Simpler displays can be generated in a number of ways. For example, results can be projected onto the two-dimensional space of two key variables while averaging across results for different values of the many other variables. 48 Also, with suitable software, the computer can search the n-dimensional space and find what combinations of variable values produce clusters of good or bad results. This is called “scenario discovery” by some of our colleagues; scenario discovery 49 is part of a larger set of techniques for “robust decision-making” (RDM), references to which can be found at http://www.rand.org/topics/robust-decision-making.html).
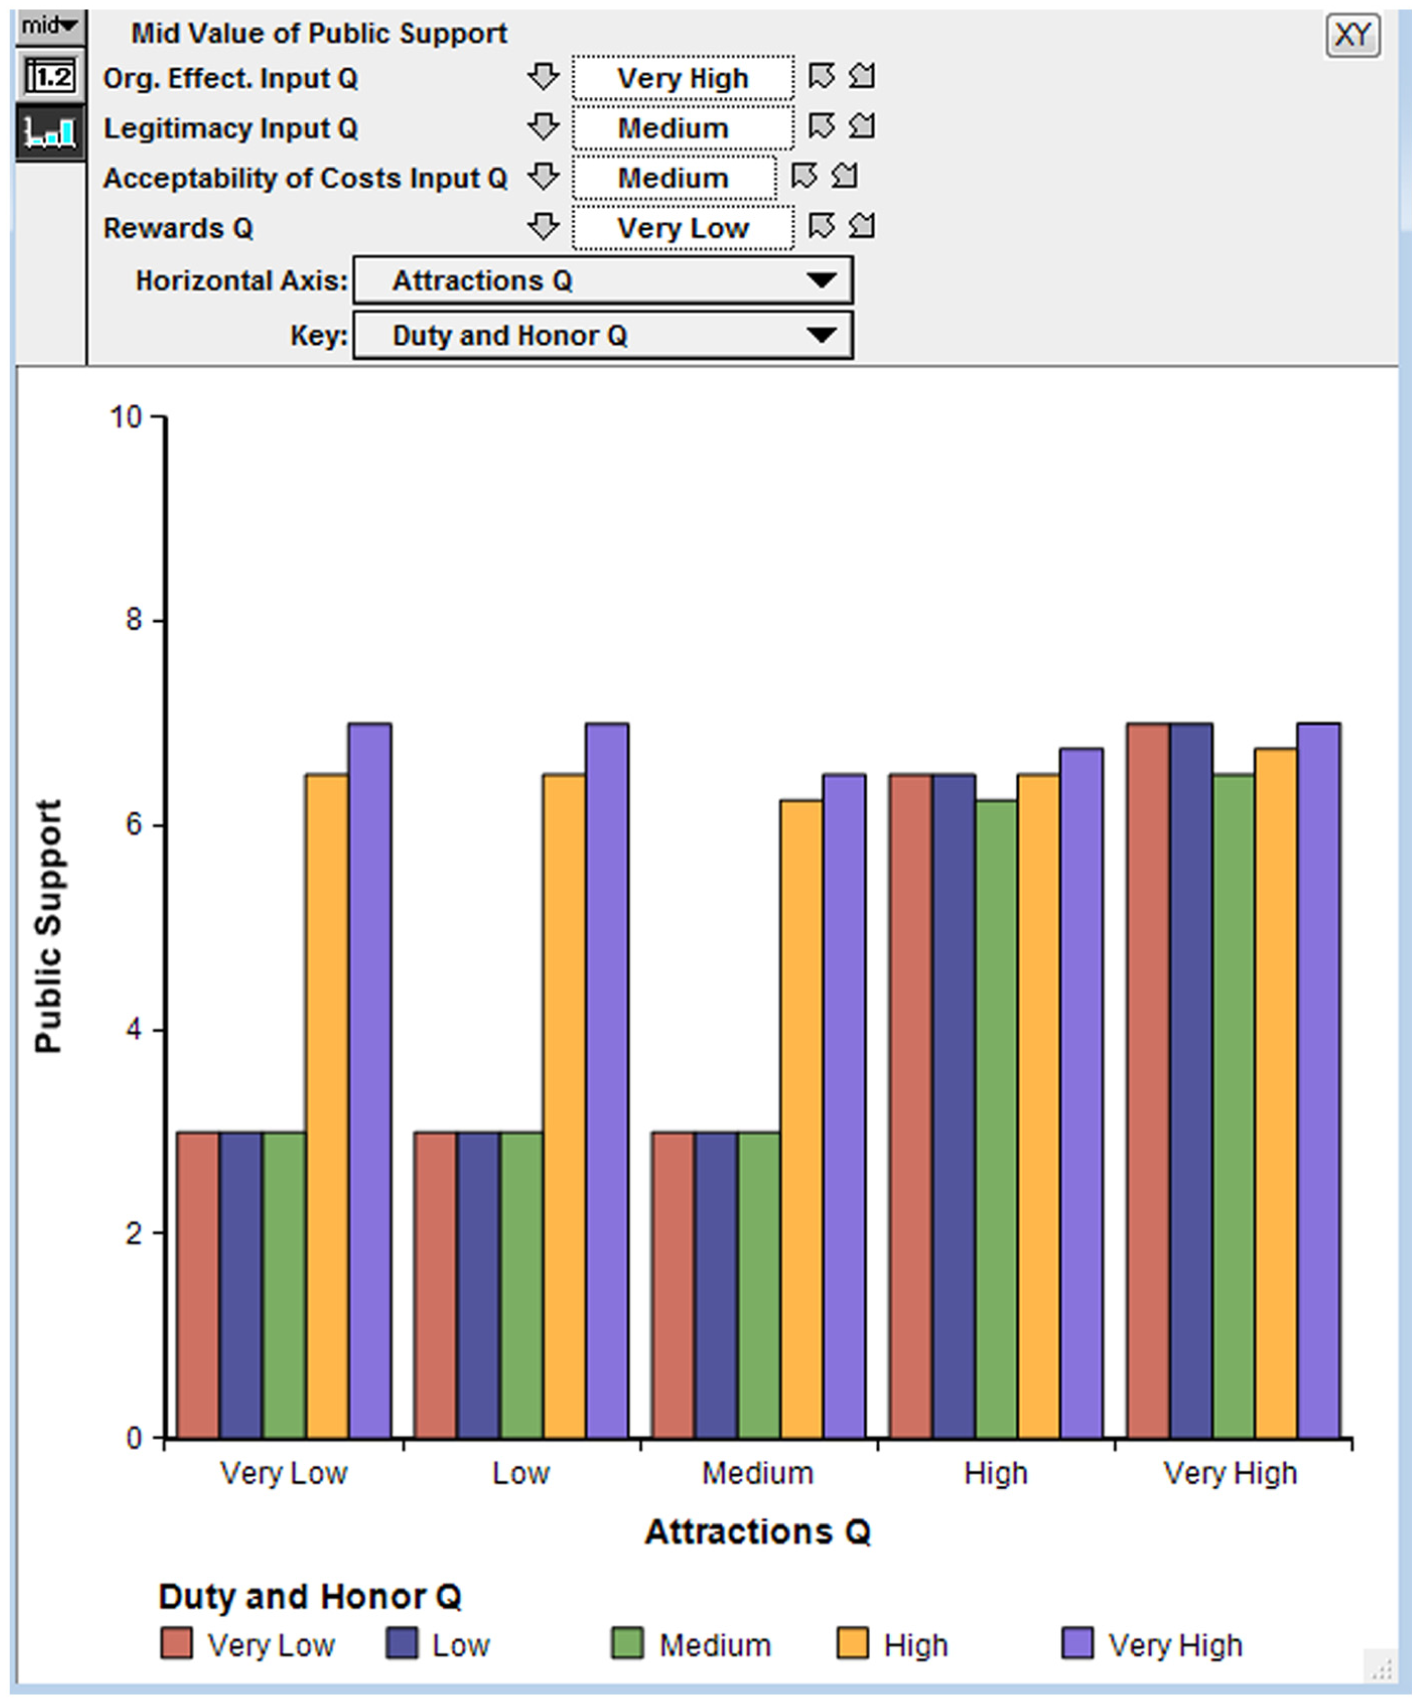
Multi-dimensional exploratory analysis projected on two dimensions.
It is sometimes convenient to show results of exploratory analysis with multi-dimensional displays, as in Figure 8. Such a display can be generated by exporting from PSOT into Excel and doing some manual manipulation. It shows public support for terrorism as a function of five variables. The result is analogous to what some readers may vaguely recall from earlier times: multi-dimensional nomograms. Other kinds of multi-dimensional displays can be generated automatically with tools for RDM or comparable modeling systems.
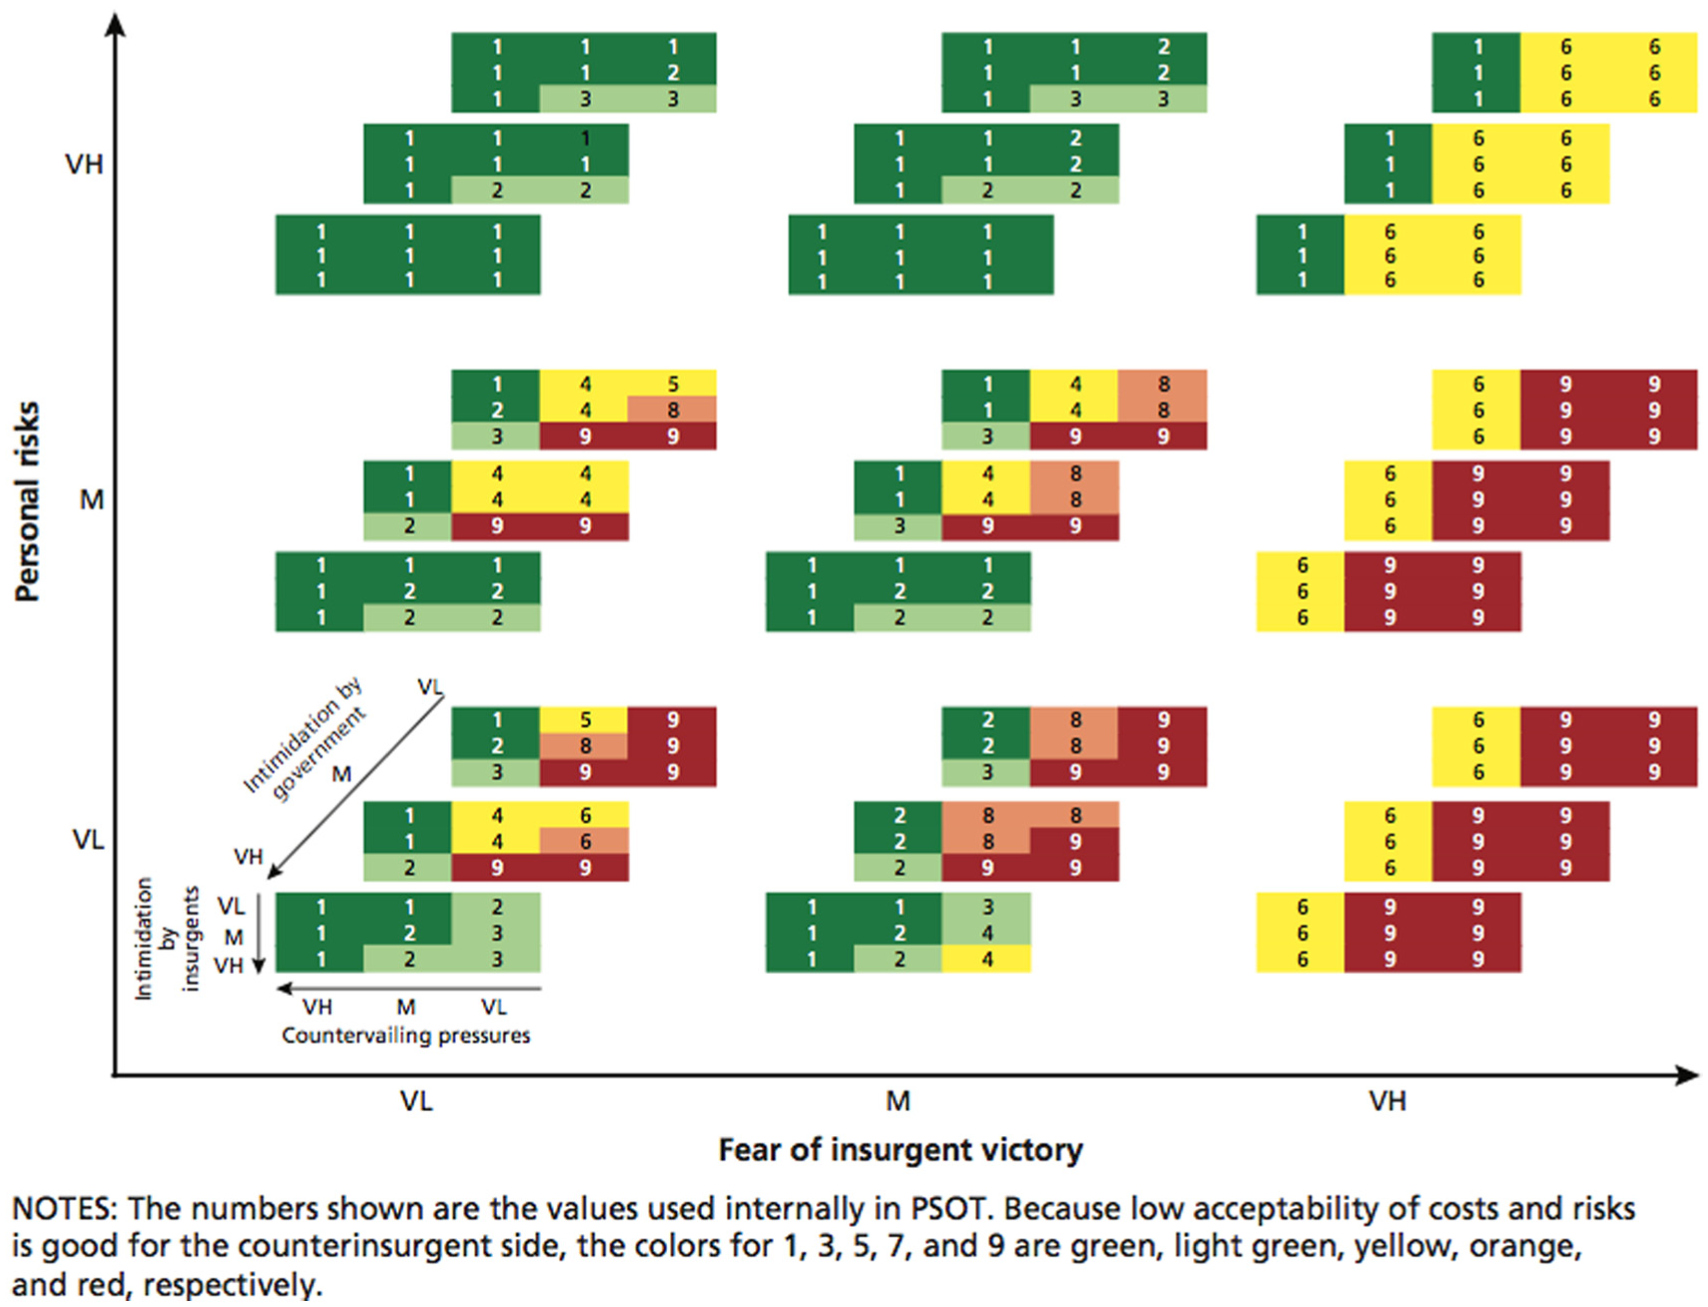
Illustrative output of exploratory analysis. (Color online only.)
3.6 Conclusions
The prototype effort demonstrated the potential for markedly improving representation of social science knowledge, eliciting knowledge from subject-matter experts, dealing with uncertainty, and working on the components of more or less composable models. We believe that such methods could be used systematically to address social science issues in national security (and other) domains on a module-by-module basis where peer review, substantive discussion, knowledge elicitation, and exploratory analysis work well. This said, ours was merely a start down a challenging path (one approach to extending this approach to include dynamics is included in this special issue of JDMS 50 ).
4 Using an uncertain social science model as part of heterogeneous information fusion
A 2015 study built on the previous experience. This basic research study investigated ways to fuse heterogeneous information as part of detecting terrorists.29,51 It sought to combine information types ranging from digital records on an individual’s background (e.g., prior arrests and convictions, travel history, weapons purchases), human sources (e.g., informants), and behavioral observations (e.g., deceptive behavior in an airport line). The information could be fragmentary, ambiguous, contradictory, or even deceptive.
An important element in the approach was using causal models rooted in social science to help put such fragments together. A model describing Propensity for Becoming a Terrorist (PFT) was developed using the same techniques as with PSOT above, and indeed reusing some of the PSOT code. This was possible because the reasons for an individual becoming a terrorist overlap with the reasons a portion of the public might support terrorism.
4.1 Objectives and challenges
The primary challenges in the study involved the mathematics of information fusion and the programming of a prototype platform, but some challenges were germane to this paper. In particular, the intent was to (1) address matters probabilistically, (2) employ causal social science models as part of the fusion, (3) use a mixed-methods approach to span the range of reasonable causal relationships and fusion methods, (4) have competitive streams of analysis because results depend on human imagination and judgment, (5) design for routine exploratory analysis under deep uncertainty, and (6) embody the system in a comprehensible analyst-centric computer platform that would facilitate review, debate, sharing, and re-use.
Figure 9 shows an overview of the concept, which anticipated iteration over time as new information becomes available. Within the process, one sees an emphasis on alternative causal models and alternative algorithms to account for structural as well as parametric and probabilistic uncertainties in both models and data. We see this idea as generically important because human and social phenomena are often uncertain.
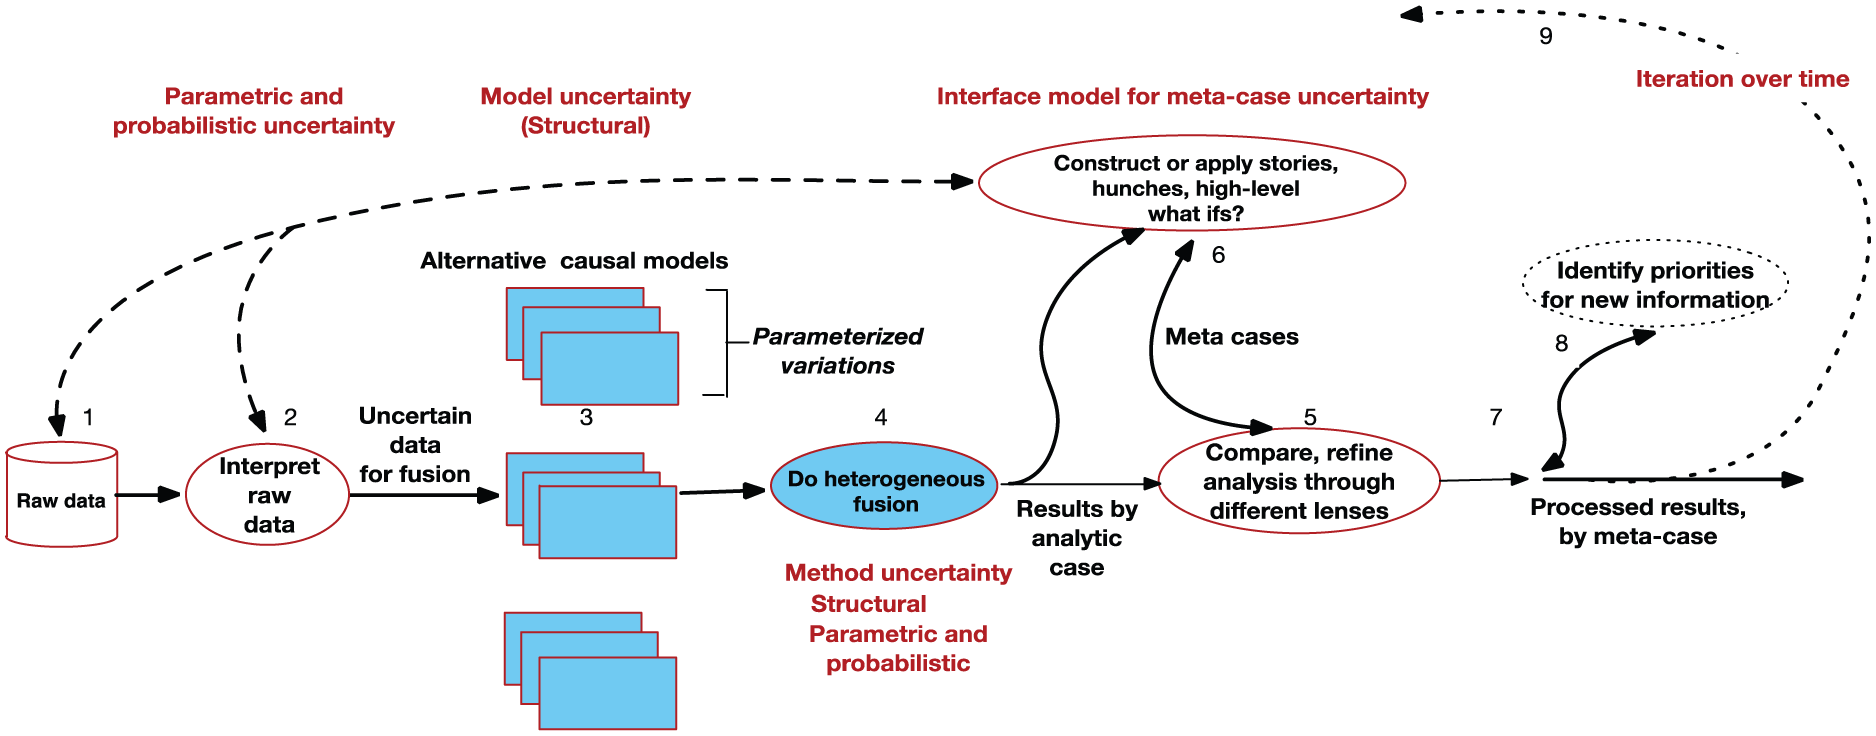
Process for heterogeneous information fusion.
The PFT model is indicated in Figure 10 as a factor tree. It depicts the factors influencing an individual’s propensity to commit terrorism and, thus, the threat posed by the individual. Although not separately validated, PFT was built on the earlier PSOT work and seemed reasonably credible as an example. We used only the top layer, which asserts that the threat T posed by an individual is a function of that individual’s motivation (M), perception of terrorism’s legitimacy (L), capability-opportunity (CO), and acceptability of costs (A). The role of capability and opportunity is particularly important and does not have an analogue in the PSOT model.
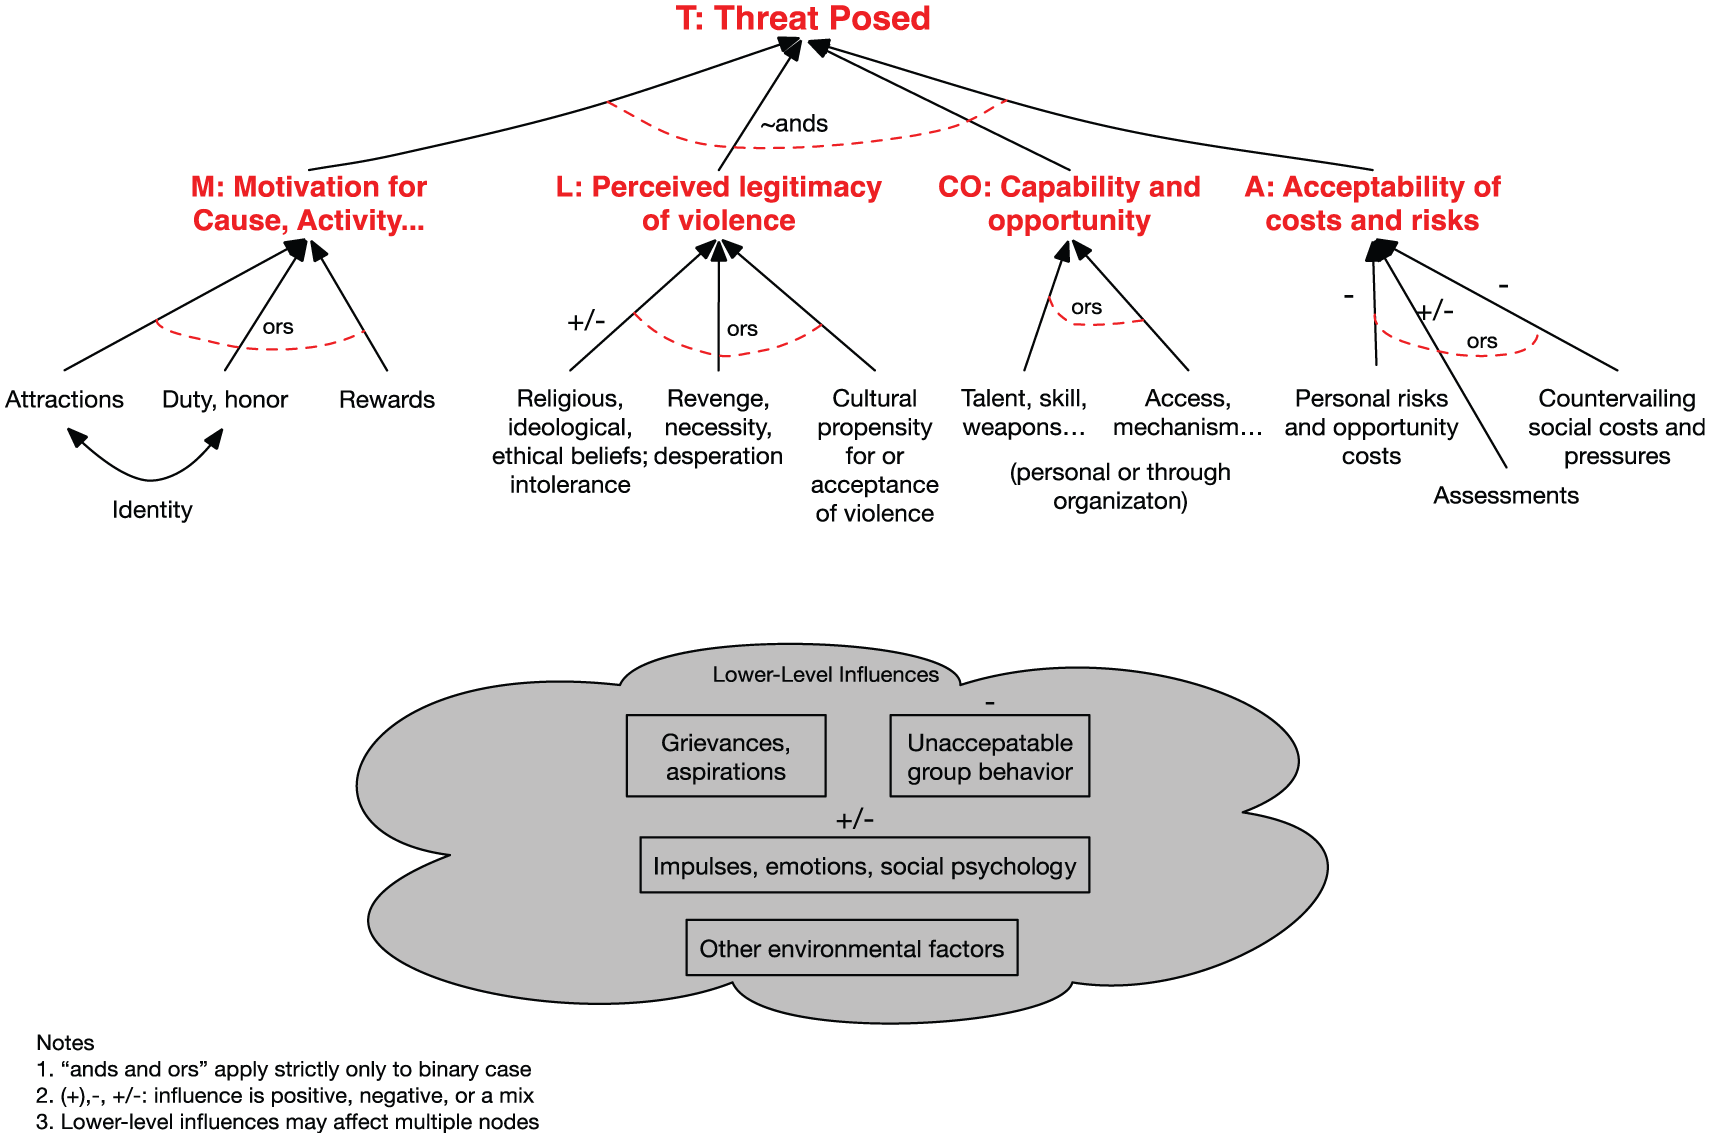
A truncated factor tree of propensity for terrorism.
In this application the factors of the model were represented with subjective probability distributions – sometimes bimodal. This allowed accommodating such inputs as from a human report saying that the individual in question was probably just sympathetic to certain aspects of radical Islamist propaganda but might very well be much more active and radical than was apparent, based on the informant’s knowledge, rumors in the community, and intuition. Whereas for practical reasons law enforcement officers must sometimes decide in a binary fashion whether to continue or discontinue treating someone as a threat, the study’s methodology anticipated a more nuanced view suited to accumulating information over time—whether to put pieces together and recognize a previously undetected major threat or to recognize when evidence effectively exonerates the individual, in part by explaining what might have been seen as incriminating.
The variables (factors) M, L, CO, and A were defined to be logically and probabilistically independent. This, however, depended on the model being used with data that has been properly interpreted. By exception, therefore, explicit correlations were permitted. For example, if a given human source did not understand the model’s difference between motivation for a cause and a sense of legitimacy in using terrorism tactics, then he might automatically report motivation and perception of legitimacy as having the same value: his inputs on M and
As with the earlier PSOT, the PFT model is deliberately not that of a rational actor doing cost–benefit calculations. Real individuals are affected by emotions, cognitive biases, and other non-rational considerations. Further, they may not even have stable utility functions, instead “discovering” their values as matters develop, rather as with “wicked problems” in the policy domain. 9 One of the important sources of motivation is enjoyment of danger, excitement, and bloody violence.
The study considered alternative fusion methods because which method is most nearly appropriate is often unclear. The study considered four types: (a) purely subjective; (b) nonlinear algebraic; (c) quasi-Bayesian; and (d) an entropy maximizing method (MEMP). The nonlinear algebraic methods borrowed from the earlier PSOT work. The quasi-Bayesian method is “quasi” because it uses heuristic methods to determine the weight given to different evidence. Also, it uses alternative “generic” likelihood functions and routinely shows results for all of them because the “real” likelihood function is often unknowable. The ME/MP method (largely the work of John Hollywood) comes from the perspective of information-theory entropy and uses methods from the machine-learning literature. Technically, it uses nonlinear programming for fusion, maximizing an objective function that includes a weighted sum of entropy-maximization terms and terms minimizing contradictions with reports, such as a claim that a person’s motivation is in the medium-to-high range. The method yields estimates of threat level that are as uncertain in an information-theoretic sense as possible given what has been reported.
4.2 Platform for exploratory analysis
Implementing the concept of Figure 9 was nontrivial. The initial version of the platform was more procedural—something an analyst who was not a programming expert could understand within days. That, however, hard-wired many choices. A redesign (primarily by David Manheim) included the flexibilities discussed earlier in connection with Figure 9, albeit with some loss of transparency.
One way to think about the structural issues is to recognize that the fusion analyst must operate on the data to map the raw data into the inputs of the platform; assign the data to each of the streams; decide on in what order to process reports; and decide on when and how to combine factors and fuse across reports. Some of these operations do not commute mathematically. The answers are different if, for example, we combine all fragmentary information at one time to estimate the probability of someone being a terrorist, and then fuse across different reports, or whether we instead fuse factor-level fragments across reports and only then combine to estimate threat.
Figure 11 shows simplified results for one case: the probabilities, after fusion, of a fictitious individual, Harry Smith, belonging to one of three categories: threat, gray-area, or non-threat. Results are shown as a function of the fusion method. The dashed lines indicate what the assessment was with just the initial information. The “slicer bars” at the top indicate major contributors to the result beyond the choice of fusion method. For the case shown, fusion greatly changed the likelihood ascribed to Harry being a threat. The changes, however, depended on the fusion method—alerting the analyst that it was necessary to go into more detail so as to better understand which method was most suitable in this particular case. Upon looking at that greater detail, it typically becomes evident that some fusion methods are quite misleading (e.g., over-valuing an alarmist human source, perhaps even a total fabrication, or—conversely–allowing the “weight” of numerous benign reports to obfuscate strong signals). This need to sometimes go into detail was part of our theoretical construct, something the opposite of the common desire to provide a single formula to be used consistently. It reflected our preference for man–machine operations rather than purely automated methods.
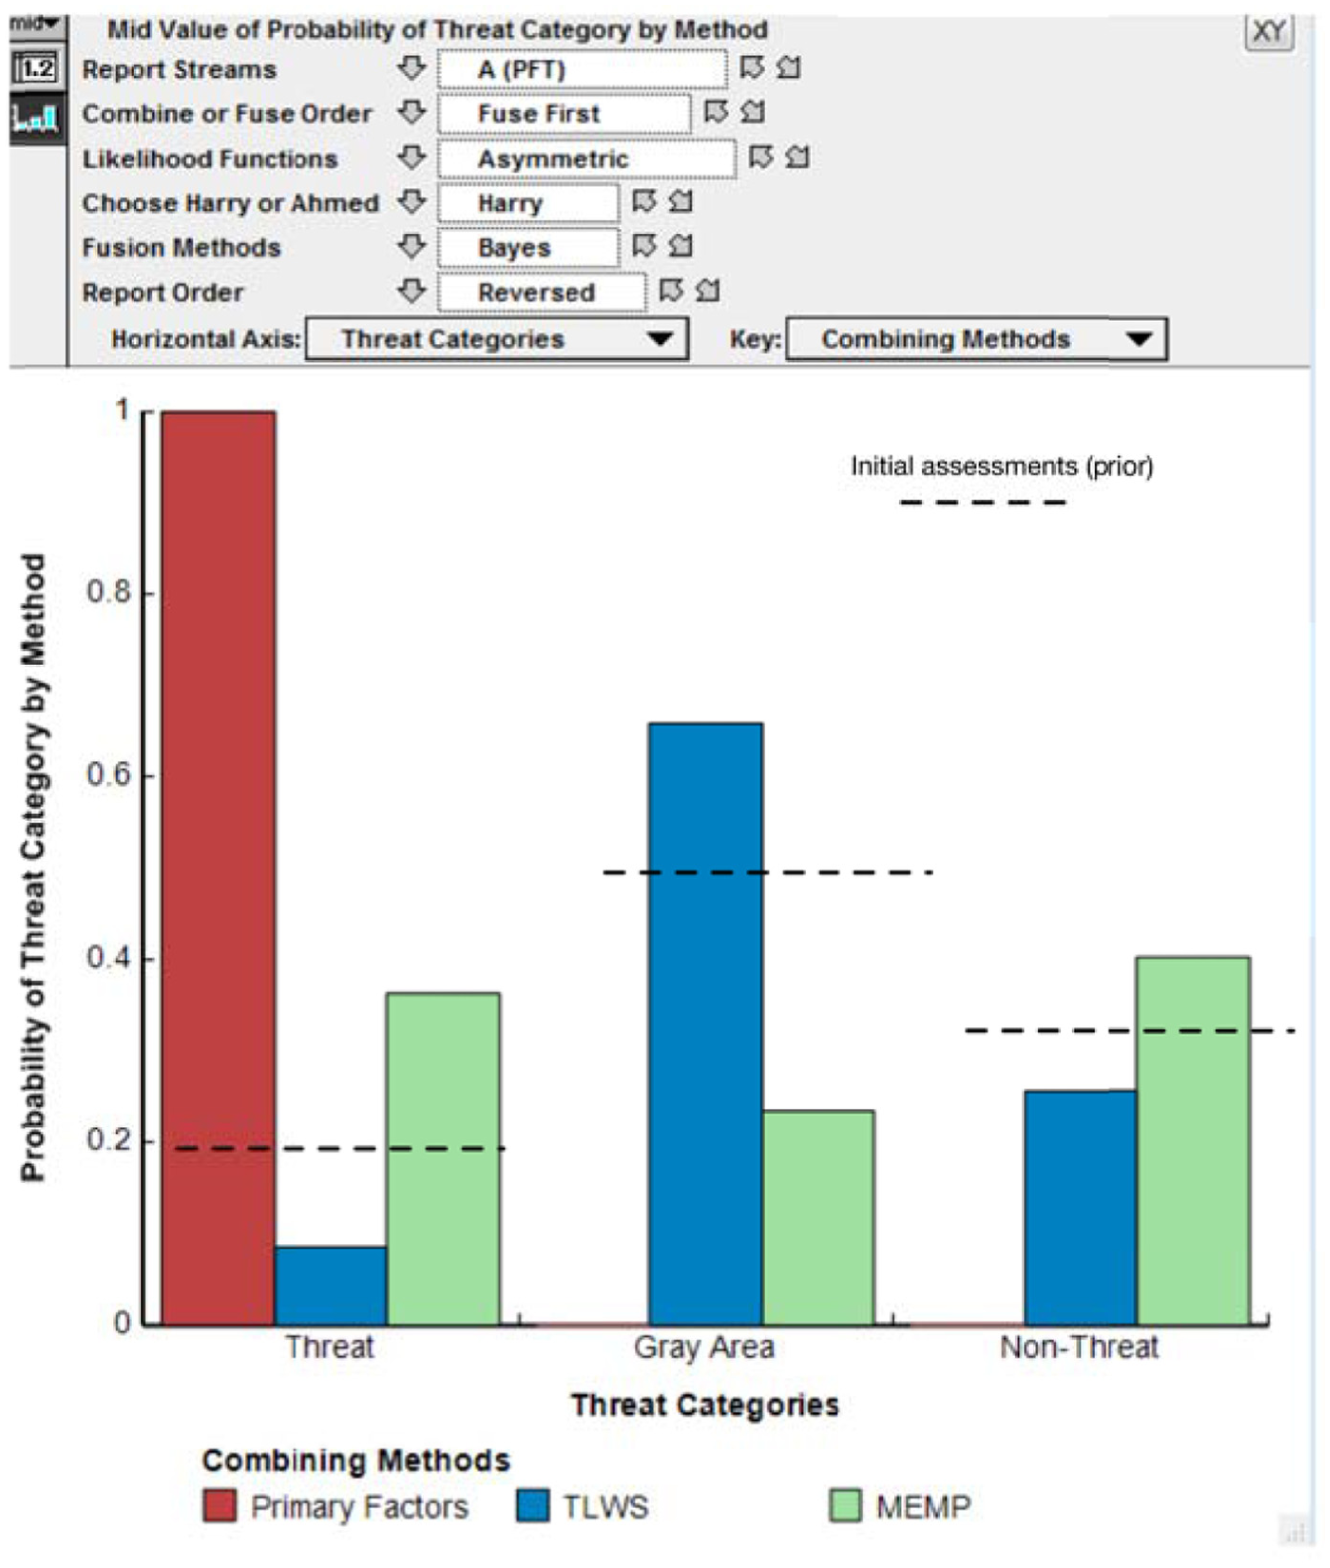
Illustrative results from prototype experiments. TLWS: Thresholded Linear Weighted Sums; MEMP: entropy maximizing method.
4.3 Conclusion
For the purposes of this paper, the primary conclusion from the work on heterogeneous fusion is that simple models incorporating social science knowledge can be embedded in larger models and tools, potentially in useful ways. A second conclusion is that methods used for such modeling can be used in a variety of applications.
5 Cognitive modeling: adversary modeling, human gaming, and decision aiding
As the last example of work in the current research stream, let us describe briefly what we sometimes refer to as cognitive modeling and how we use it to connect the domains of modeling, analysis, and human gaming. Only portions of this work have been published, but these convey the primary ideas.
5.1 Objectives and challenges
A basic truth in studying issues such as deterrence and how to aid decision-making in major crises is recognizing that the challenge is to affect the reasoning of the adversary. It does not matter what we think he should be concluding; instead, it matters how he is reasoning. This point is easy to forget—especially for modelers and analysts enamored of mathematical techniques and elegant constructs, such as game theory for rational actors (many of these issues are discussed in a recent National Academy report 9 ).
An ongoing research effort involving one of us (Davis) and collaborators in the Korea Institute for Defense Analyses (KIDA) reviewed lessons for deterrence theory from the Cold War, drawing on materials that have now been declassified and recent scholarly materials based on primary sources. 52 With the humility gained from this review, the ongoing research is building simple models of decision-making in crisis that attempt to capture more of the human reasoning and behavior of the adversary than can be inferred from purely quantitative approaches describing the alleged “calculus” of deterrence. A key objective is to connect such modeling with human war gaming, so that both can benefit from insights of the other. The tack being taken, however, is unabashedly that of theorists, modelers, and analysts. In our mind, human war gaming cannot substitute for theory. Rather, it should be an important source of quasi-empirical information. Figure 12 indicates the concept schematically. It is consistent with a model-test-model approach, as alluded to earlier in this paper.
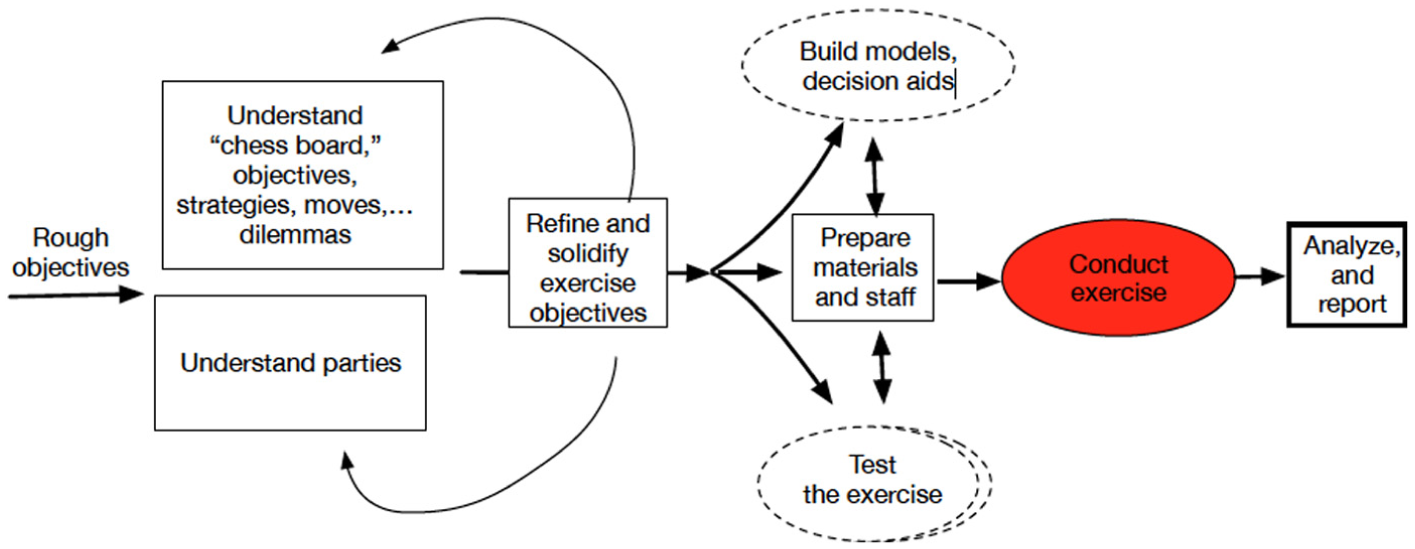
Process for using human gaming to test and enrich models.
5.2 Earlier research
The current research is drawing on a body of work from the Cold War of the 1980s. Intense arguments existed about whether the Soviet Union was intent on fighting and winning a nuclear war or whether instead it had adopted Western views about deterrence as discussed famously by Albert Wohlstetter in the 1950s. 53 One element of the DoD’s research was a project that developed what was called the RAND Strategy Assessment System (RSAS), a game-structured simulation that could either employ humans or artificial-intelligence agents in making key decisions for the Soviet Union/Warsaw Pact, USA/NATO, or third countries. 54 In the late 1980s, large computer models were constructed to represent decision-making of contending actors. Technically, a good deal of success was achieved, but this aspect of the system was too complex and demanding for effective transfer to the government or for easy maintenance. Some of the basic ideas, however, could be abstracted and used in far simpler models, as in research before and during the first Gulf War with Saddam Hussein 55,56 and dealing with North Korea’s Kim Jong Il 57 in the early days after he came to power. 17
Recent work along these lines included a human war game held in South Korea, designed specifically with the insights of prior modeling. The game was used to validate aspects of the model, to add significant additional factors and additional options, and to adjust assumptions about adversary reasoning. To put the matter more simply, the teams in the game largely covered material anticipated by theory (as represented in the model), but considered additional options and reasoned somewhat differently than expected. This was good, not bad; it meant that something had been learned from the game and that the model could be iterated. To be sure, the next human game will have different teams, opinions, and nuances, but the intent of the process in Figure 12 is not to find some single truth, but to better understand and prepare the realm of the possible.
Within this continuing effort, the cognitive models are similar in many respects to the social science models described in Sections 3 and 4. They begin with conceptual modeling and are implemented in an Analytica model. They are “uncertainty sensitive” so as to be useful for exploratory analysis. As part of this, it is necessary to identify potential options, criteria by which actors would assess those options, associated factors, or variables, and reasoning flows. Further, it is necessary to consider alternative models of adversary reasoning because adversary reasoning is unknown and often misunderstood. If such a model is called Blue’s Red, it is also necessary to recognize that Red has its own model of Blue. Thus, we must consider Blue’s Red’s Blue. This might suggest an infinite recursion, but the models became increasingly simple (even simplistic) with depth. In any case, even these simple models incorporate variables reflecting such psychological considerations as desperation or risk-taking/risk-avoiding behaviors. The need to do so is well established by psychological research and historical work. 58,59
6 Relationships with other modeling methods of representing social science in national security work
Given this background on recent work it would be appropriate to compare it to other methods. That, however, would be far beyond the scope of this paper. Papers illustrating or discussing some of the other relevant methods are included in the special issue of JDMS for which our paper was prepared. The other methods covered include agent-based modeling 59 ; fuzzy-logic modeling 50 ; mixed qualitative methods, such as narrative analysis, counterfactual analysis, system diagrams, and general morphological analysis (GMA) 60 ; cultural transmission 61 ; and social-network methods in nuclear proliferation analysis. 62 We noted earlier in the paper the importance of system dynamics methods, summarized in a textbook. 21 A number of national security applications have been made with it over the years, as illustrated by a recent article modeling the dynamics of radicalization 63 using both system dynamics and multi-model methods.
In this article we elaborate on only some relationships, those between our approach and statistical methods. Our approach contrasts strongly with most data-driven statistical modeling. To set the stage we must note that the word “theory” has drastically different meanings in English. This confusion arises in public discussion of evaluation (is evolution a fact, a mere theory, a settled theory, or a combination?), but it exists also within the scholarly community. In one meaning, “theory” means little more than “notion” or perhaps a belief that a particular independent variable has a causal relationship to another. Social science, then, may have multiple “theories” that help explain terrorism, insurgency, civil war, or the fighting effectiveness of armies. In contrast, in the hard sciences and engineering “theory” often refers to a coherent set of principles and relationships that make sense of a phenomenon. Theory is what pulls fragmented ideas together; it is what allows integrated sense-making. Even tentative theories are efforts to move in that direction. To be more blunt about the contrast in usages, “theory” may be pejorative (“Oh, that’s only a theory”) or strongly positive.
With this background, Table 3 draws some contrasts between data-driven and theory-driven inquiry with “theory” having the second meaning above, that of a coherent set of principles and relationships that attempts to explain (make sense of) a phenomenon in cause–effect terms. Such a theory seeks to identify all the variables relevant, rather than discussing only one or a few of them.
Contrasting approaches.
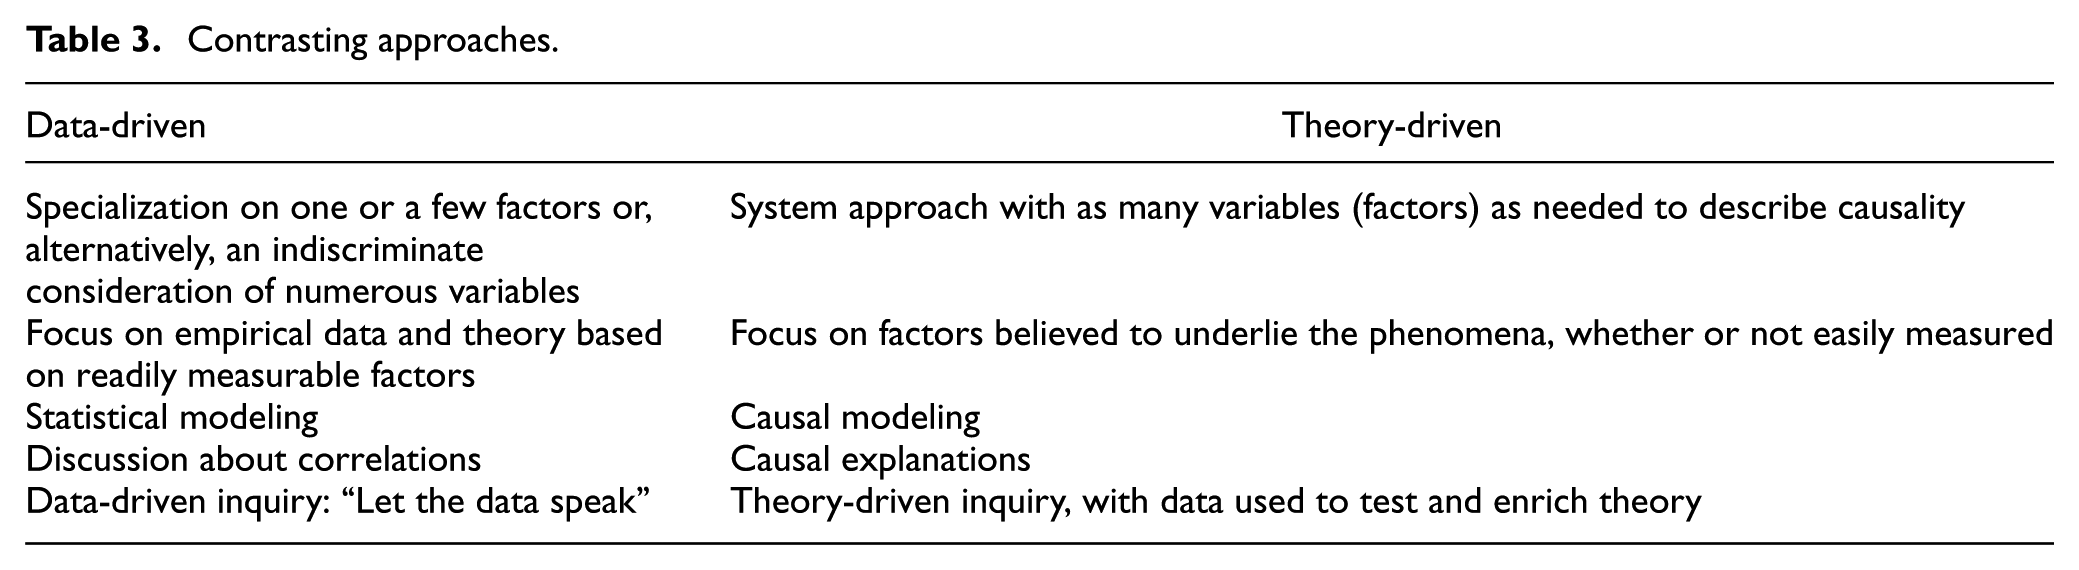
Data-driven research tends to specialize in one or a few factors, as in the testing of single-factor hypotheses, or a kitchen-sink approach that considers numerous variables rather indiscriminately and then tries to sort them out with multiple regression. In contrast, theory-driven research seeks a unifying theory that will often have a number of variables, but only those that appear to “make sense” in a systemic description. Some of the variables may be lower level causes of higher level variables, as in multi-resolution modeling. Data-driven research focuses on the data itself, particularly objective data (e.g., a country’s official gross domestic product (GDP), the size of an army, or demographics). Theory-driven research is more concerned about causal variables, which may or may not be easily measured (e.g., the fighting effectiveness of an army, a country’s total economy [including the unofficial economy that operates in the shadows], various frictions that impede effectiveness, and the resonance of ideas.
Data-driven researchers summarize knowledge with statistical models and refer to correlations (except when they get sloppy and use causal language inappropriately). When such researchers use the word “explanation,” it has the special meaning associated with what fraction of a data set’s variance is covered by the regression model being used. In contrast, theory-driven research is deeply concerned with causality and uses “explanation” in connection with sense-making and reasoning through a causal chain.
Attitudes about data are also interesting. To the data-driven practitioner, data is the focus; it is what is revered. Data may allow an empirical theory to be inferred, but any such theory should—in the data-driven view—be parsimonious (e.g., a simple regression using only objectively measurable variables). To the theory-driven practitioner, however, the objective is to develop an encompassing theory that pulls strands together and extrapolates beyond what has been observed. Additional variables may be essential for understanding the phenomena, even if their values are uncertain. Data remains crucial, but its purpose is to test and refine the theory. If some data is not available, theory calibration may include one or more composite empirical coefficients without apology (e.g., a friction coefficient, a fighting-prowess multiplier for certain units or national armies, a surprise-attack effect, or the time constant of an exponential delay factor).
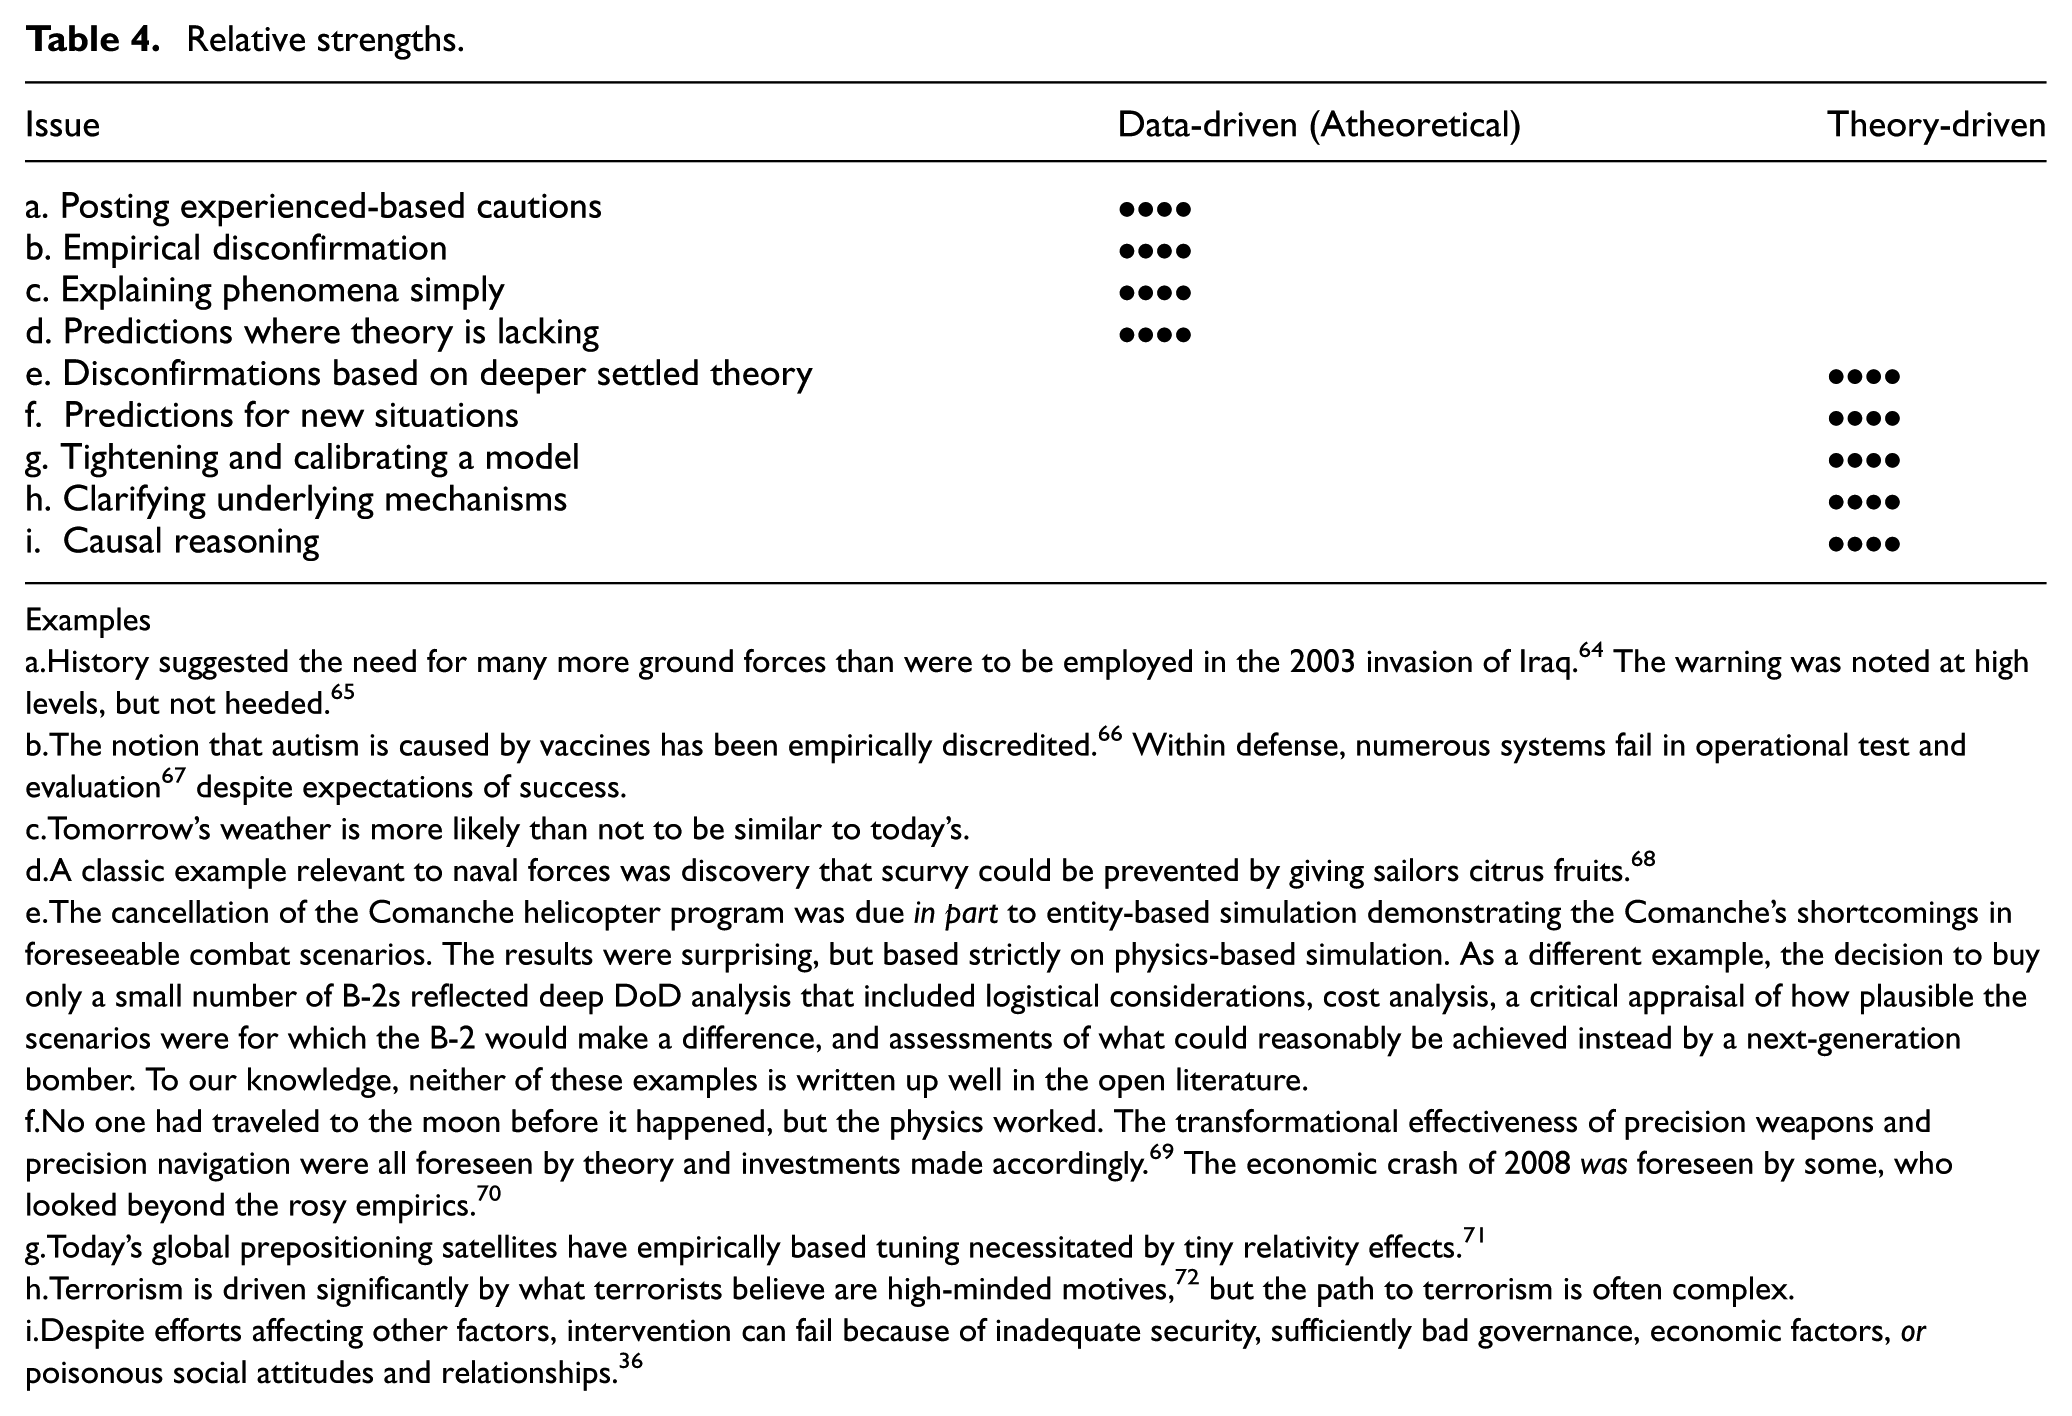
Many researchers fall clearly into one or the other of these “tribes,” but science needs multiple approaches because they contribute differently, as suggested by Table 4, in which the number of bullets indicates relative strength.
Relative strengths.
Examples
History suggested the need for many more ground forces than were to be employed in the 2003 invasion of Iraq. 64 The warning was noted at high levels, but not heeded. 65
The notion that autism is caused by vaccines has been empirically discredited. 66 Within defense, numerous systems fail in operational test and evaluation 67 despite expectations of success.
Tomorrow’s weather is more likely than not to be similar to today’s.
A classic example relevant to naval forces was discovery that scurvy could be prevented by giving sailors citrus fruits. 68
The cancellation of the Comanche helicopter program was due in part to entity-based simulation demonstrating the Comanche’s shortcomings in foreseeable combat scenarios. The results were surprising, but based strictly on physics-based simulation. As a different example, the decision to buy only a small number of B-2s reflected deep DoD analysis that included logistical considerations, cost analysis, a critical appraisal of how plausible the scenarios were for which the B-2 would make a difference, and assessments of what could reasonably be achieved instead by a next-generation bomber. To our knowledge, neither of these examples is written up well in the open literature.
No one had traveled to the moon before it happened, but the physics worked. The transformational effectiveness of precision weapons and precision navigation were all foreseen by theory and investments made accordingly. 69 The economic crash of 2008 was foreseen by some, who looked beyond the rosy empirics. 70
Today’s global prepositioning satellites have empirically based tuning necessitated by tiny relativity effects. 71
Terrorism is driven significantly by what terrorists believe are high-minded motives, 72 but the path to terrorism is often complex.
Despite efforts affecting other factors, intervention can fail because of inadequate security, sufficiently bad governance, economic factors, or poisonous social attitudes and relationships. 36
We have benefited from the fruits of both streams of work, so it is a matter of some passion to respect and encourage both. It seems clear, however, that extant work on the “analytic” side of the relevant social sciences is dominated by the statistical approach and that much more work is needed in causal system modeling. Ironically, the best insights to guide such causal modeling often come from qualitative social science.
Interestingly, some relatively new developments in social science may constitute a trend. Econometricians, in particular, are concerned with causality, not mere correlations. They have developed techniques that are now showing up particularly in economics and political science, but have also made in-roads in other social science fields. These are moving research from “kitchen-sink” large-observation multiple variable regression models in which modelers strove to increase the number of observations included in analyses and offset concomitant contextual heterogeneity and multi-causal considerations by including a multitude of independent variables, to a focus on “strong causal identification” for clearly delineated contexts. In large-observation regressions, researchers include many variables to maximize the model’s “explanation” of variation in the dependent variable (maximizing the R-squared). Focusing instead on causal identification encourages more narrow study to measure effects of individual causes (factors). This allows for strong claims about local average treatment effects, but generalization is difficult. 73 Some of the related techniques that statistical researchers have used include regression discontinuity designs, the use of instrumental variables, and difference in difference designs. 74
These developments are moving social science toward more focus on causality, as are cutting edge methods of Bayesian networks, 25 but many of the differences indicated in Table 3 continue. If data-driven and theory-driven approaches represent thesis and antithesis, then synthesis arguably consists of analyzing data informed by (but not dictated by) theory. It is possible to at once test a theory to see if it largely accurate and note its shortcomings. One way to do so is to use motivated metamodels, 75 which were first proposed for developing a simplified but meaningful model based on a much more complex but credible model. This has proven useful in a number of prior studies, demonstrating that the results of a rather complex model can be substantively explained for the most part by a much simpler model.30,48,76 The only data used in such studies, however, was from detailed simulations.
In the empirical context, a motivated meta model can be used to add theory-informed variables to the variables that would otherwise be used in regression analysis. Suppose, for example, that data existed on four independent variables X1,…X4 and the result Q (for the factor tree of Figure 1, Q would be public support for terrorism and the X’s would be the highest level factors). A statistician might try to fit a linear regression as follows:

using the data to evaluate the C coefficients. If, however, an approximate theory exists in the form (whether closed form or as a computer model):

then the same mathematical apparatus (linear regression) can be used by with an altered “specification”:

If the theory is rather good, then the first coefficient will be large and the others small, in which case one has a built-in approximate causal explanation, plus some empirical corrections. If the theory is poor, then the analysis will disconfirm it.
When motivated metamodeling was first presented, the authors believed it to be mere common sense, and perhaps what many people were actually doing already. Over the years, however, it has become evident that many empiricists (and operations researchers) do not use such theory-informed specifications. We suggest that it become more common to do so when the causal theory is attractive enough to merit the effort.
7 Thoughts on future research by the community
Representing social science considerations in national security modeling and simulation is a momentous challenge that will require myriad methods and a good deal of research and applied study, a good reason for the special issue of JDMS for which this paper was prepared. We have described a particular stream of work that we hope will contribute. In particular, we have tried to illustrate:
the value of qualitative models in themselves (as “thinking models”);
the value of qualitative models as a starting point for semi-quantitative uncertainty-sensitive computational modeling;
the feasibility of building such models with relatively simple building-block mathematics that translates readily into high-level programs that can be understood substantively without programming expertise (i.e., understood by professors and analysts who are not real programmers);
the feasibility of dealing with human and social considerations by identifying modules (e.g., propensity of an individual to become a terrorist) that can be separately modeled, reported, debated, and reviewed in an analogue to classic scientific process;
the potential for having such modules be reusable and easily reprogrammable as necessary for the composition of more complex models.
We have also argued that social science could benefit from a synthesis between data-driven and theory-driven approaches with qualitative or semi-quantitative models (causal theories) used to identify complex hypotheses to be tested empirically, in preference to using multiple regression methods with kitchen-sink variables. This will include inducing factor trees from data. We are currently involved in DARPA research in which doing so is being highlighted as a major research challenge.
Footnotes
Funding
This research received no specific grant from any funding agency in the public, commercial, or not-for-profit sectors.