
Abstract
This article advances the geographic grid approach to military unmanned aircraft systems (UAS) routing featured in the existing literature. Its contributions are twofold. First, it demonstrates an empirical scoring system to determine the most important areas for maritime domain awareness-focused intelligence, surveillance, and reconnaissance collection, applying the method to the South China Sea. Second, it introduces what we call the “team orienteering problem with prize-dependent loitering times” (TOP-PDLT) and uses that model to identify optimal UAS collection routes in the South China Sea. Compared with other grid-based UAS routing schemes that use service time-dependent profits, TOP-PDLT is shown to be particularly applicable to military use-cases.
Keywords
1. Introduction
Security and law enforcement operations worldwide make extensive use of unmanned aircraft systems (UAS), with over 100 countries possessing military UAS programs. 1 Military UAS perform intelligence, surveillance, and reconnaissance (ISR) missions to gather information about threats, patterns of life, and other details central to decision making. The US military relies on technologically advanced UAS to monitor the Western Pacific, Eastern Europe, Middle East, and other areas crucial to American national interests.
The importance of UAS makes them a scarce resource for many operational planners. Rarely does the supply of UAS satisfy the demand for what they collect. 2 As a media correspondent 3 noted early in the US-led air campaign against the Islamic State of Iraq and the Levant (ISIL), “[T]here are simply never enough [UAS] to provide sufficient coverage.” The relentless demand for UAS leads to intensive scrutiny of how planners use them. 4 Any planner failing to employ UAS resources effectively risks losing those resources to competing planners—an outcome that may jeopardize accomplishing their mission.
Existing scholarship supplies rich insights about optimizing the information-gathering performance of scarce UAS resources. Analysts have produced a wealth of studies on UAS route planning,5–8 a topic that cuts to the heart of employing UAS effectively. Scholars have applied the traveling salesman problem and vehicle routing models 9 to plan optimal UAS surveillance of a geographic area or series of targets within an area. Within that line of research, previous studies have developed techniques for routing military UAS across a geographic grid in which individual cells provide varying information gains.10–19
This article follows the geographic grid approach to military UAS routing but makes two contributions to advance the literature. First, the article develops a scoring system that we call “trouble and traffic” to determine the most important areas for maritime domain awareness-focused ISR collection, applying that scoring system to the South China Sea. The system assigns weighted values to different areas by analyzing both geopolitical risk factors (trouble) and vessel density derived from open-source automatic identification system (AIS) data (traffic). The system combines research and judgment in a manner resembling how ISR practitioners perform collection management tasks such as preparing the Joint Integrated Prioritized Collection List (JIPCL), a process in which planners convert intelligence requirements into ranked collection requirements.2,4,20,21 This article’s empirically based scoring system, which emphasizes maritime surveillance targets and aligns with ISR planning practices, offers an alternative to assigning weighted values by assumption or based on terrain features, the approach featured in other notable military UAS routing studies. 15 Essentially, the article demonstrates an empirical, maritime-focused method for practitioners to operationalize the weighted scoring concepts developed in those previous studies, complementing the illustrative analysis of Somali piracy presented in Moskal II and Batta. 16 National security policymakers will likely derive more value from analyses using scoring by empirics rather than scoring by assumption because authoritative studies of policymaker preferences show that decision makers cherish scholarly research addressing real-world regional security conditions. 22
Second, the article introduces what we call the “team orienteering problem with prize-dependent loitering times” (TOP-PDLT) and uses the model to identify optimal UAS collection routes in the South China Sea grid. The team orienteering problem considers a situation in which groups traveling within a pre-designated area coordinate to visit checkpoints, earn associated points, and maximize their collective score before time expires. In our TOP-PDLT variant, groups must loiter at each checkpoint for a penalty time period equal to the checkpoint’s weighted value. Loitering duration per location is thus established ex ante based on the trouble and traffic scores; it is not determined ex post based on emerging target availability,14,23 on-target collection performance,10,16 changing weather conditions, 24 or other dynamic factors that become apparent only after the mission begins. The TOP-PDLT model captures the fact that in real-world UAS operations, increasing loiter time over a target generally increases information gain, at least up to some saturation point of diminishing marginal returns—a logic previously explored by studies on service time-dependent profits in non-UAS contexts.25–28 Since loiter time affects information gain, operational planners typically task UAS to loiter longer over more important targets than over less important targets. 29 By allocating UAS resources strictly based on information available before a mission begins, TOP-PDLT mimics how air planners develop and execute a baseline ISR collection plan. TOP-PDLT illustrates this baseline plan’s optimal outcomes, providing a benchmark that decision makers can then compare to alternative employment schemes incorporating ex ante information streams analyzed in the extant literature. In sum, the TOP-PDLT model provides an approach to military UAS routing that differs from—but complements—existing scholarly approaches while reinforcing methods used by ISR practitioners.
Overall, the article contributes both an open-source intelligence assessment of the most important South China Sea areas for maritime domain awareness-focused ISR collection and a novel optimization solution for routing UAS to those areas. In the future, scholars could apply our methods to explore UAS routing in geographic areas beyond the South China Sea. Meanwhile, planners could use our techniques to refine their operations and ensure that they employ scarce UAS resources effectively. Applying our methods to alternative geographic areas and operational contexts will likely require analysts to adjust certain assumptions and modeling parameters given that the article’s scenario, South China Sea maritime domain awareness, involves specific conditions that may not exist elsewhere. Nevertheless, by contributing an illustrative use case, the article provides intuition and demonstrates techniques that future researchers can adapt to their own analytical scenarios. In addition, although the article focuses primarily on technical considerations related to UAS routing, we acknowledge that UAS do not always support joint military operations and that politics and other real-world factors constrain UAS planning and often preclude achieving optimal outcomes. Despite these limitations, identifying optimal UAS outcomes is still valuable because they provide a benchmark that planners can strive to achieve over time.
This article proceeds as follows. The next section describes in greater detail the existing studies most relevant to our research. The article then presents the analytical problem by introducing the South China Sea geographic grid and outlining the UAS available to surveil it. Next, the article presents the solution strategy by introducing the TOP-PDLT model and applying it in a computational experiment. After presenting results and discussion, the article concludes by offering suggestions for future research and policy applications.
2. Literature review
2.1. UAS routing
Analysts have studied UAS route planning extensively to address fundamental questions about how to employ UAS effectively. In a review of papers published from 2005 to 2019, Viloria et al 8 reported that only 4% of the papers included in their sample focused solely on military applications, with the vast majority (90%) examining either general surveillance or parcel delivery. The military-focused studies in their sample analyzed topics such as attack targeting, threat reduction, or reconnaissance,23,30–33 mirroring the military applications illustrated by Singhal et al 34 The large volume of research produced on UAS route planning for civil applications should remind military-focused researchers that innovations in the field may come from scholars working outside military applications.5,35 Such innovations from civil applications include moving from modeling military UAS in two-dimensional space, the literature’s typical approach, to modeling in three-dimensional space.7,13 Another potential innovation involves modeling large numbers of UAS operating simultaneously, a well-developed problem in civil applications such as parcel delivery via UAS.36–38 This application is becoming increasingly relevant to military researchers as countries invest in larger numbers of lower-cost military UAS that operate using swarm tactics. 39
In another review, Macrina et al 6 introduced a typology of drone routing problems and summarized how researchers have handled objective functions, target revisits, and other aspects of their analyses. Interestingly, the review critiqued the literature for failing to use realistic technological parameters when studying UAS, to include making unrealistic assumptions about speed and endurance when performing sensitivity analysis. In the authors’ experience, this problem is less common in the military operations research community, where close collaboration between scholars and practitioners tends to prevent analytical excesses by harnessing both civilian and military strengths. As Enthoven and Smith 40 noted in their classic study, “Both civilians and military men can bring to discussions of strategy and force planning elements that the other can bring only with great difficulty, if at all.” To preserve this general strength of military operations research, our analysis takes care to include realistic parameters for UAS speed, endurance, and sensor range.
2.2. Military UAS routing using geographic grid
Analysts have produced pioneering studies on routing military UAS across a geographic grid where the individual cells possess varying values. Our article builds on this important line of research. Mishra et al 14 included a case study in which a fleet of military aircraft visited a series of geographic nodes based on the emergence of targets and dispatching rules developed by the authors. Using the same geographic nodes, Thyagarajan et al 18 explored how military aircraft might vary their ingress paths spatially and temporally to minimize the risk of detection. Henchey et al 12 advanced this geographic-node approach by modeling UAS loitering, wind effects, and fuel burn rates, and Xia et al 19 demonstrated a decentralized control strategy in which UAS use a region-sharing model to accomplish their missions. Cho and Batta 10 assessed how a UAS’s sensor-capture radius, speed, and service (or loitering) time affect performance against emerging targets, finding that sensor radius and service time exert significant effects. Dasdemir et al 11 studied the general problem of UAS routing in radar-monitored environments and developed a hybrid algorithm to solve larger problems given constrained computational resources and desired levels of accuracy. Finally, in a recent series of papers, Moskal II and Batta15,16 and Moskal II et al 17 analyzed UAS operations using geographic macrogrids and microgrids in which the cells provide varying information gains. These papers’ use of the traveling salesman problem heuristic and simulated annealing provides a foundation for this article’s approach.
3. Analytical problem
3.1. South China sea geographic grid
The first step in our analysis involves defining the geographic area. We use a geographic grid covering a large section of the South China Sea (SCS) lying between Vietnam and the Philippines, running from 18° North to 9° North (Figure 1). The grid contains 116 boxes drawn along latitude and longitude lines with a total ocean area estimated at 375,000 square nautical miles (sq nm)—more than twice the size of California. The grid represents an important part of the SCS to study for maritime domain awareness because it contains many disputed locations, including the Paracel Islands, Scarborough Shoal, and Spratly Islands. Each box’s size generally corresponds with an ISR aircraft’s sensor range. As a result, the analysis assumes that UAS flying near a box’s center point can collect everywhere within that box.
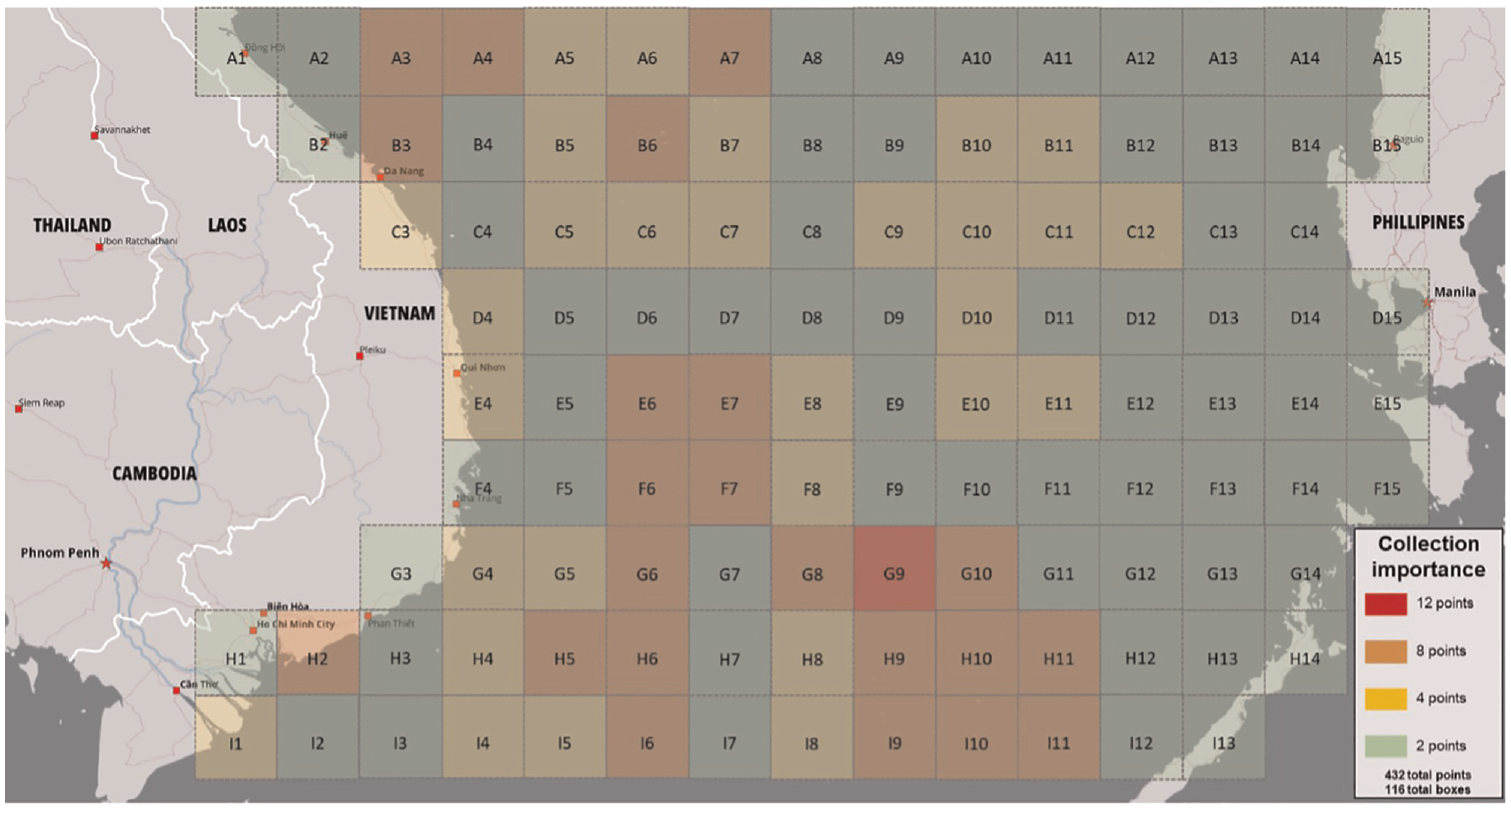
Assessed ISR collection importance of South China Sea grid.
Several examples support this assumption about UAS sensor range. The grid’s centermost box (E8) measures 60 nm (north-south) by 58 nm (west-east). The MX-20 electro-optical/infrared imaging system integrated into UAS such as the MQ-9 41 can “classify and identify a vessel at over 35 miles and read license plates at two miles,” according to the manufacturer (Pocock, 2012). 42 In addition, the Scalable Open Architecture Reconnaissance SIGINT pod integrated onto the MQ-9 43 can identify, geolocate, and characterize radiofrequency signals to determine electronic order of battle at a range of over 200 nm. 44 Given these sensor ranges, a UAS positioned near box E8’s center point could collect imagery and signals on vessels transiting throughout the box.
3.2. The “traffic and trouble” grid scoring scheme
The grid includes four ratings for ISR collection importance with point values (2, 4, 8, 12). Each box’s rating is a sum of two sub-ratings—together, we call them “trouble and traffic”—reflecting geopolitical risk and vessel density, respectively, in the SCS. The trouble sub-rating features point values (1, 3, 7, 11) and the traffic sub-rating features point values (1, 3, 5). Of the resulting eight possible summed scores, only four appear in the analysis (2, 4, 8, 12) primarily because the traffic sub-rating takes on the minimum value (1) in 97% of the boxes. The analysis awards more points for high trouble scores than for high traffic scores because it assumes policymakers will care most about higher-order regional security issues.
The point values (2, 4, 8, 12) are equal to the required UAS loiter times (in hours) used in the analysis, as further explained in Section 3.3. The analysis selected this set of specific point values (2, 4, 8, 12) rather than some alternative scheme (e.g., 1, 2, 3, 4) because the point values—when used correspondingly as loiter times—provide a direct and realistic way to apportion UAS total flight time. For example, a 40 -h endurance UAS, which we include in the analysis, could at most surveil three 12-point targets (12 h loiter per target and 36 h total) during a single sortie. This operationalization is consistent with real-world UAS employment, where practitioners tend to focus each mission on a handful of critical targets. 4 If these targets instead had point values of four, not 12, then the UAS could surveil nine targets in 36 h—a rate that practitioners might regard as unrealistically large given that UAS tend to perform persistent localized surveillance. Overall, the selected point values offer a simple way to connect assessed threats to required operations.
The point values represent an assessment of relative importance based on qualitative and quantitative factors as well as the authors’ judgment. 45 The rating determinations are based on the authors’ open-source research explained below; they are not based on the UAS route modeling featured later in the article. In other words, we perform empirical analysis with real-world data to determine the ratings, then we use the ratings to simulate UAS routing. The sub-ratings focus on maritime domain awareness missions rather than other potential missions for ISR collection such as obtaining indications and warning about an adversary’s future military operations.
3.2.1. Trouble sub-rating
The trouble sub-rating expresses whether a box featured one or more geopolitical risk factors judged by the authors to be of utmost concern in the SCS. The first factor was the concentrated presence of China-flagged vessels, excluding in port areas, given that Chinese fishing vessels are responsible for a disproportionately large portion of illegal, unreported, and unregulated fishing incidents. 46 The second factor was the concentrated presence of vessels broadcasting invalid AIS, excluding in port areas. The third factor was a location with an elevated likelihood of maritime boundary violations. The fourth factor was a fishing hotspot. Finally, the fifth factor was a major disputed territorial feature (Paracels, Scarborough, or Spratlys).
For the trouble sub-rating, the analysis scored boxes with zero factors as 1 point, one factor as 3 points, two factors as 7 points, and three factors as 11 points. To determine these scores, the analysis examined AIS data accessed through SeaVision, 47 the Department of Transportation’s unclassified online maritime domain awareness platform used by US allies and partners. The analysis identified Chinese-flagged vessels, vessels with invalid AIS, and potential maritime boundary violation locations by activating SeaVision’s exclusive economic zone (EEZ) static layer and examining AIS data filtered by:
Data sources (deactivated simulated AIS and non-AIS);
Vessel age (set maximum to 90 days [September 10–December 9, 2022]);
AIS (activated anchored or underway [examined both] and flag China, Hong Kong, and Macao)
Anomalous data (activated invalid maritime mobile service identity [MMSI] number and invalid International Maritime Organization [IMO] number).
In addition, the analysis identified fishing hotspots by studying the historical heatmap static layer, filtered by fishing vessels, over an 11-month period (January to November 2022).
As an example, the box assessed to be the grid’s most important collection area, G9, received a trouble sub-rating of 11 points due to the concentrated presence of China-flagged vessels and vessels broadcasting invalid AIS near the disputed Spratly Islands. Combining box G9’s trouble sub-rating of 11 points with its traffic sub-rating of 1 point yields its overall score of 12 points.
3.2.2. Traffic sub-rating
The traffic sub-rating expresses whether a box contained an unusually large number of vessels and thus presented a special challenge for maritime domain awareness. To score this traffic factor, the analysis calculated vessel density using SeaVision’s AIS data and then constructed a histogram using Doane’s formula for non-normal distributions48,49 to identify breaks in the data (Figure 2). The analysis scored the three outlier boxes identified by the histogram as 3 points (C3) or 5 points (B3 and H2) and scored all other boxes as 1 point. The three outlier boxes are located near the busy Vietnamese ports at Da Nang and Ho Chi Minh City.
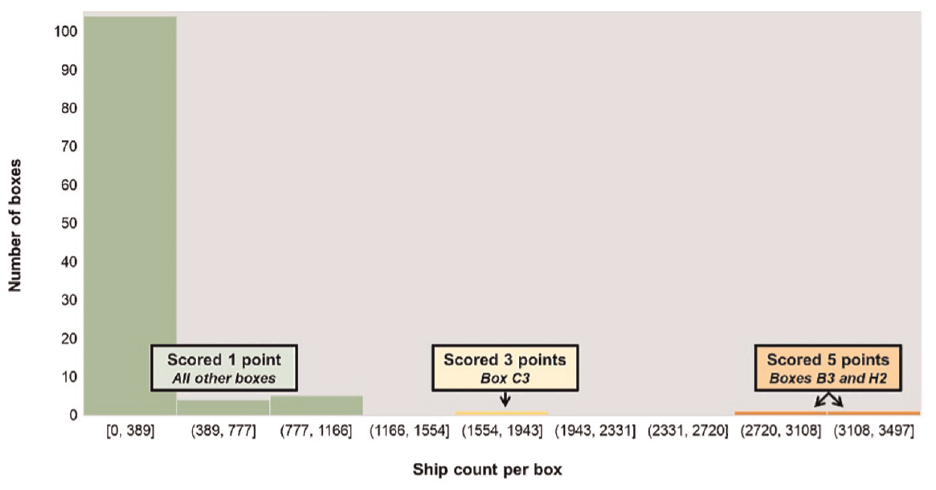
AIS ship count histogram used for traffic sub-rating.
3.3. UAS available to surveil grid
The second step in our analysis involves outlining the UAS available to surveil the geographic area. We incorporate assumptions based on previous research, unclassified UAS attributes, and judgments about future policy choices. The analysis includes variables for basing location, UAS endurance, and collection strategy to inform future decisions about how best to posture, develop, and employ ISR aircraft in the Indo-Pacific theater.
3.3.1. UAS fleet size
The analysis evaluates a fleet of three UAS as its base case because that fleet size appears more politically feasible and more budgetarily affordable for countries directly involved with SCS maritime domain awareness. According to industry data, a contractor-owned, contractor-operated fleet of three UAS would cost approximately $50 million per year, 29 a modest expense that could be split among multiple countries if they proved willing to contribute. The analysis considers larger fleet sizes when determining the number of UAS required to surveil the entire grid.
3.3.2. Basing location (Guam and/or the Philippines)
The analysis assesses UAS basing in the Philippines and Guam to explore the effects of near versus far locations, respectively. The analysis uses Andersen Air Force Base on Guam and Clark Air Base in the Philippines as the assumed locations. The analysis includes one split configuration, with UAS based in both Guam and the Philippines, to illustrate a possible multinational arrangement.
3.3.3. Aircraft endurance (40 h or 80 h)
The analysis considers a 40-h endurance UAS, flying at an assumed constant speed of 160 knots, to approximate the capability offered by established long endurance UAS such as the MQ-9 and RQ-4.50,51 It considers an 80-h endurance UAS, flying at an assumed constant speed of 80 knots, to represent the notional capability offered by experimental super long endurance UAS such as the Orion and Ultra LEAP systems.52,53 The analysis assumes that 80-h endurance UAS would not operate from the Philippines due to fears of revealing details about an advanced aircraft design.
3.3.4. Collection strategy (broad or targeted)
The analysis assumes that UAS earn one collection point for every hour spent loitering in a box, a rate derived from common ISR planning practices. 29 During a collection cycle, defined as the three UAS simultaneously flying their full endurances, the analysis assumes a box can award its points one time to one UAS, meaning points do not replenish and multiple UAS cannot team up in one box.
A broad collection strategy requires UAS to loiter in each box for exactly 1 h before proceeding to other boxes. Loiter time per box thus remains constant. Under broad collection, UAS are incentivized to visit boxes based on point values even though UAS do not harvest all the points from more valuable boxes due to loitering for only 1 h. ISR planners might use broad collection when they lacked long-endurance aircraft capable of prolonged loitering or need to survey a new (or changed) operating area to establish a baseline for collection importance.
A targeted collection strategy requires UAS to loiter in each box for the number of hours equal to the box’s collection points. UAS would loiter for 8 h in a box worth eight points before traveling to other boxes. Loiter time per box therefore varies, reflecting ISR planning practices of spending a few hours on routine targets but perhaps a full sortie (or multiple sorties) on high-value targets. UAS are incentivized to visit boxes based on point values but, unlike under broad collection, accrue all the points from each box they visit by loitering for the prescribed length of time. ISR planners might use targeted collection when they possessed long endurance aircraft or needed to monitor a crisis or illicit interaction continuously without interruption.
The analysis focuses on four configurations of basing and endurance for the three-aircraft fleet. The configurations encapsulate the range of important factors that policymakers would likely consider when planning UAS operations for SCS maritime domain awareness. 54 The first configuration features three Guam-based 40-h UAS. The second configuration includes three Guam-based 80-h UAS. The third configuration comprises two Guam-based 40-h UAS plus one Philippines-based 40-h UAS. Finally, the fourth configuration consists of three Philippines-based 40-h UAS.
3.4. Exclusion of satellite collection
The article’s modeling excludes satellite collection and focuses strictly on UAS because the research objective is exploring the problem of military UAS routing. UAS merit dedicated attention because they possess unique properties. UAS can provide more granular and persistent surveillance of important ISR collection areas than space-based collection can achieve on its own. First, UAS provide full motion video and other forms of high-resolution imagery continuously, whereas satellites collect imagery only intermittently based on their revisit rates (though larger constellations can help offset this limitation).55,56 Second, UAS equipped with multiple sensors, such as a camera and SIGINT pod, can find, fix, and track targets independently by correlating observations across different collection methods in near real-time, something satellites do not do (though data fusion can help mitigate this disadvantage).57,58 Although the modeling only includes UAS, the article’s discussion (Section 5) notes how satellite collection might cover the geographic gaps in UAS collection.
4. Solution strategy
4.1. UAS routing using team orienteering problem
Many analysts have studied UAS routing by using the classic traveling salesman problem (TSP). 9 The TSP involves discovering the shortest route that visits all customers and returns to the starting position. In the context of military UAS, the TSP provides a model for determining the most efficient route that an aircraft can fly to collect information on its assigned surveillance targets, where efficiency is measured as total distance traveled. The orienteering problem and a related variant that considers multiple vehicles—the team orienteering problem (TOP)—build upon this basic setup. The OP can be understood as a combination of the Knapsack Problem (KP) and the TSP, since the OP involves both vertex selection (a feature of the KP) and calculating the most efficient Hamiltonian path between the designated vertices. 59 Whereas the TSP minimizes travel time or distance, the OP and the TOP seek to maximize total points collected. At most one vehicle can visit each node, and the same vehicle cannot revisit a node. In addition, unlike in the classic formulation of the TSP, and because of constraints on fuel for each vehicle, it is possible that some nodes will not be visited by any vehicles.
To state the TOP formally, a set of vehicles,


Researchers have explored a number of approaches to solving the TOP. Exact solution approaches, such as branch-and-bound61,62 and branch-and-cut,63,64 have been used in instances with up to 500 locations. However, since the TOP is NP-hard, exact algorithms are time consuming. 65 Vantsteenwegen et al 66 conducted a survey on the orienteering problem, which includes the TOP. They discussed and compared all published exact solution approaches and (meta)heuristics for the TOP. Their survey provides a comprehensive overview of the different solution methods proposed in the literature. Various metaheuristic algorithms have been proposed, such as tabu search, multi-stage clustering, ant colony optimization, and the “learnheuristic” approach (a combination of machine learning and heuristics).67–71 These algorithms aim to find near-optimal solutions by iteratively improving upon initial solutions. Finally, parallel computing and biased randomization techniques have been used to solve the TOP in real-time scenarios. 72
4.2. Team orienteering problem with prize-dependent loitering times (TOP-PDLT)
To solve the analytical problem, we introduce the team orienteering problem with prize-dependent loitering times (TOP-PDLT). To model variations in loiter times at each box centroid, we alter the distance matrix. We define “loiter distances,”
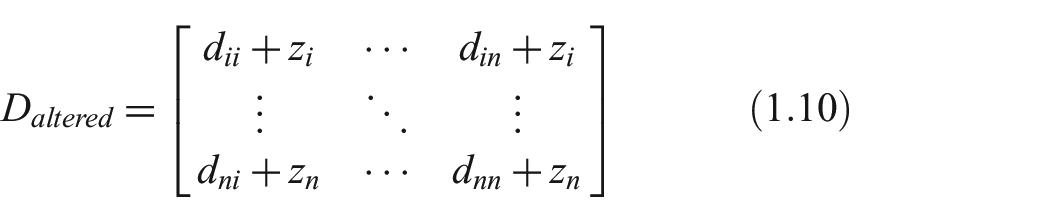
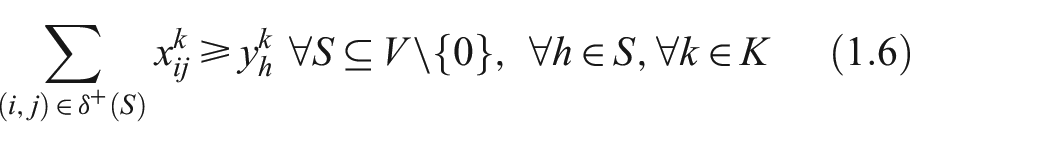
TOP-PDLT shares the same objective function, and nearly all the constraints, as the standard TOP. The only difference can be seen in constraint (1.11), which shows that
TOP-PDLT excludes time windows when locations must be visited to collect the associated points, a constraint used regularly in the literature,73–76 because maritime domain awareness surveillance targets such as disputed fishing areas or busy shipping lanes tend to supply information continuously rather than episodically. 77 Despite this distinguishing feature of TOP-PDLT, it is important to understand how recent studies have used service time-dependent profits in non-military contexts. Khodadadian et al 78 introduce the time-dependent orienteering problem with time windows and service time-dependent profits (TDOPTW-STP). In the TDOPTW-STP, each vertex is assigned a minimum and a maximum service time, and the profit collected at each vertex increases linearly with the service time. The goal is to maximize the total collected profit by determining a subset of vertices to be visited and assigning appropriate service time to each vertex, considering a given time budget and time windows. Peng et al 79 propose an exact algorithm for agile Earth observation satellite scheduling with time-dependent profits. Their approach aims to optimize the scheduling of satellite observations to maximize the total profit, taking into account the time-dependent nature of profits and various constraints. Finally, Sun et al 80 address the time-dependent capacitated profitable tour problem with time windows and precedence constraints. In this problem, the objective is to determine the optimal tour for a vehicle to visit a set of locations, considering the time-dependent profits, vehicle capacity, time windows, and precedence constraints. The goal is to maximize the total profit while satisfying all the constraints.
Notably, each of these approaches assign time windows to each location on the tour, a step that is absent from TOP-PDLT. To the authors’ knowledge, TOP-PDLT remains the only way to model routing of prize-collecting UAS if predetermined point values are assigned and time windows are not assigned—an approach that closely follows existing ISR collection management practices.
4.3. Computational experiment
We wrote a program in Python 3.11.1, and ran it on a 2021 14.2” Apple MacBook Pro with 64GB memory and an Apple M1 Max chip, to obtain results. The program reads in a data file containing the basing location and box centroid coordinates and the collection values associated with each box. Additional inputs to the program include the number of UAS to be deployed, UAS speed, program runtime, and instructions for how UAS should be distributed between multiple basing locations (if applicable).
The structure of the program is as follows. First, we calculate approximate pairwise distances using the Haversine formula, which outputs the great-circle distance between two points on a sphere. Next, we define the “loiter distance add” function, which adds “loiter distances” according to the scheme described in (1.10). The main method constructs the routing model, which preserves route connectivity, ensures that one arc enters and one arc leaves each node and guarantees that the number of routes cannot be greater than
We use the simulated annealing, a common metaheuristic for approximating global optima of an objective function, to find solutions (Table 1). Our decision to use simulated annealing, as opposed to other metaheuristic or exact solution approaches, is supported by previous studies which have found that simulated annealing yields near-optimal solutions for similar TOP variants when the number of nodes visited is small (<500),81–83 Initial solutions are obtained using the “cheapest arc path” first solution strategy. The objective function, ƒ, is defined in (1.1)
Pseudocode for simulated annealing algorithm.
Finally, we define a solution printer method, which outputs the routes, distance traveled, and value collected by each UAS, as well as the names of the basing location(s), the indices and values of unvisited boxes, the total distance traveled by all UAS for all routes, and the total value collected.
5. Results and discussion
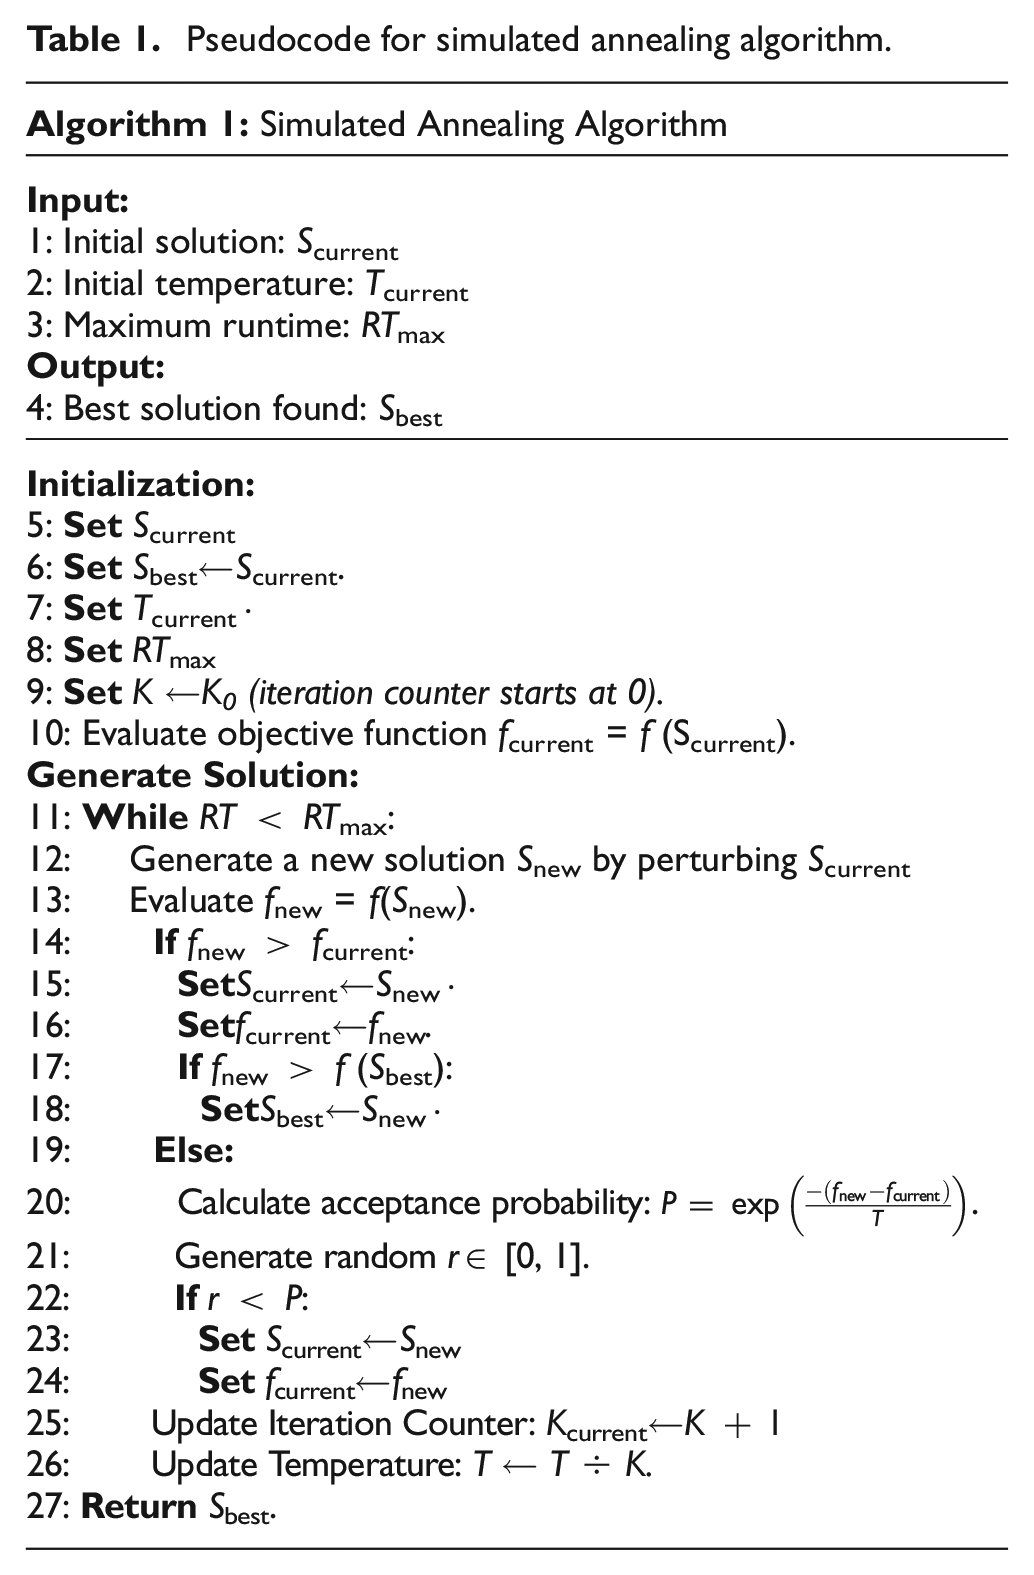
Table 2 summarizes how the four UAS configurations perform under each collection strategy. Figure 3 plots the UAS fleet sizes required to surveil the entire grid in one targeted collection cycle and Figure 4 displays optimal routes for entire-grid collection under one configuration. Figure 5 and Figure 6 illustrate the optimal routes and geographic coverages for the three-aircraft UAS configurations under each collection strategy. Finally, Table 2 summarizes the effects of computational runtime on the simulated annealing results.
ISR collection performance of four UAS configurations.
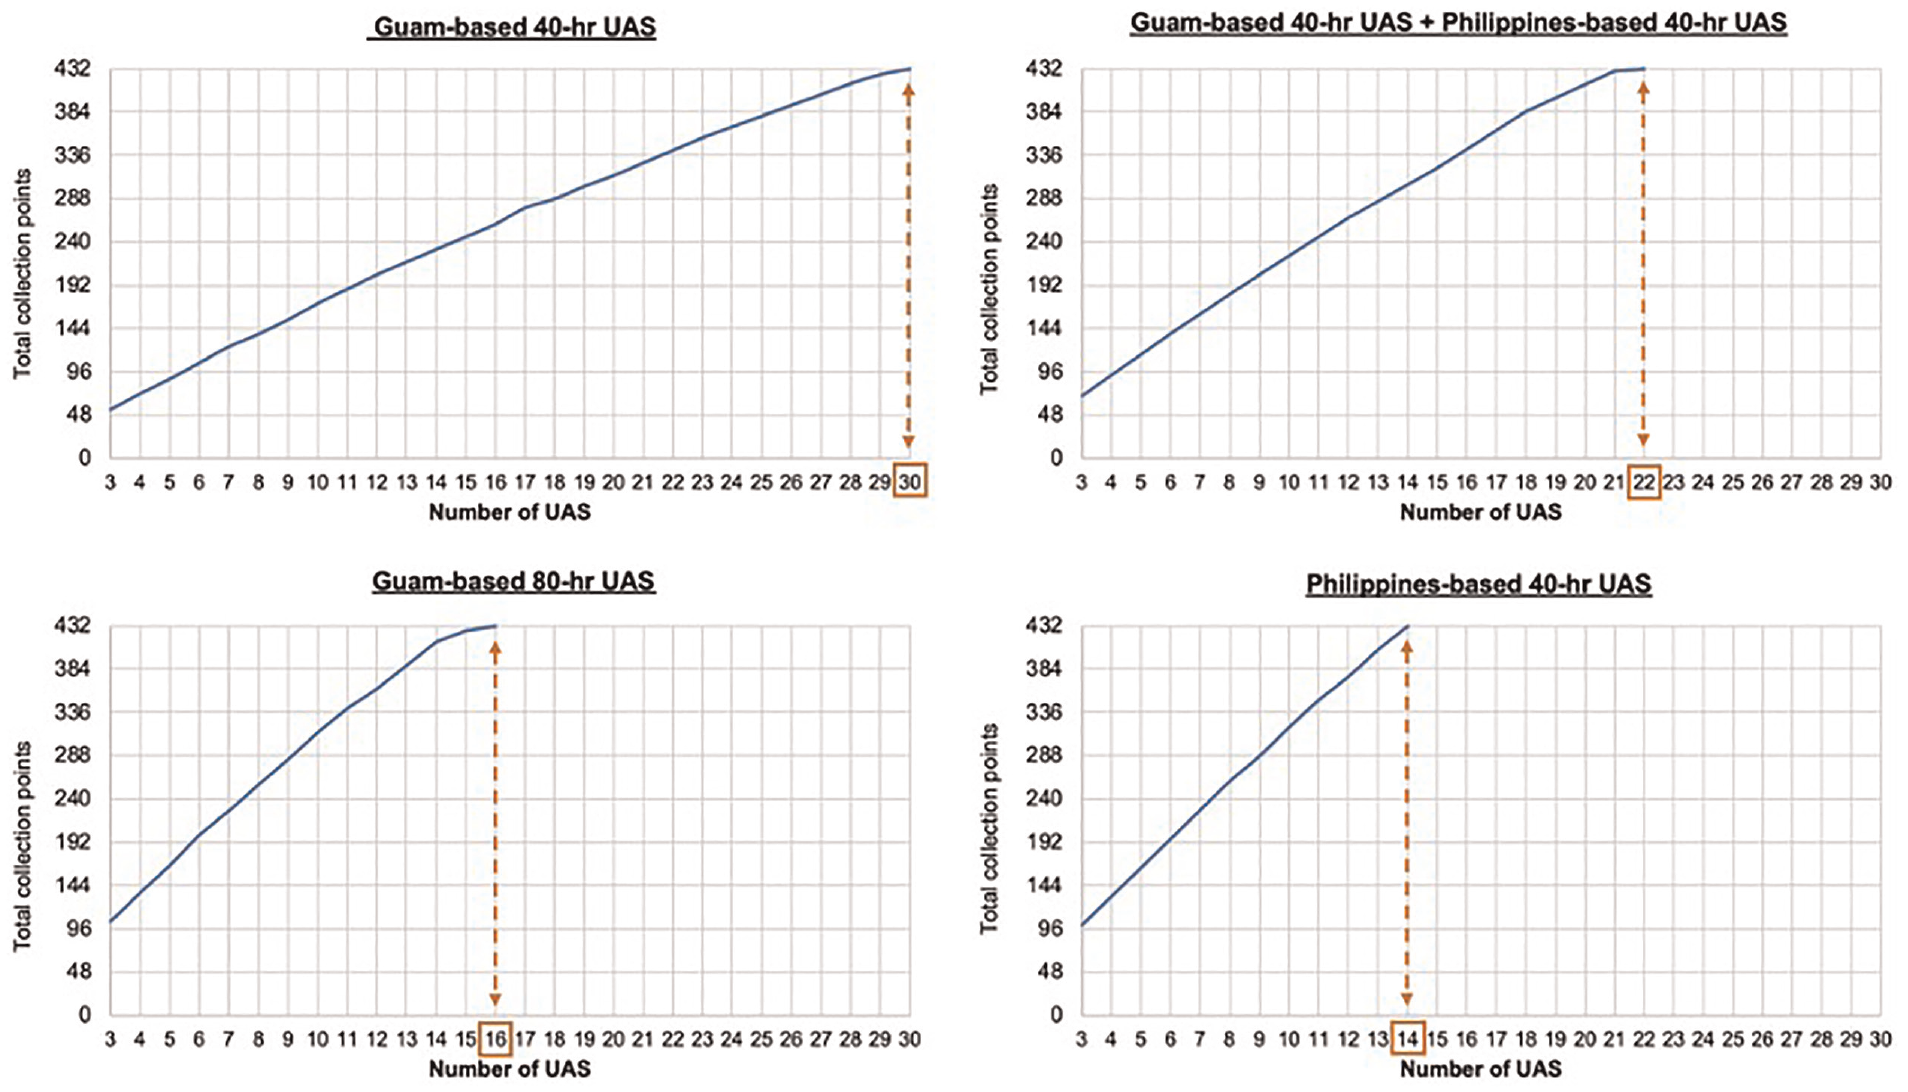
UAS fleet sizes required to surveil the entire grid in one cycle of targeted collection.
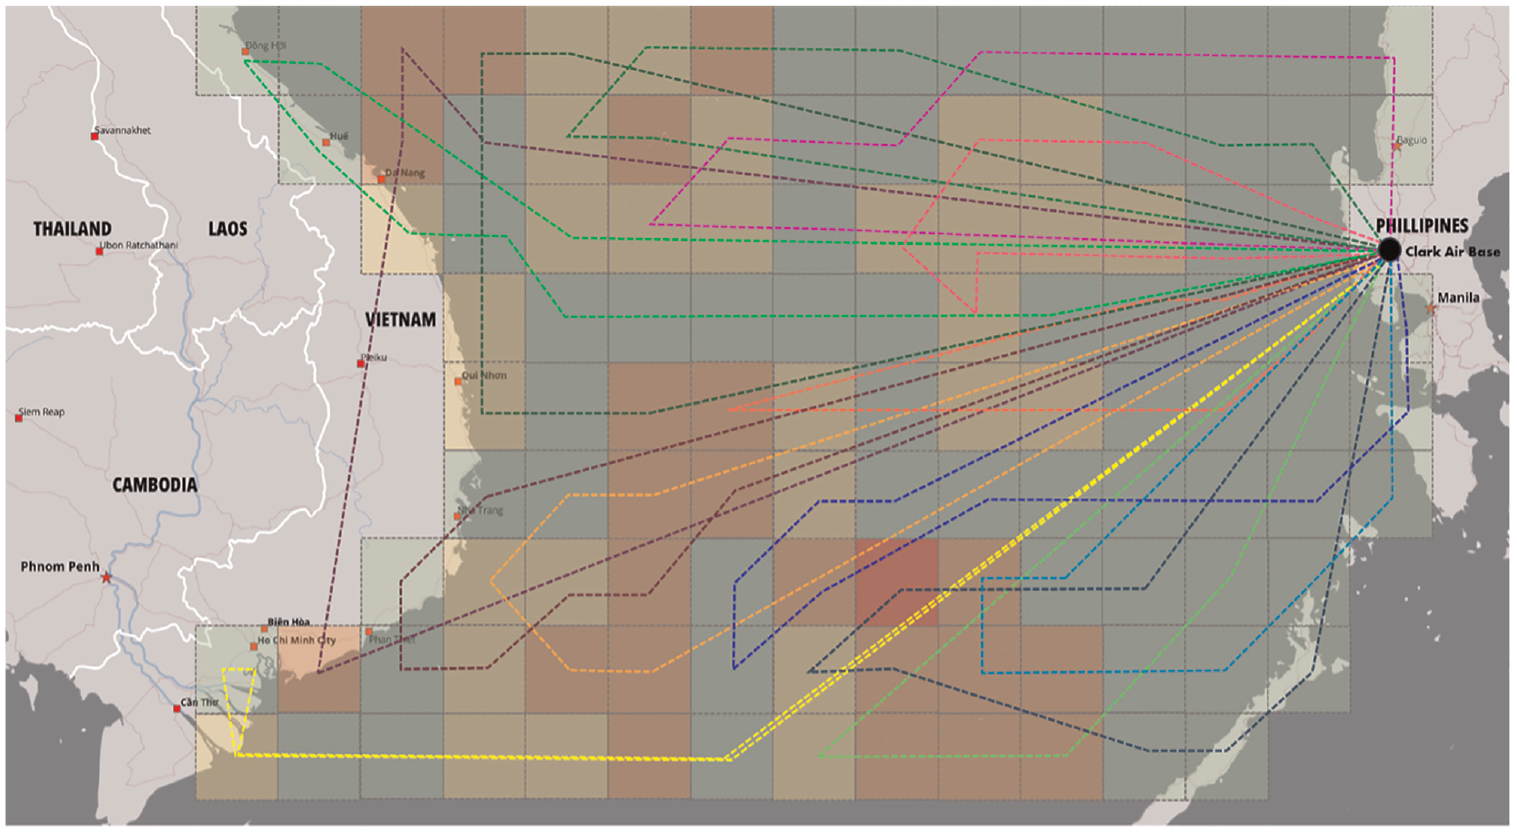
Optimal routes for 14 UAS required to surveil the entire grid in one cycle of targeted collection (configuration featuring Philippines-based 40-h UAS).
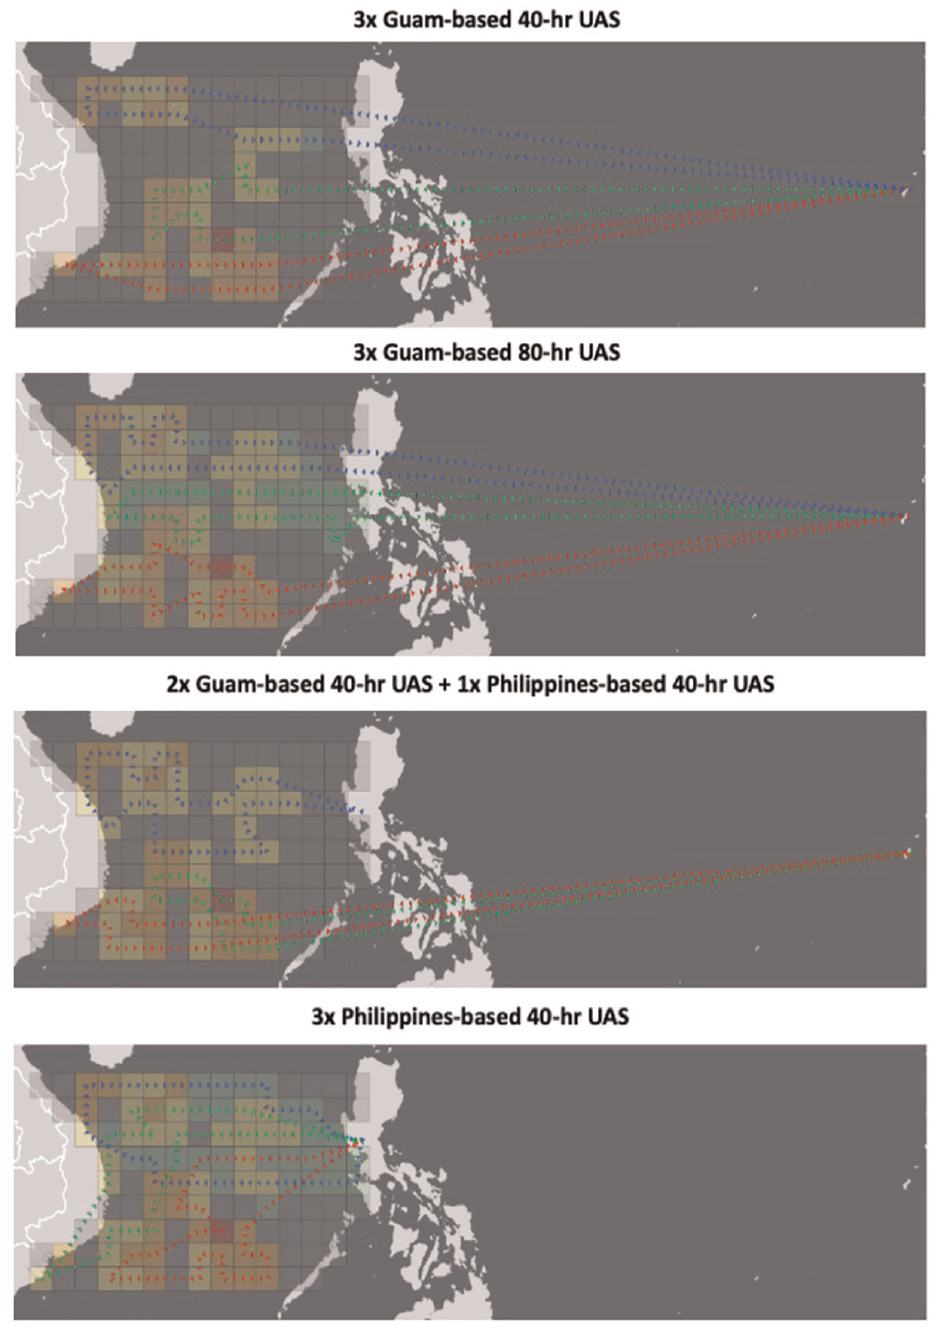
Optimal routes and geographic coverages under broad collection.
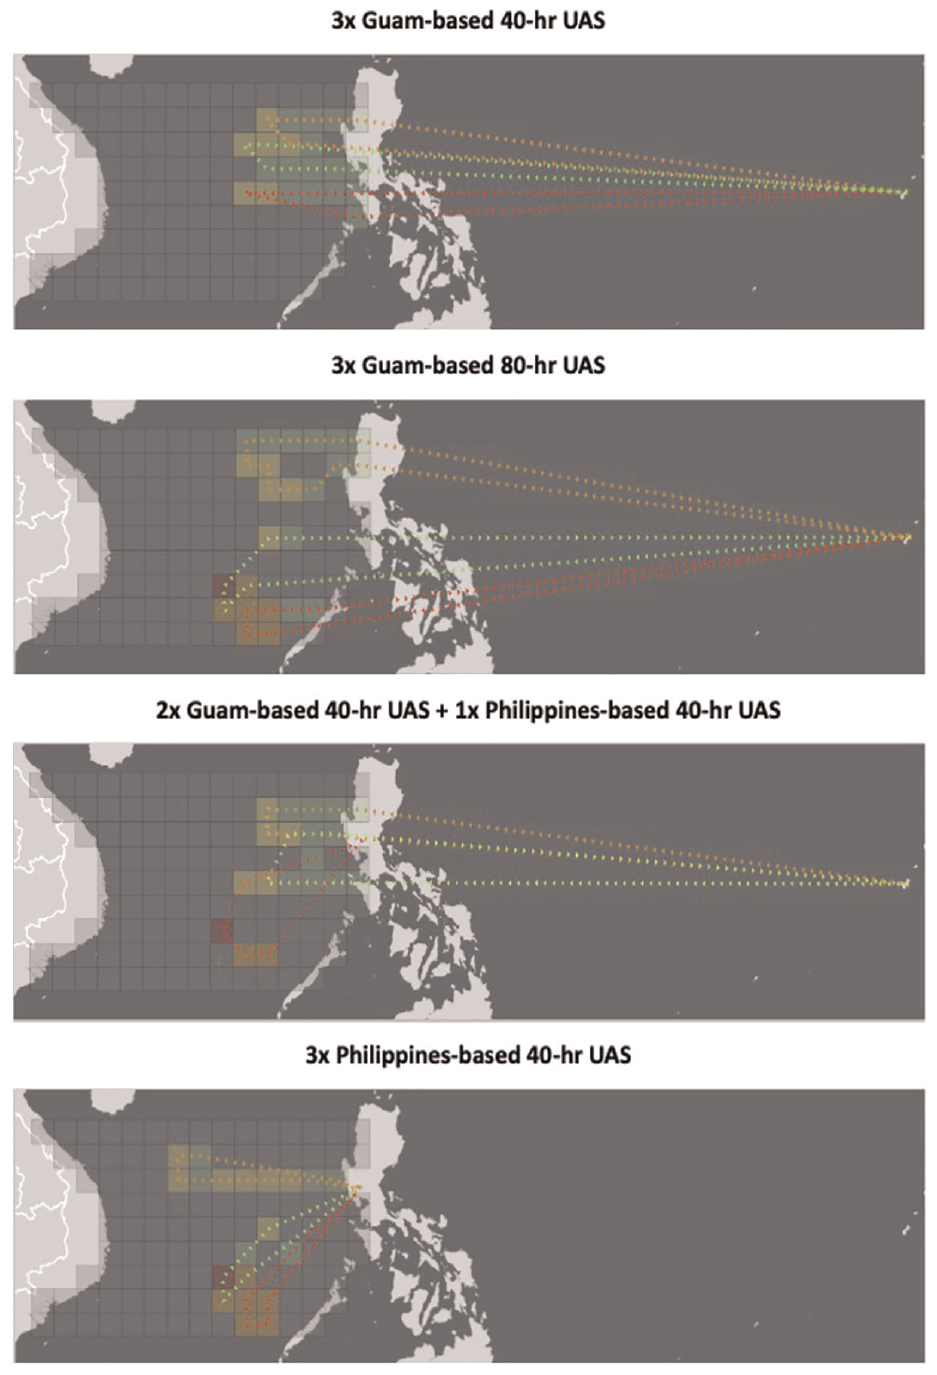
Optimal routes and geographic coverages under targeted collection.
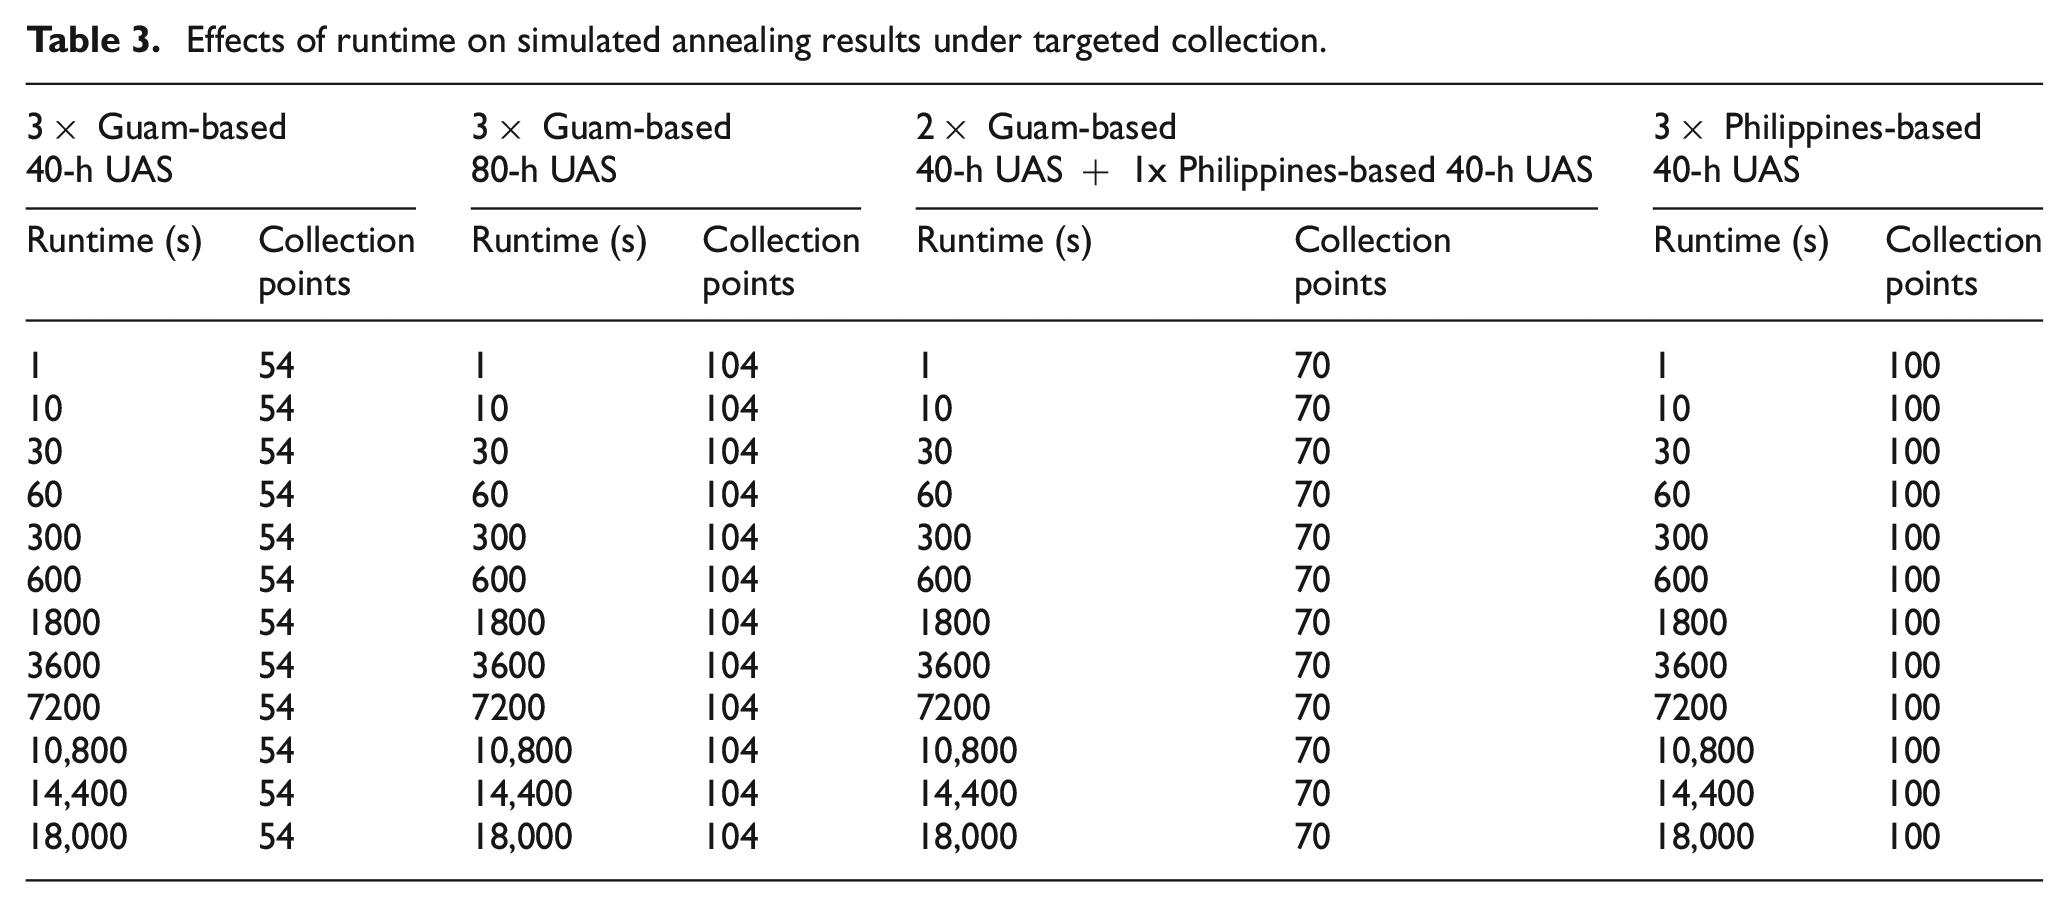
Five main findings flow from these results. First, targeted collection outperforms broad collection under all UAS configurations (Table 2), and this result is robust to variation in runtime (Table 3). This finding depends on our grid scoring scheme and would change under different schemes, as is often the case with modeling where changing the assumptions changes the results. Still, we contend that targeted collection’s superior performance reflects a logic and a reality that many ISR practitioners have observed firsthand. By restricting UAS from capitalizing on perhaps their greatest strength, persistent loitering, broad collection forfeits much of the advantage offered by UAS. Broad collection employs UAS in a manner more befitting space-based reconnaissance assets, which generally perform well at surveilling widely, shallowly, and intermittently across large geographic areas. Targeted collection, on the other hand, enables UAS to collect points narrowly, deeply, and continuously one box at a time by loitering for the length of time prescribed by the box’s predetermined value. Overall, our results show that targeted collection by a small fleet of three UAS leaves most boxes unexplored. Future work can show how satellites might cover those gaps.
Effects of runtime on simulated annealing results under targeted collection.
Second, the configuration featuring Philippines-based, 40-h endurance UAS outperforms the alternatives according to most criteria, including after normalizing the results to points per hour (Table 2). This finding supports the intuitive principle that better basing enables better ISR collection in the expansive Indo-Pacific region. The configuration featuring Guam-based, 80-h endurance UAS earns the most points under targeted collection, but it has a longer-duration collection cycle. If 40-h UAS flew more than one sortie every 80 h, on average, then they would collect more than the 80-h UAS. However, if ISR planners determined that back-to-back sorties by 40-h UAS were unsustainable or unnecessary, then the 80-h UAS would present an effective option.
Third, the configurations would require between 14 and 30 UAS to surveil the entire grid in one targeted collection cycle, whereby all aircraft simultaneously fly their full endurances (Figure 3). Figure 4 depicts optimal routes for the 14 UAS required in the configuration featuring only Philippines basing. In the authors’ judgment, fielding a UAS fleet of that size likely would prove politically and budgetarily infeasible for countries directly involved with SCS maritime domain awareness. However, using UAS as a supplement to space-based collection would eliminate the need to operate so many aircraft. 29 Future work can explore whether combining broad collection by satellites and targeted collection by UAS would prove more effective than satellites alone and more feasible than UAS alone—as we suspect will be the case.
Fourth, under the preferred targeted collection strategy, all configurations fail to surveil the grid’s western half near Vietnam, including the important areas around the Paracel Islands (Figure 6). This finding does not depend on our grid scoring scheme; after all, even a broad collection strategy fails to surveil the entire grid (under our assumed fleet size of three UAS). The failure of all targeted collection configurations to surveil key areas near Vietnam indicates that Philippines basing is incredibly helpful, but alone insufficient, for maintaining comprehensive maritime domain awareness in the SCS. Operating additional UAS from Vietnam presents one way to reach these important collection areas. The most promising Vietnamese bases would include Da Nang in central Vietnam and Nha Trang, Cam Ranh, or Phan Rang in south central Vietnam due to their proximity to important ISR collection areas. Vietnam has a strong incentive to support UAS surveillance given that Vietnam-flagged vessels comprised nearly 90% of the AIS vessel observations in the SCS grid examined by the analysis.
Fifth, Guam-based UAS spend significant time flying over open ocean before they reach the SCS, limiting the opportunity for incidental collection en route (known as “non-interference basis” or NIB collection) (Figures 5 and 6). Incidental collection involves a UAS surveilling lower-priority targets as it travels to and from its assigned higher-priority targets. The goal is to gather additional information while transiting without reducing collection performance at the assigned targets. In practice, this typically means that UAS conduct “fly by” surveillance of targets en route but do not loiter because doing so would reduce on-station time at their assigned targets. If standoff-based aircraft operated from Japan (Honshu), Northern Australia, Singapore, or Malaysia—countries very roughly matching Guam’s standoff distance from the SCS—then they could perform some collection over geopolitically significant areas such as Taiwan and Southeast Asia’s maritime chokepoints during their flights to the SCS. UAS operating from the four countries could perform incidental collection while flying to and from the SCS, increasing each sortie’s return on investment and delivering valuable collection to countries beyond the SCS grid examined in the analysis. Existing airfields in the four countries offer feasible locations for basing UAS.
6. Conclusion
This article contributed to the UAS routing literature in two ways. First, it demonstrated an empirical scoring system, rooted in existing collection management practices, to determine the most important areas for maritime domain awareness-focused ISR collection, applying the method to the SCS. Second, it introduced the team orienteering problem with prize-dependent loitering times (TOP-PDLT) and used that model to identify optimal collection routes for a small UAS fleet surveilling the SCS to maintain maritime domain awareness. Operational planners may not always employ UAS or adopt optimal UAS routes due to political factors and other practical constraints. Nevertheless, we believe that analyzing the best-possible UAS outcomes is still worthwhile because they provide an aspirational goal that planners can work toward.
Analysts could apply the article’s methods to future research and planning, although they may have to modify certain assumptions and modeling parameters to match operational scenarios differing from a SCS use case. Analysts could create weighted-value geographic grids for areas beyond the SCS and then apply the TOP-PDLT model to identify optimal UAS collection routes. In the Indo-Pacific theater, the Indian Ocean represents a strong candidate for future research attention, given that India faces a growing challenge from China in that region. 84 In the European theater, analysts could examine the Sigonella, Italy-based NATO ISR Force, particularly since its small size (fleet of five UAS) and mission (maritime domain awareness) closely resemble this article’s analytical scenario. 85 Meanwhile, operational planners could apply the article’s methods to assess the effectiveness of their UAS employment. In the US military context, analysts assigned to geographic combatant commands or subordinate air component commands could use TOP-PDLT analysis to determine whether theater airborne ISR assets were flying optimal collection routes.
As UAS capabilities continue to spread throughout military and law enforcement organizations worldwide, the mere possession of these capabilities will no longer confer the competitive advantage that they once did. To stay ahead, planners will have to find ways to employ their scarce UAS resources more effectively than their competitors. Analysts can make invaluable contributions helping planners solve these difficult challenges. This article presented one solution to a policy-relevant problem, but much more work is needed, particularly on other geographic areas, to resolve related questions in this important field of inquiry.
Footnotes
Acknowledgements
The authors would like to thank Tom Mahnken for his contributions to this study’s analytic framework. They would also like to thank Sameer Lalwani, Whitney McNamara, Arthur (Trip) Barber, and Stan Robertson for reviewing this study before submission.
Declaration of conflicting interests
The author(s) declared the following potential conflicts of interest with respect to the research, authorship, and/or publication of this article: The views represented in this article are the author’s own and do not necessarily reflect the view of Booz Allen Hamilton, the Center for Strategic and Budgetary Assessments, or the U.S. Department of Defense.
Funding
This research received no specific grant from any funding agency in the public, commercial, or not-for-profit sectors.
Ethical considerations
Ethical approval was not required for this study.