






Abstract
After a U.S. Coast Guard (USCG) search and rescue (SAR) case, USCG personnel create an after-action report containing a textual narrative of the situation and Coast Guard response efforts. Data analysts explored how to identify reports involving cases with a verified person in the water. With restricted access to compute resources and limiting policy, large language models (LLMs) could not be utilized, so statistical (‘classical’ and non-neural) methods were considered for training a classification model to identify SAR case outcomes from report texts. The dataset was severely imbalanced toward the negative class, and the texts were extremely messy, with many typos and abbreviations. Therefore, an extensive text cleaning pipeline was developed and tested for improving classification performance. The Iterative Token Elimination Algorithm (iTEA) was developed to increase differences in vocabulary between classes. Model improvement was further explored through augmentation of the feature space using non-text data. The best model was an XGBoost model, achieving 0.762 recall and precision (and 0.959 accuracy). Errors from the test set are analyzed to guide future improvements until LLMs can be used, which are expected to improve performance and reduce text cleaning requirements.
Keywords
1. Introduction
Unlocking information contained within text is a common problem for data analysts, 1 and the use of large language models (LLMs) for a wide range of natural language processing (NLP) tasks—i.e., text-based tasks, including topic modeling and document classification—has skyrocketed with the release of models such as Llama and Mistral.2–4 But when access to these state-of-the-art technologies is restricted or unavailable, can classical models still provide usable results?
We conducted NLP research on United States Coast Guard (USCG) after-action reports with these constraints in mind (see Motivation section for more details). We explored how to adequately prepare Coast Guard operational reports before using them to train a text classification model. This paper will address the challenges and benefits of the preprocessing steps of scrubbing the text of identifying information and standardizing vocabulary with a repository of common token conversions for typos and abbreviations. This paper will also show how replacing similar phrases and terms with hypernyms can improve model performance. Furthermore, the Iterative Token Elimination Algorithm (iTEA) is presented as a useful means of increasing the difference between the class-specific vocabularies when classifying event outcomes in documents with similar topics.
1.1. Background
One of the most well-known missions of the U.S. Coast Guard is search and rescue (SAR), 5 which can be broadly defined as moving one or more USCG boats, ships, and/or aircraft (collectively known as ‘assets’) to maritime locations where one or more vessels and/or persons may be in distress. In 2025, the USCG conducted 6705 SAR missions, saving 2242 lives and more than $40 million worth of property, which made SAR one of the USCG’s largest missions.6–8
When the Coast Guard receives a notification of possible maritime distress, a regional USCG command center takes responsibility for the coordination of the response efforts. A watchstander at the command center assigns and manages which assets are launched; the watchstander also records key facts and details about the SAR mission (also referred to as a SAR case). In every SAR case, a paramount matter of importance is the safety of any people in distress, especially if the individual(s) is (are) physically in the water. A person in the water (PIW) poses a particular challenge for Coast Guard responders: consequences of exposure (e.g., hypothermia, sunburn, dehydration) and possible predatory marine life (i.e., sharks) hasten the timeline for rescue; the relatively small size of a human body in large bodies of water makes detection challenging; and currents and waves create a dynamic and probabilistic search environment.
A command center watchstander uses the Probability of Survival Decision Aid (PSDA) (see Figure 1(a)) to calculate the mean survival time of a PIW under the known conditions. Information about water and air temperature, weather, and sea conditions, and the person’s characteristics (clothing, age, weight) are all considered in the PSDA model, and it appears to thoroughly consider the key factors for survivability at sea. However, the developers of this model state in a 2008 paper, ‘To expand the applications of PSDA, more physiological data from case histories or controlled studies are needed.’ 9 Use of the PSDA for USCG SAR cases became a mandatory practice in 2010, and the PSDA model was refined in 2014 with major updates including new interface features and the determination that life jackets and other personal flotation devices do not have a significant impact on heat retention of PIWs. 10

(a) The PSDA graphical user interface. (b) Example of a SITREP Narrative from a case with incident subtype: ‘Person in Water.’ Names and other details have been changed for public release. Some commonly seen spelling errors are underlined. (c) GPS coordinates of SAR cases contained in this dataset.
1.2. Motivation
This project supported the initial phase of a larger initiative by the USCG Research and Development Center (RDC) to validate or refine the mathematical model of PSDA. The RDC considered how in-water survivability information—physiological and environmental inputs, PSDA output values, and actual survival/decease time—may be recorded in the SAR case situation reports (SITREPs) written by the command center watchstanders. Therefore, the RDC sought to gather and study the SITREPs pertaining to SAR cases where at least one person was in the water. SITREPs, however, do not contain a tag or label for whether they involved a PIW event, so the RDC desired an automated means of identifying which SITREPs were likely to contain survivability information for the PSDA model improvement project.
Text (document) classification in the context of this project diverged from typical text classification in a significant way. Common problems involve differentiating between topics or authors, and there is an assumption that there are certain words or terms that serve as key signals for the model. Consider the example of classifying news articles by genre (e.g., politics, sports); words such as ‘senator,’‘law,’ and ‘vote’ are likely to be weighted heavily for politics, whereas ‘field,’‘crowd,’ and ‘ball’ would strongly indicate sports. The PIW classification problem, however, sought to identify which documents pertained to a specific outcome within a single genre; an analogous illustration from the previous example would be identifying which articles in a corpus of only basketball news articles were about the home team winning.
One major obstacle prevented us from using state-of-the-art large language models (LLMs) for PIW SITREP classification: limited computing resources. In early 2025 (well after the onset of this project), the U.S. Coast Guard and Department of Homeland Security established Force Design 2028, and stated in an Executive Summary, ‘Today the Service is not equipped to deliver and use today’s technology that is needed to effectively execute its missions and unprepared to harness advanced technology that is already upon it and that it will need for the future.’ 11 This statement refers in large part to artificial intelligence capabilities, which include powerful compute and big data resources (i.e., GPUs and the cloud). Without access to these technologies, we could not locally employ large language models (LLMs)—or even small language models—due to their significant computational demand. Moreover, the use of commercial cloud computing and storage services was prohibited by policy since these methods ultimately relinquish custody of the dataset to an external entity and the dataset was not publicly releasable. While military-approved large language chat bots similar to ChatGPT on the military network are now accessible for all USCG members, at the time we were completing the project, those applications were not available for use; furthermore, the efficacy of these models for analysis and classification (versus content/idea generation) is still ongoing.
Given these obstacles, the research team turned to statistical machine learning (ML) models for classifying the texts. This approach would allow the team to deliver results in a short time instead of waiting for technology acquisitions and policy updates to facilitate more apt methods. Moreover, since a model had to be trained from scratch and the size of the dataset was small (see Data Overview section), only non-neural models were considered. This approach broadened the understanding of best practices for analysis of Coast Guard operational texts using statistical models and supported continued exploration with them until access to powerful compute resources becomes a standard practice. The SITREP structure is used for more than SAR record-keeping; the Coast Guard relies on these types of reports for many of its operations. Consequently, the lessons learned from this project can be applied to the analysis of other USCG text corpora and may also inform improvements to the way watchstanders record USCG activities.
The fast-paced nature of a SAR case means that when producing reports, watchstanders often rely on shorthand (abbreviations, acronyms, and initialisms) along with other Coast Guard jargon. There is no built-in spelling or grammar check function in the report entry system, and with minimal proofreading of the report prior to entry into the records database, the text in these fields often more closely resembles user comments, replete with typos and spelling errors (see Figure 1(b)), made on an online video or blog. The presence of Coast Guard jargon and shorthand in these texts complicates analysis since these tokens are rare, if present at all, in the embedding models built from even the widest Internet crawl; additionally, some tokens may carry different meanings in the Coast Guard and SAR context than the public domain. 4
1.3. Literature review
Domain-specific text classification has been widely studied across medical, legal, scientific, and other technical fields. Although pre-trained large language models (LLMs) have demonstrated strong performance in recent years, prior research shows that simpler approaches can remain competitive. Wahba et al.12,13 report that for several domain-specific tasks, linear models such as support vector machines with TF–IDF features perform comparably to attention-based architectures, offering a cost-effective, reproducible, and interpretable alternative.
Model interpretability is a key concern in these settings. Rudin argues that black-box models should be avoided when transparent solutions are possible, particularly in high-stakes environments. 14 Recent systematic reviews highlight additional limitations in the literature on domain-adapted LLMs, including potential screening bias, narrow temporal coverage, and keyword-constrained inclusion criteria. 15
Domain specialization has led to numerous adapted pre-trained language models, including SciBERT for scientific writing, 16 BioBERT for biomedical text, 17 LEGAL-BERT for legal corpora, 18 FinBERT for financial reporting, 19 and NukeLM for nuclear regulatory documents. 20 These efforts suggest that an adapted BERT-like model for Coast Guard SAR text could be feasible. This project serves as a prerequisite to that work, and broader military applications of generative AI are surveyed by Vasankari and Koski. 21
Other work focuses on improving representations for domain-specific vocabulary. Sarica and Luo identify content-specific stopwords in engineering corpora and show that generic stopword lists can suppress meaningful technical terminology. 22 Kim and Zhang 23 introduce credibility-adjusted TF–IDF (CRED-TF-IDF), weighting class-indicative terms more strongly, and Zubiaga extends this idea to non-TF-IDF embeddings. 24 TF–IDF and shallow embeddings also continue to appear in medical and legal applications.25,26
Despite the widespread adoption of transformer-based models, classical approaches remain valuable for domain-specific text classification. Linear models and TF-IDF-based methods are often more cost-effective, computationally efficient, and more reproducible than large pre-trained models and can still achieve competitive performance in specialized tasks.12,13 By focusing on classical models, this study offers a rigorous evaluation of baseline methods and establishes a strong benchmark for potential future work with domain-adapted transformers in Coast Guard SAR text classification.
1.4. Research objectives
As mentioned in the Motivation section, this project was part of a larger effort to update the PSDA; our specific focus was to aid the efforts by conducting research to understand whether small-scale, classical ML methods could adequately classify useful SITREPs. Appropriate preparation of the dataset for model training was paramount, especially with the messy text found in the SITREPs. A major consideration for preprocessing was how to remove similarities between classes in order to boost the ‘signal’ for what indicated a true PIW occurrence. We explored which preprocessing measures for these types of text best supported classification and also considered whether augmentation of the text data using structured (tabular) data improved model performance.
Once thorough preprocessing methods were established for USCG SITREPs in the SAR domain, we sought the best classical ML model for classifying the texts. In addition, we explored whether traditional data science practices of hyperparameter tuning, oversampling the imbalanced class, and using alternative metrics to accuracy could improve results.
1.5. Contributions
In this paper, we show that useful data contained in, and about, U.S. Coast Guard search and rescue (SAR) narratives can still be unlocked using classical NLP techniques. By developing a robust text cleaning pipeline and conducting model testing, we delivered a competitive machine learning solution that relies on classical techniques and does not require massive compute power. This project demonstrates how Coast Guard data analysts can still conduct valuable text analysis with simple tools, which allows for rapid results that are still viable for the problem at hand.
Moreover, the preprocessing pipeline gives a long list of considerations for cleaning and improving SAR reports, as well as SITREPS from other operations. While text cleaning is not crucial when using LLMs, the cleaning pipeline presented here might contribute to better performance of finetuned LLMs now that Coast Guard capabilities are coming online to support those avenues of data exploration and exploitation. This robust cleaning process is useful for other small-scale, text-based analysis, too.
In addition, this project demonstrates the usefulness of combining the text-based feature space (embeddings) with non-text features. This is an important consideration for Coast Guard analysts seeking to understand Coast Guard operations and outcomes from freeform text documents, regardless of the method used for analysis.
While this paper is presented predominantly as a project report, it offers important lessons for statistical text analysis when working with military/operational corpora. It also offers a unique perspective on the text classification problem when classification is based on event outcome (versus event/article type or sentiment). Methods for reducing ‘noise’ in the dataset through vocabulary standardization and for increasing the polarity between class-specific vocabularies are both explored.
2. Data overview
Each case report was stored as a text (*.txt) file, one per SAR case. The RDC gathered reports from SAR cases that occurred between January 2008 and June 2020 in several key regions on both the east and west coasts of the United States (see Figure 1(c)). The RDC selected the regions to support several research projects; nevertheless, the case reports still constitute a representative sample of all the USCG SAR SITREPs across the United States.
The cases did not have a label or tag indicating whether the case actually involved at least one person in the water (PIW). Therefore, staff members from the RDC, along with cadets and faculty from the USCGA, assigned labels to 1210 case reports. Readers were randomly assigned a subset of cases to review; the number of reviewers and the project timeline precluded labeling a greater number of reports. After reading the SITREP, a single person assigned a label to the case: 1 if there was one or more PIWs and 0 otherwise. Out of the 1210 labeled cases, 104 reports (8.6%) pertained to at least one confirmed PIW.
The SITREP files are lengthy structured text files that contain the case information entered into a data entry system by command center watchstanders. Fields within the report are marked with headers. The most relevant fields (sections) of the report for this project were the ‘Narrative’ and ‘Actions Taken’ sections, in which USCG watchstanders use freeform text to record the ‘story,’ or summary, of the USCG’s response efforts during each SAR case. These two sections were concatenated because the labelers noticed that important case details were often described in only one of the sections. It is important to note that the data entry system does not have specified fields for PSDA input and output values, and it is not a requirement, nor a standard practice, for watchstanders to include that data in the freeform text entries. The ‘Actions Taken’ section contains date- and timestamped entries associated with each event or action the watchstander recorded; these timestamps were removed during preprocessing to eliminate unnecessary noise in the text. The combined ‘Narrative’ and ‘Actions Taken’ sections vary considerably in length and vocabulary size (see Table 1). The vocabulary size (number of unique tokens) for the entire corpus before preprocessing was 57,524 tokens.
Summary statistics for labeled SAR reports.

Values account for ‘Narrative’ field text combined with ‘Actions Taken’ field text before any preprocessing.
Sentences separated by period (.) or semicolon(;).
Tokens separated by white space or punctuation, excluding hyphens (-) and apostrophes (’).
Total number (duplicates, punctuation, spaces included).
2.1. Non-text features
Early exploration of the dataset revealed that some non-text features,
2.1.1. Incident subtype
The watchstanders categorize a SAR case with a single tag (e.g., ‘capsized vessel,’‘MEDEVAC,’‘person in the water (PIW)’). The tag, called the incident subtype, is selected from a standard list and is determined by the watchstander upon the initial notification of possible distress. This dataset saw 48 categories for this feature, but the set of categories in this dataset was not an exhaustive list of all the available subtypes in the data entry system for SAR reports. There is limited policy on what events, scenarios, and situations constitute each subtype; therefore, the determination of a SAR case subtype is at the discretion of the individual who receives the initial notification. Moreover, there is no mechanism to change the subtype at the conclusion of a case or add multiple tags. As illustrated by Figure 2, approximately thirty-eight percent of cases with the subtype ‘PIW’ were false alerts, and approximately forty-five percent of cases with the subtype ‘Capsized Vessel’ included an instance of people in the water.

Class proportions for the most frequent subtypes.
When incident subtype is used as the predicted label, observed metrics on the test set are lower than when using a trained model to classify the data points. The bottom two rows of Table 7 show the classification metrics achieved when incident subtype ‘PIW’ is used as the predicted label and when ‘PIW’ and ‘Capsized Vessel,’ the two subtypes with the largest proportion of positive PIW cases, are used for labeling the positive class. Only recall for the two-subtype classifier cannot be shown as being significantly less than the full model’s recall (see Table 2). The RDC sought to understand the effectiveness of classification based solely or predominantly on text content, and the results when using these weak classifiers indicate that using the text is in fact a preferred method.
95% confidence intervals for the difference between the full model metrics minus metrics for the weak classifiers that used only subtype as a label.

A positive value indicates that the full model gives better performance. See the Findings section for the procedure used to produce these confidence intervals.
2.1.2. Length
The distributions of character counts (lengths) for the narrative and actions taken sections differed by class, too. Figure 3 shows the class distributions of text lengths for the beginning and end of the preprocessing pipeline. Throughout the pipeline, the difference in the distributions remains, which indicates that this feature was likely to improve a classifier’s performance. An examination of the use of this feature is continued in the Findings section.

Joint probability distributions for the lengths of the texts (a) before preprocessing and (b) after iTEA with
3. Considerations for preprocessing U.S. Coast guard SAR reports
As previously described, the freeform text in the ‘Narrative’ and ‘Actions Taken’ sections is messy. Spelling errors, USCG-specific jargon, abbreviations, and other shorthand create a style that is uncommon outside of this type of text. As such, special procedures were considered for preprocessing these texts before use in statistical natural language processing methodologies.
3.1. Sensitive and specific information scrubbing
USCG watchstanders must record all pertinent information from a SAR case in the SITREP. Therefore, the ‘Narrative’ and ‘Actions Taken’ texts often contain contact information for government organizations as well as personally identifiable information (PII) of involved persons. These details are not pertinent in classifying, and analyzing what occurred during, a SAR case. The presence of this information in the report, however, might help signal the occurrence of a specific event (i.e., a person in the water). In order to steer models away from associating specific places, names, and values with certain event outcomes, we used regular expressions to insert a tag in place of PII and other details, such social security numbers and URLs, respectively. Geographic locations (e.g., ‘Brenton Reef,’‘Port Aransas’) and USCG units (e.g., ‘Station Castle Hill,’‘CGC RAYMOND EVANS’) were replaced with the tags
3.2. Indicator word substitution
Since a bag of words approach was implemented, we considered how to condense strong indicator phrases for PIW into a single token to ensure that the models did not miss those important relationships. For example, the phrases ‘recovered man from the water,’‘recovered woman from the water,’ and ‘recovered child from the water’ all describe the recovery of a person (a hypernym for man, woman, and child) from the water; the action of person recovery serves to confirm that the case involved a person in the water. ‘Recovery’ is often used to describe the action of retrieving any object from the water, so the word alone would not have been sufficient; the
This flag word was not strong enough to serve as a classifier, however. Of the 92 documents that have at least one instance of

Example non-PIW labeled narrative where emphasized phrase was converted to
Class-conditional probabilities for the indicator flag words, reported as counts (with percents in parenthesis) out of 104 and 1106, respectively.
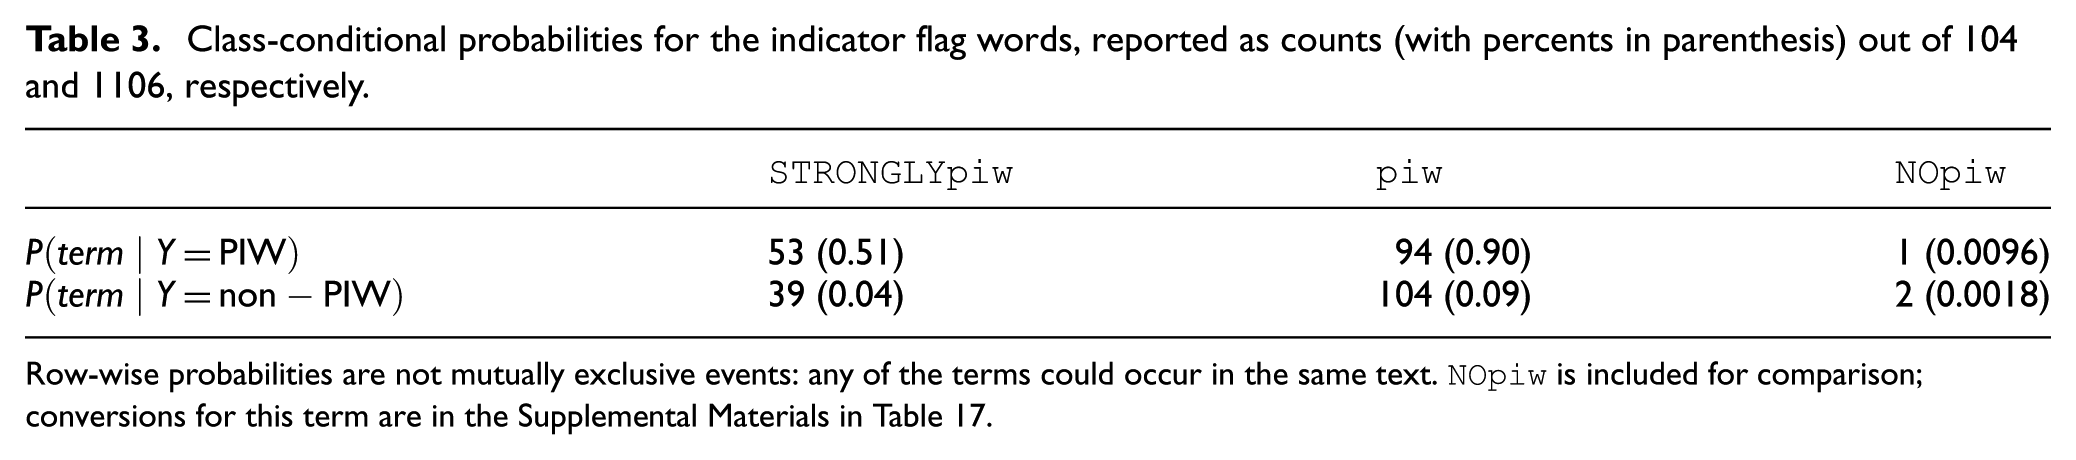
Row-wise probabilities are not mutually exclusive events: any of the terms could occur in the same text.
Exploration of the corpus also helped identify phrases that were often associated with an initial report for a possible person in the water. Hypernyms and hyponyms were used to build a robust list of these phrases (Supplemental Table 16); these phrases were replaced with the flag word
There were 198 documents with at least one occurrence of this flag word, and only 94 (
3.3. Vocabulary standardization
Another impact of using bag of words approaches was the need to standardize the vocabulary of the corpus. The SITREPs in this dataset were replete with acronyms, abbreviations, and initialisms (collectively referred to as ‘abbreviations’) as well as spelling errors. Both of these issues were addressed during preprocessing.
Across documents, many abbreviations referring to the same action or idea varied by at least one character. For example,
Frequent spelling errors for English words were corrected if a common typo was identified during labeling and early model analysis. Another method for finding misspelled words was through the comparison of nearby Word2Vec embeddings that had been tuned to the project’s corpus. These common mistakes—e.g., ‘flase’ for ‘false’—were added to the conversion dictionary (again, see Supplemental Table 18). A grammar check, however, was not employed, so incorrect homonyms (‘threw’ versus ‘through’) were not corrected.
3.4. iTEA
We developed a method, called the iTEA, to enlarge the distinction between the two classes of documents by making the class vocabularies more disparate. (The pseudocode for this method is given in Algorithm 1.) This process considers the most frequent tokens conditioned on each class; if the same token appears within the top

The identification of tokens that occur with similar frequencies across classes serves to create a corpus-specific list of stopwords—that is, common words that do not carry meaning. In the context of SAR outcome identification, words that carry meaning in everyday communication become irrelevant in this text classification space. As an example, Table 4 shows the top 10 words in each class before and after applying the iTEA with
Top 10 words in each class before and after applying iTEA algorithm with

Words listed in order of highest frequency.
4. Model training
The 1210 labeled texts were vectorized using a document-term matrix (DTM). Each term’s frequency was calculated using term frequency-inverse document frequency (TF-IDF), and the vector was truncated to the 1000 most important tokens. Early experiments considered using more to all of the features of the DTM, but model performance did not improve with the addition of more features. We also considered

Visualization of token frequency patterns from an early iTEA prototype, which included the use of a stemming model. (a) Before iTEA word cloud for non-PIW cases. (b) Before iTEA word cloud for PIW cases. (c) Post-iTEA (with
The dataset was divided into a 80%/20% (968/242) train-test split that preserved class proportions. Using a 95% confidence level, there was not strong enough statistical evidence of model improvement when the dataset was over-sampled to avoid class imbalance (see Table 5 and description of process in the following section). We considered a standard suite of statistical ML models (e.g., logistic regression, nearest neighbors, etc.) and found that XGBoost
31
ultimately gave the best results on the unseen test set. Cross-validation using the
Confidence intervals for the difference between a model trained using over-sampled training data minus a model trained on the imbalanced training data.

A positive value indicates that oversampling is give better performance. Observed (point) values are given in Table 7.
XGBoost hyperparameter settings selected through cross-validation.

5. Findings
The best model performance on the test set occurs when all preprocessing steps are used and both of the non-text features are included in the feature space for the XGBoost model (top row of Table 7). Due to the class imbalance found in the dataset (8.6% PIW class, 91.4% Non-PIW class), we treated recall as the primary metric for evaluating the model’s performance, although the suite of F1 score, precision, and accuracy was also considered. Recall was selected as the paramount metric since the goal of the project was to maximize the number of PIW cases identified by the model, even at the cost of false positives.
Performance of XGBoost model with all preprocessing steps and both non-text features.

The observed metrics for each of the preprocessing trials (see next subsection) are listed for comparison along with the performance of weak classifiers that use one or both of the incident subtypes with the largest proportions of true PIW events (last two rows).
Bold values indicate the highest observed performance for each metric; no statistical significance testing was performed.
To assess the significance of observed performance differences between models, we followed Bestgen’s bootstrap resampling methodology 32 to construct confidence intervals for differences in F1 score, recall, and precision. We generated 5000 bootstrap samples, each sample consisting of 242 data points drawn with replacement from the test set. For each sample, the metric of interest was computed using the labels predicted by the two models being compared, and the difference between the metric values was calculated. Two-sided 95% confidence intervals were calculated using the 2.5th and 97.5th percentiles of the distribution of differences. If a confidence interval includes zero, the difference between models was not statistically significant at the 95% confidence level. In all experiments, the XGBoost model and train-test split were configured as described in the preceding section, including with the same random seed (see Table 6).
First, we evaluated the efficacy of including one or both of the non-text features by comparing a model trained without either of those features to models with one or both of the features. The results of these trials are given in Table 8.
Confidence intervals for the difference in model performance via bootstrap resampling between a model trained with neither of the additional features and one or both additional features.

Differences were calculated as additional feature model minus text-only model, so positive values indicate that the additional feature model was better.
Bold values indicate confidence intervals that do not include zero.
For most of the additional feature model comparisons, Bestgen’s bootstrap resampling methodology
32
indicated that there was no statistical difference between the model trained without the additional text features and those with at least one additional feature. In the case of the model with just
5.1. Examination of preprocessing steps
We used the same statistical test methodology to explore whether the preprocessing steps improved model performance. For these trials, we retrained an XGBoost model on a dataset where one of the preprocessing steps was skipped; all other variables were held constant. Performance metrics were calculated and compared. Table 7 shows that in all cases, skipping one of these steps led to lower performance; Table 9 shows the confidence intervals for the differences between trials. An examination of each of the steps follows.
Confidence intervals for the difference in model performance via bootstrap resampling in experiments where a specific preprocessing step was omitted.

Differences were calculated as final model minus omitted model, so positive values indicate that the final model was better with the preprocessing step included.
Bold values indicate confidence intervals that do not include zero.
5.1.1. Sensitive/specific information scrubbing
Skipping this step in the preprocessing timeline was shown to have no significant difference in the precision, recall, or F1 score (see Table 9), but the confidence interval for recall, which has zero as the lower bound, indicates that with 95% confidence, the inclusion of this step does not reduce model performance. This outcome is expected given the bag-of-words approach: when PII is replaced with tags, those tags have high frequencies in both classes and are subsequently removed during the iTEA step; when PII is not replaced, many of those tokens occur so infrequently that they do not make it to the 1000 most important features of the document-term matrix.
Nevertheless, we opted to keep this step in the final model. Like the replacement of PII with tags in the medical domain, 33 the removal of PII from the SAR report dataset meets USCG data stewardship guidance. Not only is this step appropriate for maintaining the security and privacy of the dataset, it may help a model remain agnostic to specific tokens even when using a large language model.
5.1.2. Indicator word substitution
Again, we observed no statistically significant differences at the 95% confidence level for any of the three metrics (see Table 9) when flag words
5.1.3. Vocabulary standardization
In this trial, we calculated a recall difference confidence interval that is strictly greater than zero (see Table 9), although the precision and F1 score confidence intervals contain zero. However, since the precision, recall, and F1 score on the entire test set are greater for the model trained with a standardized vocabulary, we opted to keep this step in the final preprocessing pipeline, too.
5.1.4. iTEA
To study the iTEA, we first tested model performance on datasets for which varying values of

Graph of model performance as
5.2. Error analysis: false negatives
We next examine cases from the test set where the human-provided label indicated a PIW event, but the model predicted the negative class. Table 10 presents three representative false negative examples using the original, unprocessed narratives for clarity.
False negative example narratives.

CG asset call signs have been redacted. Spelling errors have been maintained as in the original.
In the first example, the PIW label appears to rely on implicit context—namely, individuals entering the water—rather than explicit PIW terminology. After preprocessing, the remaining tokens primarily reflect a lack of distress (e.g., uninjured, undamaged), with no indication that individuals remained in the water. Although the term evacuate remains, it is relatively uncommon in PIW-related narratives. In this case, the model’s negative classification may be more appropriate than the human label.
The second example contains relevant keywords; however, the phrase ‘recovered all persons’ was not converted to the
We further examined the incident subtypes associated with false negative cases in the test set (Table 11). Four of the five false negatives correspond to incidents labeled with the subtype ‘Person in Water (PIW),’ indicating that misclassifications occur even within the incident subtype best associated with target class. This suggests a degree of intra-class heterogeneity, where certain PIW narratives, particularly those that are brief or implicitly described, lack sufficient distinctive cues for reliable identification. It may also indicate the model’s over-reliance on subtype for classification, as many of the incident subtype features were within the top 25 most important features of the XGBoost model.
Subtypes of the false negative examples in the test set.

5.3. Error analysis: false positives
Next, we investigate instances where the model predicted a PIW event, yet the human labeler categorized the case otherwise. The first entry in Table 12 demonstrates a case where standard PIW ‘flag words’ were present, but responding Coast Guard units ultimately attributed the sighting to misidentified marine life. The terms ‘ACTSUS’ and ‘false alarm’ are also in this narrative, but these terms occur only once, whereas the PIW flag words occur much more frequently in the narrative and are therefore weighted more in the TF-IDF matrix. If credibility-adjusted TF–IDF (CRED-TF-IDF) was used as presented by Kim and Zhang, 23 these strong indicators for a non-PIW case may have helped steer the model toward the correct classification. (In the second example, ‘false alert’ has a similar problem.) We also note that converting these flag words to NoPIW led to decreased model performance across all metrics.
False positive example narratives.

CG asset call signs have been redacted. Spelling errors have been maintained as in the original.
In the second example, although the model correctly identified the presence of individuals in the water, the subjects were not in distress. This highlights an inherent labeling ambiguity: while the model’s prediction was technically accurate in detecting a PIW, the incident did not constitute a traditional emergency. This ambiguity suggests that additional guidance may be needed to ensure consistent labeling of borderline cases.
Finally, the third narrative gives an example of a case with an inconclusive outcome: while a PIW was reported, search efforts yielded negative results. It is possible that there was a person in the water and search efforts did not find the person in time; in that event, this report may contain useful data about survivability based on the search time. Of course, this is merely speculation, which indicates another key refinement needed for the dataset: not only should PIW cases be identified, but PIW cases with living and deceased subjects would may help narrow in on the cases with useful survivability data.
When examining the incident subtypes associated with false positive cases in the test set, we observe that several belong to incident categories that are semantically or operationally related to PIW events, including Person in Water (PIW) and Diving Accident (Table 13). This outcome is expected, as narratives describing these incident types are likely to share overlapping terminology and contextual cues with genuine PIW reports, increasing the likelihood of misclassifications.
Subtypes of the false positive examples in the test set.

We observe a clear association between narrative length and model outcome (Figure 7). False negative cases tend to involve substantially shorter narratives, which may provide insufficient lexical evidence for the classifier to make a correct prediction. In contrast, false positive cases are generally longer than both true positives and true negatives, suggesting that increased document length may introduce spurious or weakly relevant features that bias the model toward a positive classification.

Length of narratives (post-processing) grouped by outcome of model (test set).
6. Conclusion
This project demonstrates how rapid testing with classical models can still inform understanding of a domain-specific text corpus while keeping computing costs low. This methodology is useful for present-day U.S. Coast Guard data analysts when there is still limited to no access to compute and big data storage resources, which is especially true for members working at local units (versus on a data task force or the Office of Data Analytics at U.S. Coast Guard Headquarters). Beyond the Coast Guard, these methods are also likely useful to local government entities, such as fire and rescue or other small organizations that may not have personnel with advanced education or the resources (including funding) needed to adequately employ state-of-the-art LLMs.
For this project’s classification problem, the model’s performance, especially recall, might be further improved by including even more of the tabular data that was masked at the onset of the project since several of those features carry significant information about the outcome of a SAR case. Moreover, these additional features may hold the key to collecting survivability data necessary to validate or retrain the Probability of Survival Decision Aid. Extensive reviews of the labeled reports indicate that many of the texts do not contain information about the individual(s) in distress or the environmental conditions, so while the text will help to identify which reports were about a true person in the water, the survivability data are likely stored elsewhere, if at all.
While text cleaning in this project was focused on classical machine learning methods due to computing restrictions, some of the cleaning aspects explored in this paper—specifically acronym/abbreviation conversion, strong indicator token replacement, and text augmentation with tabular features—are likely to remain pertinent even as Coast Guard NLP initiatives shift toward the use of LLMs.34,35 The extent of preprocessing explored in this project may not be necessary for off-the-shelf LLMs, but the nuances of Coast Guard report texts will likely require major finetuning efforts to adequately perform with those models. The plethora and variation of abbreviations, acronyms, and initialisms alone will require a massive number of documents, which exist but may be difficult to access and use. Preprocessing may allow for better fine tuning with fewer documents. Integration with local large- and small language models (SLMs) is another key line of effort for the future of this project.
In addition, acceptable levels of performance, along with high levels of explainability, were achieved with the classical text analysis methods. Explainability is particularly helpful when presenting results to senior Coast Guard leaders, who likely have little to no education in developing, guiding, and employing artificial intelligence/machine learning (AIML) systems. These small-scale wins will continue to build confidence in these methods and help to accelerate Coast Guard development of technological infrastructure that supports more complex, state-of-the-art analysis.
Supplemental Material
sj-pdf-1-dms-10.1177_15485129261440549 – Supplemental material for Evaluating analysis methods for coast guard reports freeform text: a case study on resource-constrained natural language processing with search and rescue reports
Supplemental material, sj-pdf-1-dms-10.1177_15485129261440549 for Evaluating analysis methods for coast guard reports freeform text: a case study on resource-constrained natural language processing with search and rescue reports by Zachary Kudlak and Justin Sherman in The Journal of Defense Modeling and Simulation
Footnotes
Acknowledgements
We thank the U.S. Coast Guard Research and Development Center, New London, CT, for providing the data, and we also thank the U.S. Coast Guard Academy cadets in the NLP Directed Study in Spring 2023 for data labeling and exploratory data analysis.

Ethical considerations
Not applicable.
Consent to participate
Not applicable.
Consent for publication
Not applicable.
Funding
The authors received no financial support for the research, authorship, and/or publication of this article.
Declaration of conflicting interests
The authors declared the following potential conflicts of interest with respect to the research, authorship, and/or publication of this article: The first author is employed by the U.S. Coast Guard Academy. The second author is an officer in the U.S. Coast Guard and was stationed at the U.S. Coast Guard Academy. The views expressed in this publication are those of the authors and do not necessarily represent the views of the United States, the Department of Homeland Security, or the United States Coast Guard.
Data availability
The dataset used by the authors of this paper is the property of the U.S. Coast Guard and is not available to the general public due to the nature of military after-action reports.
Supplemental material
Supplemental material for this article is available online.
Author biographies
References
Supplementary Material
Please find the following supplemental material available below.
For Open Access articles published under a Creative Commons License, all supplemental material carries the same license as the article it is associated with.
For non-Open Access articles published, all supplemental material carries a non-exclusive license, and permission requests for re-use of supplemental material or any part of supplemental material shall be sent directly to the copyright owner as specified in the copyright notice associated with the article.
