
Abstract

INTRODUCTION
Patients with a sudden loss of consciousness (LOC) are often considered to have syncope, a term implying a generalized cerebral ischemia, and these attacks are relatively common in the elderly population. Since they are paroxysmal and occur suddenly, they may also be considered as epileptic seizures. In fact, Delgado-Escueta et al 1 considered drop attacks followed by confusion as their Type III of complex partial seizures. Also, Niedermeyer 2 has referred to “attacks of simple impairment of consciousness,” usually with a confusional state, as a form of complex partial seizures, and the revised “International Classification of Epileptic Seizures” considers the second form of complex partial seizures 2(a) as “impairment of consciousness only.” 3 Thus, a sudden loss of consciousness may be due to a general cerebral ischemia as a true syncope or due to an epileptic seizure 4,5 and both phenomena are relatively common in the elderly. The present study of the elderly was designed to study the similarities and differences between the EEGs of patients with clear epileptic seizures and patients with only LOC, considered as “syncopal attacks.” If these EEG records are proved to be very similar, they would provide evidence that most syncopal attacks in the elderly are a seizure phenomenon, but if different they would argue for a different mechanism.
METHODS
Persons in the seizure group were randomly selected from the files of the Clinical Neurophysiology Laboratory of the University of Illinois Hospital. Patients qualified if their clinical seizures began after 60 yrs of age. The comparison group, called the syncope group, were those with a sudden LOC as their only symptom, also beginning after 60 yrs of age. The EEGs of all patients were recorded between 1977 and 1999, usually on 18-channel instruments with electrodes placed according to the International 10–20 System, utilizing both referential and bipolar montages during both wakefulness and (usually) sleep, including hyperventilation (when possible) and photic stimulation. All patients were instructed to come to the EEG Laboratory with approximately one half of a typical night's sleep in order to sleep during the test. Occasionally, chloral hydrate (usually 500–1500 mg) was orally administered to those whose sleep was not spontaneous, and sleep records were commonly at least 20 min in length, including the spindle stage (Stage II).
The EEGs were interpreted by the senior author (JRH) and included the assessment of the frequency of the waking background rhythm. For the analysis of this study, a range of 1 cycle per sec in the original report was listed as the one-half cycle between the full cycle and a range of one-half cycle (e.g., 9.0–9.5) was listed at the higher of the two frequencies. Also assessed in the background rhythm was the degree of rhythmicity (called organization) and absolute amplitude (called development), determined on a referential montage. For both categories, assessments were called (1) poor, (2) fair, (3) moderate, (4) well and (5) very well. In the case of organization, the classification of “very well” was defined as a consistent, highly sinusoidal background rhythm, and “poor” was defined as a rhythm whose frequency could be determined only with great difficulty. The “moderate” category was between the two extremes. The categories of “fair” and “well” were between “moderate” and the two extremes. For development these same five categories were defined as mean peak-peak amplitudes of <20 μV, 20–60 μV, 60–100 μV, 100–150 μV, and > 150 μV, respectively. In one study, 6 these judgments could be made with a 96% agreement among 3 EEGers skilled at those same judgments. For slow wave abnormalities, the degree of slowing was assessed in the waking record, utilizing five categories: (1) mild (rare theta rhythms or slow transients), (2) mild-moderate (25–50% with theta), (3) moderate (<20% with delta waves), (4) moderate-marked (20–50% with delta) and (5) marked (>50% with delta waves). Epileptiform activity such as sharp waves, spikes or spike and wave complexes were assessed according to their incidence: (1) rare referred to <4 paroxysms in a 20-min sleep record, (2) few, 4–6, (3) typical or standard number of 7–12, (4) frequent, 12 in 20 min to 1/10 sec, (5) many, average of >1/10 sec, and (6) very many, repetitive, at times, <1/sec. PLEDs were designated only when a repetitive discharge appeared throughout the entire record with no more than a 20-sec period without such a discharge. None of the controversial patterns were counted as clearly epileptiform. 7
The clinical histories of all patients were reviewed. Etiologies were listed, when designated: hypertension (HTN) when diastolic values were >100 mm, head injury when LOC had occurred, and cardiac abnormalities when cardiologists considered the patient to have clinically significant cardiologic disease. Statistical significance was determined between the two groups by the Fisher's Exact Test, designating x = p < 0.05; xx = p < 0.001; xxx = p < 0.0001; xxx = p < 0.00001 in all Tables.
RESULTS
The seizure group (Sz) consisted of 161 patients with 61 males and 100 females (62.1%); the syncope group (Sync) were 122 in number with 48 males and 74 females (60.7%). The age range in the Sz patients was 60–91 yrs, mean of 70.7 yrs, with 302 EEGs; in the Sync group the age range was a similar 60–95 yrs, mean of 72.3 yrs, with 133 EEGs. Thus, the incidence of females in both groups was within 1.4%, the age range similar and the mean age differing only by 1.6 yrs.
The seizures in the Sz group consisted of: simple partial 15 (9.3%), complex partial 110 (68.3%), complex partial with secondary generalization 12 (7.5%), generalized tonic-clonic 16 (9.9%), atonic 1 (0.6%) and unknown type 7 (4.3%). The attacks in the Sync group were only a sudden LOC without any other manifestations.
I. Etiology
The presumed etiology in the two groups is seen in Table 1. Very significant differences appeared in the incidence of some type of etiology in the Sz and Sync groups (83% vs. 39%; p < 0.00001) and specifically with a history of a CVA (cerebrovascular accident) more in the Sync than in the Sz group (41 vs. 8%; p < 0.00001), but also a difference was seen for any type of cerebrovascular etiology (p < 0.001). One other major difference was that 21% of the Sz group had a brain tumor and none appeared in the Sync patients (p < 0.00001). Two factors were seen exclusively in the patients with “syncope” viz, significant hypertension and some type of cardiac abnormality (both p < 0.00001).
Presumed etiology of seizures and “syncope” in elderly
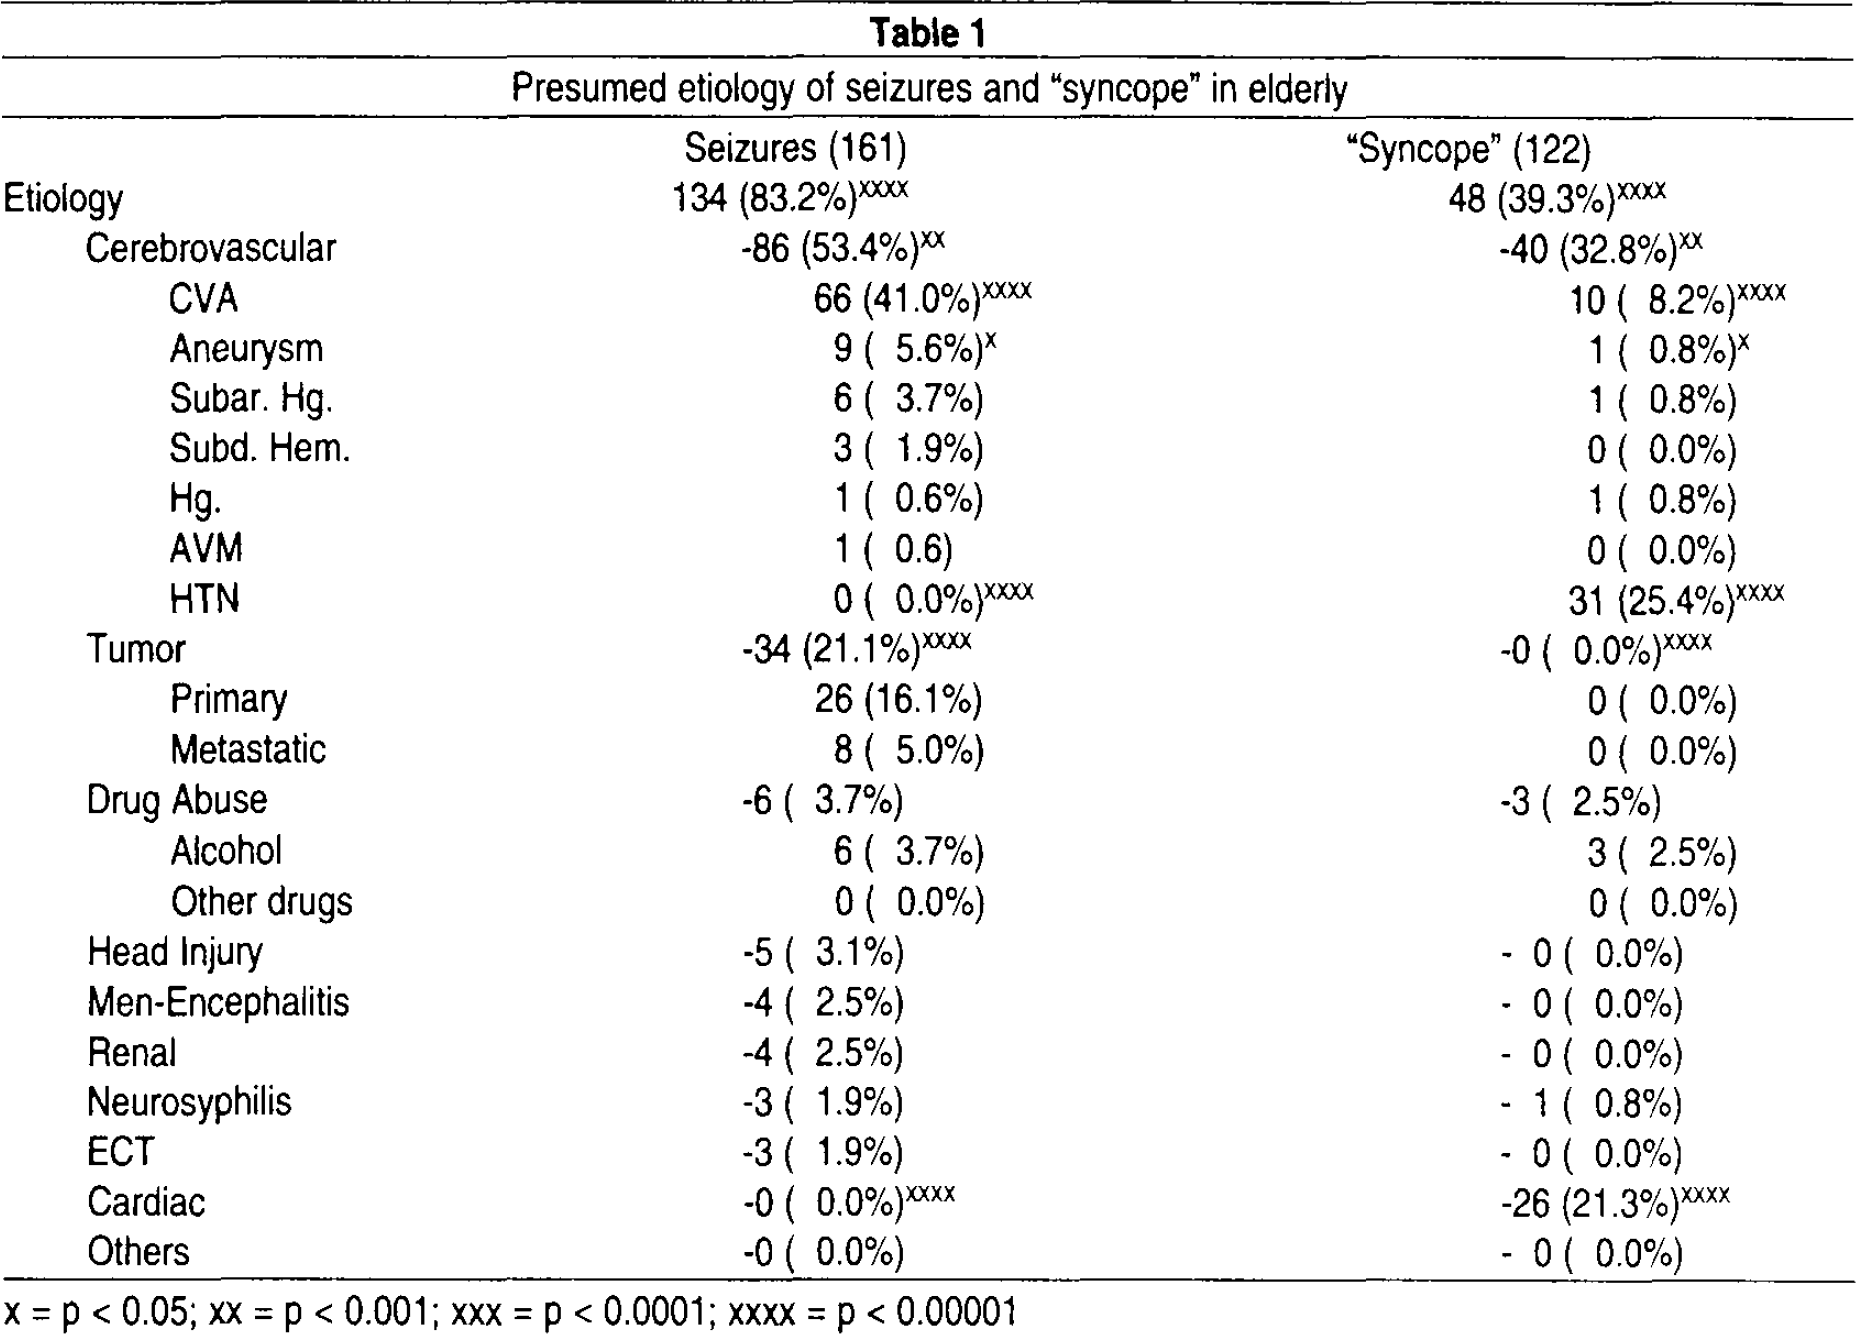
= p < 0.05
= p < 0.001
= p < 0.0001
= p < 0.00001
II. Epileptiform Discharges
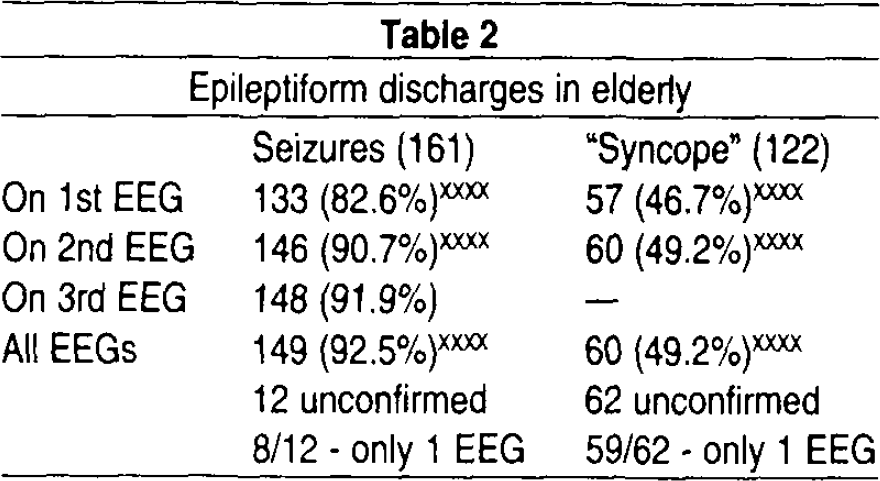
In Table 2 the incidence of epileptiform discharges is seen on the first, second and all EEGs. A great difference (p < 0.00001) appeared between the groups since 83%, 91% and 93%, respectively, were noted in the seizure patients, in contrast to 47%, 49% and 49% in the syncope group. Table 3 shows more data on epileptiform activity on the first EEG, when a wake and sleep vs. only waking record was obtained. Although sleep was obtained significantly more often in the syncope group, discharges appeared in nearly twice as many seizure patients. For those that slept, a significant difference (p < 0.001) was seen for the larger number of Sz patients with a discharge, but for those that had only waking records, an even greater difference (p < 0.00001) appeared.
Epileptiform discharges in elderly
Relation of sleep EEGs and discharges in elderly
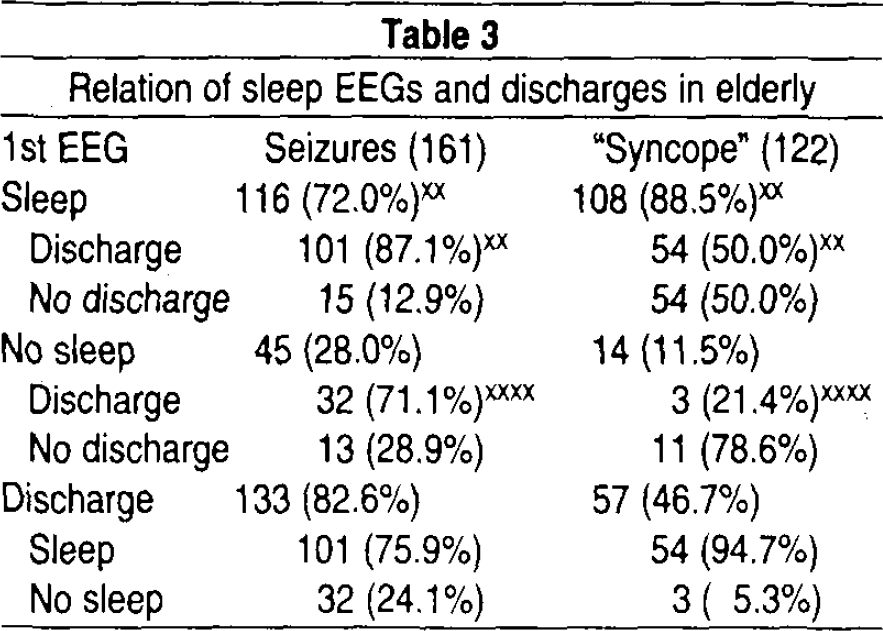
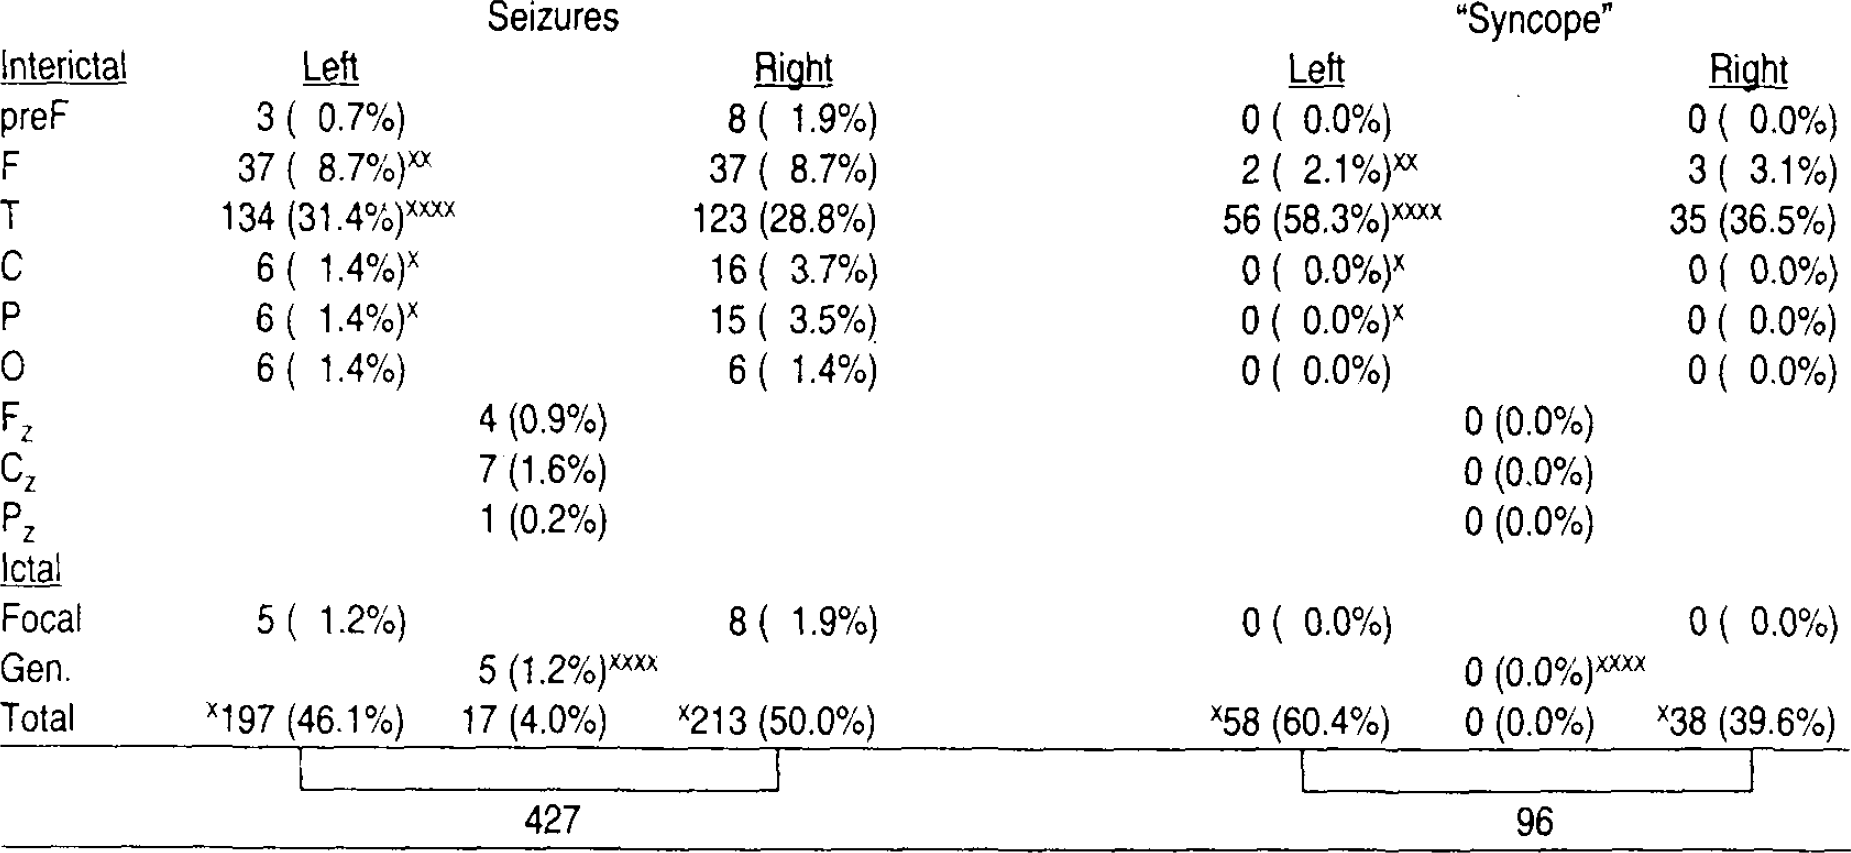
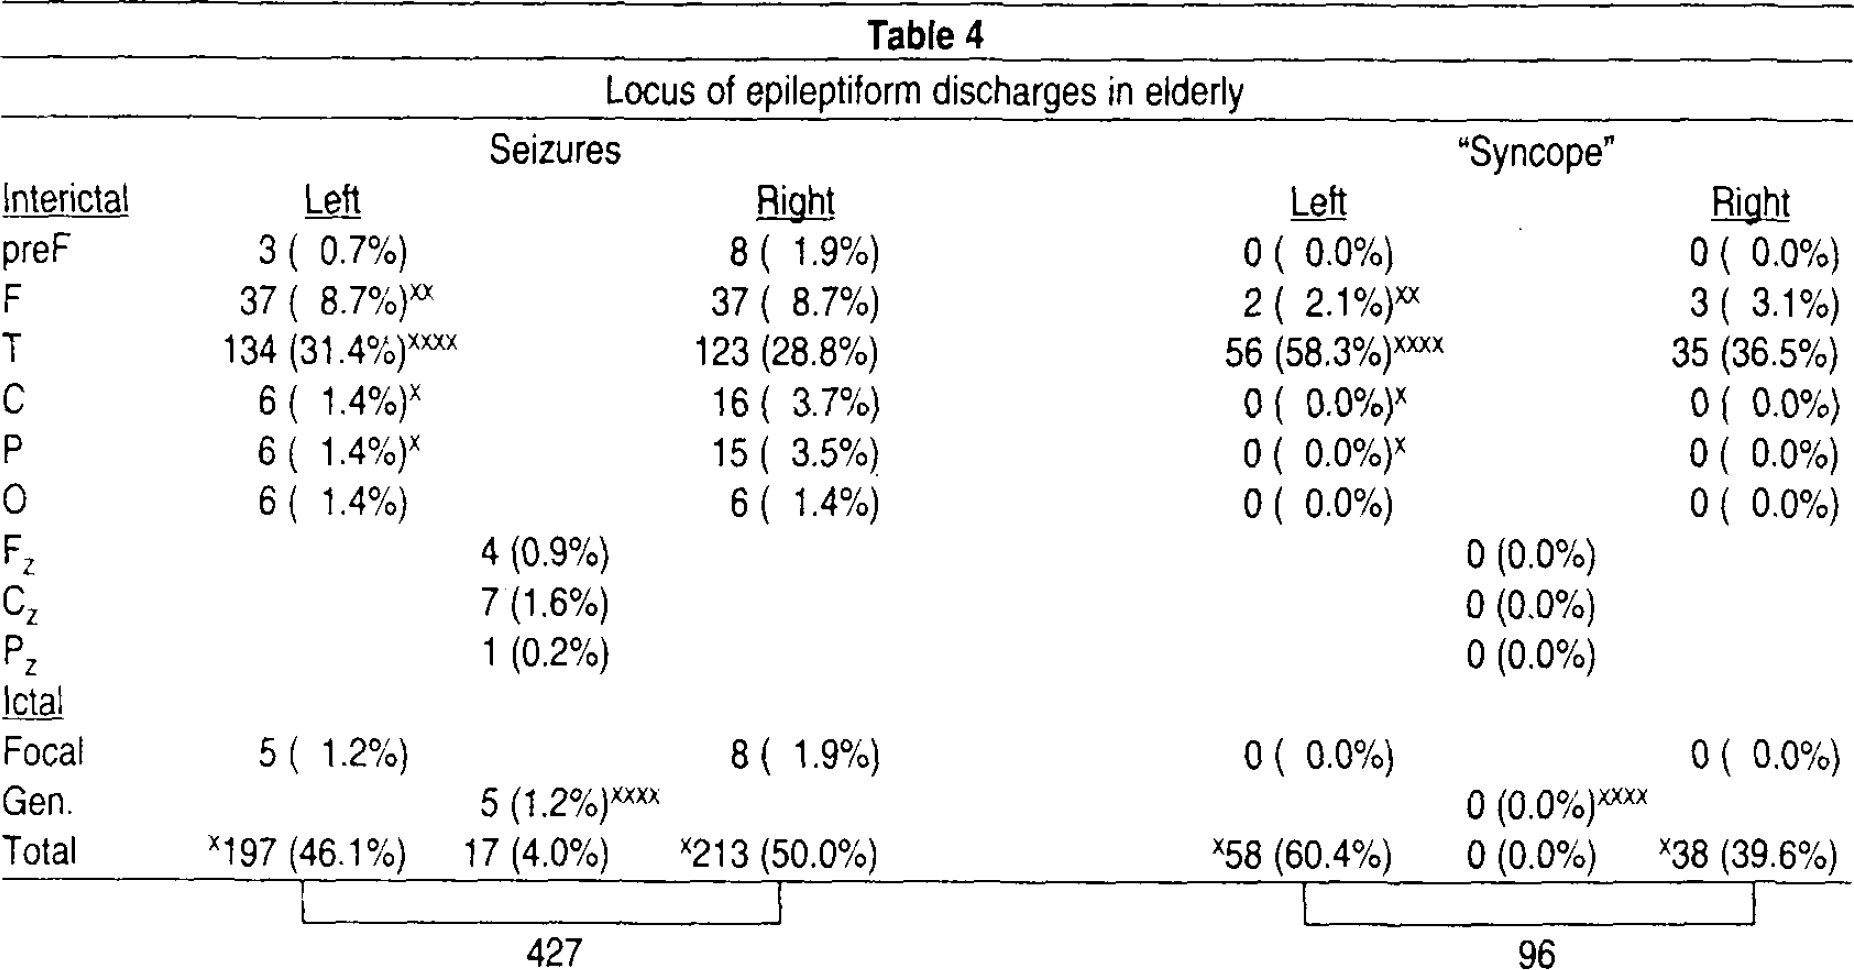
Table 4 shows the location of these interictal discharges. When paroxysms appeared they were much more often (p < 0.00001) on the temporal areas in the Sync group, but appeared on the prefrontal, central, parietal, occipital, and midline areas only in the Sz patients. The Sync group had discharges relatively more often on the left, and Sz patients more often on the right. Only the Sz group had generalized discharges.
Locus of epileptiform discharges in elderly
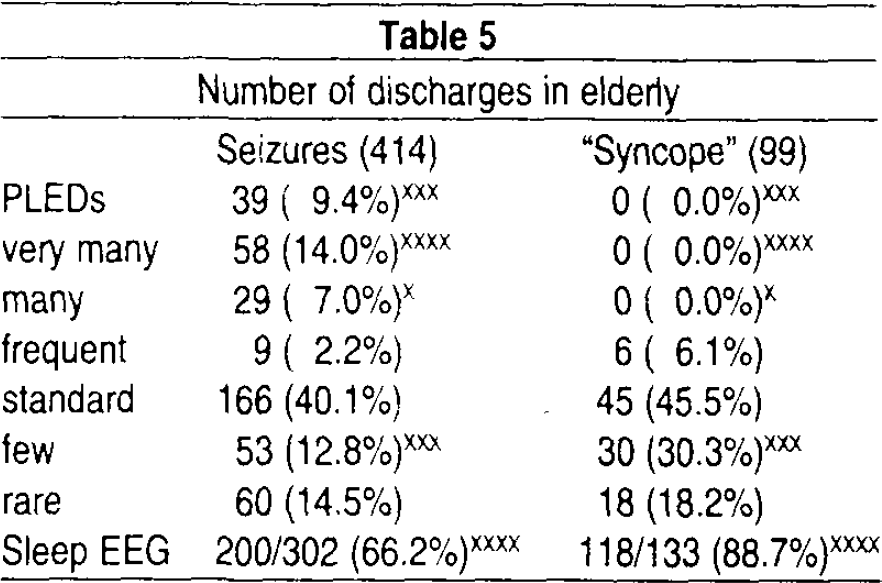
In Table 5 the numbers of discharges are seen, showing that only the elderly patients with seizures had PLEDs, very many or many discharges, although they had fewer sleep records. Consistent with the difference in numbers of discharges the seizure group less often had only few discharges.
Number of discharges in elderly
III. Slow Waves
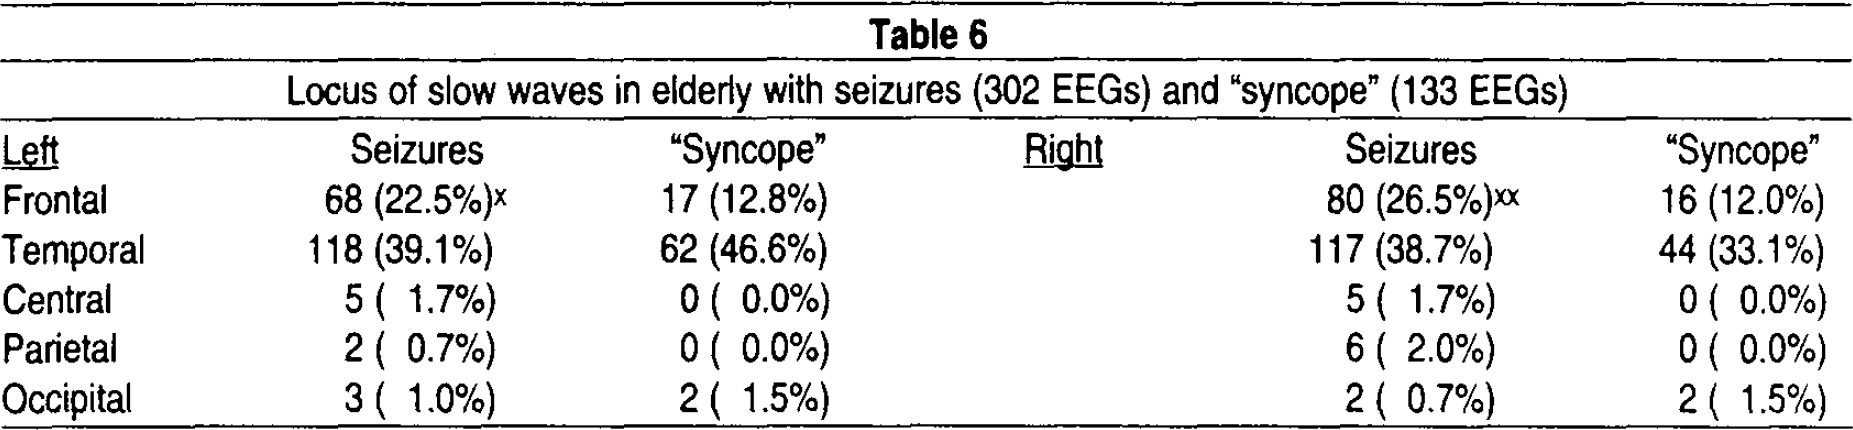
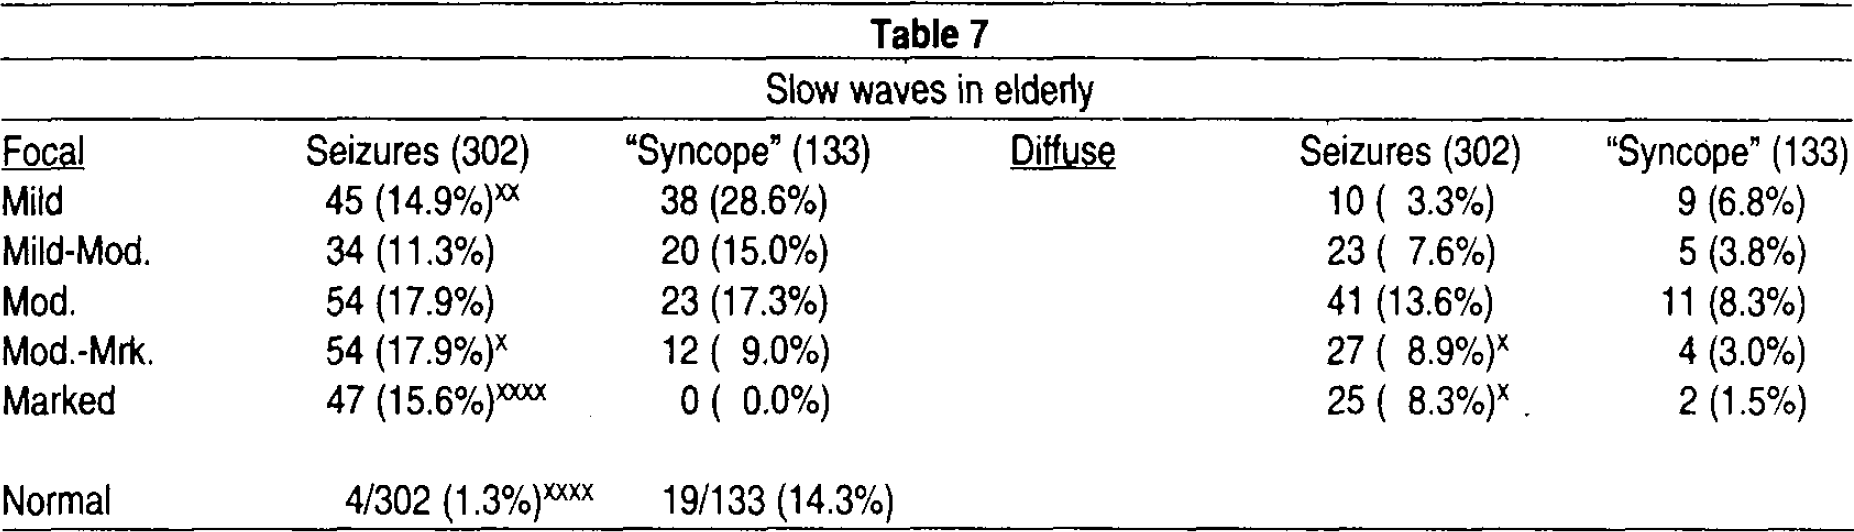
Slow waves were seen in 75.2% of all records and 73.8% of all patients. Table 6 shows the location of these slow waves. Only one significant difference appears, and that is the seizure patients more often (p < 0.05) had frontal slowing, both on the left and right. In Table 7, these slow waves are evaluated for degree of severity. For those that were focal, only the seizure patients showed a marked degree (p < 0.00001) of slowing, and also more often showed a moderate-marked degree and less often only mild slow waves. For diffuse slowing, the seizure patients more often showed a marked or moderate-marked degree. This Table also shows the difference in normal records in that the Sz patients had only a 1% incidence in contrast to 14% in the Sync group.
Locus of slow waves in elderly with seizures (302 EEGs) and “syncope” (133 EEGs)
Slow waves in elderly
IV. Background Activity
In Figure 1 the frequency of the background activity is seen for the two groups and shows that the seizure patients had slower background frequencies with peaks at 7.0 and 9.0/sec. The Sz patients had many more frequencies under 8.0/sec (p < 0.00001) and fewer over 9.0/sec (p < 0.05).
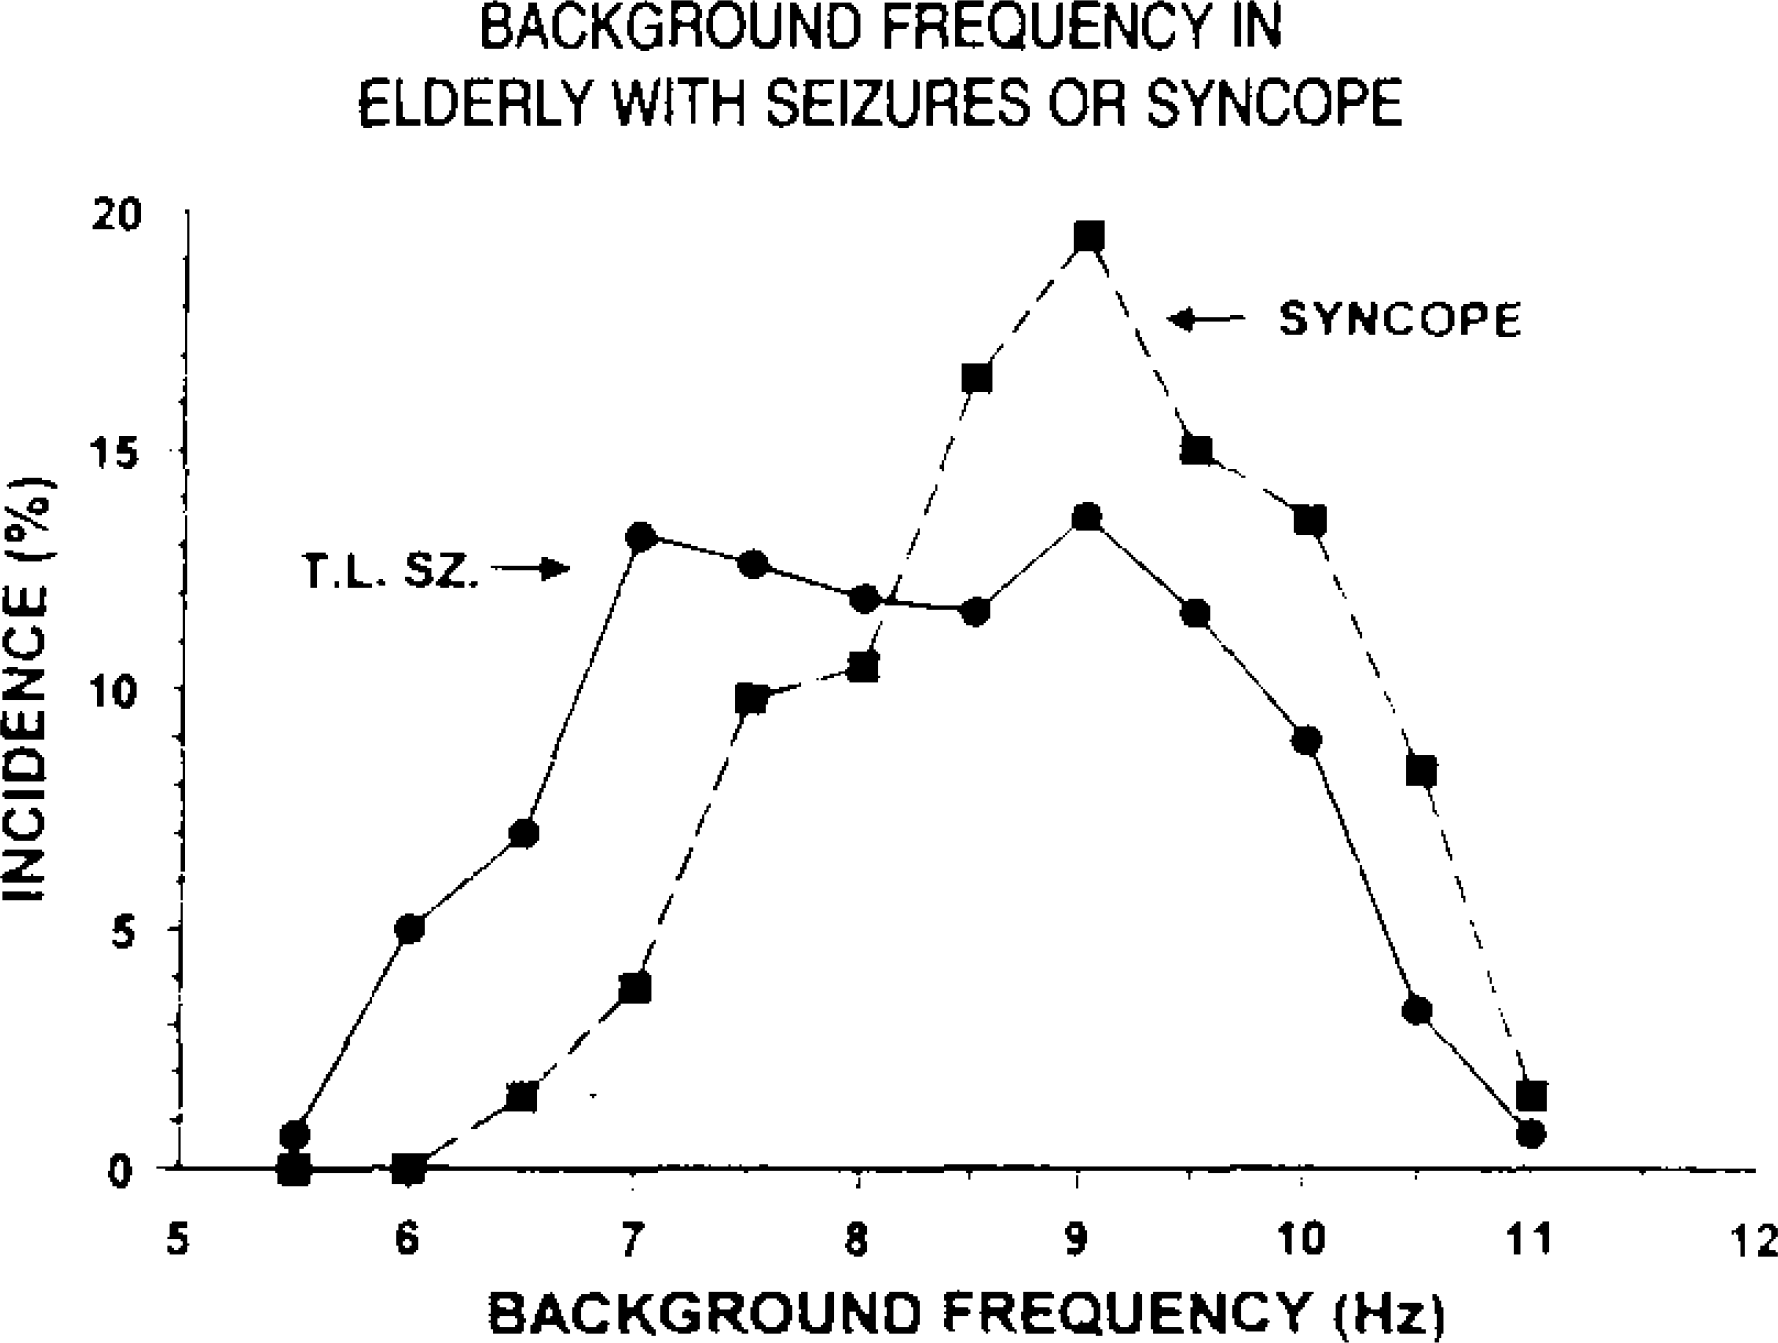
Background frequency in elderly with temporal lobe seizures (dots) and syncope (squares). Incidence in percent is on the vertical axis and background frequency in hertz on the horizontal axis.
In Figure 2 organization and development of the background is seen. The seizure patients show very much more often poor-fair organization and less often well or very well organized alpha (p < 0.00001). Similar differences are seen for the development of the background activity. The seizure patients more often have poor or fairly developed alpha and less often well or very well developed rhythms (p < 0.05).
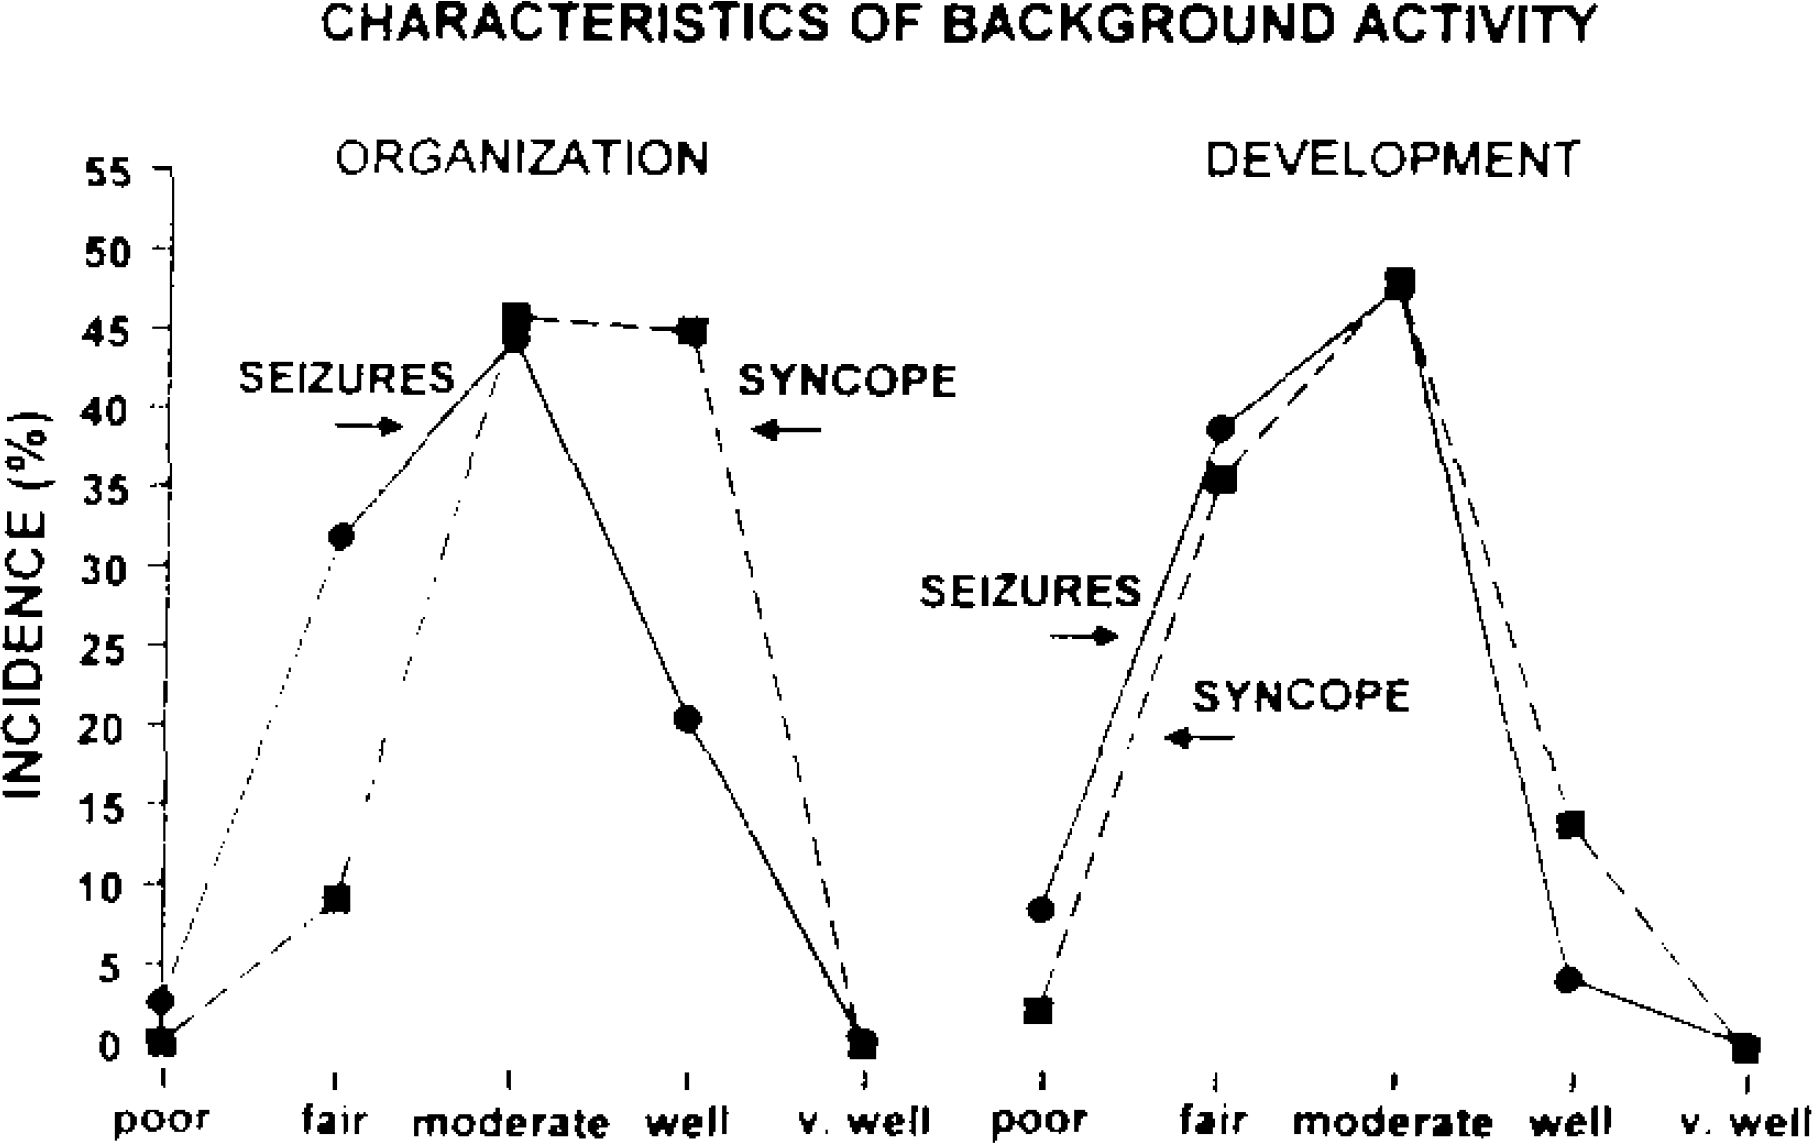
Characteristics of background activity: organization (left) and development (right) for elderly with seizures (dots) and syncope (squares). Incidence in percent is on the vertical axis and quality of the organization and development (poor to very well) is on the horizontal axis.
V. Relationship of Etiology to Discharges
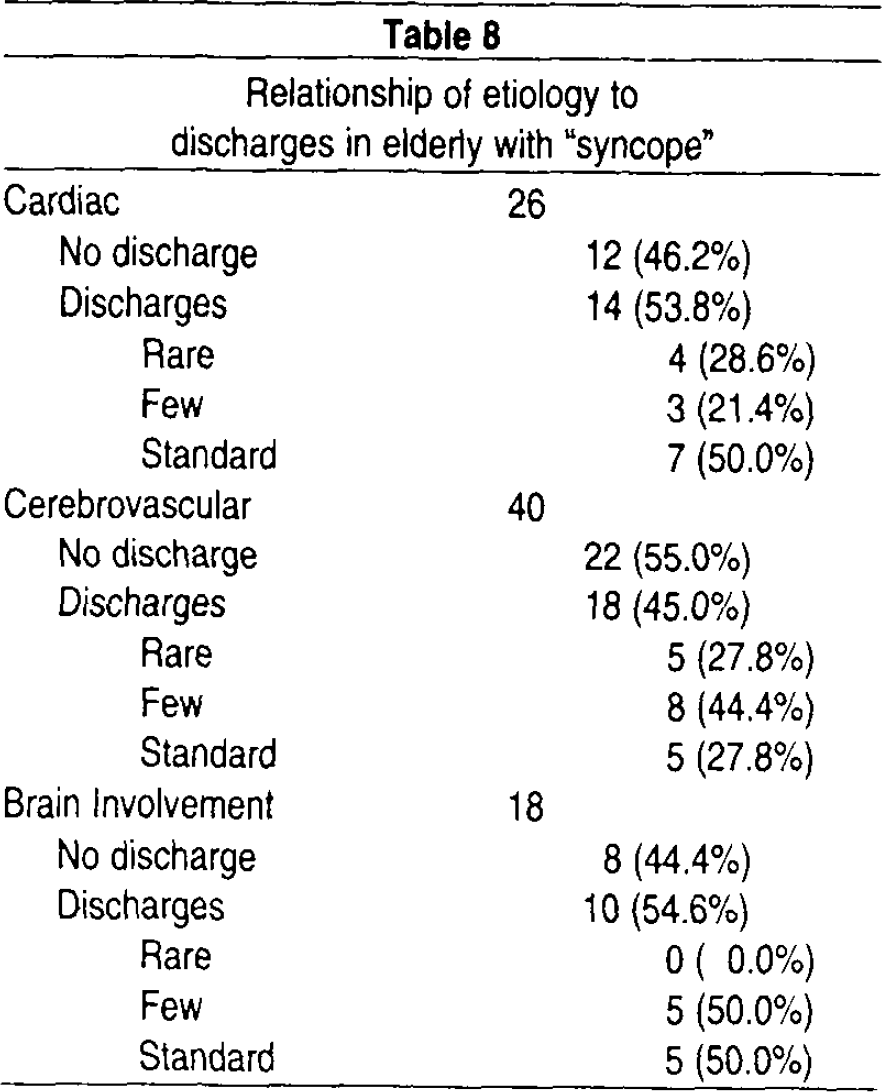
Table 8 shows that discharges appeared in nearly one half of syncope patients regardless of etiology. For those with a cardiac etiology, discharges were seen in slightly over one half, but somewhat less often with a cerebrovascular etiology. For other types of organic brain involvement, discharges were seen in slightly over one half.
Relationship of etiology to discharges in elderly with “syncope”
Further analysis was done to try to understand the relationship of epileptiform activity and slow waves to cardiac etiologies. Although cardiac patients more often had normal EEGs than the rest of the patients (26.9 vs. 11.2%; p < 0.05), those with sharp waves more often also had slow waves, compared to patients without sharp waves (85.7 vs. 41.7%; p < 0.05). The same conclusion of sharp and slow waves together pertained to those with either a cardiac or some specific brain involvement, compared to patients without sharp waves (91.7 vs. 55.0%; p < 0.01). Of those patients with discharges, more often they were female (73 vs. 27%; p < 0.00001). Finally, the mean age of patients with different EEG findings was determined to provide evidence for the possible sequence of EEG abnormalities over time. The mean age of those (1) without discharges or slowing, (2) with discharges only, (3) with slowing only and (4) with both discharges and slowing was (1) 66.5, (2) 66.8, (3) 72.5, and (4) 74.2 yrs, respectively. Thus, these ages provide evidence that one typical sequence of events in this population of syncope patients may be that discharges occur first, with the addition of slow waves later. Further evidence that some slow waves may, in part, be dependent upon the previous presence of an epileptiform sharp wave is that 100% of patients with an organic brain involvement and sharp waves showed also slow waves, compared to only 75%, if no sharp waves appeared. On the other hand, the degree of slow wave abnormality was similar when sharp wave discharges were present and when they were not.
In summary, nearly one half of syncope patients had discharges, regardless of a specific etiology and these discharges were often associated with later slow waves, especially if organic brain involvement was also evident.
DISCUSSION
The major reason for this study was to determine if patients with LOC or blackouts only (“syncopal attacks”) had EEGs similar to or different from patients with definite complex partial seizures. If similar, then the evidence would be that these “syncopal attacks” are likely seizures. However, the data in this study showed many significant differences between the two groups. The seizure patients were significantly different from the syncope patients by the higher incidence of (1) some etiology (83 vs. 39% — Table 1), (2) epileptiform discharges (93 vs. 49% — Table 2) with a different location, more often parasagittal, midline or generalized (Table 4), and a different number with active foci (Table 5), (3) of frontal slow waves (Table 6), (4) more severe slow wave abnormalities (Table 7), (5) slower background frequencies, less well organized and developed (Figures 1 and 2), and (6) abnormal EEGs (Results V). Thus, the first conclusion is that the EEGs of the seizure group were sufficiently different from the syncope group and that these latter patients as a group are not just simply examples of seizure patients.
A brief review of the literature reveals the complexity of the interrelationship between cardiac and cerebral mechanisms in patients who have just “syncope.” After careful study, some of these patients have proven to be seizure patients, especially those with the “ictal bradycardia syndrome” that can mimic a syncopal attack, 4 seen as a seizure leading to cardiac arrhythmias 5 or asystole 6 in particular and possibly leading at times to sudden unexpected death in epilepsy (SUDEP). 7 The hypothesis is that a temporal discharge activates the reticular formation and the parasympathetic system, leading to a sinus arrest. 8 Reeves et al 9 have reviewed the ictal bradycardia syndrome, seen in all age groups from 4 mo to 72 yrs (mean 39 yrs) but 5:1 male and 87% with discharges from the temporal lobe. Two patients in another study 10 showed discharges, specifically on the left temporal area, that precipitated a significant cardiac event. Another seizure phenomenon has been called the “temporal lobe drop attack.” 11 This type of attack usually involves a very long delay after the epilepsy onset (mean 24 yrs); spread of seizure activity likely occurs within the pontine reticular formation to account for the atonic attack.
A number of authors 12,13 have properly emphasized the importance of the EEG in identifying the seizure components of these and similar phenomena. One study 14 showed that a noncardiac etiology (likely seizure) was evident in 26%, and another 15 emphasized that the EEG was abnormal as often in patients with bradycardia as in nonbradycardia patients.
Obviously, the electrocardiogram (ECG) plays a significant role in identifying the possible mechanisms. Some studies have reported nearly half (48%) of syncope patients had sinus bradycardia, 15 adding 17% more with Holter monitoring. Another study reported exactly 50% with a cardiogenic syncope. 14 Other groups have reported a lower incidence of an abnormal ECG, e.g., 17%. 16 When such a cardiogenic etiology is identified, a 19% early death rate had been reported 14 and in another report a 25% mortality-morbidity rate. 17 Simultaneous video-EEG-ECG can, at times, properly identify a cardiogenic syncope. 18
The latter discussion makes clear that there is, of course, an intimate relationship between the heart and brain. Examples of this relationship are cases of epileptic and hypoxic interaction. 19 One study reported that 69% of seizures were associated with sinus tachycardia, 20 but after 24 hr studies 74% were viewed as seizure and 26% as cardiogenic in etiology. The multifactorial mechanisms are emphasized in one particular study 14 which concluded that 86% of these patients could be properly diagnosed using the history, standard ECG and EEG. At times, as an example of the importance of both types of recording, a vasovagal syncope was shown in one patient to lead to a complex partial seizure. 5,21 As another example of the complexity of these interactions, even after detailed study of ECGs and EEGs, as many as 29% may remain without a clear diagnosis. 15
The results of our own study support the complexity of the cerebral-cardiac interactions in patients with syncope. For example, discharges appeared with nearly a 50% incidence, regardless of probable etiology (Table 8), and the overall incidence in all syncope patients was 49% (Table 2), implying that nearly one half of the patients likely have some relationship to a seizure mechanism. This 49% incidence is very different from a 12% rate found in another study 22 by the same author (JRH) in the same age group, without obvious organic brain disease but not as a normal control. Thus, our 49% incidence cannot be an effect of the older age group under study. The predominance of the discharges in the syncope group as temporal in location (95% in Table 4) is consistent with the literature with case histories of definite seizure patients presenting with “syncope,” nearly always with temporal lobe discharges. The fact that the latter patients show fewer discharges than the epileptic group (Table 5), never with many, very many or PLEDs, may indicate that foci, when present in this group, are often not sufficiently active to reveal clear examples of seizure and may depend upon other factors, like cardiovascular ones, to manifest themselves as a sudden loss of consciousness.
The great difference between the syncope and seizure groups in normal records (14 vs. 1% in Table 7) and in the characteristics of the background rhythm (Figures 1 and 2) provides further evidence that the syncopal group does not show the same degree of cerebral organicity as the seizure patients. When slow waves are considered, a similar conclusion can be reached. Much less slow activity appeared in the syncope group (Table 7). In the patients with a cardiac abnormality the presence of discharges greatly increased the incidence of slow waves, and if patients with other evidence of organic brain involvement were added a further increase was seen.
The differences in mean age of four different subgroups of patients within the syncope group may provide evidence for a possible sequence of EEG findings in some patients. The progressive increase in mean age from 66.5 yrs to 74.2 yrs was found for the groups without either sharp or slow waves, with one or the other and finally to those with both sharp discharges and slow activity. Furthermore, if patients with clear organic brain involvement and discharges were considered, 100% had slow waves. These data would suggest that discharges may often occur first, followed by additional slow activity later, especially in some patients with “syncope” who have independent evidence of an organic brain involvement.
The final conclusion in this study on elderly patients is that the EEG in elderly seizure patients is usually very different from syncope patients. Nearly one half of the syncope patients have epileptiform activity, which may be only mildly epileptogenic, requiring additional mechanisms, especially involving the cardiovascular system, to manifest an attack of unconsciousness.
SUMMARY
The EEGs of elderly patients with a definite seizure disorder (161 patients; 302 EEGs) were compared to patients with “syncope” (122 patients; 133 EEGs), especially to determine if the latter patients were sufficiently similar to the seizure patients that the syncope could be viewed as a seizure phenomenon. The two groups were similar only by the predominance of females in both groups (61–62%) and otherwise were very different. The seizure group had a higher incidence of (1) etiology (83 vs. 39%), (2) epileptiform discharges (93 vs. 49%), with a different location, more often parasagittal, and different number often with active or very active foci, (3) frontal slow waves, (4) more severe slow wave abnormalities, (5) slower background frequencies, that were less well organized and developed and (6) abnormal records. The conclusion is that the syncope patients as a group are usually not simply seizure patients. Regardless of etiology, the patients with “syncope” (33% with cerebrovascular and 21% cardiac etiologies) showed nearly a 50% incidence of epileptiform discharges, demonstrating a complex interrelationship between cardiac and cerebral mechanisms, which are discussed. The conclusion is that epileptiform activity in elderly patients with syncope is likely to be mildly epileptogenic, and may require additional cardiovascular mechanisms to generate an attack of unconsciousness.