
Abstract
The goal of this study was to explore the frontal-mid-line theta rhythm (Fm theta) generation mechanism employing event-related desynchronization/synchronization (ERD/ERS) analysis in relation to task-irrelevant external stimuli. A dual paradigm was employed: a videogame and the simultaneous presentation of passive auditory oddball stimuli. We analyzed the data concerning ERD/ERS using both Fast Fourier Transformation (FFT) and wavelet transform (WT).
In the FFT data, during the periods with appearance of Fm theta, apparent ERD of the theta band was observed at Fz and Cz. ERD when Fm theta was present was much more prominent than when Fm theta was absent. In the WT data, as in the FFT data, ERD was seen again, but in this case the ERD was preceded by ERS during both the periods with and without Fm theta. Furthermore, the WT analysis indicated that ERD was followed by ERS during the periods without Fm theta. However, during Fm theta, no apparent ERS following ERD was seen.
In our study, Fm theta was desynchronized by the auditory stimuli that were independent of the video game task used to evoke the Fm theta. The ERD of Fm theta might be reflecting the mechanism of “positive suppression” to process external auditory stimuli automatically and preventing attentional resources from being unnecessarily allocated to those stimuli. Another possibility is that Fm theta induced by our dual paradigm may reflect information processing modeled by multi-item working memory requirements for playing the videogame and the simultaneous auditory processing using a memory trace. ERS in the WT data without Fm theta might indicate further processing of the auditory information free from “positive suppression” control reflected by Fm theta.
INTRODUCTION
Conditions requiring continuous attention or concentration in order to perform a task have been shown to evoke a particular rhythm at midline Cz and Fz leads, i.e., the frontal-midline theta rhythm (Fm theta). 1,2 Fm theta is defined as a train of rhythmic waves, observed in the frequency band of 5.5–7.5 Hz, and having a focal distribution with a maximum around the frontal midline in the electroen-cephalogram (EEG) of normal subjects. 1,3,4 The train usually lasts for several seconds and tends to wax and wane. 1,3
Magnetoencephalogram (MEG) studies modeled the generator sources of Fm theta in various parts of the lateral frontal cortex of both hemispheres or in a large area of the medial prefrontal cortex including the anterior cingulated cortex (ACC). 5 –8 Despite these findings, the neuronal substrates underlying the Fm theta generation mechanism have not been fully elucidated. One way to assess the stimulus-related responses of different EEG frequency bands is event-related desynchronization (ERD) and synchronization (ERS) analysis. 9,10 ERD is defined as a phasic relative amplitude decrease, whereas ERS denotes a phasic relative amplitude increase in a defined frequency band occurring in relation to an event. 11 It has been documented that distributed theta, alpha, and gamma oscillatory systems might act as communication networks with functional relations to memory and integrative functions. 12 –14
It has been indicated that the ERD of theta and alpha rhythms during an auditory memory task could be closely associated with higher cortical processes such as memory functions, rather than with auditory stimulus processing per se. 15 Theta synchronization is related to episodic memory performance, 16 –18 or interpreted to reflect visuo-spatial working memory processes. 19 Since theta long-term potentiation (LTP) is closely linked to the synchronous activity of the hippocampal theta rhythm, 20,21 theta synchronization may be related to the encoding of new information. 16 –18 The hippocampal theta may be transmitted to the cortex via hippocampal cortical feedback loops. 16,18 The authors suggested that the initiation and maintenance of stimulus-locked hippocampal theta observed in neuromagnetic responses may facilitate processing of potentially salient and/or novel input with respect to a context established by the contents of working memory. This may be essential for orientation to perturbations in the sensory environment, a function requiring the use of a context established by a constellation of stimuli. 12 Furthermore, the induced band power (IBP), 22 a variant method of ERD, in a visuo-spatial working memory task revealed that the sustained theta decreased more over the frontal electrodes for memory trials than for the sensory trials.
A Sternberg working memory task evoked a phenomenon termed “cognitive gating of theta oscillations” in which the amplitude of theta oscillations increased dramatically at the start of a trial, continued through all phases of the trial, including the delay period, and decreased sharply at the end. 23 These results suggest that theta oscillations could have an important role in organizing working memory. These findings are compatible with the finding that theta or Fm theta during working memory tasks increased and overt performance improved after practice on the tasks and that theta increased with increased task difficulty. 6,7
Therefore, ERD/ERS may serve to assess cognitive processes specifically associated with a specific EEG rhythm such as Fm theta. The goal of this study was to explore the generation mechanism of Fm theta employing ERD/ERS analysis for the theta rhythm in relation to task-irrelevant external stimuli. We employed a dual-task paradigm to explore reactivity to cognitive events not involved in the evoking of Fm theta. The primary task was a videogame (designed to evoke Fm theta) and a passive auditory oddball task with stimuli independent of the videogame.
ERD/ERS are different phenomena from phase-locked EEG activity including all types of event-related potentials (ERPs). For the quantification of phase-locked EEG activity the technique of signal averaging is employed, whereby the non-phase-locked EEG such as ERP/ERS is attenuated. Phase-locked and non-phase-locked EEG activity cannot be distinguished when both types of activity are within the same frequency band. This means an ERP can mask ERD/ERS. 24 With the classical ERD methods, event-related EEG data are first bandpass filtered, the samples squared and then averaged over trials. Bandpass filtering of each trial, squaring of samples and averaging across all trials, results in a time course of instantaneous band power (power method). Bandpass filtering of each trial and calculating the intertrial variance by averaging all the trials also results in a time course of instantaneous band power (intertrial variance method). The difference between the two methods is that in the power method both phase-locked and non-phase-locked EEG activities contribute to the band power changes, while in the intertrial variance method only the non-phase-locked activity is quantified. 24
The intertrial variance method attenuates the phase-locked activity, whereas the presentation of a stimulus may lead to a resetting of the phase of an EEG/MEG oscillation. 25,26 Since the phase resetting is evoked by the stimulus, the induced activity “becomes” evoked activity for a short period of time. Specifically, P300, evoked by an “oddball” paradigm, may be a result of a transient event-related phase-resetting of induced rhythmic activity. 27,28 Thus, the averaged ERP may be partly composed of synchronized background activity. 29
Furthermore, a disadvantage of the classical ERD/ERS including the intertrial variance method technique using band pass filtering such a short-term Fast Fourier Transformation (FFT) is that it has a relatively poor temporal resolution. 30 On the other hand, the wavelet transform (WT) method, based on a time-frequency (TF) wavelet decomposition, can quantify a time-varying energy of the signal in each frequency band's oscillatory activity. 31 This method provides a better compromise between time and frequency resolution 32 than previously proposed ERD/ERS methods using FFT filtering. 33 Hence, we analyzed the data concerning ERD/ERS using FFT and the intertrial variance method at first and secondly reanalyzed using WT to confirm the results of FFT analysis. The time resolution of a WT is better at high frequencies whereas its frequencies resolution is better at lower frequencies. WT is well suited for the dynamic of EEG signal, in which low frequencies change more slowly than higher frequencies, 29 as general in cognitive tasks evoking Fm theta.
METHODS AND MATERIALS
Subjects
Eight healthy volunteers (24–33 years, six males), who had frequently showed Fm theta (Figure 1) in preliminary EEGs, were recruited. All subjects reported that they were in good physical health and had normal hearing. After a complete description of the study was presented to the subjects, all subjects gave informed consent for the protocol, which was approved by the Institutional Review Board of the Juntendo Institute of Mental Health.
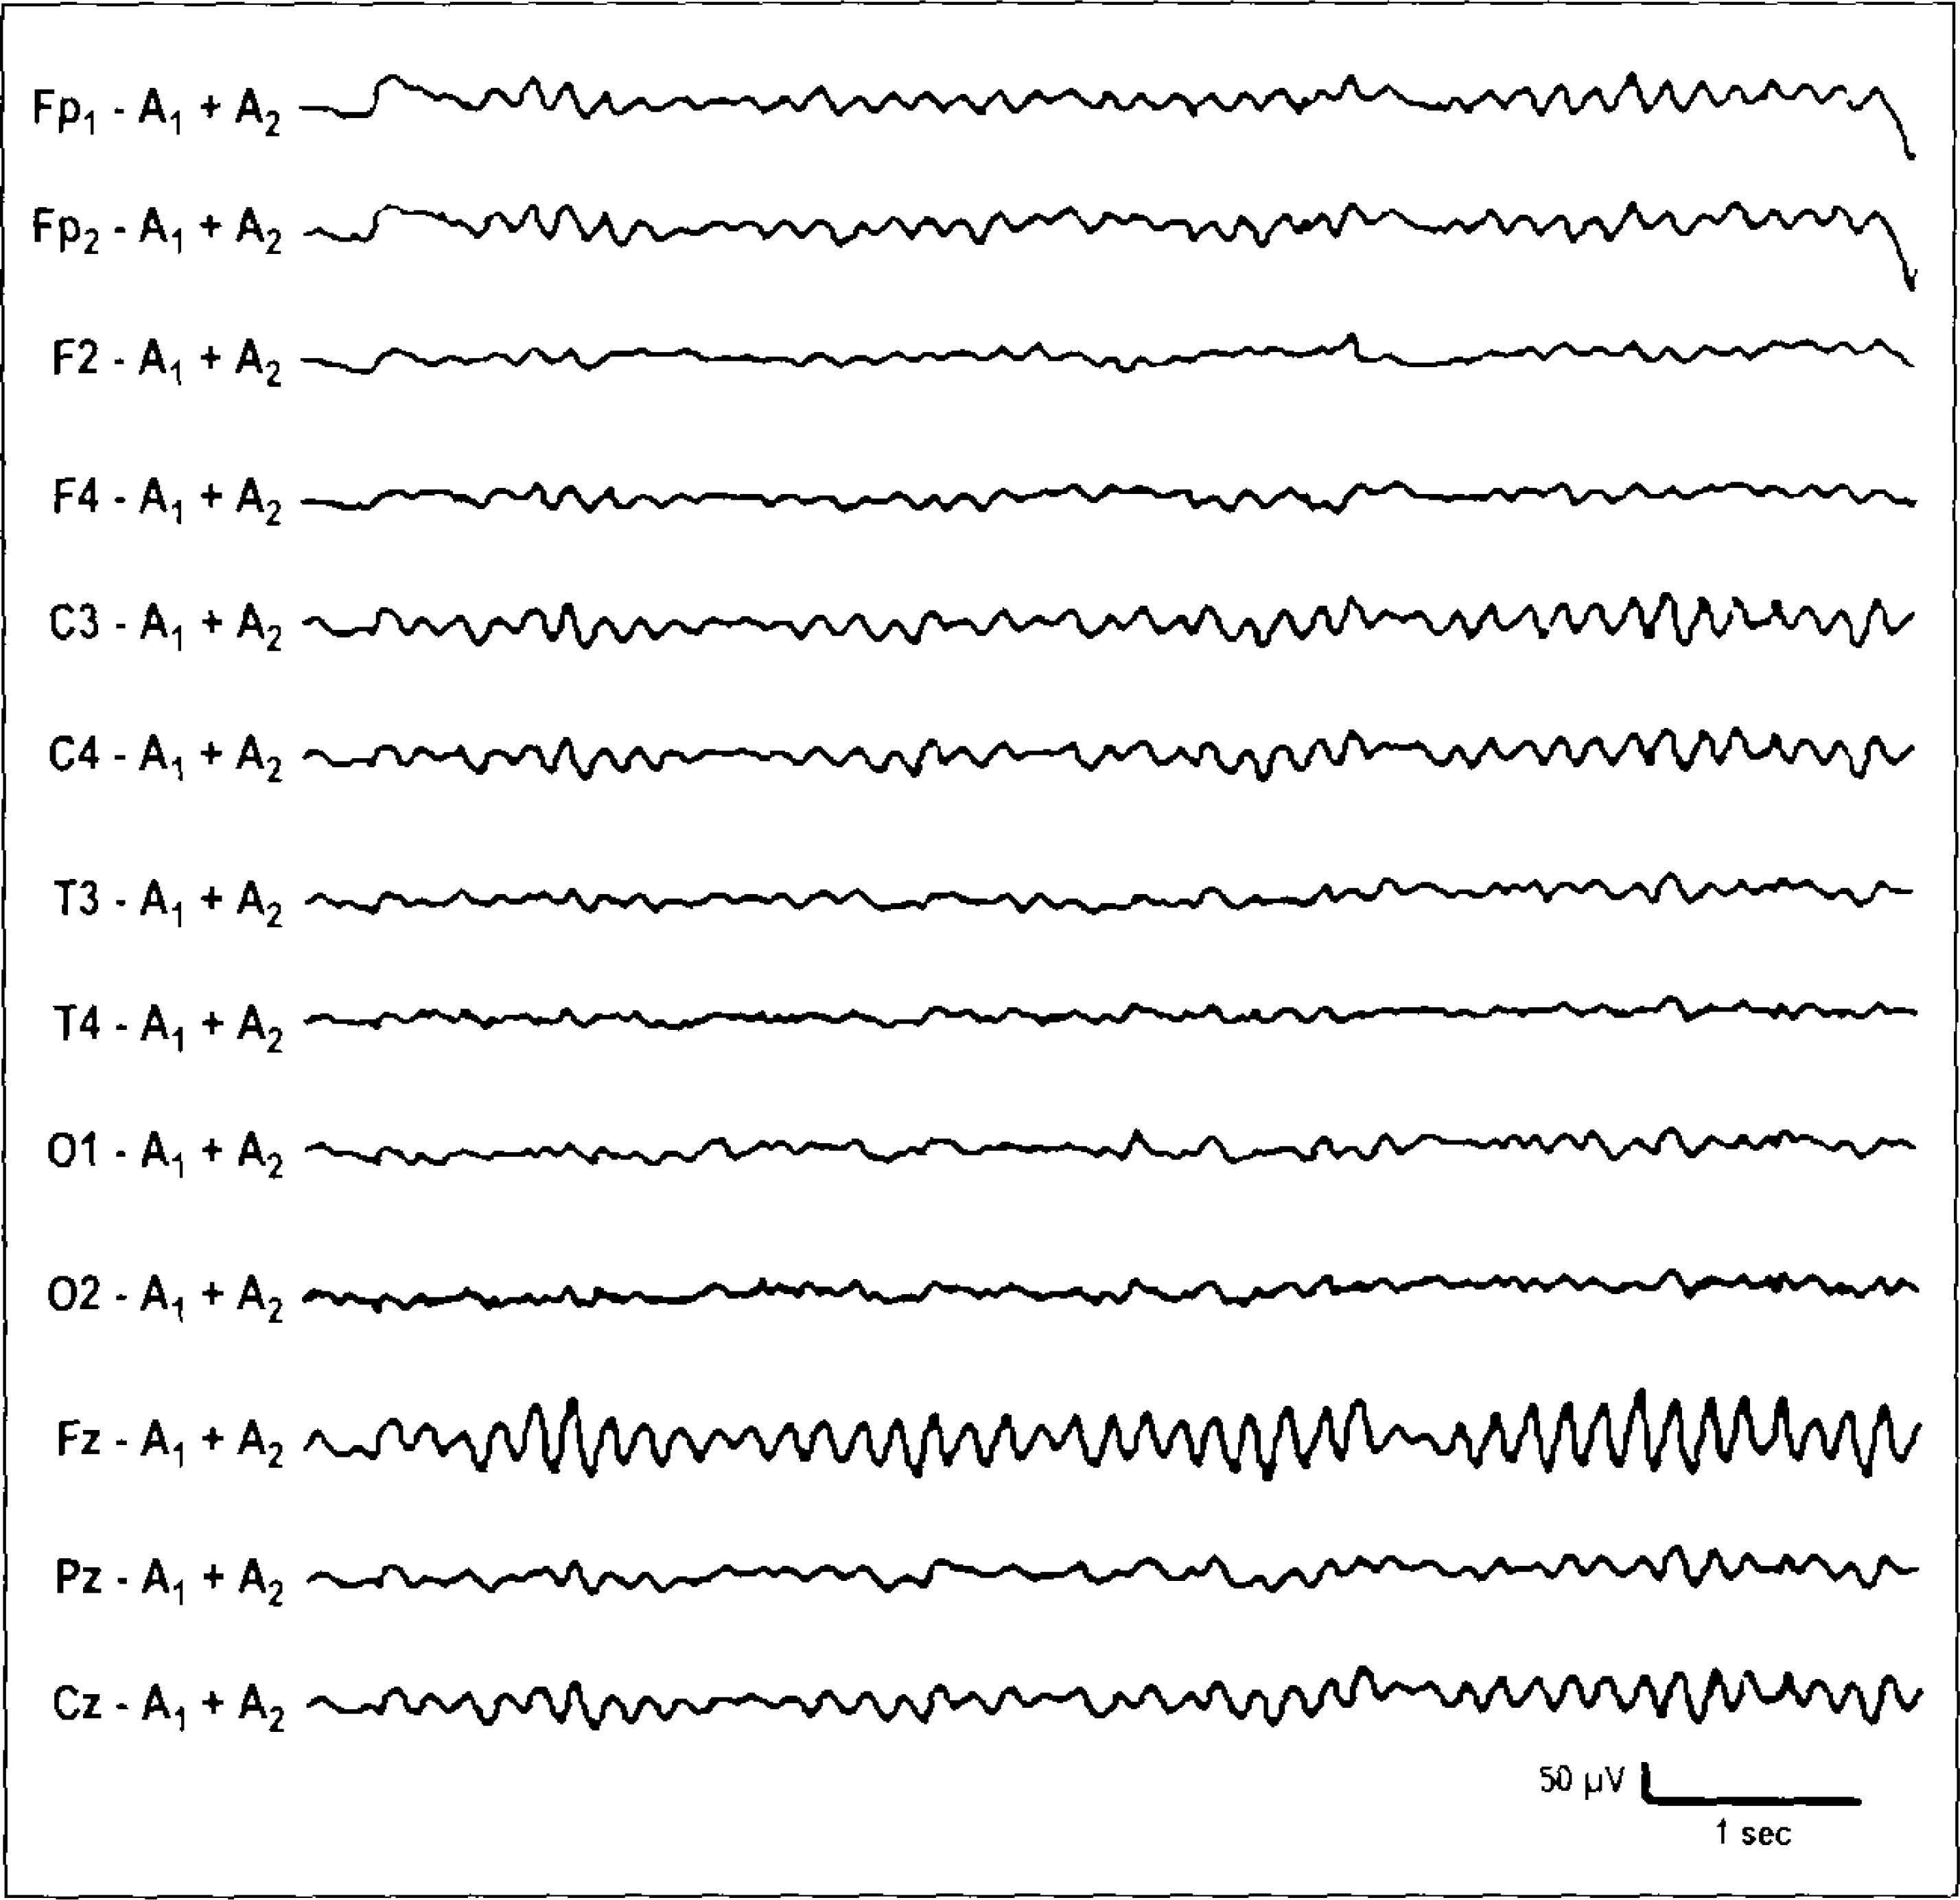
Representative EEG tracings of Fm theta observed in a male subject. The subject showed rhythmic theta activities at midline Fz and Cz leads during the video game task in the preliminary EEG test. Note that the montage of EEG sites in the preliminary tests is different from that in digital recording for ERP and ERD/ERS analyses.
Experimental tasks and procedure
To elicit Fm theta, subjects played a videogame while simultaneously being presented with “passive” auditory oddball stimuli that required no response. Subjects were instructed to ignore the auditory stimuli and concentrate on the videogame.
Videogame
Subjects played Tetris® on a video screen that subtended a visual angle of 5.4° × 5.4°. Tetris is a puzzle game where seven different types of blocks continuously fall from above and the player must arrange them to make horizontal rows of bricks. Completing any row causes those blocks to disappear and the rest above move downwards. The blocks above gradually fall faster, and the game is over when the screen fills up and blocks can no longer fall from the top. Tetris requires the subjects to maintain a high level of sustained attention and concentration. Subjects practiced the Tetris game for 5 minutes prior to the start of the dual-task condition.
Auditory oddball stimuli
The auditory stimuli consisted of tones (sine waves) with a duration of 80 ms, including 10 ms rise and fall times. The frequency of the standard tones (
EEG recording
EEG was recorded using Ag/AgCl disk electrodes placed at 10 scalp sites (Fp1, Fp2, Fpz, F3, F4, Fz, C3, C4, Cz and Pz of the International 10/20 System). Recording electrodes were referenced to the nose. In addition, a ground electrode was placed at the forehead. A bipolar electrode pair was placed above and over the outer canthus of the right eye to record the electrooculogram (EOG). Impedances of all electrodes were maintained below 5 K. EEG data was recorded and analyzed using a Brain Atlas 2 and Ceegraph system (Bio-logic). During the task, the EEG and EOG were continuously digitized at 250 Hz per channel and stored on a computer disk using a 0.1–100 Hz on-line filter. The EEG was filtered off-line with a bandpass of 0.1–35 Hz (−3dB points; 6 dB/octave). The digital event markers for the deviants or standards were synchronized to the stimulus onsets and were stored. EEG epochs of 1024 ms duration (256 points) (100 ms prestimulus baseline, 924 ms poststimulus) associated with each stimulus type were excised from the continuous records. The root mean square voltage of the EOG channel was computed to identify and discard epochs associated with eye movements and blink artifacts. All single trial epochs were baseline corrected prior to subsequent processing. Epochs contaminated by EOGs, blinks, or muscle artifacts exceeding an artifact rejection threshold of ±80 μV at any electrode were omitted from the analysis. The experimental task was continued until 400 clean deviant epochs were obtained.
Criteria of Fm theta
The criteria for defining Fm theta were as follows: (1) 5.5–7.5 Hz rhythmical sinusoidal configuration with a maximum at Fz or Cz, (2) markedly higher amplitudes as compared with background activity, and (3) duration exceeding 1 s. 1,2
EEG analysis
Artifact-free epochs were segregated according to the two types of auditory stimuli. Each raw EEG epoch was visually screened, and epochs where Fm theta was observed throughout, or where no Fm theta appeared at all, were identified. For each of the resulting four types of epochs, (standards and deviants with and without Fm theta), ERD/ERS and ERP were constructed. Fifty artifact-free epochs were analyzed for each type of epoch.
ERP
After filtering off-line with a bandpass of 0.1–35 Hz, the EEG epochs of standards and deviants both with and without Fm theta were averaged for each subject individually, and then across all subjects to compute group-average ERPs.
ERD/ERS (FFT)
The EEG data were filtered with FFT bandpass filtering so that the theta (5.5–7.5 Hz) band activity was extracted.
The calculation of the variance by the intertrial variance method is as follows:
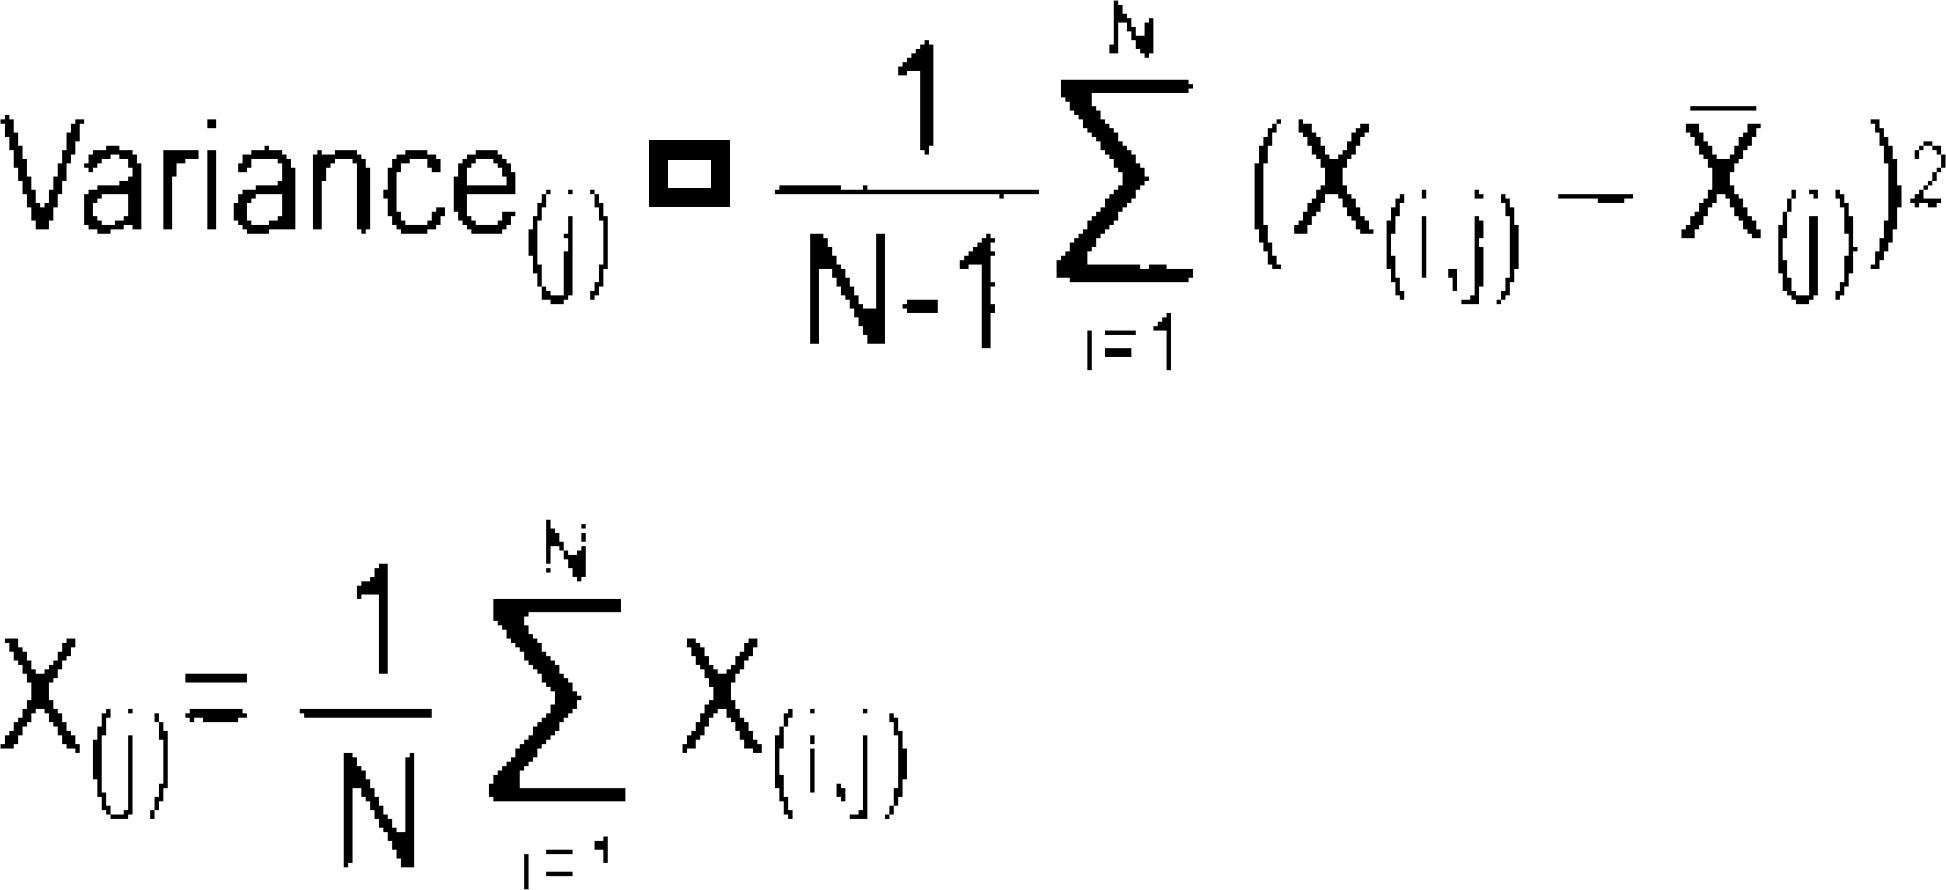
Where N = total number of trials, X(i, j)
 j-th sample of the i-th trial of the bandpass filtered data and
  mean of the data at the j-th sample (averaged over all bandpass filtered trials).
24
In power methods, phase-locked activity is not excluded, because
mean of the data at the j-th sample (averaged over all bandpass filtered trials).
24
In power methods, phase-locked activity is not excluded, because  is not subtracted from X(i, j). The ERD was quantified as the percentage change of the intertrial variance at each sample point relative to the average intertrial variance in the 100 ms prestimulus baseline as a reference interval. Individual subject's ERD/ERS for each condition was calculated using intertrial methods, and then low-pass filtered at 4 Hz to obtain reliable power estimate. Individual subject's ERD/ERS was averaged across all subjects to compute a group-average ERD/ERS.
ERD/ERS of the slow alpha (8–10 Hz) and the fast alpha (10–12 Hz) band were also constructed using epochs without Fm theta.
ERD/ERS (WT)
We modified the procedures of Tallon-Baudry et al 31 and Mazaheri et al. 29 The time-varying energy in the single trial was calculated by convolving the recorded activity with complex Morlet's wavelets that have a Gaussian shape both in the time domain and in the frequency domain around its central, and then varied in width and frequency to obtain the energy at different frequencies in the spectrogram. Since the Morlet's wavelet is a modulated Gaussian curve, time points at the beginning and end of the wavelet window would show an attenuation of the frequencies. 23 We subjected the entire 1024 ms epochs to the WT, but examined only the time point interval from the stimulus onset to 800 ms.
The time-varying energy of the signal in a frequency band is the square norm of the result of the convolution of a complex wavelet with the signal. The time resolution of a WT is better at high frequencies whereas its frequencies resolution is better at lower frequencies. Analyses of the resultant spectrogram were obtained by calculating time-varying energy at 119 different frequencies from 2 to 35.71 Hz (Figure 2). After averaging the time-varying energy of each single trial in the individual, ERD/ERS was assessed in terms of percentage change scores from the mean energy during the reference period (0–100 ms from the stimulus onset). ERD/ERS of the theta band were obtained by averaging the time-varying energy change (%) at 5.00, 5.56, 5.95, 6.58, 6,94, 7.35 Hz.
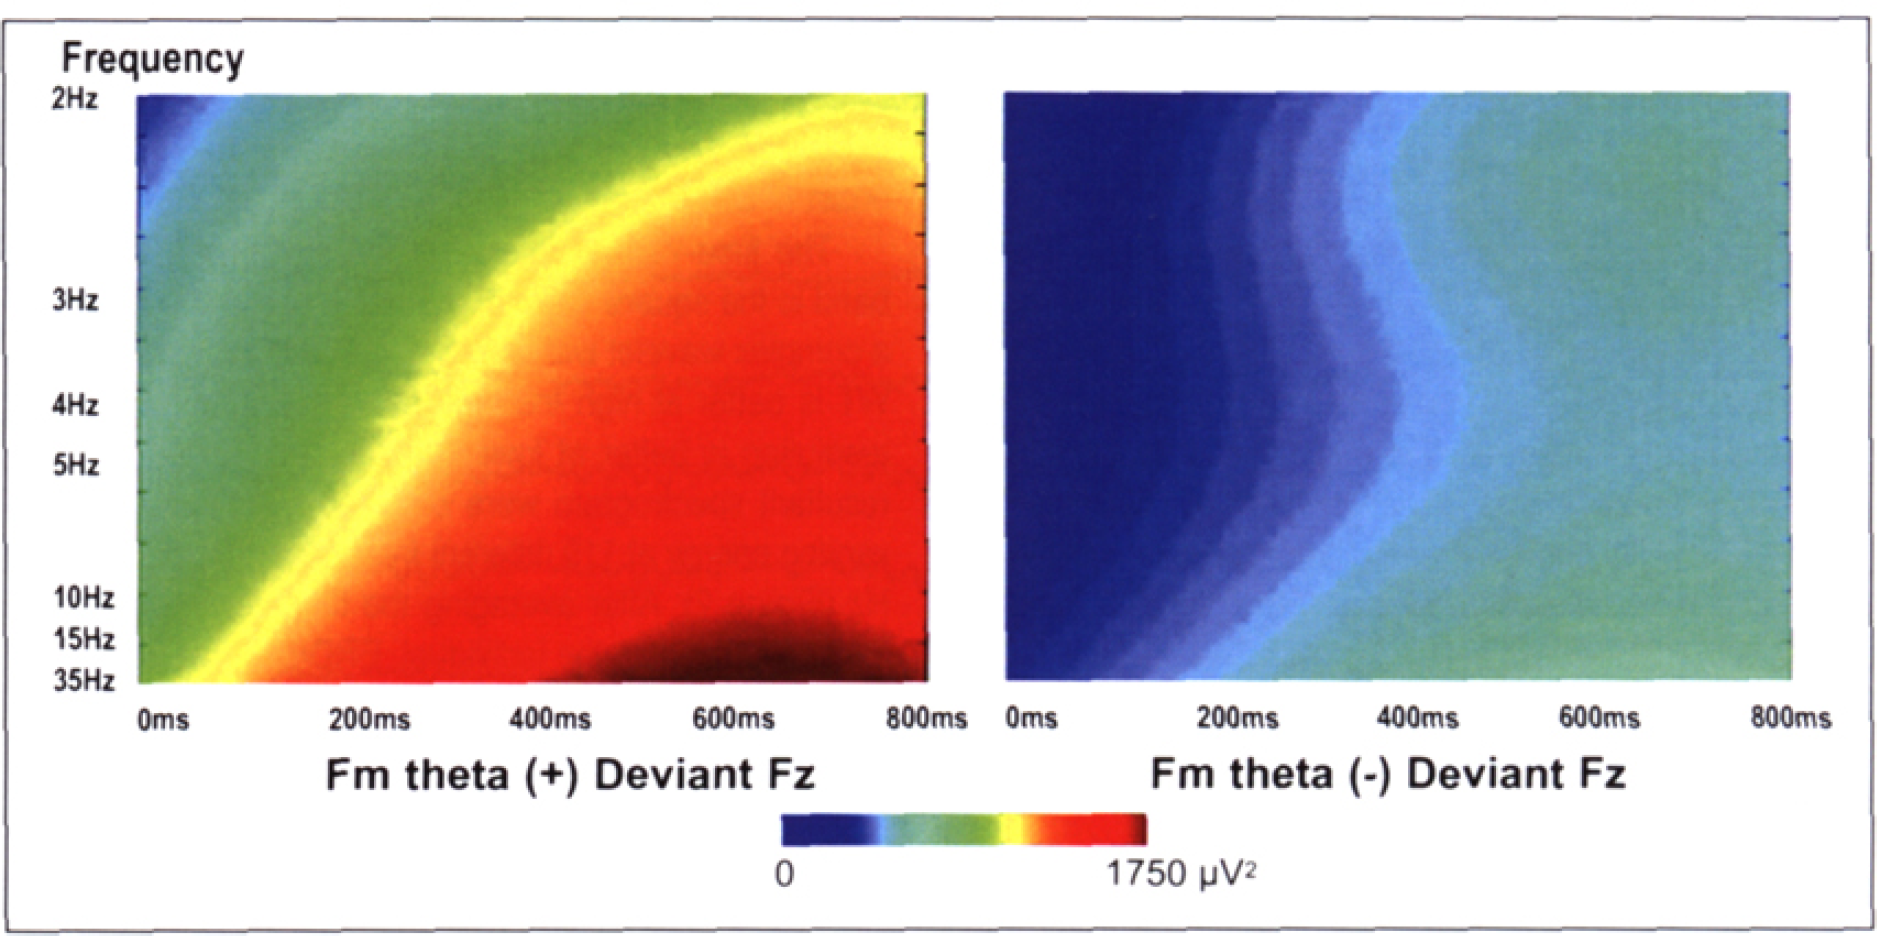
Examples of WT spectrogram (deviants, Fz). Each of the wavelet estimations of the time changes in energy at a particular frequency, averaged across single trials, grand averaged across subjects, was presented with x-axis for time, y-axis for frequency (not yet baseline-subtracted or converted on the percentage of the average of baseline) and the stimulus onset indicated at 0ms. Energy values are coded on a color scale. Note that the time resolution of a WT is better at high frequencies whereas the frequencies resolution is better at lower frequencies.
According to the method of Mazaheri and Picton, 29 we did not subtract the spectrogram of averaged ERP (phase-locked activity) from the averaged spectrogram from the individual EEG trial. The usage of the subtraction method to remove phase-locked evoked activity does not fully remove the power of the ERP from spectrum, and the validity of the subtraction method has not been established. 29,34,35
Statistical analysis
ERD/ERS of the theta band at Fz and Cz, where the Fm theta is usually the greatest, was analyzed by means of an analysis of variance (ANOVA) with repeated measures. For FFT data, ANOVA was conducted using five time-windows with time duration of 200 ms; 1000 ms (prestimulus 100 ms and poststimulus 900 ms) was separated down to 200 ms. For WT data, 800 ms (poststimulus 800 ms) was separated down to eight windows of 100 ms. ERD/ERS data were averaged over time-window for each electrode and each type of epoch within an individual subject. 13,18,19,23 There were four within-subject factors, Electrode (Fz, Cz), Stimulus (standard, deviant), Fm-theta (epochs with or without Fm theta), and Time (five time-windows). Reduced degrees of freedom (Greenhouse-Geisser) were used when appropriate to counter violations of the sphericity assumption underlying ANOVA with repeated measures (epsilon values are provided). Alpha values of 0.05 were considered significant. All statistics were performed using SPSS for Windows (SPSS, Chicago, IL).
RESULTS
ERP
On the waveforms for the standards and deviants, during the periods with or without the appearance of Fm theta (Figure 3), ERP components, N100, P200, and N200, were clearly identified for both the standards and deviants. No prominent deflections of P3a or P3b were observed. It might be because the oddball task was completely passive and the auditory stimuli were not distractive or novel.
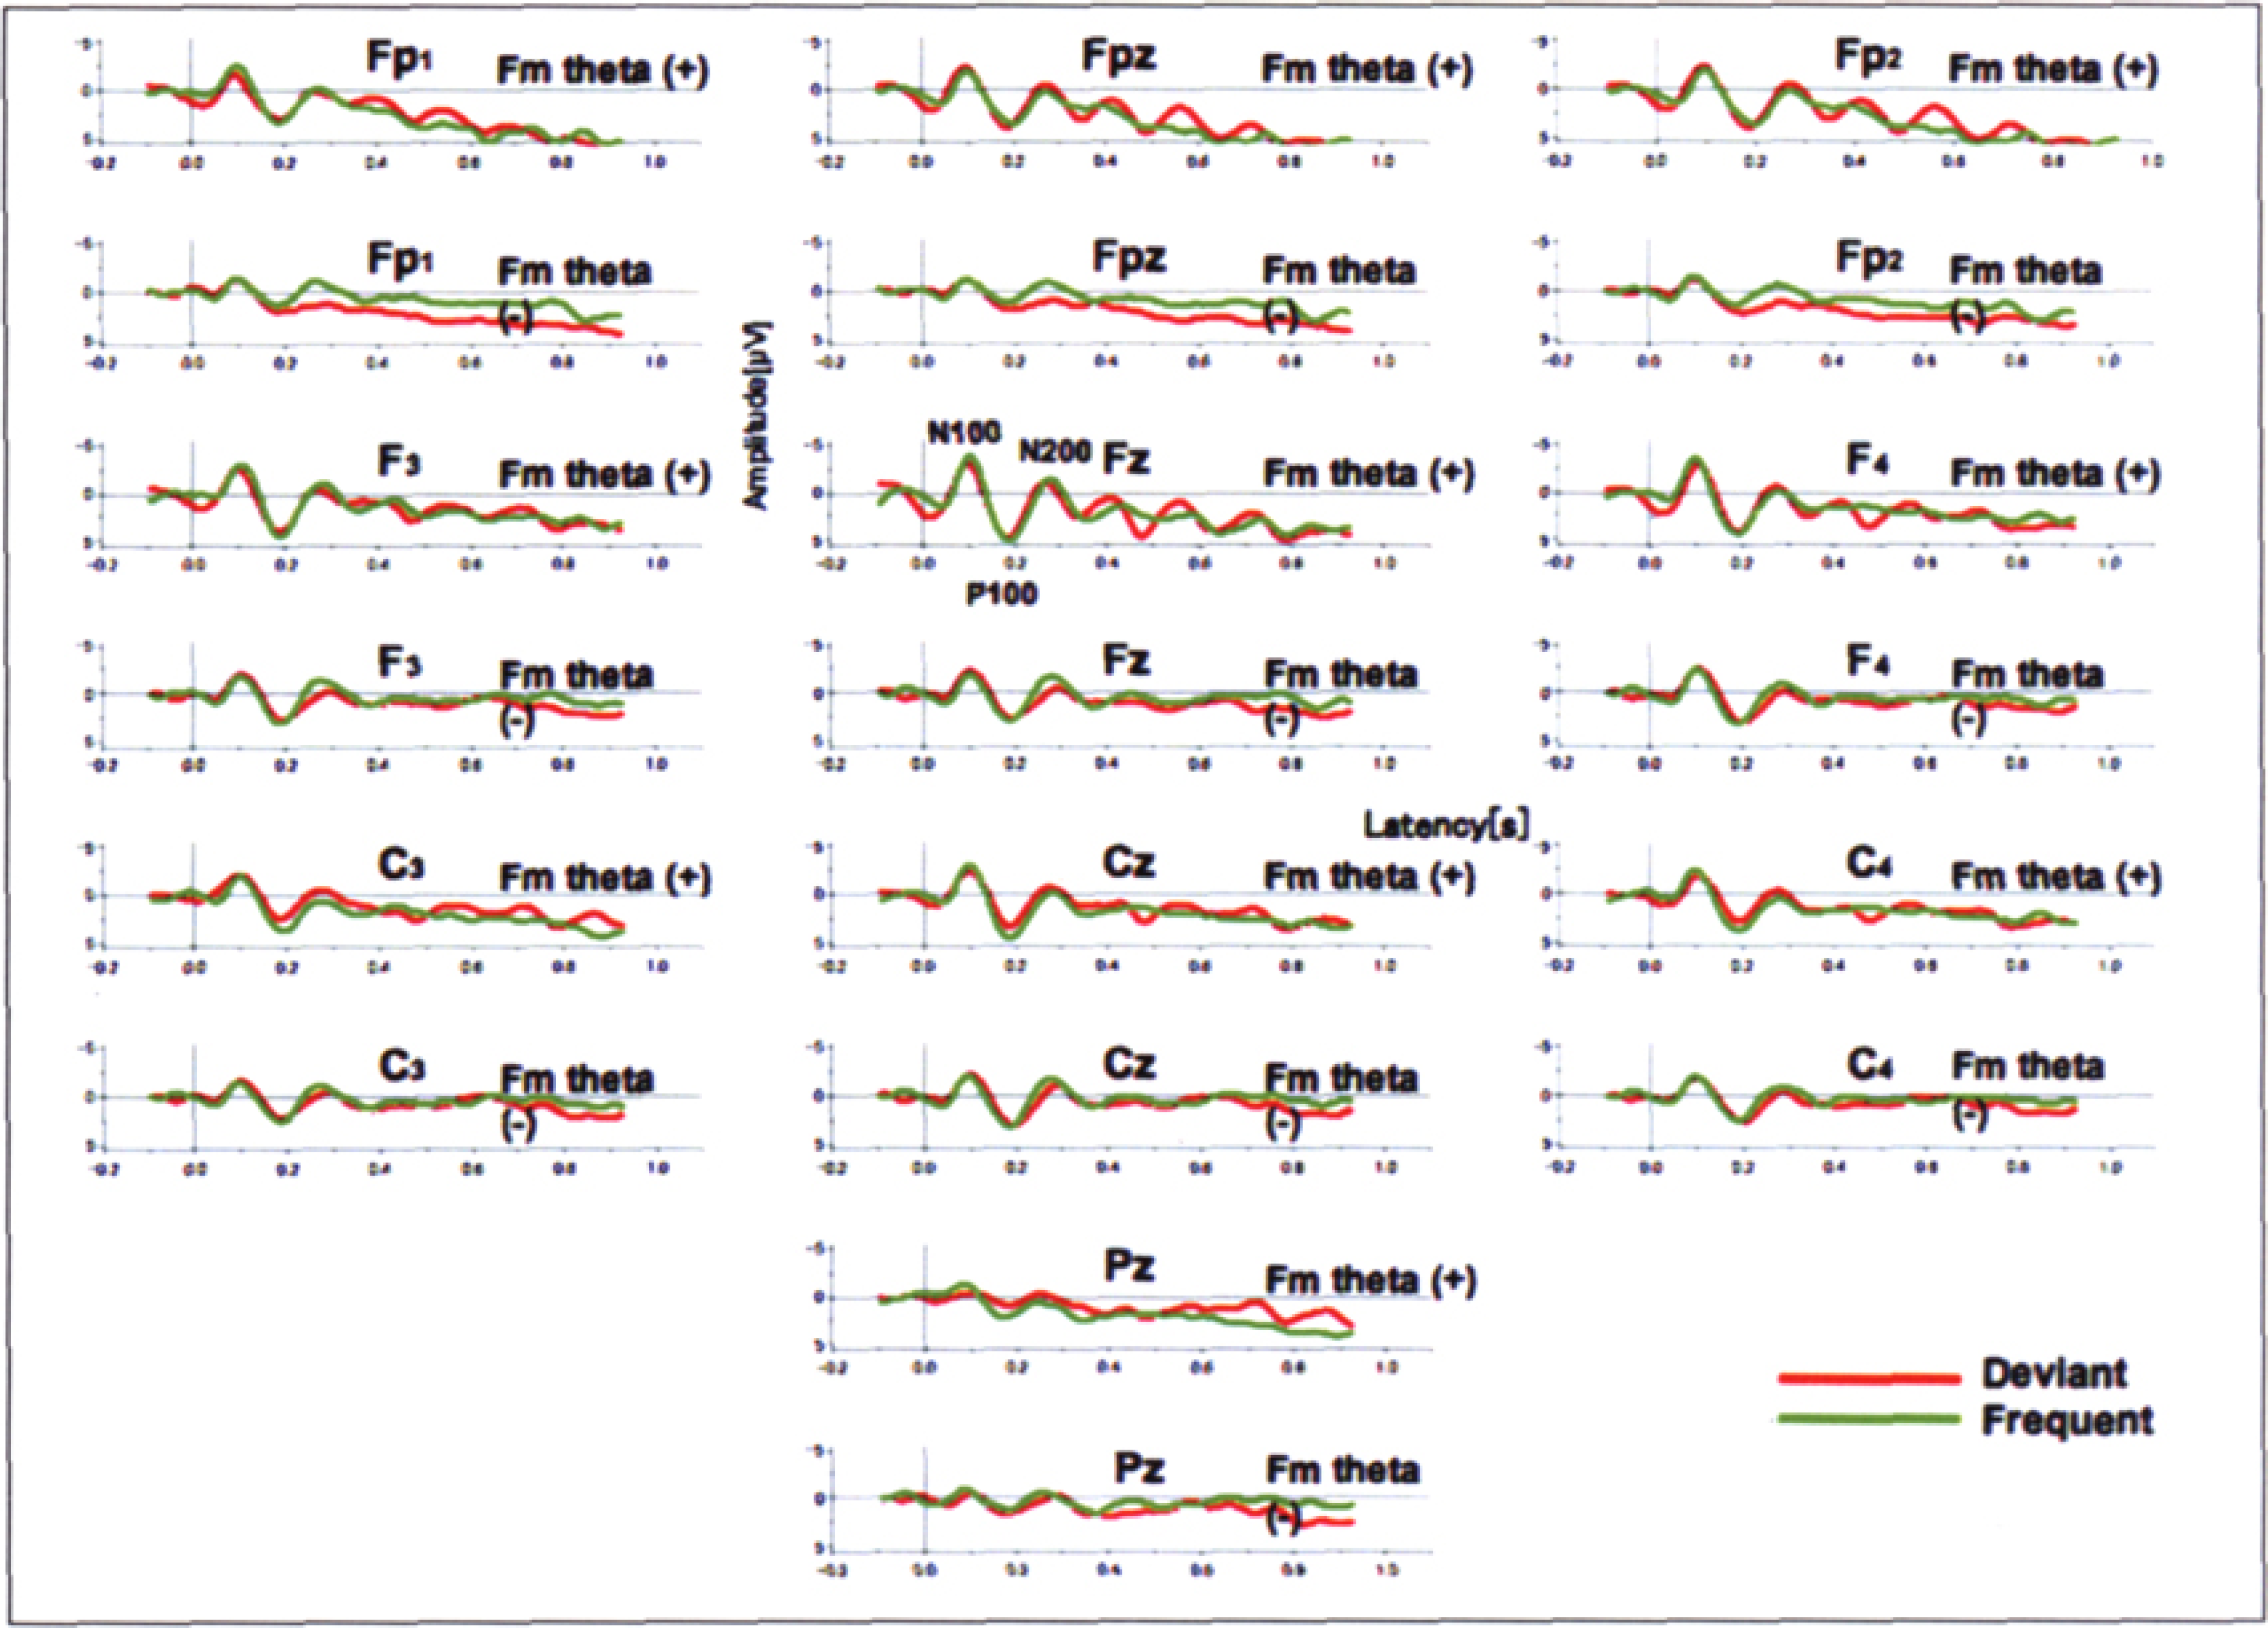
Grand average of ERP waveforms. ERP components, N100, P200, and N200 were apparently recognized for both deviants and standards.
ERD/ERS (FFT)
During the periods with Fm theta, ERD of the theta band was clearly visible, peaking approximately 400 ms after the onset of stimulus with a deflection decrease of more than 100 % from the baseline for both the standards and deviants (Figure 4). During the periods without Fm theta, however, no apparent ERD/ERS was recognized for either the standards or deviants (Figure 5). ANOVA revealed significant effects of Stimulus [F (1,7) = 10.220, p
0.015], FM-theta [F (1,7) 6. 418, p = 0.039] and Time [F (4,28) = 6.914, p = 0.030, ɛ = 0.271]. ANOVA also revealed significant interactions of Fm-theta × Time [F (4,28) 10.332, p = 0.008, ɛ = 0.319], which indicated that the ERD with the appearance of Fm theta was more prominent than that during the periods without Fm theta. The interaction of Fm-theta × Time was confirmed by the post-hoc test results that during the period of 100–500 ms ERD with Fm theta were more prominent than that without Fm theta (100–300ms; p = 0.012, 300–500ms; p = 0.022). No clear ERS/ERD of the alpha band was observed (not shown).
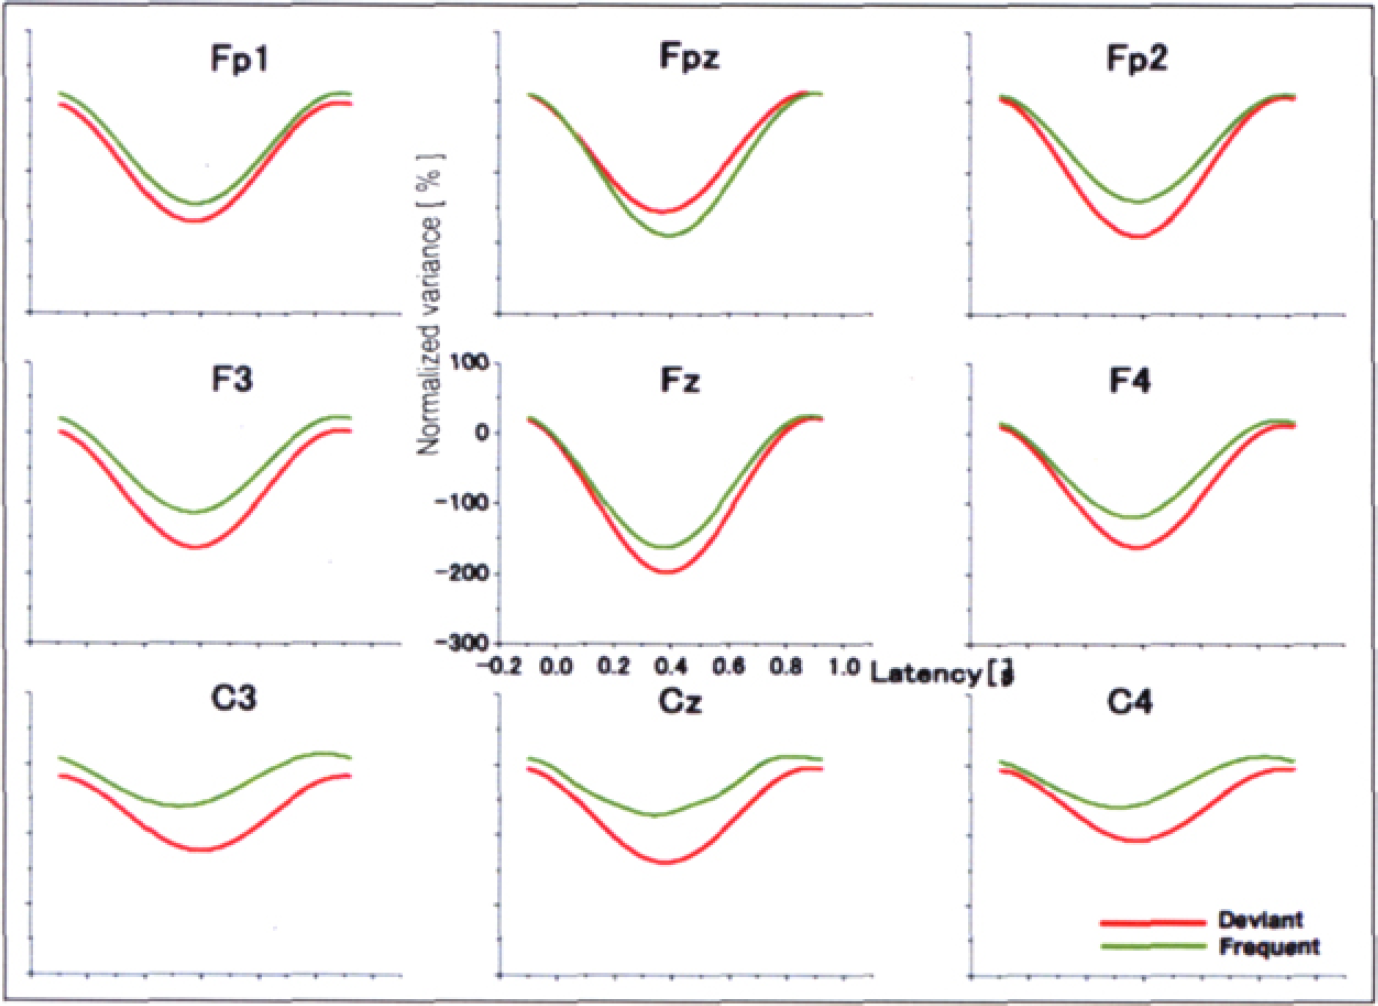
Grand averaged theta ERD during the periods with the appearance of Fm theta (FFT). During the periods when Fm theta appeared, apparent theta ERD was observed at Fz and Cz.
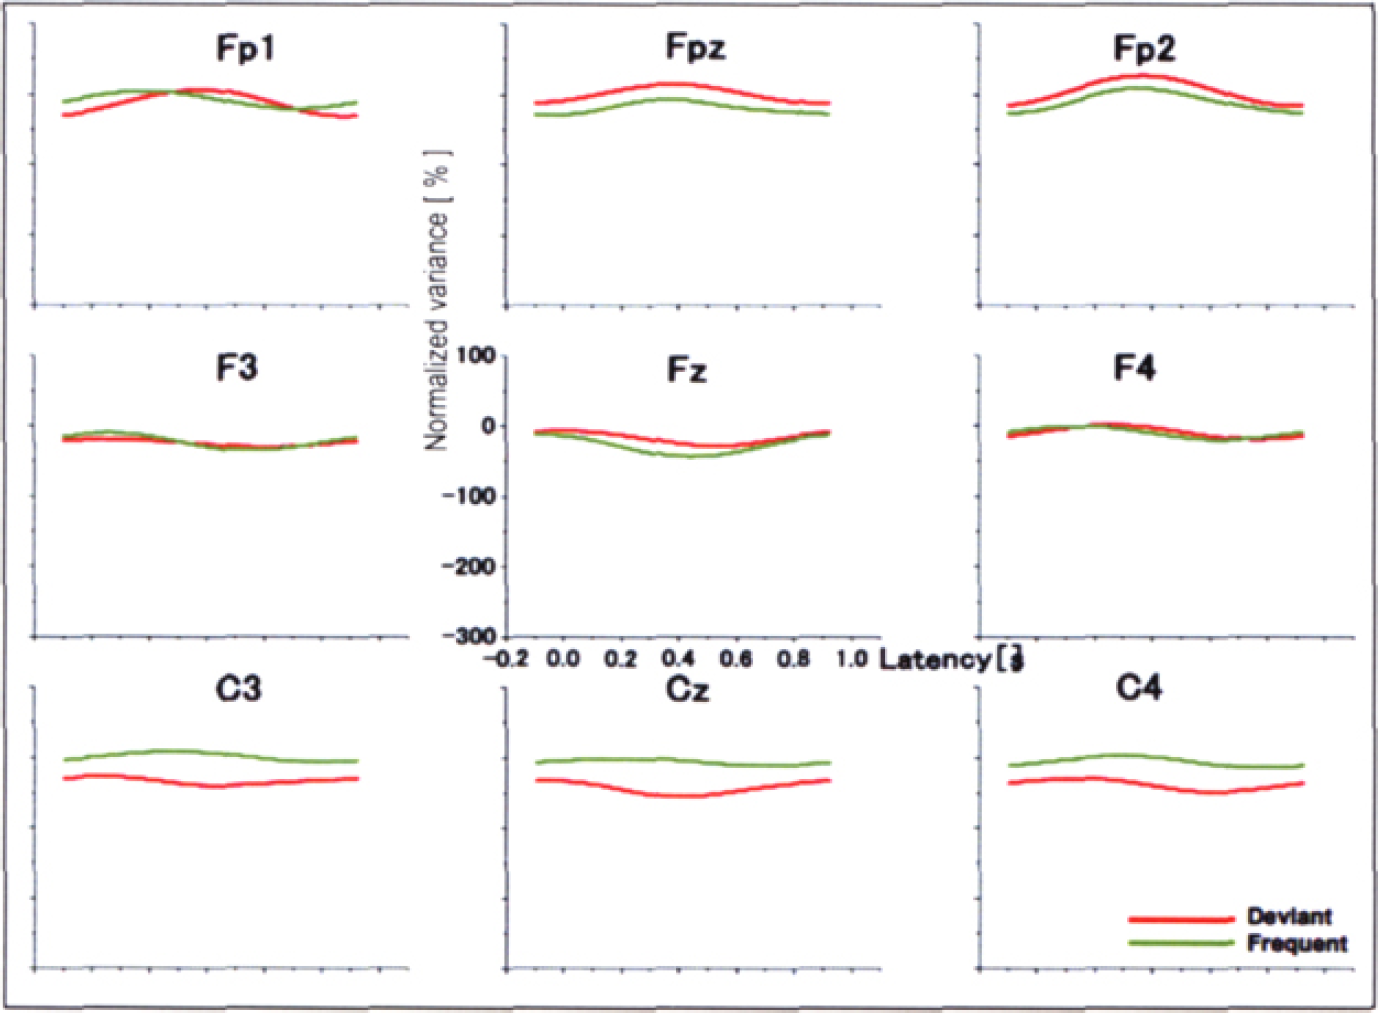
Grand averaged theta ERD during the periods without the appearance of Fm theta (FFT). During the periods without Fm theta, no apparent ERD/ERS was recognized for either the standards or deviants.
ERD/ERS (WT)
ERD and ERS of theta band indicated biphasic or triphasic deflections during the wavelet window for both the standards and deviants. As in the FFT data, the ERD was seen 400–600 ms after the onset of stimulus, whereas ERD was preceded by ERS at 160–200 ms both during the periods with and without Fm theta. Furthermore, ERD was followed by ERS at 600–800 ms during the periods without Fm theta. During the periods with Fm theta, however, no apparent ERS following ERD was seen for either the standards or deviants (Figure 6). ANOVA revealed significant effects of Fm-theta [F (1,7) = 31. 649, p
0.001] and Time [F (7,49) = 9.210, p = 0.001, ɛ 0.345]. ANOVA also revealed significant interactions of, Fm-theta × Time [F (4,28) = 6.857, p = 0.013, ɛ 0.243]. Post-hoc test revealed that ERS with Fm theta was more prominent than that with Fm theta during the period of 600–800 ms (500–600 ms, p = 0.001; 600–700 ms, p
0.003; 700–800 ms, p = 0.002).
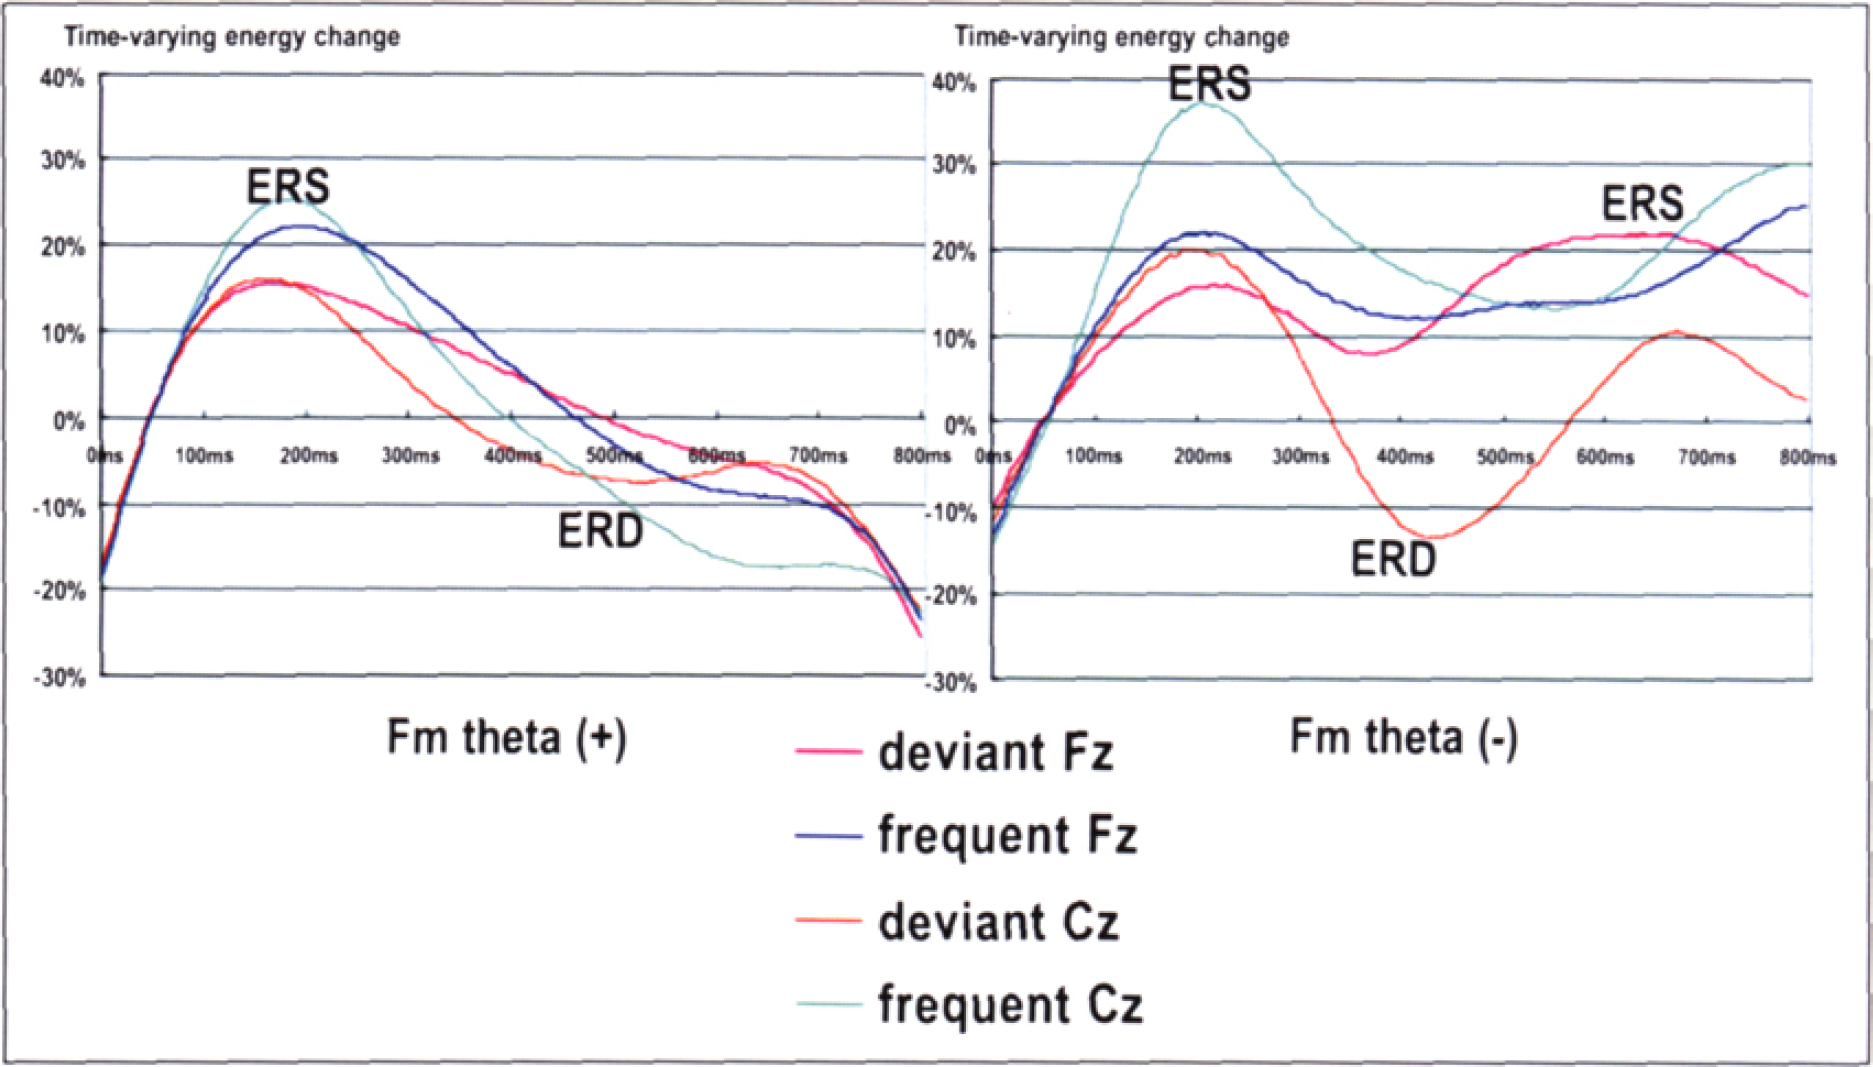
Grand averaged theta ERD/ERS (WT). ERD and ERS of theta band indicated diphasic or triphasic deflections during the wavelet window for both the standards and deviants. ERD was seen 400–600 ms after the onset of stimulus, whereas ERD was preceded by ERS at 160–200 ms. ERD was followed by ERS at 600–800 ms during the periods without Fm theta. However, during the periods with Fm theta, no apparent ERS following ERD was seen.
DISCUSSION
We found that during periods with clear Fm theta, ERD of the theta band was seen at the front midline region. These findings suggest that Fm theta is desynchronized in relation to additional external stimuli independent of the task evoking the Fm theta.
The midline subcortical structures, including the thalamus and hippocampus, may play important roles in controlling interhemispheric synchronization of Fm theta. 36 It was also hypothesized that the appearance of Fm theta during consecutive mental tasks reflects alternative activities of the prefrontal-medial superficial cortex and ACC in approximately a 40 to 120 degree phase shift during one Fm theta. 37 Alternative fire of the two regions may be operated by subcortical structures such as the thalamus, and may be closely related to the ongoing cortico-ACC feedback required for the recruitment of neuronal subpopulations into a coherent distribution network. The control of cortico-ACC activity may contribute to suppressing unnecessary regions and activating necessary ones in performing the engaging task. 37 Such a “positive suppression” control probably results in a blood flow increase in the prefrontal medial cortex including ACC 38,39 and in generating Fm theta. 37
In the FFT data, the ERD with the appearance of Fm theta was more prominent than that during the periods without Fm theta. The ERD of Fm theta might be revealing the mechanism that processes external auditory stimuli automatically and prevents the attentional resources from being unnecessarily allocated to the auditory stimuli. More amplified ERD during the period with Fm theta compared to that without Fm theta might reflect more efficient “positive suppression” by cortico-ACC activity. However, although “Tetris” requires a certain amount of sustained attention, there was no direct control on the “amount” of attention allocated to the task. A task with established different levels of difficulty should be a better method to control for allocation of resources.
Electrophysiological studies of working memory indicate that persistent firing of cells underlies working memory. 40 The fact that theta is induced by working memory tasks suggests that this firing may have an oscillatory character. 23 Jensen and Lisman 41,42 proposed an oscillatory model that similar phase coding may be important in multi-item working memory with different memory items active at different phases of the theta cycle. Bastiaansen and Hagoort 43 supported the hypothesis that theta activity plays a functional role in cell assembly formation, a process which may constitute the neural basis of memory formation and retrieval. Another possible function of theta is to rapidly encode information directly into long-term memory by synaptic modification 44,45 or to synchronize different regions of the cortex that participate in the task. 46 On the other hand, passive oddball stimuli used here are generally used to elicit a component of ERPs, Mismatch Negativity (MMN). Näätänen 47 has proposed a model for the role of automaticity and attention in the processing of acoustic stimuli in which all auditory sensory information produced by preconscious processing is stored for a temporary period in the form of precise neuronal representations of sensory memory (memory trace). Another possible function of Fm theta induced by Tetris, and desynchronized in relation to oddball stimuli, may reflect information processing modeled by the multi-item working memory task required for executing Tetris and the simultaneous auditory processing using memory trace described by Näätänen's model.
In the WT data, ERD was followed by ERS during the periods without Fm theta. However, during the periods with Fm theta, no apparent ERS following ERD was noted. ERS during the periods without Fm theta might indicate the further processing of auditory information free from the processing reflected by Fm theta.
To our knowledge, there have been a few reports regarding Fm theta in clinical populations accompanied by cognitive deficits such as schizophrenia, depression, or ADD/ADHD (attention deficit disorder/attention deficit hyperactivity disorder). Fm theta has been reported to be closely related to personality and anxiety level. Fm theta was likely to appear more markedly in those subjects who were more extraverted, less neurotic and less anxious. A subject with low MAO (monoamine oxidase) activity will show more Fm theta and is likely to be extraverted. Anxiety in subjects with Fm theta may be mainly correlated with 5-HT1A (5-hydoxytryptamine) receptor function. On the other hand, the PANSS (positive and negative syndrome scale) scores of Fm theta group of schizophrenic patients were higher than those of non-Fm theta group. Plasma levels of dopamine and homovanillic acid were lower and prolactin level was lower in Fm theta group compared with those in non-Fm theta group. Furthermore, patients with quantitative neurometric EEG features of the frontal theta excess responded to stimulants despite their classification of ADD or affective disorder. Summarizing there findings, Fm theta in healthy subjects may reflect expeditious processing, which is interfered by anxiety, however, Fm theta in clinical populations may stem from their pathological states or low vigilance. Further studies in such clinical populations will be required to elucidate mechanisms underlying Fm theta under concentration for a mental task and the frontal theta activity in a resting state.
Finally, we should address the limitations of the present study. Firstly, we could not recognize the difference of the ERD/ERS between the deviant and frequent stimuli. Even though the passive auditory oddball stimuli was preconscious, the deviants, which require the subjects to update their memory buffer according to the present context instated by the standards, might demand attentional resources to a greater extent than the standards. Modification of the experimental designs or further analyses for other frequency bands such as gamma or alpha might be needed. Secondly, the findings of the FFT data were not completely compatible with the WT data. Advantages and disadvantages of the both methods should be assessed minutely for the study of Fm theta. Thirdly, detailed analyses other than ERD/ERS, such as the peak range of Fm theta within and across individuals, the differences of cognitive processing reflected by the lower or upper range of theta, or correlation between ERD/ERS and the task performances or duration of Fm theta, would be needed in the future.
Footnotes
ACKNOWLEDGMENTS
This research was supported by grants from the Research Support Foundation of the Juntendo Institute of Mental Health and a grant from the Support Activity of the Japan Keirin Foundation.