
Abstract
The stability of the steady-state visual evoked potentials (SSVEPs) across trials and subjects makes them a suitable tool for the investigation of the visual system. The reproducible pattern of the frequency characteristics of SSVEPs shows a global amplitude maximum around 10 Hz and additional local maxima around 20 and 40 Hz, which have been argued to represent resonant behavior of damped neuronal oscillators.
Simultaneous electroencephalogram/functional magnetic resonance imaging (EEG/fMRI) measurement allows testing of the resonance hypothesis about the frequency-selective increases in SSVEP amplitudes in human subjects, because the total synaptic activity that is represented in the fMRI-Blood Oxygen Level Dependent (fMRI-BOLD) response would not increase but get synchronized at the resonance frequency. For this purpose, 40 healthy volunteers were visually stimulated with flickering light at systematically varying frequencies between 6 and 46 Hz, and the correlations between SSVEP amplitudes and the BOLD responses were computed.
The SSVEP frequency characteristics of all subjects showed 3 frequency ranges with an amplitude maximum in each of them, which roughly correspond to alpha, beta and gamma bands of the EEG. The correlation maps between BOLD responses and SSVEP amplitude changes across the different stimulation frequencies within each frequency band showed no significant correlation in the alpha range, while significant correlations were obtained in the primary visual area for the beta and gamma bands.
This non-linear relationship between the surface recorded SSVEP amplitudes and the BOLD responses of the visual cortex at stimulation frequencies around the alpha band supports the view that a resonance at the tuning frequency of the thalamo-cortical alpha oscillator in the visual system is responsible for the global amplitude maximum of the SSVEP around 10 Hz.
Information gained from the SSVEP/fMRI analyses in the present study might be extrapolated to the EEG/fMRI analysis of the transient event-related potentials (ERPs) in terms of expecting more reliable and consistent correlations between EEG and fMRI responses, when the analyses are carried out on evoked or induced oscillations (spectral perturbations) in separate frequency bands instead of the time-domain ERP peaks.
Keywords
INTRODUCTION
Although functional neuroimaging technologies such as PET or fMRI have made it possible to localize the brain activations with a high precision in the 3 dimensional space, electroencephalogram (EEG) as a non-invasive measurement technique of brain electrical activity is still one of the important tools for investigating human brain function under physiological and pathological conditions. 1 Beyond the easy and comfortable application using inexpensive equipment, the continuing importance of EEG based measurements depends mainly on the high temporal resolution of the EEG signal in the millisecond range, while the hemodynamic or metabolic activities measured with fMRI and PET suffer from a poor temporal resolution due to the slower temporal dynamics of the vascular and metabolic responses, which indirectly reflect neuronal activity changes. 2
In fact, EEG is also an indirect signal of the cortical neuronal activity, because it represents the spatial sum of the post-synaptic potentials generated on the cortical pyramidal cells. Volume conduction in the brain tissue and heterogeneous electrical conductances of the tissues between the EEG generators and the scalp lead further to blurring of the signal, which makes it almost impossible to directly relate the EEG signal with the neuronal activity within the cortex. On the other hand, the spatial summation of the post-synaptic activity in the brain volume-conductor that builds the biophysical basis of the measurement of neuro-electric signals from the scalp, makes EEG unique for representing the local and large-scale synchronizations within and among neuronal groups. 3 In other words, the EEG amplitude represents the level of neuronal synchronicity but not the level of the non-synchronized neuronal activity. 4 Such synchronization patterns in the EEG can either be observed as transient waveforms such as epileptic spikes or in the form of spontaneous, evoked or induced rhythms in various frequency bands. 5,6
One of the synchronized states in the EEG that can be well-controlled by the external events is the steady-state evoked potential produced by trains of stimuli with an inter-stimulus interval (ISI) shorter than needed for the complete processing of a single stimulus. 7 While the EEG response to a single stimulus decays in hundreds of milliseconds, regular oscillatory responses are obtained by driving the brain with stimulus trains with shorter ISIs, which is also used to obtain the photic driving response in clinical EEG. 8 Such steady-state stimulation has been usually applied in the visual modality, and EEG oscillations at the stimulation frequency could be observed with flickering light up to 100 Hz frequency, when EEG segments were averaged phase-locked to the stimuli. 9 The spectral analysis of the averaged steady-state visual evoked potentials (SSVEP) reveals peaks mainly at the stimulation frequency and its harmonics.
The stability of the SSVEPs across trials and subjects makes them a suitable tool for the investigation of the visual system. Furthermore, the well-defined frequency spectra of the SSVEPs make them less prone to EEG artifacts, as they can be efficiently quantified by measuring the amplitudes of the spectral peaks at the stimulation frequency and its harmonics by excluding the effects of the artifacts occurring at other frequency ranges. Because of such properties some research groups developed SSVEP based techniques for measuring cognitive processes as well, 10 where the modulation of the amplitude or phase of the SSVEPs produced by repetitive stimuli in the background of the task-related event were used as measures of cognitive processes under study. 11,12
Studies measuring the SSVEPs with systematically varying flicker frequencies have shown that their amplitudes do not change uniformly or monotonously with changing stimulation frequencies. 7,9 The reproducible pattern of the frequency characteristics of SSVEPs shows a clear peak around 10 Hz and additional local maxima around 20,40 and 80 Hz. While these frequencies have been pragmatically used to obtain large SSVEP responses, 12 it is important to understand the neuronal mechanism lying behind this phenomenon to effectively use SSVEPs for testing sensory or cognitive functions.
Various studies have argued that the peaks in the SSVEP frequency characteristics represent resonant behavior of damped neuronal oscillators in the sensory system, 9,13 while for the scalp recorded data these peaks could also have other explanations such as different positions and orientations of the respective dipoles to the scalp surface. However, a study carried out in the cat brain with intracranial electrodes supported the resonance hypothesis by showing similar spectral peaks in the local field potentials (LFP) in visual sensory areas 17 and 18. 14 According to the authors, these spectral characteristics represent the behavior of strongly damped oscillators, which are tuned to different frequency bands and get entrained to variable extents at a large range of stimulation frequencies. Therefore, periodic activation with stimuli matching the frequency preference of these tuned oscillators is expected to reveal resonance phenomena which can be observed as global and local peaks in the SSVEP frequency characteristics.
The simultaneous EEG/fMRI measurement allows testing of the resonance hypothesis on the selective increases in SSVEP amplitudes at certain stimulation frequencies in human subjects. While EEG, as a measure sensitive to the synchronicity of neuronal activity, would catch the resonance phenomena at the tuning frequencies of the neuronal oscillators with large SSVEP amplitudes, blood oxygen level dependent (BOLD) signal of the fMRI, which depends on the metabolic demand of both synchronously and non-synchronously activated neuronal populations, 15 would change across different stimulation frequencies independent from the synchronization level. An inverse correlation between the EEG amplitude and BOLD response is already shown for spontaneous alpha rhythm that represents a synchronized state of cortical neuronal activity. 16 –18 Such frequency-dependent changes in the coupling between EEG and hemodynamic signal during steady-state visual responses may shed light on the neuronal mechanisms responsible for the SSVEP generation and visual perception.
This study aims to analyze the neuronal dynamics in the visual sensory system that lead to the SSVEPs by investigating their BOLD counterparts obtained through visual stimulation at various frequencies. 19 For this purpose, flickering light was used to stimulate visual areas at systematically varying frequencies between 6 and 46 Hz, and different levels of correlation were shown between SSVEP amplitudes and the BOLD responses for 3 different frequency ranges.
METHODS
Subjects
Steady-state visual responses were recorded simultaneously with EEG/fMRI from 40 healthy volunteers (20 female, 20 male; mean age 25.8 ± 3.7 years) without any sensory system related pathology and neuro-psychiatric history. The study procedure was approved by the local ethics committee of Istanbul University, Istanbul Faculty of Medicine. Every participant was informed about the procedure and signed informed consent before the experiment. The subjects were instructed to sleep at their habitual bedtime to prevent feeling sleepy during the experiment.
Experimental setup and stimulation
Photic stimulation was applied in the dimly illuminated MRI scanner room by using an electro-magnetically isolated light source consisting of four sets of light-emitting diodes (LED) and a digital switching circuit. To keep the energy constant across frequencies the duty cycle was set to 50%. Light source was located one meter away from the rear side of the magnet, aligned with the subject and controlled by a digital I/O card (National Instruments DAQCard-6062E). The digital I/O card was triggered by external device synchronization output of the MRI scanner. Therefore, visual stimuli “on”-periods and “off”-periods were determined in terms of repetition time (RT) parameter of EPI sequence with high precision. Signal output of digital I/O card and synchronization output of MRI scanner were connected to the EEG amplifier to simultaneously register event markers on the EEG trace.
Bright diffuse light was reflected by a mirror coated with a semi-transparent paper which is located over the head-coil (field of view 54.8°). Subjects were instructed to focus on the fixation cross drawn on the mirror during the experiment. Flashing light stimuli in thirteen different frequencies were used; five frequencies from 6 to 14 Hz with 2Hz steps, and eight frequencies from 18 to 46 Hz with 4Hz steps. Each visual stimulation sequence started with an “off”-period (baseline) lasting 10 RT. Afterwards three 15 RT visual stimulation periods each followed by 15 RT “off”-periods were presented. Total duration of each sequence was 100 RT (298.1 s), approximately 70 minutes for all sequences. The different stimulation frequencies were applied to each subject in a randomly selected order to avoid any bias of the frequency sequence on the SSVEP and fMRI responses. Volunteers were allowed to rest without changing their scan position among sequences.
MRI data acquisition
Imaging was performed on a 1.5T MR scanner (Achieva, Philips Healthcare, Best, The Netherlands) with SENSE-Head-8 coil at NPISTANBUL Neuropsychiatry Hospital, Istanbul. Besides routine cranial MRI for clinical assessment, T1-weighted MPRAGE sequence was employed as high resolution anatomical scan (voxel size 1.25/ 1.25/1.2 mm; 130 slices; field of view 240 mm). MR compatible EEG caps were placed on the subject's head after the structural scanning which lasted about 20 minutes. A dynamic T2*-weighted gradient echo (GE) echo planar imaging (EPI) sequence with 100 dynamics was used for BOLD measurements. Additional two dynamics were used to obtain steady state of tissue magnetization. Functional EPI volumes were acquired using AC-PC aligned 32 axial slices with slice thickness of 4 mm without gap and field of view 230 × 230 mm (matrix = 64 × 64 voxel) covering whole cerebrum. RT was 2981 ms with 50 ms echo time (TE).
The RT period was selected in such a way that it did not correspond to a multiple of the period of any stimulation frequency to avoid the phase-locking of the residual MR gradient artifacts in the EEG with the visual stimuli. This way, the SSVEP averaging procedure, as explained in the next subheading, helped further to remove the residual gradient artifacts in the EEG that remained after the gradient artifact elimination algorithm.
EEG data acquisition and processing
EEG was recorded simultaneously by using an MR compatible EEG amplifier (BrainAmp MR+, Brain Products, Germany) with 30 channels EEG (extended 10/20 system) and 1 channel ECG. The EEG signal filtered between 0.01 and 250 Hz was digitized with a sampling rate of 5 kHz. The clocks of the MR scanner and the EEG digitizer were synchronized using a hardware (SynchBox, Brain Products, Germany) to obtain MR gradient artifacts as a constant waveform in the EEG recordings. Gradient artifacts were removed according to the Average Artifact Subtraction (AAS) method described by Allen and coworkers 20 implemented in the Brain Analyzer software (Brain Products, Germany). After this procedure, the ballistocardiographic (BCG) artifacts were removed with a similar technique based on an average template of the BCG artifact using the timing of the R wave in the ECG trace. 21
After eliminating the epochs with eye and muscle artifacts manually, EEG was down-sampled to 1kHz and averaged over non-overlapping epochs of 1 s duration along the 3 stimulation blocks for each stimulation frequency (Figure 1). The total number of 1 s epochs obtained during the 3 visual stimulation blocks at each stimulation frequency was 132 (3 × 44 s), and after artifact removal the minimum number of usable epochs was 108 among the 40 subjects.
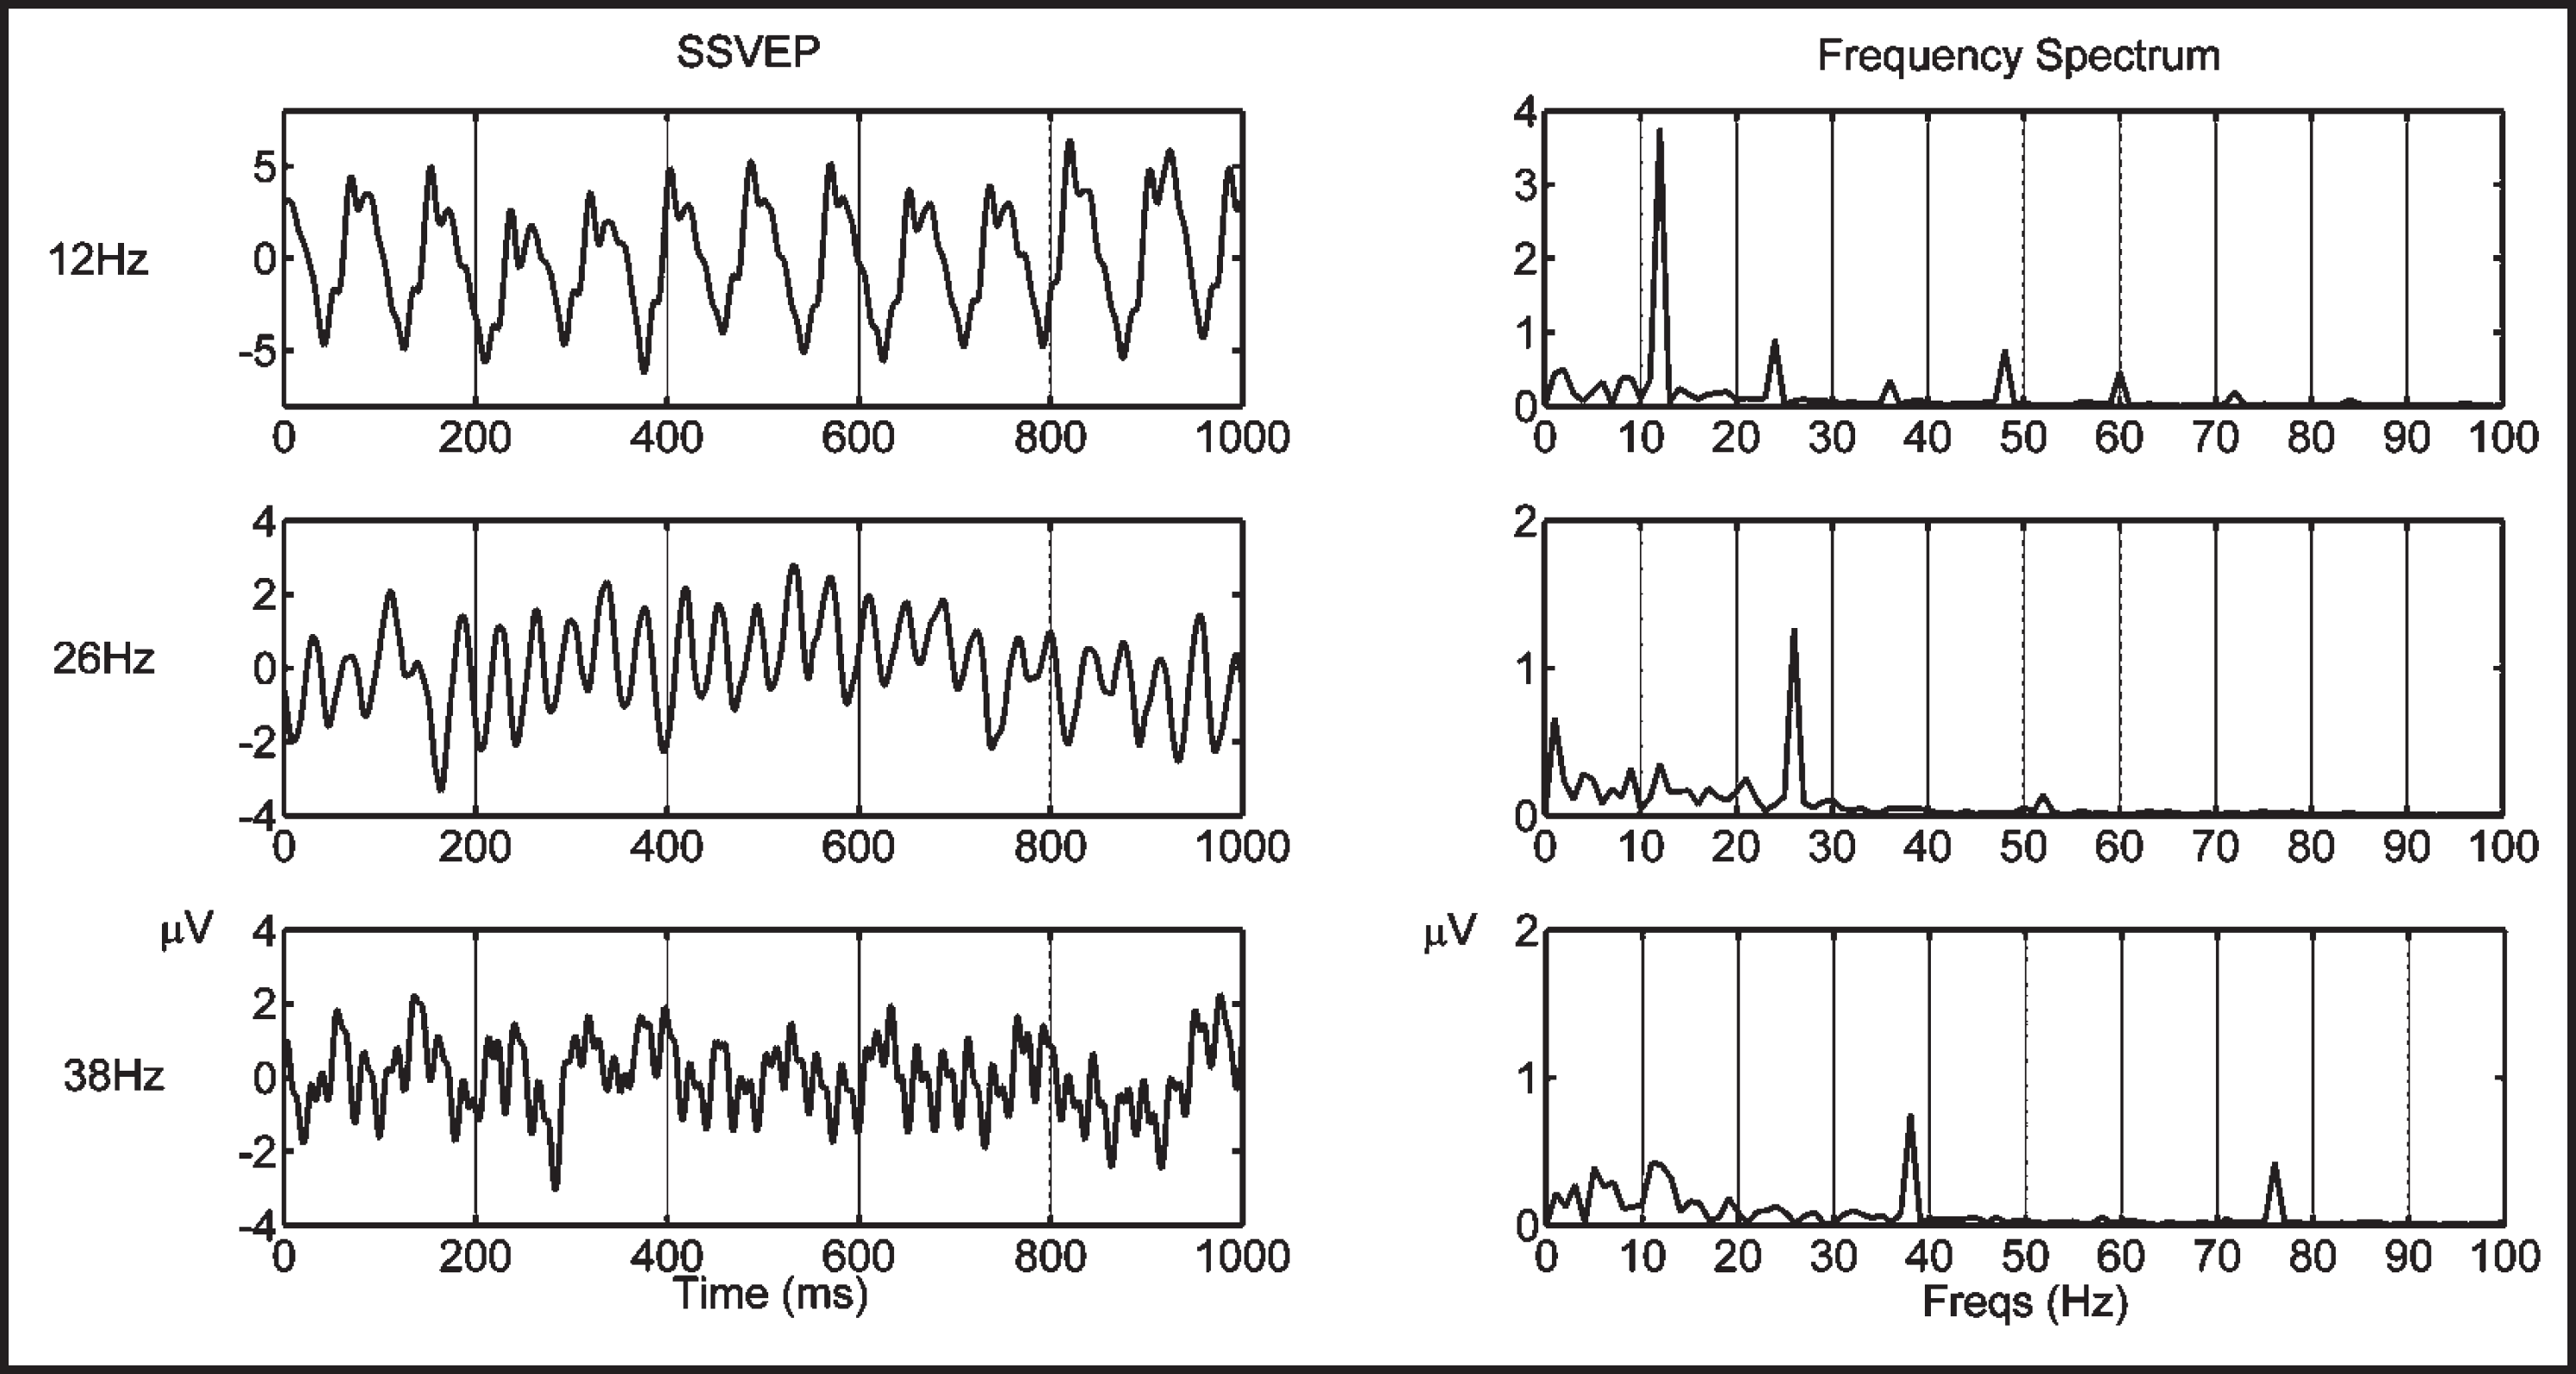
Left column: Sample SSVEPs of a typical subject obtained with three different stimulation frequencies. Right column: The frequency spectra of the SSVEPs showing peaks at the stimulation frequencies and their harmonics.
The amplitude spectra of the averaged SSVEPs were then obtained by computing the magnitudes of the Fast Fourier Transforms (FFT) of the repetitive SSVEP signals. As the amplitude spectra of the SSVEPs obtained with all stimulation frequencies contained peaks at the stimulation frequency (fundamental frequency) and at least at its first and second harmonics, the quantification of the SSVEP amplitude for each stimulation frequency was obtained by adding the amplitudes of the spectral peaks at the stimulation frequency and at its first and second harmonics. Because the topographical pattern was clearly occipital (Figure 2), mean amplitudes of the O1, Oz, and O2 electrodes were used in further analyses.
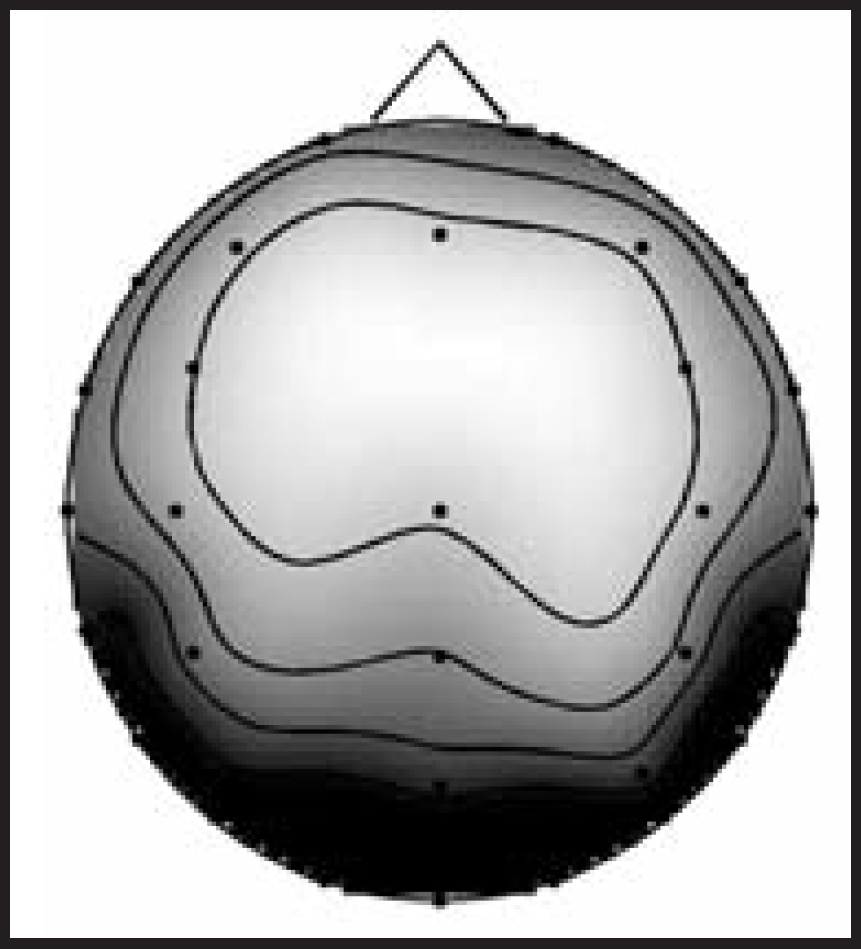
Mean topography of the SSVEPs of a subject. The SSVEPs obtained with each of the 13 stimulation frequencies have been quantified by adding the amplitudes of the spectral peaks at the fundamental frequency and its first and second harmonics. Mean of the 13 SSVEPs is topographically displayed. Because a clear occipital topography was observed, mean amplitudes of the O1, Oz and O2 channels have been used in the SSVEP-informed fMRI analyses.
The individual SSVEP frequency characteristics were then obtained by plotting the SSVEP amplitudes vs. stimulation frequencies for each subject (Figure 3).
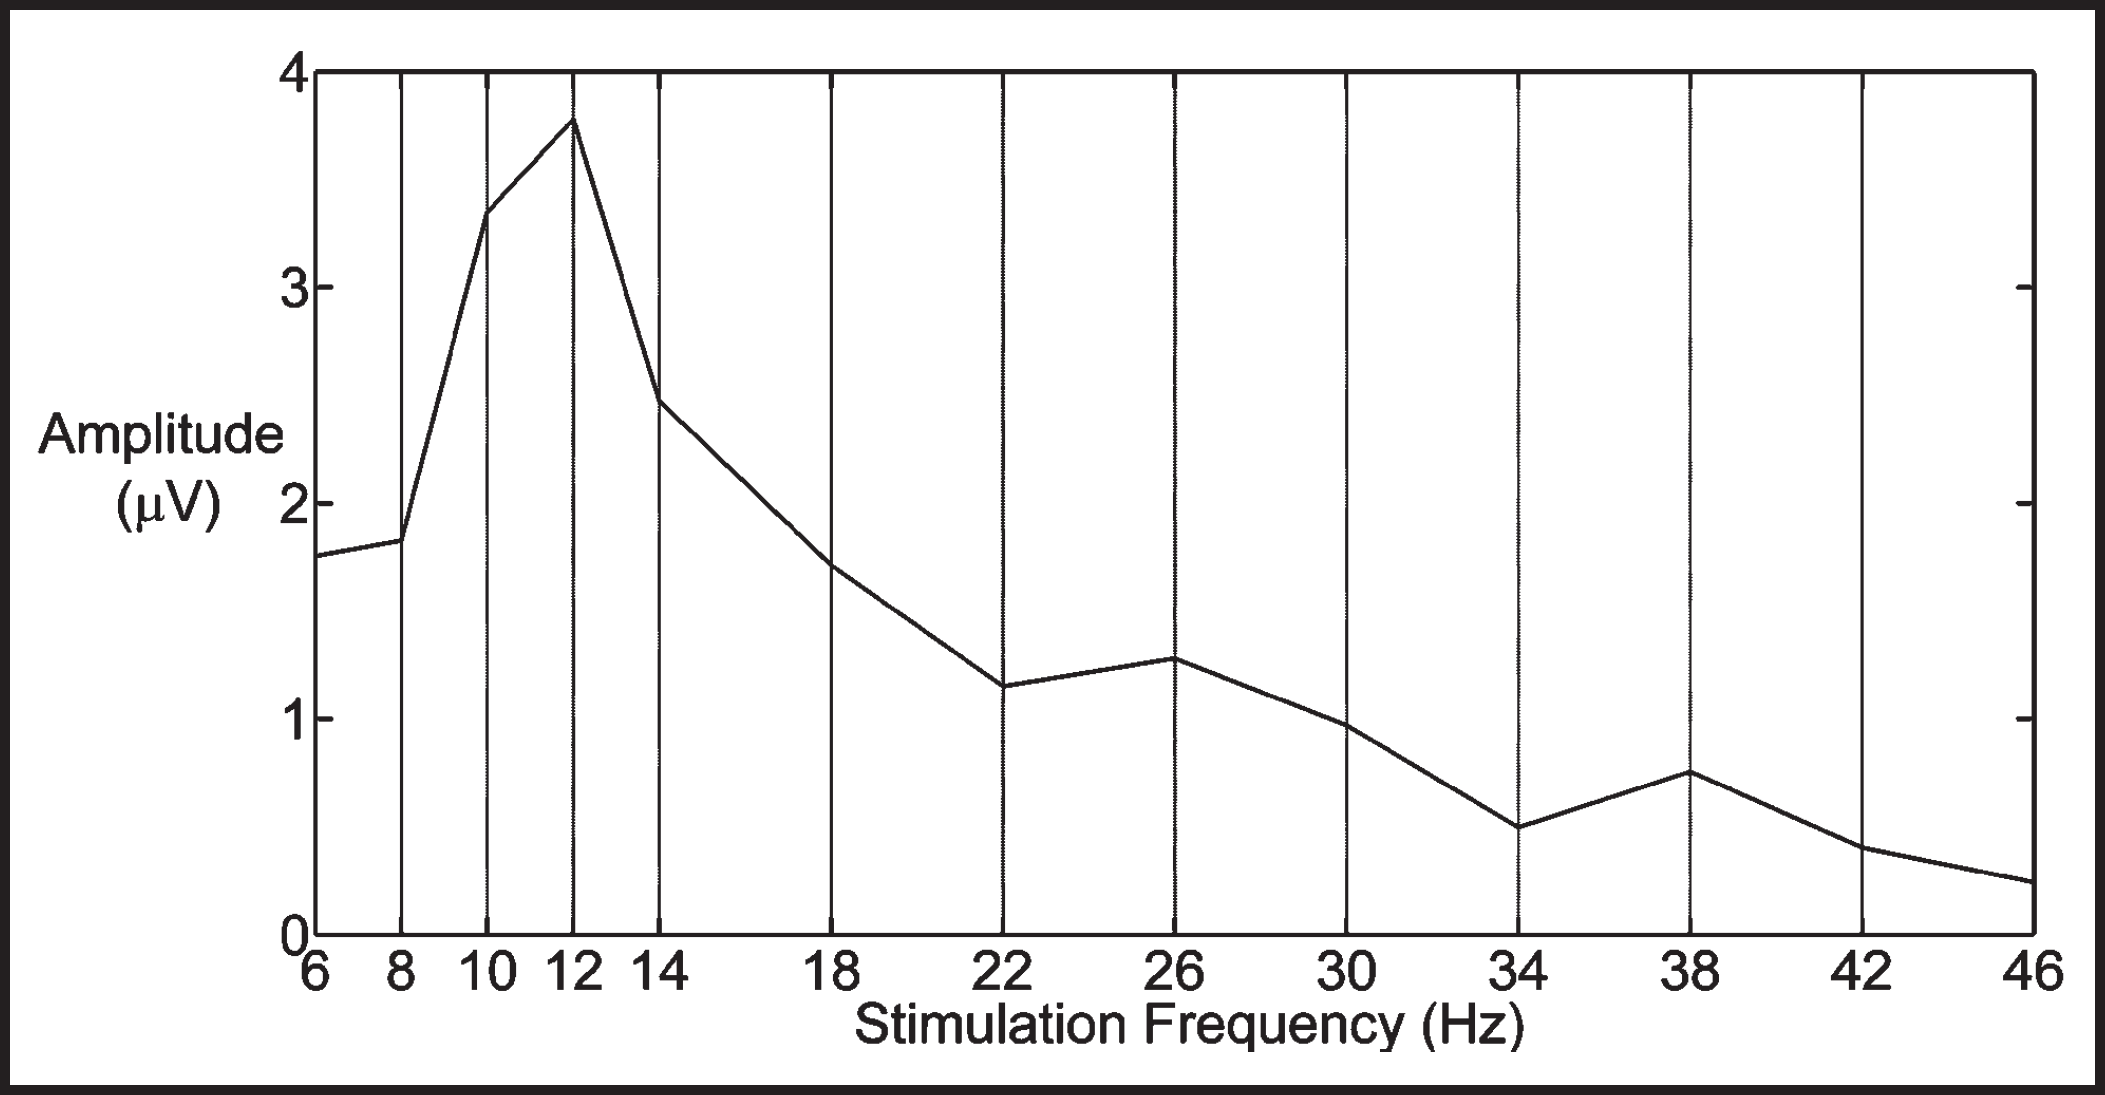
The SSVEP amplitudes of a subject quantified as the sum of the spectral peaks at the stimulation frequency and its first and second harmonics at 13 visual stimulation frequencies. Average amplitudes from the O1, Oz and O2 channels are shown.
EEG informed fMRI processing
Software tools within FSL (FMRIB's Software Library, FMRIB, Oxford, UK) were used in fMRI data processing. 22 Data were pre-processed prior to performing general linear model (GLM) analysis. Motion correction, slice timing correction, non-brain removal, spatial smoothing using a Gaussian kernel of FWHM 8.0 mm, grand-mean intensity normalization of the entire 4D dataset and high-pass temporal filtering (Gaussian-weighted least-squares straight line fitting, with sigma=45.0 s) were applied. 23
The scheme of the applied EEG informed fMRI analysis technique is summarized in Figure 4. In the first stage of the three-level analysis of fMRI data, the correlation between the visual input and the BOLD response measured at each voxel is obtained for each stimulation frequency and for each subject. GLM time series analysis with local autocorrelation correction was applied in order to find BOLD related signal changes discriminating the visual stimulation periods from the rest periods. 24 For this, basic boxcar model which is convolved with the double-gamma hemodynamic response function (HRF) was used with its temporal derivative in the design matrix.
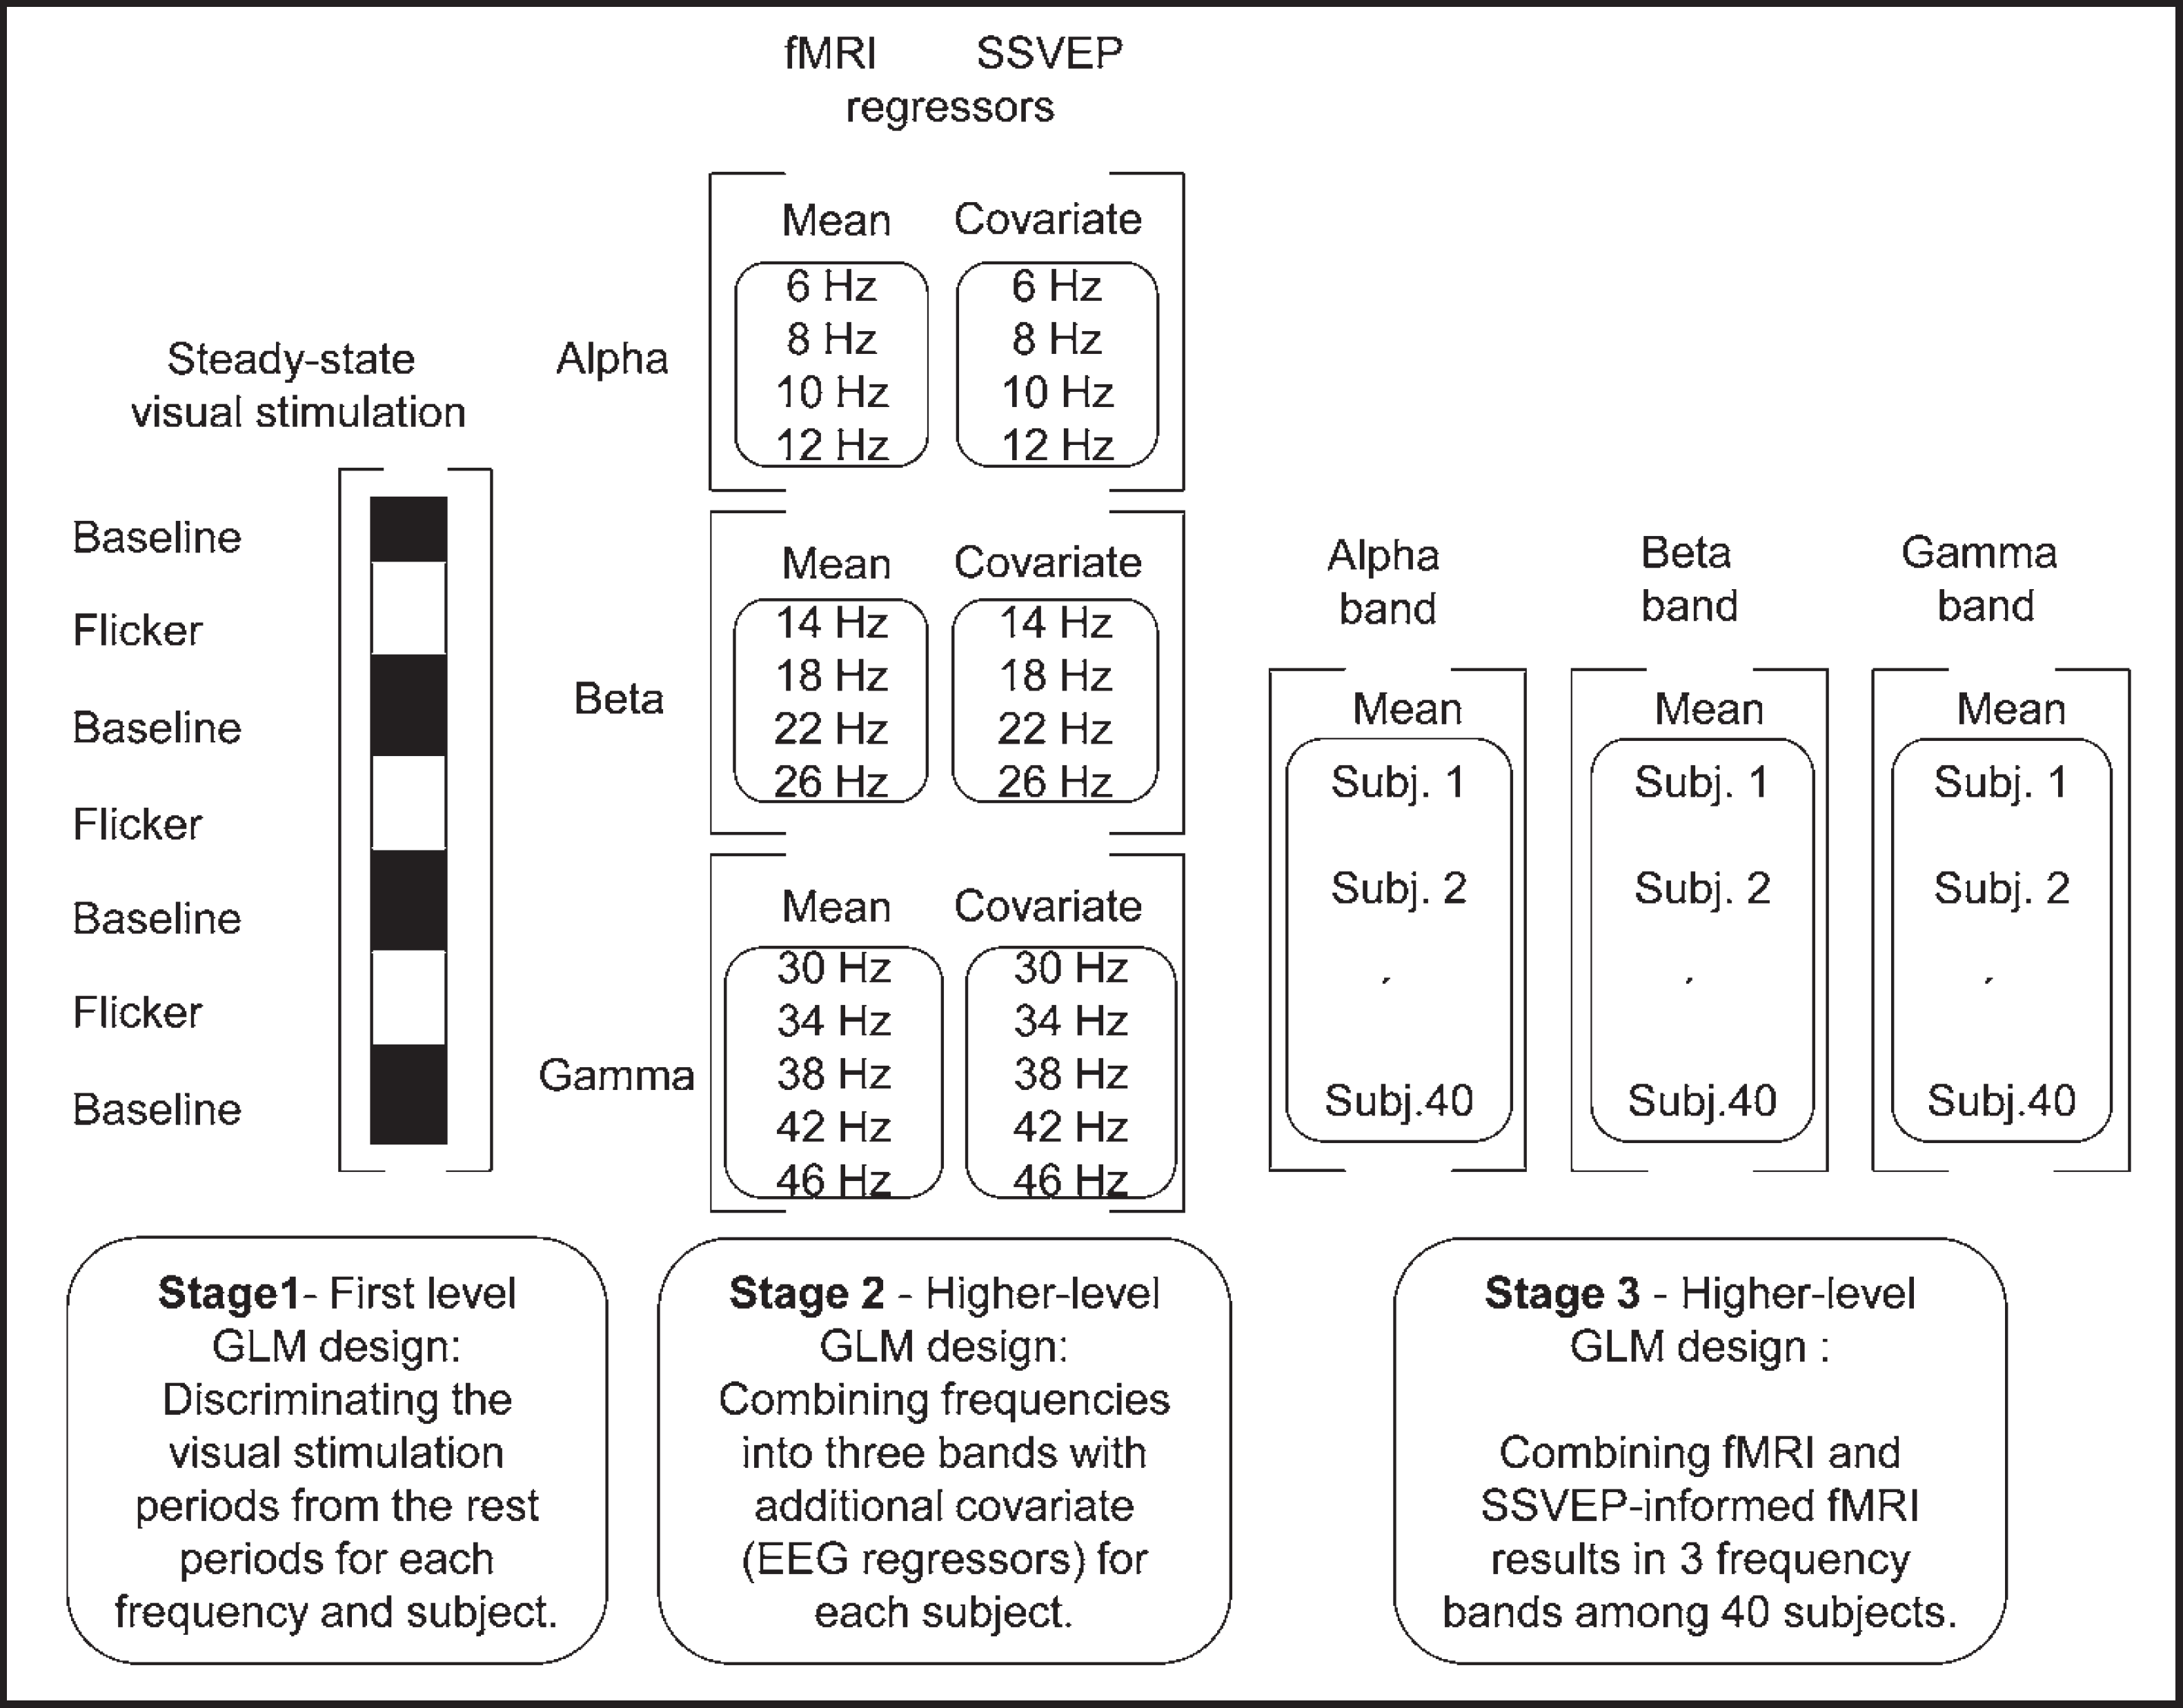
Short description of the SSVEP-informed fMRI analysis.
In the second stage, higher-level single subject multi-session GLM analysis was applied using random-effects analysis for specific ranges of stimulation frequencies to combine analysis of first level and integrate it with the SSVEP derived data. 25 For this, the whole range of visual stimulation frequencies was divided into 3 bands in such a way, that the SSVEP frequency characteristics of each subject contained a peak in each frequency band. The resulting frequency ranges were 6–12 Hz, 14–26 Hz and 30–46 Hz that approximately correspond to alpha, beta and gamma frequency bands of the EEG. The amplitude patterns of the SSVEP responses of each subject across 4 (alpha: 6,8,10,12 Hz and beta: 14,18,22,26 Hz) or 5 (gamma: 30,34,38,42,46 Hz) different stimulation frequencies were then used as SSVEP derived fMRI regressors. To model only fMRI activity correlated with the SSVEP amplitudes, mean of these amplitudes representing the common response to all stimulation frequencies in the frequency band was removed, and a zero-mean vector was obtained for each frequency band of each subject. Parameter estimates of the first-level fMRI analysis were then modeled in the second level with a design matrix having a column of ones representing mean fMRI activation in the whole frequency band and a column of zero-mean SSVEP derived fMRI regressor as an additional covariate representing the SSVEP correlated visual stimulation effects in the fMRI. In this way, both mean fMRI activations and SSVEP correlated fMRI activations were obtained for each subject and frequency band.
In the third stage, multi-subject group analysis was performed for each band using a GLM model which accounted for the intersubject variability across 40 subjects. The parameter obtained at this final stage was used to generate a t-field to test the significance of linear correlation between fMRI and SSVEP across 40 subjects for each band. Gaussian Random Fields (GRF) theory based maximum height thresholding with a (corrected) significance threshold of P<0.05 was employed for Z (Gaussianised T/F) statistic images. 26 Average and EEG correlated Z statistic images were registered to standard space (MNI152). 23
RESULTS
SSVEP results
The averaged SSVEP responses displayed clear oscillatory patterns phase-locked to the visual stimuli and the frequency spectra of the responses showed peaks at the stimulation frequency and its harmonics (Figure 1).
Figure 3 displays the SSVEP amplitudes of one subject at each of the 13 stimulation frequencies. Although the exact peak frequencies had a variability among the subjects, the general pattern of visual SSVEP amplitudes across the stimulation frequencies consisted of a global maximum around 10 Hz and secondary local maxima around 20 and 40 Hz in line with the findings of previous studies. 9
Considering that the generation of the 3 main amplitude maxima observed in the SSVEP frequency characteristics might depend on different mechanisms, the full spectrum of visual stimulation frequencies was divided into 3 ranges, such that each of the 40 subjects had a peak in each of these frequency bands. The resulting frequency ranges roughly corresponded to the alpha (6–12 Hz), beta (14–26 Hz) and gamma (30–46 Hz) frequency bands of the EEG.
fMRI and SSVEP-informed fMRI results
As we investigated the correlation between BOLD and SSVEP activities, the 3 level GLM analysis allowed us to systematically rule out the variabilities arising from the several sources, i.e., the visual stimulation, the different stimulation frequencies and the subjects. The first level eliminates the variability of the fMRI activity of each subject along each experiment with a single visual stimulation frequency and captures the parameter that correlates with the input stimulus pattern. The second level analysis accounts for the variability due to the different stimulation frequencies within each of the alpha, beta and gamma frequency bands and determines mean BOLD response and SSVEP-correlated BOLD response of each subject for each band separately. Finally, at the third stage, the variability coming from different subjects is eliminated to determine those voxels in which the BOLD response correlates significantly with SSVEP for each band.
Mean fMRI activity that is independent of the SSVEP amplitudes (Figure 5) shows, that in all 3 bands the lateral geniculate nuclei, the primary visual cortex (BA17) and visual association areas (BA18 and BA19) were active. In general the level of activity decreased slightly with increasing frequencies. Additional activations were observed in the precuneus and bilaterally in the hippocampi and dorso-lateral prefrontal cortices (BA46 and BA47).
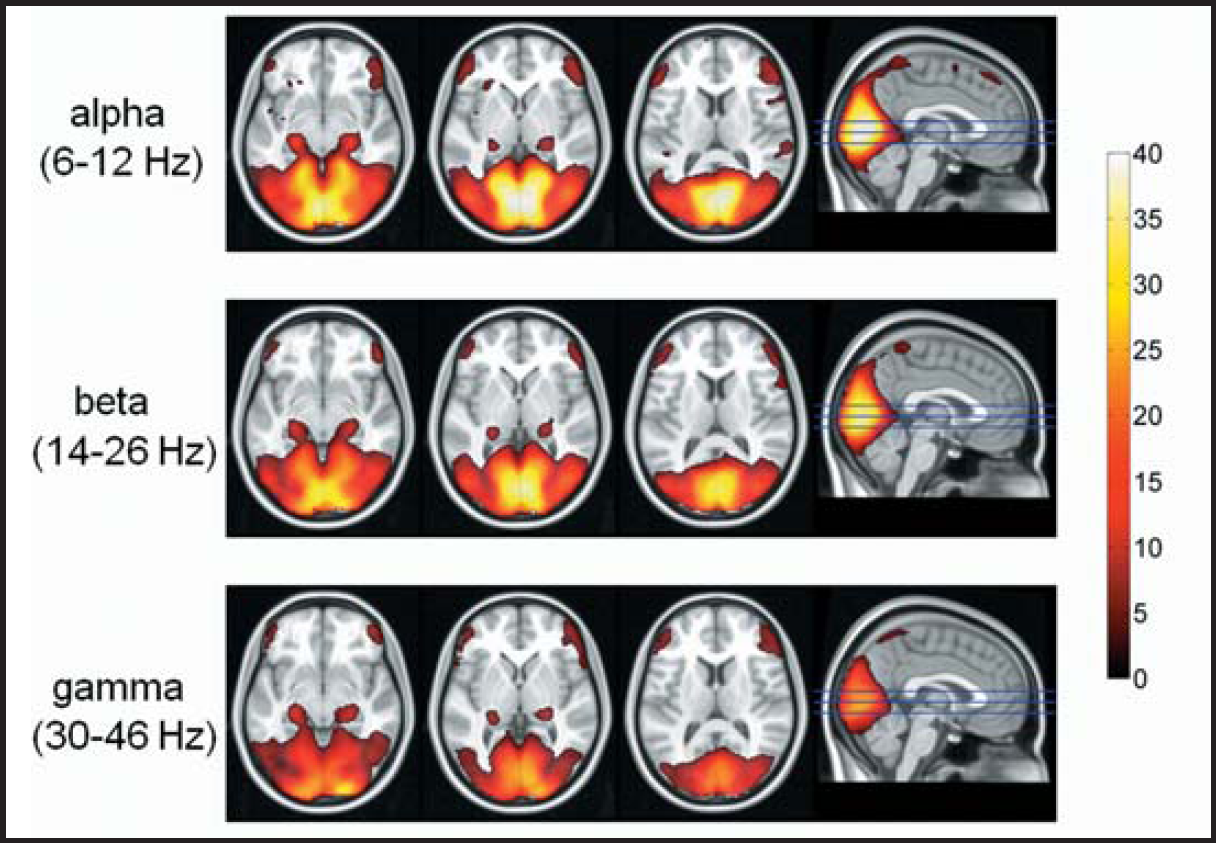
Mean fMRI activation maps of 40 subjects obtained with visual stimuli in the alpha, beta and gamma frequency ranges. Colors represent the Z (Gaussianised T/F) scores. For all frequency bands, significant BOLD increases were observed in the primary (BA17) and secondary visual areas (BA18 and BA19), bilateral dorsolateral prefrontal cortices (BA46 and BA47), bilateral hippocampi (left column), LGN (2nd column) and precuneus (right column).
The fMRI activity maps that were correlated with the SSVEP amplitude changes across the different stimulation frequencies within each frequency band showed no significant correlation in the alpha band, while a significant correlation was obtained in the primary visual area (BA17) and lingual gyri (BA19) for the beta band, and in a limited area of the primary visual cortex for the gamma band (Figure 6).
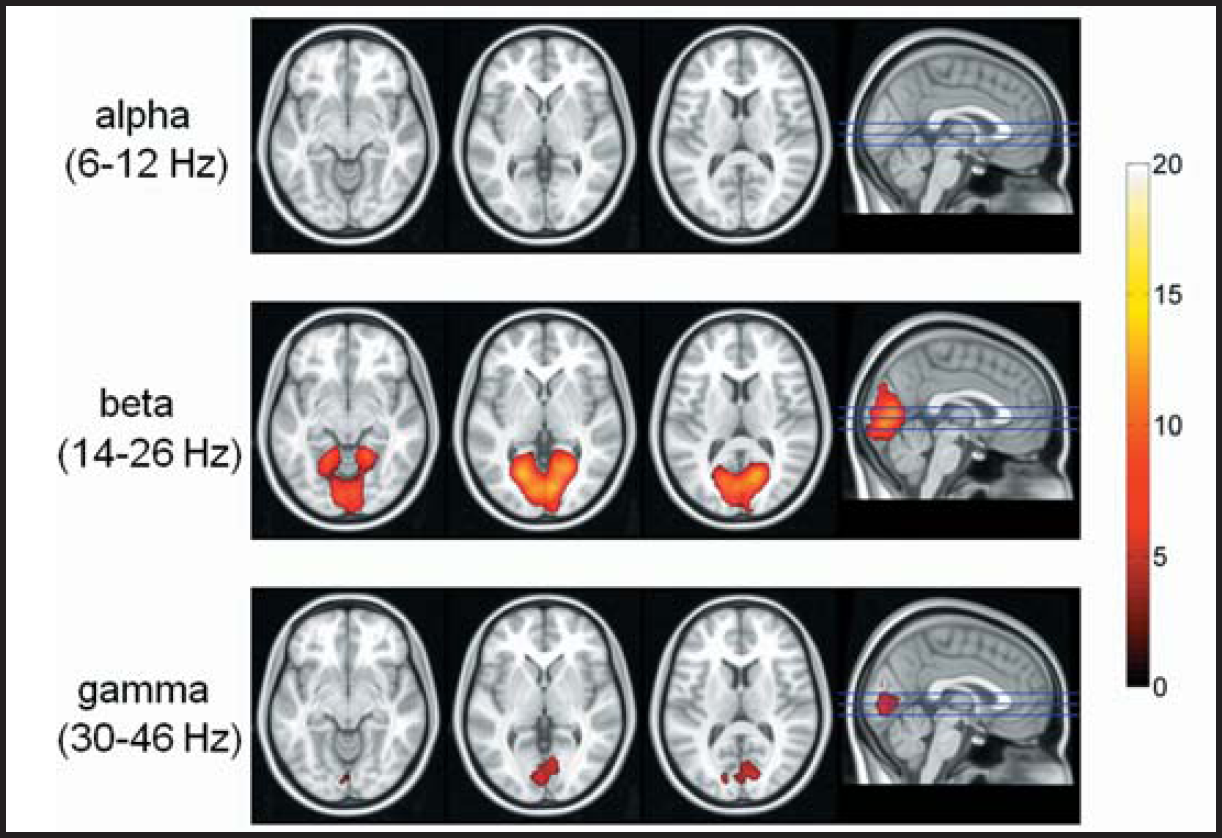
SSVEP correlated fMRI activations of 40 subjects obtained with visual stimuli in the alpha, beta and gamma frequency ranges. The maps are based on the significantly correlated change of the BOLD responses with SSVEP amplitudes across the different visual stimulation frequencies in each frequency band. Colors represent the Z (Gaussianised T/F) scores. For the beta band, BOLD responses in the primary visual cortex (BA17) and lingual gyri (BA19) showed a significant correlation with the SSVEP amplitudes, while for the gamma band a SSVEP-correlated BOLD response could only be observed in the primary visual cortex.
DISCUSSION
The strength of the present study is that it is the first study that recorded simultaneous EEG/fMRI responses with steady-state visual stimulation at systematically varying stimulation frequencies between 6 and 46 Hz in a large group (40) of subjects to obtain reliable information about the neural events generating the steady-state visual evoked responses. The change of SSVEP amplitudes along the stimulation frequencies revealed individual variability in the peak frequencies among the subjects, but the presence of three amplitude maxima around 10, 20 and 40 Hz was the common finding for all 40 subjects. This result is in accordance with earlier studies on SSVEP frequency characteristics. 7,9,14
In the present study, BOLD responses during steady-state visual stimulation revealed significant increases in primary sensory and association areas of vision and in the thalamus (LGN) when visual stimulation periods were compared with the rest periods. Although a slight decrease in the strength of this hemodynamic response was observed with increasing stimulation frequency, the same areas were active along the whole range of stimulation frequencies. Also some weaker activations were observed in the precuneus, bilateral hippocampi and prefrontal cortices. We will first focus on the activities recorded in the visual areas, but these latter activations will also be shortly discussed.
The presence of clear oscillatory SSVEP responses in the EEG inline with significant increases of BOLD responses for all stimulation frequencies shows that there is a high temporal correlation between both electrophysiological and hemodynamic responses in terms of the signal change during stimulation periods compared with the rest periods. This finding is in accordance with the EEG/fMRI results reported by Rosa and coworkers, 27 who showed a high temporal correlation between the EEG spectral parameters and the BOLD response during steady-state visual stimulation with checkerboard reversal rates of 2, 3.75, 5, 6, 7.5, 10, 15, and 30 Hz. However, this study pooled all stimulation frequencies and did not compare the responses in both modalities among the different stimulation frequencies, which is the main focus of the present work.
For the analysis of the correlations between the SSVEP and BOLD responses among different stimulation frequencies, we divided the whole range of 13 visual stimulation frequencies into 3 frequency ranges, because the common finding was that each subject's SSVEP frequency characteristics contained a peak in each of the 3 frequency ranges, 6–12 Hz, 14–26 Hz and 30–46 Hz, which roughly correspond to alpha, beta and gamma frequency bands of the EEG. A further reason for the analysis of responses at different stimulation frequencies in 3 sub-bands was that the SSVEP frequency characteristics showed strongly decreasing amplitudes with increasing stimulation frequencies after a global peak around 10 Hz. Therefore, analysis of the correlations between the fMRI activations and the SSVEP amplitudes along the whole range of 13 stimulation frequencies would mainly reflect the effects in the lower frequencies, and any normalization procedure to overcome this problem would introduce an arbitrary bias to the data. The 3 bands allowed analysis of the correlations between both modalities through responses of comparable amplitudes.
We found no correlation between the SSVEP and BOLD responses for the stimulation frequencies between 6 and 12 Hz (alpha range), while there was a significant correlation in the primary visual cortex (BA17) and lingual gyri (BA19) for the stimulation frequencies between 14 and 26 Hz (beta range) and a significant correlation in a limited part of the primary visual area (BA17) for frequencies between 30 and 46 Hz (gamma range). This pattern of correlations is especially interesting, because the global maximum of the SSVEP amplitudes is consistently obtained around 10 Hz, where no cross-frequency correlation was present between EEG and fMRI. Based on previous results in animal subjects, which show that the BOLD response in a cortical volume is correlated with the synaptic activity measured in the form of local field potentials, 15 this finding suggests that the strong peak of the SSVEP in the alpha band does not depend on an increase of the total synaptic activity compared with visual stimulation at other frequencies in the frequency band.
This finding is in favor of the hypothesis that the global peak of the SSVEP amplitudes reflects the resonance of oscillators tuned to this frequency, because the repetitive stimulation at this frequency yields strongly synchronized neuronal activity without a net increase in the total synaptic activity. The report by Parkes and coworkers 28 on the reduced BOLD response obtained with periodic stimulation compared with stimuli delivered with a latency jitter supports this view in terms of a reduced metabolic demand for the entrainment of neuronal oscillators into a rhythmic pattern. Hence, resonant entrainment of the neuronal oscillator leads to large amplitudes in the scalp recorded EEG, which is sensitive to neuronal synchronicity, while BOLD signal, which is mainly sensitive to the total amount of synaptic activity, does not show any significant change compared with the stimuli at non-resonant frequencies. Such discrepancy between the SSVEP and BOLD response at the resonant frequency is especially plausible if the inter-neurons within the investigated cortical volume do not play a role in the resonating circuitry, and therefore their synaptic work does not contribute to the BOLD response generated in the cortical volume. The modeling study by Robinson and coworkers, 29 which shows that resonant behavior near the alpha peak both in the spontaneous EEG and in SSVEP can be explained by the cortico-thalamic loop delays, supports this point. Furthermore, a number of studies, which reported a negative correlation between the BOLD activity and the EEG alpha power in the occipital cortex 16 –18 also support the finding that high amplitude alpha oscillations do not require a high metabolic rate in the cortex.
The same does not hold for secondary SSVEP peaks observed within the beta and gamma frequency ranges. In the beta band, a strong correlation is observed between the SSVEP and the hemodynamic response in a large part of the primary visual area and partially in the secondary visual area BA19. This contrast compared with the alpha peak could be explained by either an increased synaptic input to the visual cortex from the thalamus at the beta and gamma peak frequencies, which would increase the BOLD signal in-line with the SSVEP peak, or again by a resonance of a neuronal oscillator but this time consisting of a local neuronal network with significant contribution of inhibitory or excitatory inter-neurons within the cortical volume, which would increase the metabolic demand and therefore BOLD response in the investigated area. Which of these two possible mechanisms holds true for the beta and gamma SSVEP peaks needs further investigation by analyzing the possible changes in effective connectivity between the LGN and the primary visual area across the stimulation frequencies in the beta and gamma frequency ranges. However, in vitro evidence for the cortex that the interplay between excitatory pyramidal cells and inhibitory inter-neurons is essential for the generation of oscillatory activities within beta and gamma frequency ranges 30–31 suggests that the latter mechanism might be responsible of the correlation between the SSVEP and BOLD responses at beta and gamma peaks. At this point, we would like to indicate that even the presence of a linear relationship between the electrophysiological and hemodynamic signal does not dictate that the observed electrophysiological phenomenon reflects a simple summation of the synaptic activity, but the increased synaptic activity within the investigated cortical volume might be necessary for the phase-locking of the neuronal oscillators, which would yield the change in the surface-recorded EEG response.
The spatial restriction of the SSVEP-correlated BOLD activity in the gamma range compared with the beta range is in accordance with EEG results that show the role of the beta oscillations in building functional interactions between more spatially distant regions of the central nervous system, while gamma oscillations build rather local patches of synchrony. 32 In general, the localization of the SSVEP correlated BOLD activations both in beta and gamma ranges were in accordance with previous studies about the generators of the SSVEPs. 33
The contrasting results obtained in alpha vs. beta and gamma ranges in the present study are in accordance with the results of an earlier study of our group that investigated BOLD transients obtained with steady-state visual stimuli between 1 and 44 Hz. 34 BOLD response typically consists of three transients; the initial dip, the positive BOLD (PBOLD) and the post-stimulus undershoot (PSU), which have been explained by the balloon model of the dynamics of blood flow and oxygenation changes during brain activation 35 or the independent change of model components under specific conditions. 36 Later, a biophysical model of the coupling between neuronal activity and the balloon model was proposed, which showed that increases in excitatory activity amplify both the PBOLD and the PSU, whereas increasing the inhibitory activity evokes decrease in the PBOLD signal without altering the PSU. 37 The results by Emir and coworkers 34 revealed that PBOLD and PSU were correlated during visual stimulation between 1 and 13 Hz suggesting that they might be attributed to exclusively excitatory inputs from a distant source. 3 However, the PBOLD and PSU were uncorrelated between 13 and 44 Hz, possibly because of the significant contribution of the inhibitory inter-neurons within the cortex in the neuronal responses produced within this frequency range. The same mechanism might explain the present results about the alpha vs. beta and gamma oscillations in the following manner: The synchronizing long-range excitatory input to the cortex at the alpha peak does not lead to a significant increase in the cortical metabolic rate resulting in uncorrelated SSVEP and PBOLD changes, while the resonance of the neuronal oscillators that operate in the beta and gamma frequency ranges requiring interaction of the local inhibitory and excitatory neurons leads to increased energy demand in the cortical volume leading to correlated increases in SSVEP and PBOLD responses.
An earlier study with the similar aim to investigate human cerebral activation during steady-state visual evoked responses 38 as in the present study, applied EEG and regional cerebral blood flow (rCBF) measurements with positron emission tomography (PET) in separate sessions. The authors reported a SSVEP amplitude maximum at 15 Hz. On the basis that the primary visual cortex rCBF follows an activation pattern similar to the SSVEP amplitudes among stimulation frequencies at 5, 10, 15, 25 and 40 Hz, the authors concluded that the SSVEP peak corresponds to a true activation of neuronal clusters in primary visual cortex and is not a phase summation effect. First of all, the global SSVEP peak frequency reported in this study does not correspond to that in other SSVEP studies 29 and in the present study, possibly because of the different stimulation conditions. The authors used stroboscopic flashes, which leads to increasing mean luminance with increasing stimulation frequency. This problem was overcome by both Herrmann 9 and in the present study by using LED light sources with 50% due time, such that the mean intensity of the light remained constant across stimulation frequencies. Additionally, it is well described before 7,9 and in the present study, that the SSVEP amplitude maxima are not exactly at the same frequency for all subjects. Regarding the present results for example, SSVEP amplitude maximum can be obtained at stimulation frequencies between 8 and 12 Hz for different subjects. Therefore, the grand-average SSVEP frequency characteristics show rather broad peaks compared with the individual ones. Probably, this is the reason, why Pastor and coworkers 38 sampled the rCBF measurements at only 5 different stimulation frequencies of 5, 10, 15, 25 and 40 Hz, which were chosen according to the grand-average SSVEP peaks in their EEG sessions. This low sampling of stimulation frequencies may be the reason why the authors did not observe the non-linear effect we obtained in the alpha frequency range, which we sampled with stimuli at 6, 8, 10 and 12 Hz. Furthermore, the correlation of the rCBF measurements from the subjects with a regressor consisting of the grand-average SSVEP amplitudes in contrast to the individual correlations we computed might also explain the discrepancy between the results.
There are two other studies that investigated the relationship between SSVEP and fMRI measurements and reported that the relationship between both responses is a linear one. 39–40 The first one 39 recorded EEG and fMRI responses in separate sessions using a checkerboard illuminated with flashes of 1 ms duration at 2, 4, 6, 8, 10 and 12 Hz, and found a SSVEP peak at 8 Hz in 7 of 8 subjects and at 6 Hz in one subject. These SSVEP peaks that roughly correspond to the maximal hemodynamic responses both in PET or fMRI studies 28,41 resulted in a high correlation between SSVEP and BOLD signals. However, atypical SSVEP peaks at 6–8 Hz instead of the expected peak around 8–12 Hz and the uncorrected mean light intensity due to the 1 ms flashes at different frequencies makes it questionable, whether the linear relationship depends on the intensity or the frequency of the applied visual stimuli. The thick MRI slices of 10 mm might also be responsible for the discrepant results compared with the present study. The other study by Wan and coworkers 40 used radial checkerboard stimuli at 0.5, 1, 4, 8 and 16 Hz, which cannot exclude the presence of the non-linear relationship between SSVEP and BOLD responses we observed between 6 and 12 Hz.
A straightforward interpretation of the activations of the bilateral hippocampi, dorso-lateral prefrontal cortices and precuneus during the steady-state visual stimulation is hard, however, there are a range of studies which report that the SSVEP responses in frontal electrodes are sensitive to tasks related with executive functions and working memory, 11 –13 which have been mostly investigated by superimposing the task-related stimuli on a sinusoidally modulated light at 13 Hz. These studies implicitly show that there are neuronal generators in the prefrontal regions which oscillate at the visual stimulation frequency. How these areas are coupled with the visual areas in terms of oscillatory activities and whether oscillations at the stimulation frequency or its sub-harmonics are obtained with higher stimulation frequencies needs further investigation. However, a sub-sampling of the visual information in higher areas might be expected in the light of the results reported on the theta-gamma coupling during visual perception. 42 The activation of these areas during the passive visual stimulation condition in the present study might depend on the self-instructed attempt of the subjects to judge the stimulation rate or a self-instructed working memory condition to predict the end of the flicker period which was constant along the whole experiment.
In conclusion, our results show a non-linear relationship between the surface recorded SSVEP amplitudes and the BOLD response of the visual cortex at stimulation frequencies around the alpha band, which supports the view that resonance at the tuning frequency of the alpha oscillator in the visual system is responsible for the global amplitude maximum of the SSVEP around 10 Hz. The SSVEP/BOLD relationships at secondary amplitude maxima of the SSVEP are linear, which however does not exclude the possibility that they also represent resonances with significant contribution of the cortical inter-neurons to the phase-coupling of neuronal oscillators. In short, the surface-recorded SSVEPs display a frequency-selective non-linear relationship with the BOLD response, hence do not reflect a simple summation of the synaptic activity in the cortex as proposed in earlier studies. 38 –40 Present work further shows that scalp-recorded EEG and fMRI reflect different aspects of the neuronal activity, hence cannot be simply fused to increase the temporal or spatial resolution of each other in many instances. However, the complementary information in each modality can efficiently answer basic questions regarding specific phenomena in each modality.
Additionally, information gained from the SSVEP/fMRI analyses in the present study, which overcame the temporal registration problem between both modalities by obtaining electrophysiological signals that are stationary for the duration of the slower BOLD response, might be extrapolated to the EEG/fMRI analysis of the transient event-related potentials (ERPs): More reliable and consistent correlations between electrophysiological and fMRI responses can be expected, when the EEG/fMRI analyses are carried out on evoked or induced oscillations in separate frequency bands instead of a search for correlations between the time-domain peak amplitudes or latencies of ERPs with the BOLD response.
Footnotes
ACKNOWLEDGMENTS
This study is supported by the TUBITAK (Turkish Scientific and Technological Research Council) project # 108S101. We are grateful to Prof. Dr. Pedro Valdes-Sosa from Cuban Neuroscience Center for the very valuable comments during the preparation of the paper.
DISCLOSURE AND CONFLICT OF INTEREST
A. Bayram, Z. Bayraktaroglu, E. Karahan, B. Erdogan, B. Bilgic, M. Özker, I. Kasikci, A.D. Duru, A. Ademoglu, C. Öztürk, K. Arikan, N. Tarhan and T. Demiralp have no conflicts of interest in relation to this article.