
Abstract
Cerebral hemorrhage may cause cognitive dysfunction. Electroencephalogram (EEG) is a noninvasive diagnostic tool for assessment of cerebral function. A total of 174 patients (including cognitively impaired and cognitively normal) with cerebral hemorrhage, and 120 healthy persons (CN), were recruited between August 2008 and July 2012 at the Department of Neurology. EEG was used to analyze cerebral function of patients and normal persons. Correlation, clustering and concordance analyses were performed to analyze the relationship between EEG power and Montreal Cognitive Assessment (MoCA) scores. Cognitively impaired patients had a significantly decreased EEG beta power (0.793 ± 0.176 µV2) compared with cognitively normal patients (1.589 ± 0.205 µV2, P < .01) or healthy persons (1.651 ± 0.185 µV2, P < .01). Significantly negative correlations between beta power and hemorrhage region, size, amount, and patients’ age were apparent (r = −0.91888, −0.78569, −0.84961, and −0.80365, respectively, all Ps < .001). There was good concordance between the K-means clustering algorithm calculating beta power and MoCA scoring (κ = .904, P < .001). In conclusion, the analysis method of EEG (beta power) abnormalities holds considerable promise to assess cognitive impairment after cerebral hemorrhage. Cognitive impairment was negatively correlated to hemorrhage region, size, amount, and age.
Introduction
Cerebral hemorrhage occurs within the brain tissue itself, 1 which is a subtype of intracranial hemorrhage. Cerebral hemorrhage may influence the function of specific cognitive abilities and cause cognitive dysfunction.2,3 Impairment could include cognitive loss, especially for semantic memory, which may lead to serious social, vocational, or other brain functional impairment to the patients.4,5 Cognitive consequences of ischemic stroke have been well documented, 6 but the frequency and diagnosis of cognitive impairment post cerebral hemorrhage have not been systematically analyzed. 7
EEG is a noninvasive, relatively cheap and widely available diagnostic tool, for assessment of cerebral function. EEG may be useful for evaluation of cognitive impairment. 8 Although EEG lacks specific findings in cognitive disorders, it may still have value when there is diagnostic doubt. Diffuse EEG slowing is useful in differentiating healthy humans from patients with Alzheimer’s disease. 9 Specific types of EEG abnormalities could reflect different cognitive profiles in patients with Alzheimer’s disease. 10 EEG may provide biological or diagnostic assistance in variable cognitive impairment.
EEG frequency is usually described in 5 frequency bands: delta, theta, alpha, beta, and gamma. Most studies have not investigated gamma, because of low power and higher susceptibility to noise. Many investigators also hypothesize that the earliest modifications of EEG occur in beta and theta, whereas changes in alpha and delta appear later in the course of some neurodegenerative diseases. In the present study, we selected beta power to study cognitive impairment post cerebral hemorrhage. A specific pattern recognition technique (K-means clustering algorithm) was used to classify cerebral hemorrhage patients into cognitively impaired (CHCI) and cognitively normal (CHNC), and compared with CN. Beta power characteristics were investigated in the assessment of cognitive impairment in patients with cerebral hemorrhage.
Materials and Methods
Patients
In this study, 174 cerebral hemorrhage patients were recruited from August 2008 to July 2012 at the Department of Neurology, First Hospital of Xi’an The average disease time (from the acute hemorrhage to EEG analysis) was 8.28 ± 1.09 hours. All patients’ families gave their informed consent. One hundred twenty cases selected from individuals who came for health examination at the Physical Examination Center, were classified as CN, and all gave their informed consent.
Assessment Scale, Inclusion/Exclusion Criteria, and Trial Grouping
We selected the MoCA Beijing version to assess cognitive impairment post-cerebral hemorrhage. A series of standardized diagnostic methods were also used to exclude other diseases, including, Hamilton Depression Rating Scale (to exclude depressive disorder), Hachinski’s Ischemic Scale (HIS) (to exclude Alzheimer’s disease), instrumental activities of daily living, basic activities of daily living, and Clinical Dementia Rating Scale. In addition, patients underwent magnetic resonance imaging (MRI).
Inclusion criteria were as follows: (a) onset for the first time according to computed tomography scanning and MRI, (b) normal social behavior and having no mental sickness before the disease, (c) right-handed and cooperative with the inspection, (d) no cognitive impairment before cerebral infarcts, and (e) There was no cognitive impairment at the time of the acute cerebral hemorrhage. Exclusion criteria were as follows: (a) history of cognitive impairment caused by other explicit etiopathogenisis, such as Parkinson’s disease, normal pressure hydrocephalus, and thyroid hypofunction; (b) use of psychoactive drugs or other drugs enhancing brain cognitive functions; (c) infection, tumor, and autoimmune disease; (d) other psychiatric diseases, epilepsy, drug addiction, alcohol dependence; (e) encephalic trunk infarcts and multi-infarct disease; (f) cognitive impairment before onset; and (g) current or previous uncontrolled or complicated systemic diseases, or traumatic brain injuries.
For all the cerebral hemorrhage patients, Beijing version MoCA assessment was performed at the time of EEG and at 12 weeks post-cerebral hemorrhage. Patients whose total score was less than 26 (107 cases), accounting for 61.5%, were classified into CHCI; 67 cases with scores more than 26, accounting for 38.5%, were classified into CHNC. A total of 120 cases selected from individuals who presented for health examination were classified as CN. All cases with MoCA scores more than 26 were classified into the CN group.
EEG Recordings
EEG activity was recorded continuously from 16 channels by using standard EEG electrode placement (Jasper 10-20 electrode placement), and positioned according to the 10-20 International System (Fp1, Fp2, F7, F3, F4, F8, T3, C3, C4, T4, T5, P3, P4, T6, O1, and O2). EEG data were analyzed and fragmented off-line in consecutive epochs of 2 seconds, with a frequency resolution of 0.5 Hz. 11 EEG epochs with ocular, muscular, and other types of artifacts were preliminarily identified by a computerized automatic procedure. EEG epochs with sporadic blinking artifacts were corrected by an autoregressive method validated in the study by Moretti et al. 12
EEG Analysis Techniques
EEG signals were divided into delta (<4 Hz), theta (4-8 Hz), alpha (8-12 Hz), beta (12-22 Hz), and gamma (>22 Hz) bandwidths. Analysis yielded average power for each frequency, at each of the 16 EEG channel locations Eight EEG channels (Fp1, C3, C4, T4, T5, P3, P4, O2) exhibited the largest differences in relative beta power, but not in the other bandwidths. Therefore, we selected beta from 8 EEG channels for post–cerebral hemorrhage patients. An 8-dimensional characteristic vector was obtained, and then measured on every individual to obtain a characteristic vector array. The K-means clustering algorithm was used to classify the characteristic vector array. This clustering algorithm assumes a user-specified number of classification categories, and then calculates the centroid (mean EEG power) for each category (CHCI group and CHNC group). The value of the centroid is then iteratively adjusted until differences between data points and the centroid for each group are minimized. Steps in the algorithm are (as in the report by Moretti et al 11 ): Step 1—choose K initial cluster centers (2 centers, CHCI and CHNC, K = 2); step 2—calculate Euclidean distances between the feature vectors; step 3—find the centroids of newly created K clusters; Step 4—using the centroids of step 3 as cluster centers, repeat steps 2 and step 3 until the centroids no longer change. At this point, the algorithm is assigned to attain “convergence,” that is, they no longer change with subsequent iterations.
Statistical Analysis
Statistical software SPSS (20.0 version) and t test were used in all the statistical analyses. All K-means clustering was performed using MATALAB R20120a. Both K-means program algorithm and MATLAB function were applied to determine clusters. Kappa test was used for the concordance analysis
Basic Data
One hundred seventy-four cerebral hemorrhage patients were included in the present study. For the CHCI group, the course of disease was 8.39 ± 1.05 hours, and the educational level was 7.89 ± 0.93 years. For the CHNC group, the course of disease was 7.98 ± 1.46 hours, and the educational level was 7.57 ± 0.73 years. Moreover, hypertension and hyperglycemia were also detected in all 3 groups. No significant difference between CHCI, CHNC, and CN groups were found for the above parameters. The amount of hemorrhage in CHCI group was more significant than in the CHNC group (Table 1, P = .013). The size of the hemorrhage and patients’ age in the CHCI group were also greater than in the CHNC group (Table 1, P = .008 and .015, respectively).
Basic Data of 174 Cerebral Hemorrhage Patients and 120 Normal Controls. a
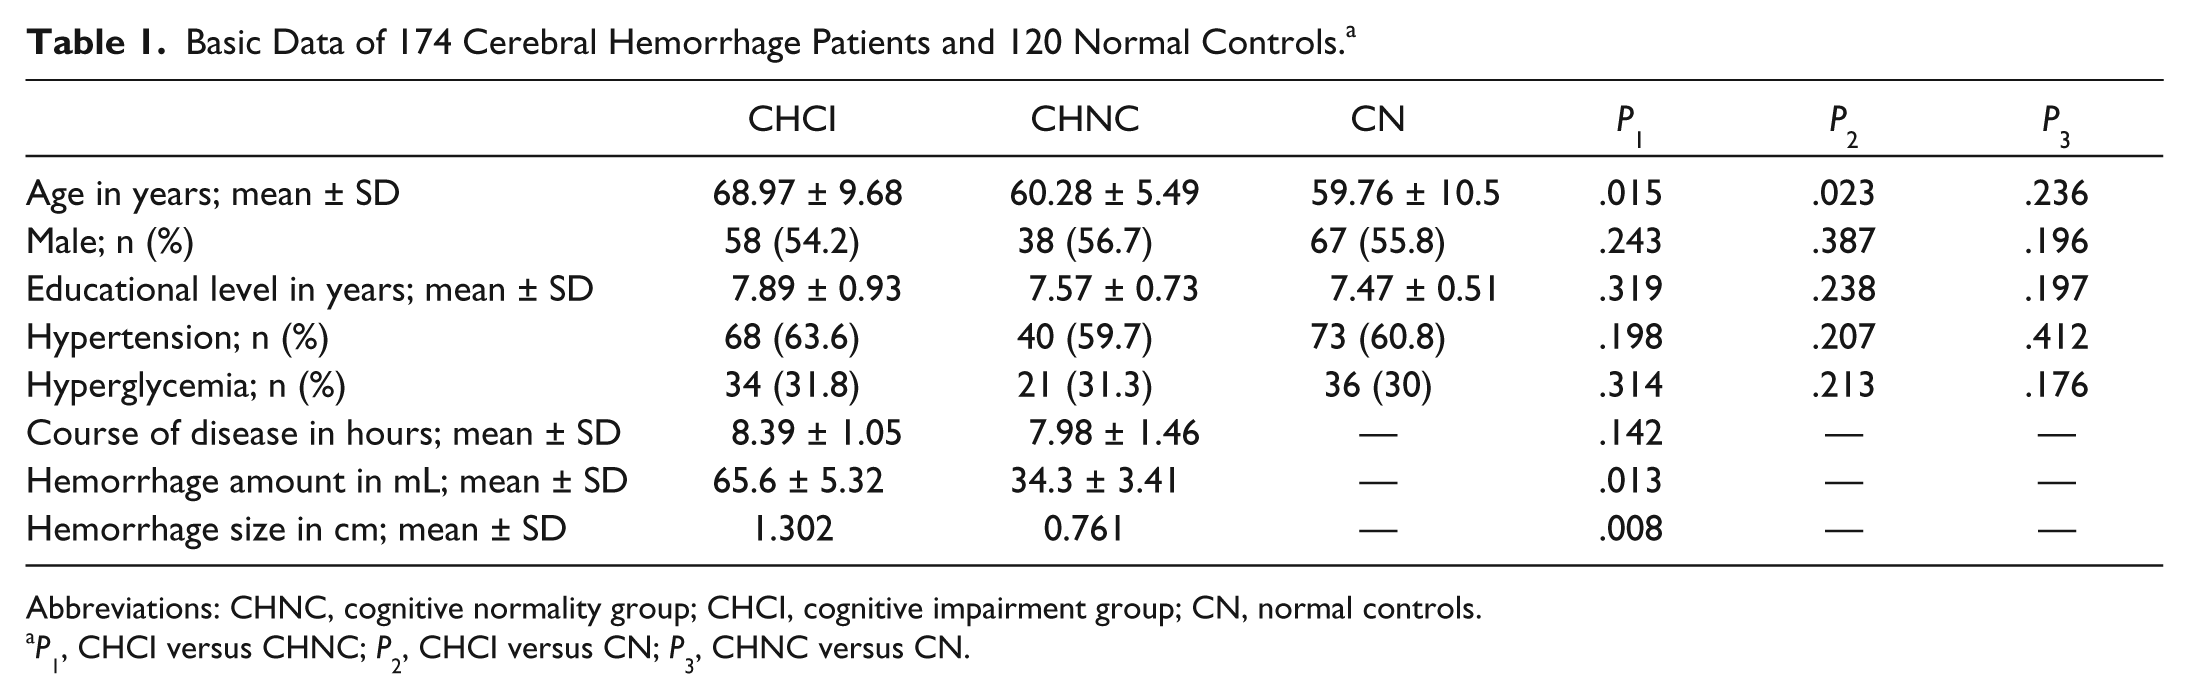
Abbreviations: CHNC, cognitive normality group; CHCI, cognitive impairment group; CN, normal controls.
P1, CHCI versus CHNC; P2, CHCI versus CN; P3, CHNC versus CN.
Results
EEG Spectral and Relative Beta Power
According to the EEG spectral profiles, we found that the power spectrum of beta frequency range in CHCI group was decreased significantly compared with the CHNC and CN groups (Figure 1), but no significant differences were observed between the CHNC and CN groups (Figure 1).
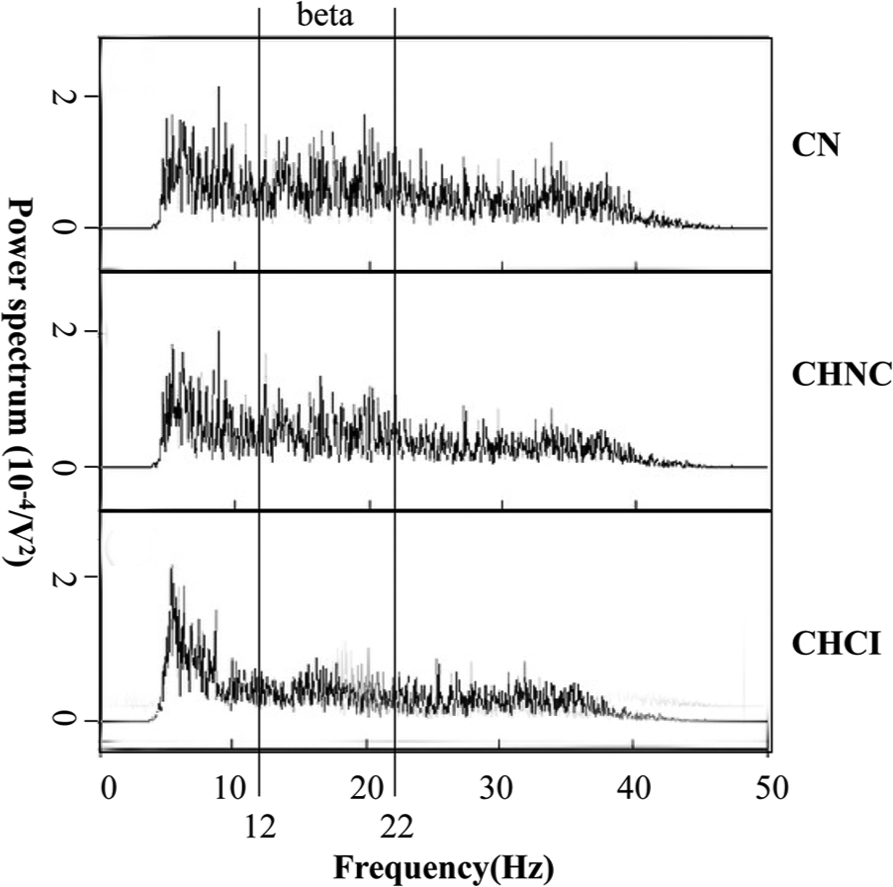
EEG spectral profiles of the 3 groups.
Table 2 shows that EEG beta relative power in CHCI patients decreased significantly (0.793 ± 0.176 µV2) compared with the CHNC group (1.589 ± 0.205 µV2; P < .01) or the CN group (1.651 ± 0.185 µV2; both Ps < .01; Figure 1 and Table 2). In Figure 2, relative beta power values for CHNC group were closely aligned with those for the CN group. Thus, there were no significant differences between CHNC and CN groups (P > .05). We also analyzed the other bandwidths, but no significant differences between the 3 groups were observed (data not shown).
Relative Beta Power Analysis.
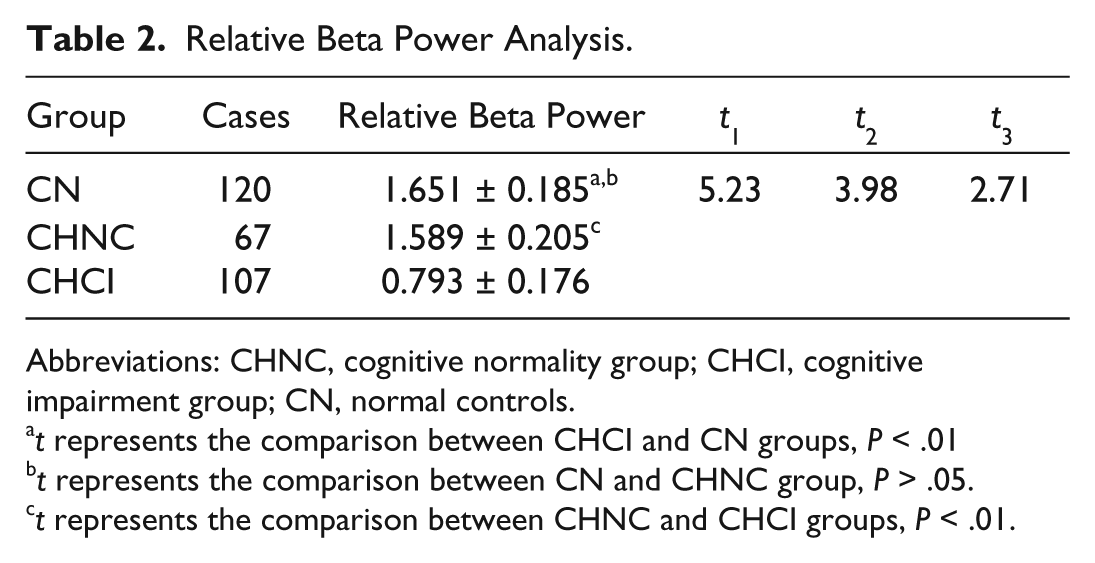
Abbreviations: CHNC, cognitive normality group; CHCI, cognitive impairment group; CN, normal controls.
t represents the comparison between CHCI and CN groups, P < .01
t represents the comparison between CN and CHNC group, P > .05.
t represents the comparison between CHNC and CHCI groups, P < .01.
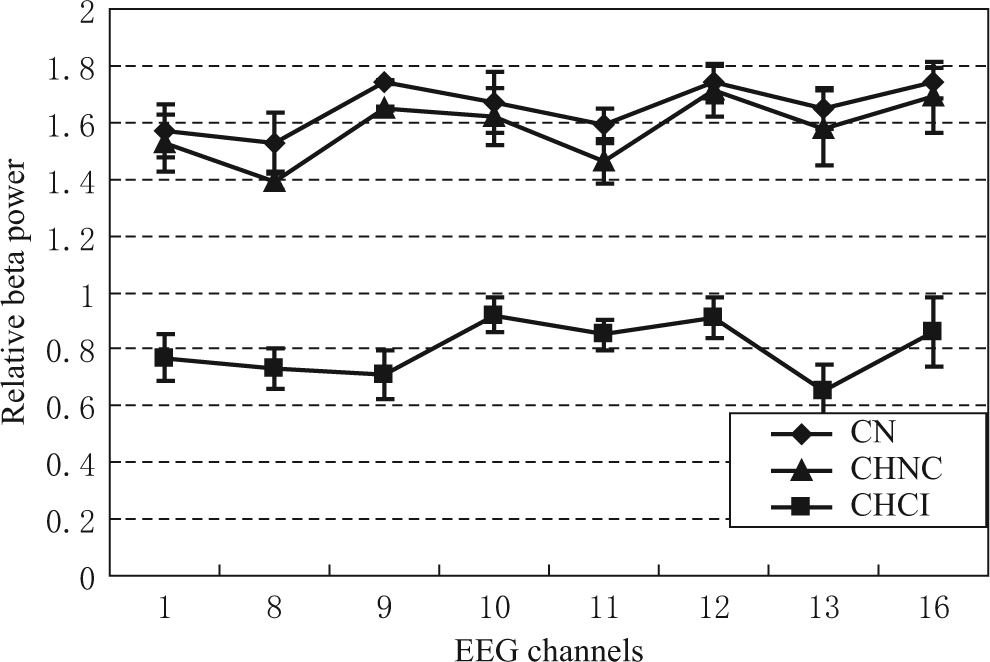
Relative beta power for the 3 groups.
MoCA score
The MoCA scores for the 3 groups, both at the time of EEG and 12 weeks after the hemorrhage, were assessed (Table 3). At the time of EEG, the CHCI and CHNC patients had significantly lower MoCA scores (14.53 ± 0.84 and 19.43 ± 2.05, respectively) compared with the CN group (33.34 ± 2.16; both Ps < .01). The MoCA scores of CHCI patients were also significantly lower compared with those of the CHNC patients (P < .05). After 12 weeks, the CHNC group improved their MoCA scores significantly compared with their scores at the time of EEG (from 19.43 ± 2.05 to 29.51 ± 1.78; P = .017). The MoCA scores of patients in the CHCI group indicated only a little improvement compared with the scores at the time of EEG (from 14.53 ± 1.73 to 16.13 ± 0.84; P = .063).
MoCA Assessment in All Groups.
Abbreviations: CHNC, cognitive normality group; CHCI, cognitive impairment group; CN, normal controls.
Relative Beta Power Correlated With Hemorrhage Region, Amount, Size, and Patients’ Age
Figure 3 indicates that there was a significant negative correlation between beta power and hemorrhage region (r = −0.91888, P < .001), patients’ age (r = −0.80365, P < .001), hemorrhage size (r = −0.78569, P < .001), and amount (r = −0.84961, P < .001). There was no significant correlation between age and beta power in the CN group (r = −0.0914, P > .05; Figure 3E). The correlations between beta power and hypertension, hyperlipemia, and sexuality were also analyzed, but no significant correlations were observed (data not shown).

Correlations between relative beta power and cerebral hemorrhage characteristics. A. Correlation between beta power and hemorrhage region; B. Correlation between beta power and age; C. Correlation between beta power and hemorrhage size; D. Correlation between beta power and hemorrhage amount. E. Correlation between beta power and age in the CN group.
Correlations Between MoCA Score and Relative Beta Power at the Time of EEG or After 12 Weeks
Figure 4 shows that there is no correlation between the MoCA score and relative beta power at the time of EEG (r = 0.31678, P > .05), but a significant correlation is seen after 12 weeks (r = 0.92065, P < .01).
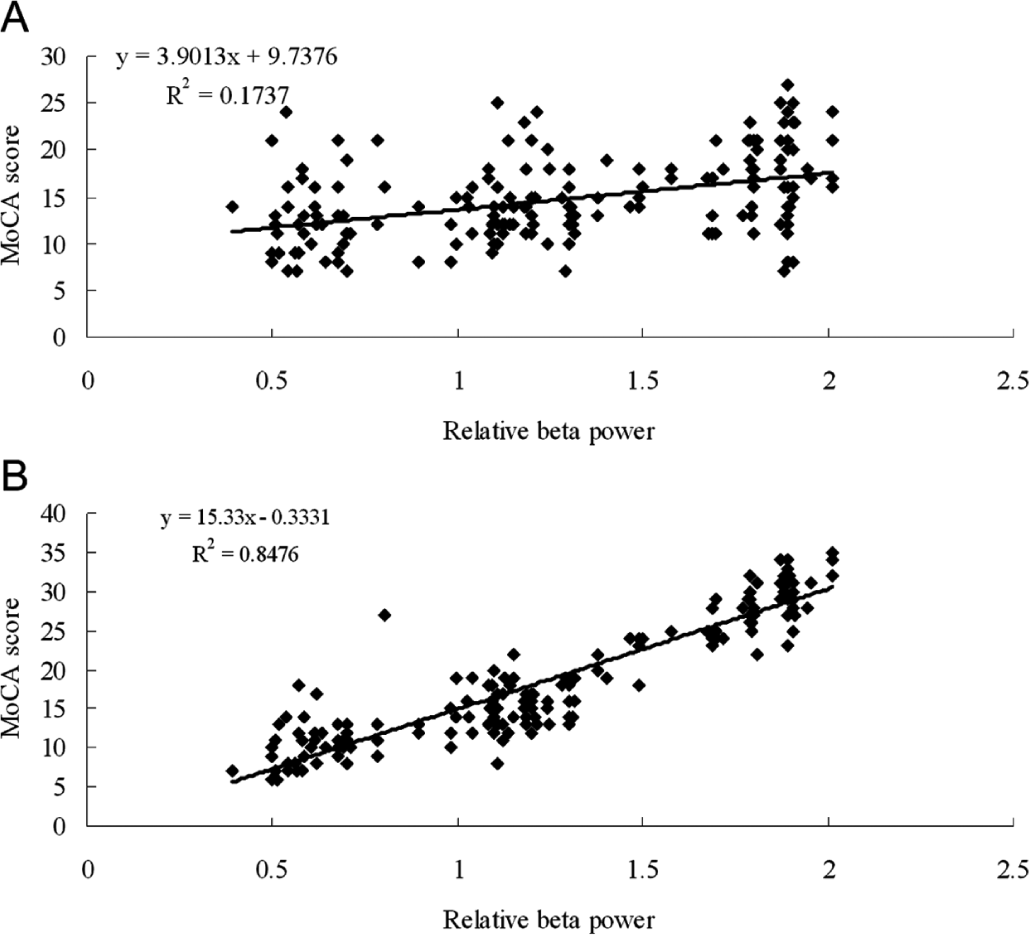
Correlations between relative beta power and MoCA scores at the time of EEG (A) and after 12 weeks (B).
Clustering Analysis
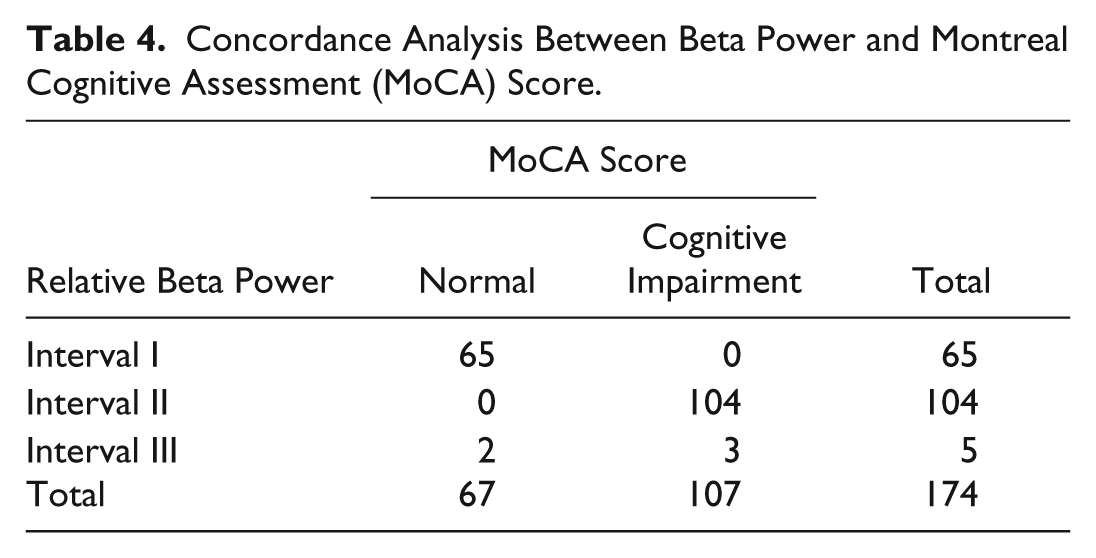
To observe the difference directly, we have illustrated the beta power of 174 cerebral hemorrhage patients from the highest channels (1, 10, and 12), on a 3-dimensional graph (Figure 5). The relative beta power from 65 cases out of the total cognitive normality post-cerebral hemorrhage cases (67 for MoCA) were distributed in interval I [0.8, 1.5]; and 104 cases out of the total cognitive impairment post-cerebral hemorrhage cases (107 for MoCA) were distributed in interval II [0, 1.0] (Table 4, Figure 5). Therefore, 2 cognitively normal and 3 cognitively impaired patients distributed in interval III [1.0, 1.2], which were relatively far apart from both convergence centers.
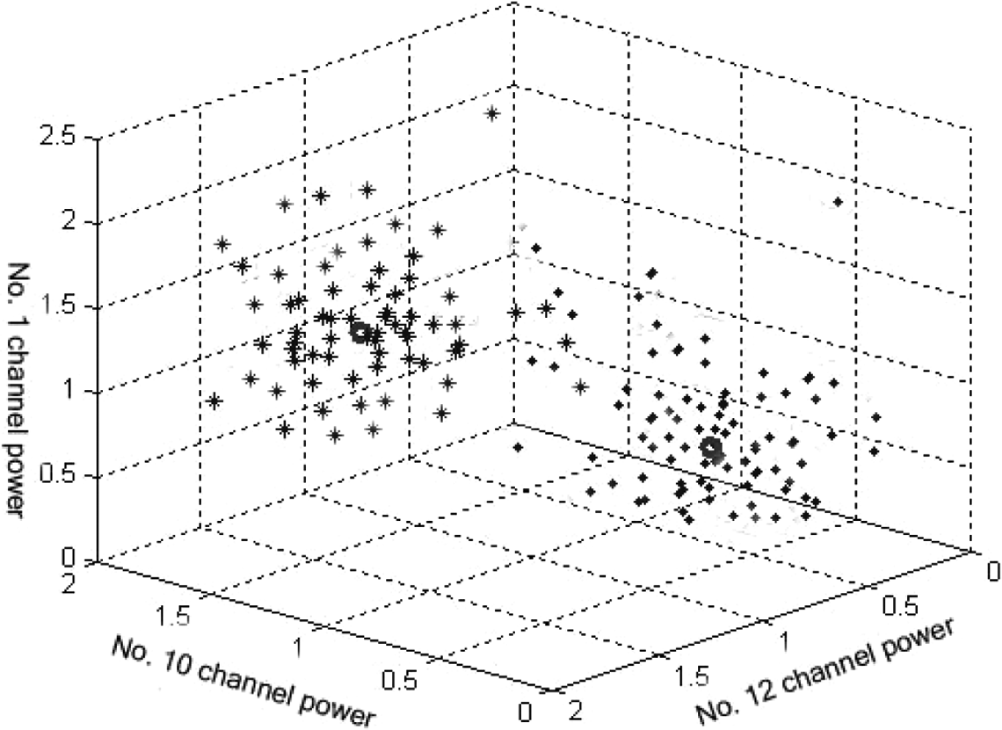
Three-dimensional display of the beta power.
Concordance Analysis Between Beta Power and Montreal Cognitive Assessment (MoCA) Score.
Concordance Analysis
According to the clustering analysis, we speculated that there may be a better concordance between K-means clustering algorithm–calculated beta power and MoCA scoring. Thus, we selected 2 specific convergence intervals I and II, and compared the clustering results with MoCA scoring (Table 4). By comparing EEG beta power with MoCA scores, 65 cognitively normal cases were consistent with MoCA scoring, and the sensitivity was 97%. A total of 104 cognitively impaired cases were consistent with MoCA scoring, and the sensitivity was 97.2%. According to kappa analysis, we found that there was a better concordance between beta power and MoCA scoring for cognitive impairment (κ = .904, P < .001). Through the McNemar paired χ2 test, we found that there were no significant differences between beta power and MoCA scoring for cognitive impairment post -cerebral hemorrhage (Table 4, P = .297).
Discussion
In recent years, exploring testing methods for cognitive impairment caused by cerebral hemorrhage has become significant. A series of standardized diagnostic tests for cognitive impairment has been applied for brain or degenerative diseases. The Mini Mental State Examination (MMSE) scale has been applied to assess cognitive impairment of patients with cerebral hemorrhage. 14 Other scientists found that MoCA is more valuable than MMSE in predicting vascular cognitive impairment. 15 Zadikoff et al 16 also found that, compared with the MMSE, MoCA is more sensitive in identifying early cognitive impairment in Parkinson’s disease. In the present study, MoCA scoring was used to study cognitive impairment post-cerebral hemorrhage.
EEG can reflect cognitive impairment caused by various kinds of diseases, such as cerebral infarcts, Alzheimer’s disease, and Parkinson disease.17,18 Giannakopoulos et al 19 used EEG to identify the subtle functional changes preceding metabolic deficits in cognitive impairment. Automated pattern recognition techniques of EEG can also identify mild cognitive impairment progressing to other diseases. 20 Our previous experiments have indicated that there were no significant correlations between other bandwidths and MoCA scores. Therefore, we used beta to analyze the relationship between EEG and MoCA. Correlation analysis indicated that beta power was negatively correlated with hemorrhage region, patients’ age, hemorrhage size, and hemorrhage amount. Poels et al 21 also found cerebral microbleeds, with different hemorrhage amount, size, and region, jointly contribute to cognitive impairment, results that are consistent with ours.
In the present study, patients with cerebral hemorrhage were divided into 2 subgroups based on their EEG profiles using the K-means clustering technique. Thus, 65 of 67 cerebral hemorrhage patients without cognitive impairment were categorized as members of subgroup 1 (interval I), and 104 of 107 cerebral hemorrhage patients with cognitive impairment were categorized as subgroup 2 (interval II). The above classifications were performed by using the 8 EEG channels exhibiting the largest differences in relative beta power. We reflected the beta power of patients on the highest channels (1, 10, and 12) displaying the 3-dimensional graph to observe the difference directly. The κ value greater than .75 was thought to be a better concordance. Therefore, K-means clustering analysis shared a better concordance with MoCA scoring (κ = .904) of cognitive impairment, and sensitivities achieved were 97.2% and 97%, respectively.
We found that beta power abnormalities may be effective in modifying those cerebral hemorrhage patients who were most likely to progress to cognitive impairment from those less likely to do so in the early stage. This kind of function of beta power was consistent with previous reports distinguishing the cognitive impairment of patients with Alzheimer’s disease. 13 We found that analysis of beta power in interval III (between interval I and interval II) identified 3 patients as having cognitive impairment by MoCA scoring, but they did not progress to cognitive impairment in follow-up. Whereas 2 cerebral hemorrhage patients in beta power interval III were assessed as cognitive normal by MoCA, they developed cognitive impairment in follow-up. We speculated that EEG beta power may exclude false diagnosis using MoCA assessment.
EEG recordings were selected within 24 hours post-cerebral hemorrhage, because the computed tomography scan is often not informative, and MRI was not available on the first day. So it is difficult to identify cognitive impairment post-cerebral hemorrhage early by using computed tomography or MRI. This study demonstrates that EEG can predict cognitive impairment at the acute stage of cerebral hemorrhage. But whether EEG can be used for early identification of long-term cognitive impairment of patients with cerebral hemorrhage, needs an extensive study.
In summary, the analysis of EEG (beta power) abnormalities holds considerable promise to assess cognitive impairment after cerebral hemorrhage. Cognitive impairment was negatively correlated to hemorrhage region, size, amount, and patients’ age.
Footnotes
Declaration of Conflicting Interests
The author(s) declared no potential conflicts of interest with respect to the research, authorship, and/or publication of this article.
Funding
The author(s) received no financial support for the research, authorship, and/or publication of this article.