






Abstract
Alzheimer’s disease accounts for 60% of all dementia. Numerous biomarkers have been developed that can help in making an early diagnosis. The P300 is an event-related potential that may be abnormal in Alzheimer’s disease. Given the possible association between P300 amplitude and Alzheimer’s disease and the need for biomarkers in early Alzheimer’s disease, the main purpose of this meta-analysis and meta-regression was to characterize P300 amplitude in probable Alzheimer’s disease compared to healthy controls. Using online search engines, we identified peer-reviewed articles containing amplitude measures for the P300 in response to a visual or auditory oddball stimulus in subjects with Alzheimer’s disease and in a healthy control group and pooled effect sizes for differences in P300 amplitude between Alzheimer’s disease and control groups to obtain summary effect sizes. We also used meta-regression to determine whether age, sex, educational attainment, or dementia severity affected the association between P300 amplitude and Alzheimer’s disease. Twenty articles containing a total of 646 subjects met inclusion and exclusion criteria. The overall effect size from all electrode locations was 1.079 (95% confidence interval = 0.745-1.412, P < .001). The pooled effect sizes for the Cz, Fz, and Pz locations were 1.226 (P < .001), 0.724 (P = .0007), and 1.430 (P < .001), respectively. Meta-regression showed an association between amplitude and educational attainment, but no association between amplitude and age, sex, and dementia severity. In conclusion, P300 amplitude is smaller in subjects with Alzheimer’s disease than in healthy controls.
Introduction
Up to 24 million people worldwide have some type of dementia, 1 a number expected to double every 20 years through at least 2040. 1 Alzheimer’s disease is the most common type of dementia, accounting for up to 60% of all dementia cases. The definitive diagnosis of Alzheimer’s disease requires pathological confirmation by autopsy or brain biopsy 2 ; presumed cases of Alzheimer’s disease without pathological confirmation are considered to be probable Alzheimer’s disease. Nonetheless, anatomical changes in global brain and hippocampal volume, medial–temporal volume loss, levels of amyloid-β peptide 42, and levels of phosphorylated tau protein are important biomarkers of Alzheimer’s disease 3 that can aid in clinical diagnosis. Because of the putative importance of early diagnosis of Alzheimer’s disease for treatment 2 and for understanding risk and protective factors associated with Alzheimer’s disease, techniques of early and accurate diagnosis are seen as increasingly important.
Several electrophysiological changes occur in Alzheimer’s disease that may have utility for its diagnosis, including variations in theP300 component of event-related potentials. A marker of cognitive activity, 4 the P300 waveform is an event-related potential that occurs anywhere from 250 to 500 ms 5 after an infrequent 6 auditory, visual, or somatosensory stimulus, 7 which can be presented through an oddball paradigm in which subjects are instructed to attend to the infrequent target stimulus while other stimuli are also presented.
Moreover, the P300 amplitude appears related to working memory, 8 and the P300 amplitude correlates positively with memory ability in healthy controls, 8 whereas P300 amplitude decreases are associated with decreased brain activation 9 and cognitive dysfunction.10,11The association between both memory and cognitive dysfunction and P300 amplitude suggests that P300 amplitude is likely to be reduced in Alzheimer’s disease. Furthermore, the P300 appears to be independent of attention, making it a means of assessing people who are cognitively impaired. 4 TheP300 amplitude also decreases with age, an effect that appears exaggerated in Alzheimer’s disease. 12 The P300 may be more sensitive to cognitive change than is neuropsychological testing 13 and has been used to study age-related cognitive decline and dementia. 14 In fact, several studies have found evidence of reduced P300 amplitude in Alzheimer’s disease. 15
Given the association between reduced P300 amplitude and Alzheimer’s disease and the need for biomarkers in early Alzheimer’s disease, the main purposes of this meta-analysis and meta-regression are to characterize P300 amplitude in probable Alzheimer’s disease compared with healthy controls, to estimate the extent of the difference in P300 amplitude and the consistency of the amplitude difference across studies, and to identify any factors that may be associated with P300 amplitude among patients with Alzheimer’s disease.
Methods
Identification and Selection of Source Studies
Using variations of the terms Alzheimer’s disease, P300, ERP, EEG, and amplitude, we searched the online database of Medline, Web of Knowledge, and PsychINFO for peer-reviewed articles in English containing amplitude measures for the P300 in response to a visual or auditory oddball stimulus in subjects with Alzheimer’s disease, with studies gathered through January 2014. We initially reviewed article titles and abstracts to identify potential source studies. After reviewing the full text of all the identified articles found in our search, we also reviewed the reference lists for other relevant articles.
Inclusion and Exclusion Criteria
We included only those studies that met the following inclusion criteria: use of either a visual or auditory oddball paradigm to compare subjects diagnosed with probable Alzheimer’s disease with an age-matched healthy control group in a peer-reviewed study in English and data for sample sizes, mean P300 amplitude and either its standard deviation or standard error, in both female and male subjects. In some cases, we measured and interpreted P300 mean amplitudes and standard errors and standard deviations from graphs because the actual numbers were not reported in the source studies. In one case, the data for the Alzheimer’s disease group and the data for the healthy control group reported in the source article’s table appeared to be reversed according to the graph in the same article and to the ensuing discussion. In this case, we classified the data according to the study’s graph and discussion. In the included source studies, Alzheimer’s disease was diagnosed by a variety of diagnostic criteria, including the Diagnostic and Statistical Manual of Mental Disorders, fourth edition, the National Institute of Mental Health, the National Institute of Neurological and Communicative Disorders and Stroke, the Alzheimer’s Disease and Related Disorders Association criteria or by a subject’s involvement in an Alzheimer’sclinic. Exclusion criteria were psychiatric or other neurological disorders and cognitive impairment from another disorder or condition.
Data Extraction
Four trained members of the research group independently evaluated each source study and extracted and placed into a spreadsheet the name of the first author and year of publication, sample size, mean and standard deviation (or standard error) of the amplitude of the P300 waveform for both the Alzheimer’s and control groups, diagnostic criteria used in each source study, mean age, percentage male, mean education level, and mean Mini-Mental State Examination (MMSE) of the Alzheimer’s sample. In cases of disagreement about the extracted data, the extractors reevaluated as a group the source study in question to resolve any discrepancies. We extracted the P300 amplitude at all available electrode sites, including the midparietal (Pz), frontal (Fz), and central (Cz) locations. In one source study, 16 there were data reported for 3 different degrees of difficulty for the task used to elicit the P300; we used the data from the easiest of the 3 tasks based on the assumption that this would be the task least likely to differentiate between Alzheimer’s disease and healthy controls, making the overall estimates of the effect size more conservative.
Statistical Analysis and Data Synthesis
We estimated effect sizes by 2 methods. First, we calculated a summary effect size for P300 amplitude from each individual source study from all of the electrode locations a particular study reported and then combined these into one summary effect size. For studies that elicited the P300 using both auditory and visual stimuli, we combined the results from the auditory and visual stimuli into one summary effect size for that particular study. In addition, from those studies reporting data for either for Pz, Fz, or Cz, we calculated a summary effect size for each of these electrode locations individually. In each effect size calculation, we used the Hedges g unbiased effect size statistic, 17 which corrects for small sample sizes by multiplying Cohen’s d effect size by the J correction factor. We also calculated Q statistics to assess heterogeneity across the source studies. In both analyses, we used a random-effects model because we assumed that the true effect size may have differed between the source studies 17 given the potential for differences between studies in diagnostic accuracy and Alzheimer’s disease progression.
We assessed the potential for publication bias using two techniques: the classic failsafe N test to estimate the number of studies with a mean effect size of zero that would be needed to increase the P value to greater than .05 and the trim and fill test, which iteratively removes small positive studies to create a symmetrical funnel plot and then adds the small positive studies and corresponding small negative studies to estimate a the difference between the original effect size and the new effect size assuming that the smaller the difference between the original and new effect size the less potential for publication bias. 17
We also did 4 separate meta-regressions of Alzheimer’s subject characteristics on effect size using the method-of-moments technique, which is a random-effects model. 17 The 4 potential moderating variables were source study level average age, percentage male, average education level, and average MMSE score, each variable individually regressed against the effect size for P300 amplitude for each source study. We used Comprehensive Meta-Analysis 2 (Biostat, Englewood, NJ) for all calculations.
Results
We reviewed titles and abstracts of the initially identified studies and retrieved the full study article for 111 studies that based on the information contained in the title and abstract might be eligible for inclusion. Of these, we excluded 91 articles: 20 articles because they were not original studies or did not include EEG data; 50 studies because they did not report data for P300 amplitude; 9 studies because they used subjects who did not have probable Alzheimer’s disease or used subjects with mild cognitive impairment; and 12 studies for a variety of other reasons, such as the article written in a language other than English, lack of a control group, and stimulus in a sensory modality other than auditory or visual (Figure 1). We included 20 papers in the meta-analysis.8,12,13,16,18-33
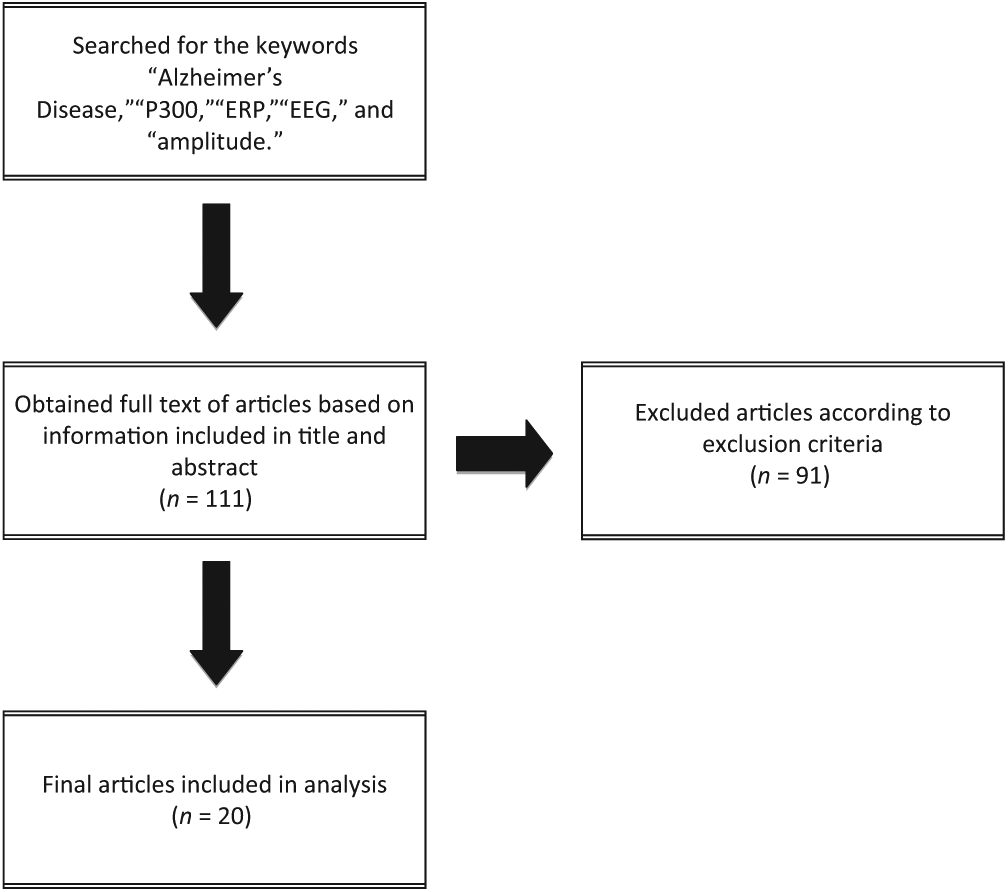
Flowchart delineating the study selection process.
The 20 included studies contained 307subjects with Alzheimer’s disease and 339 healthy controls for a total of 646 subjects (Table 1). The average of the mean ages across the source studies for the Alzheimer was 70.2 years. Percentage male, average educational attainment, and MMSE scores for the source studies are shown in Table 2.
Characteristics of Source Studies.
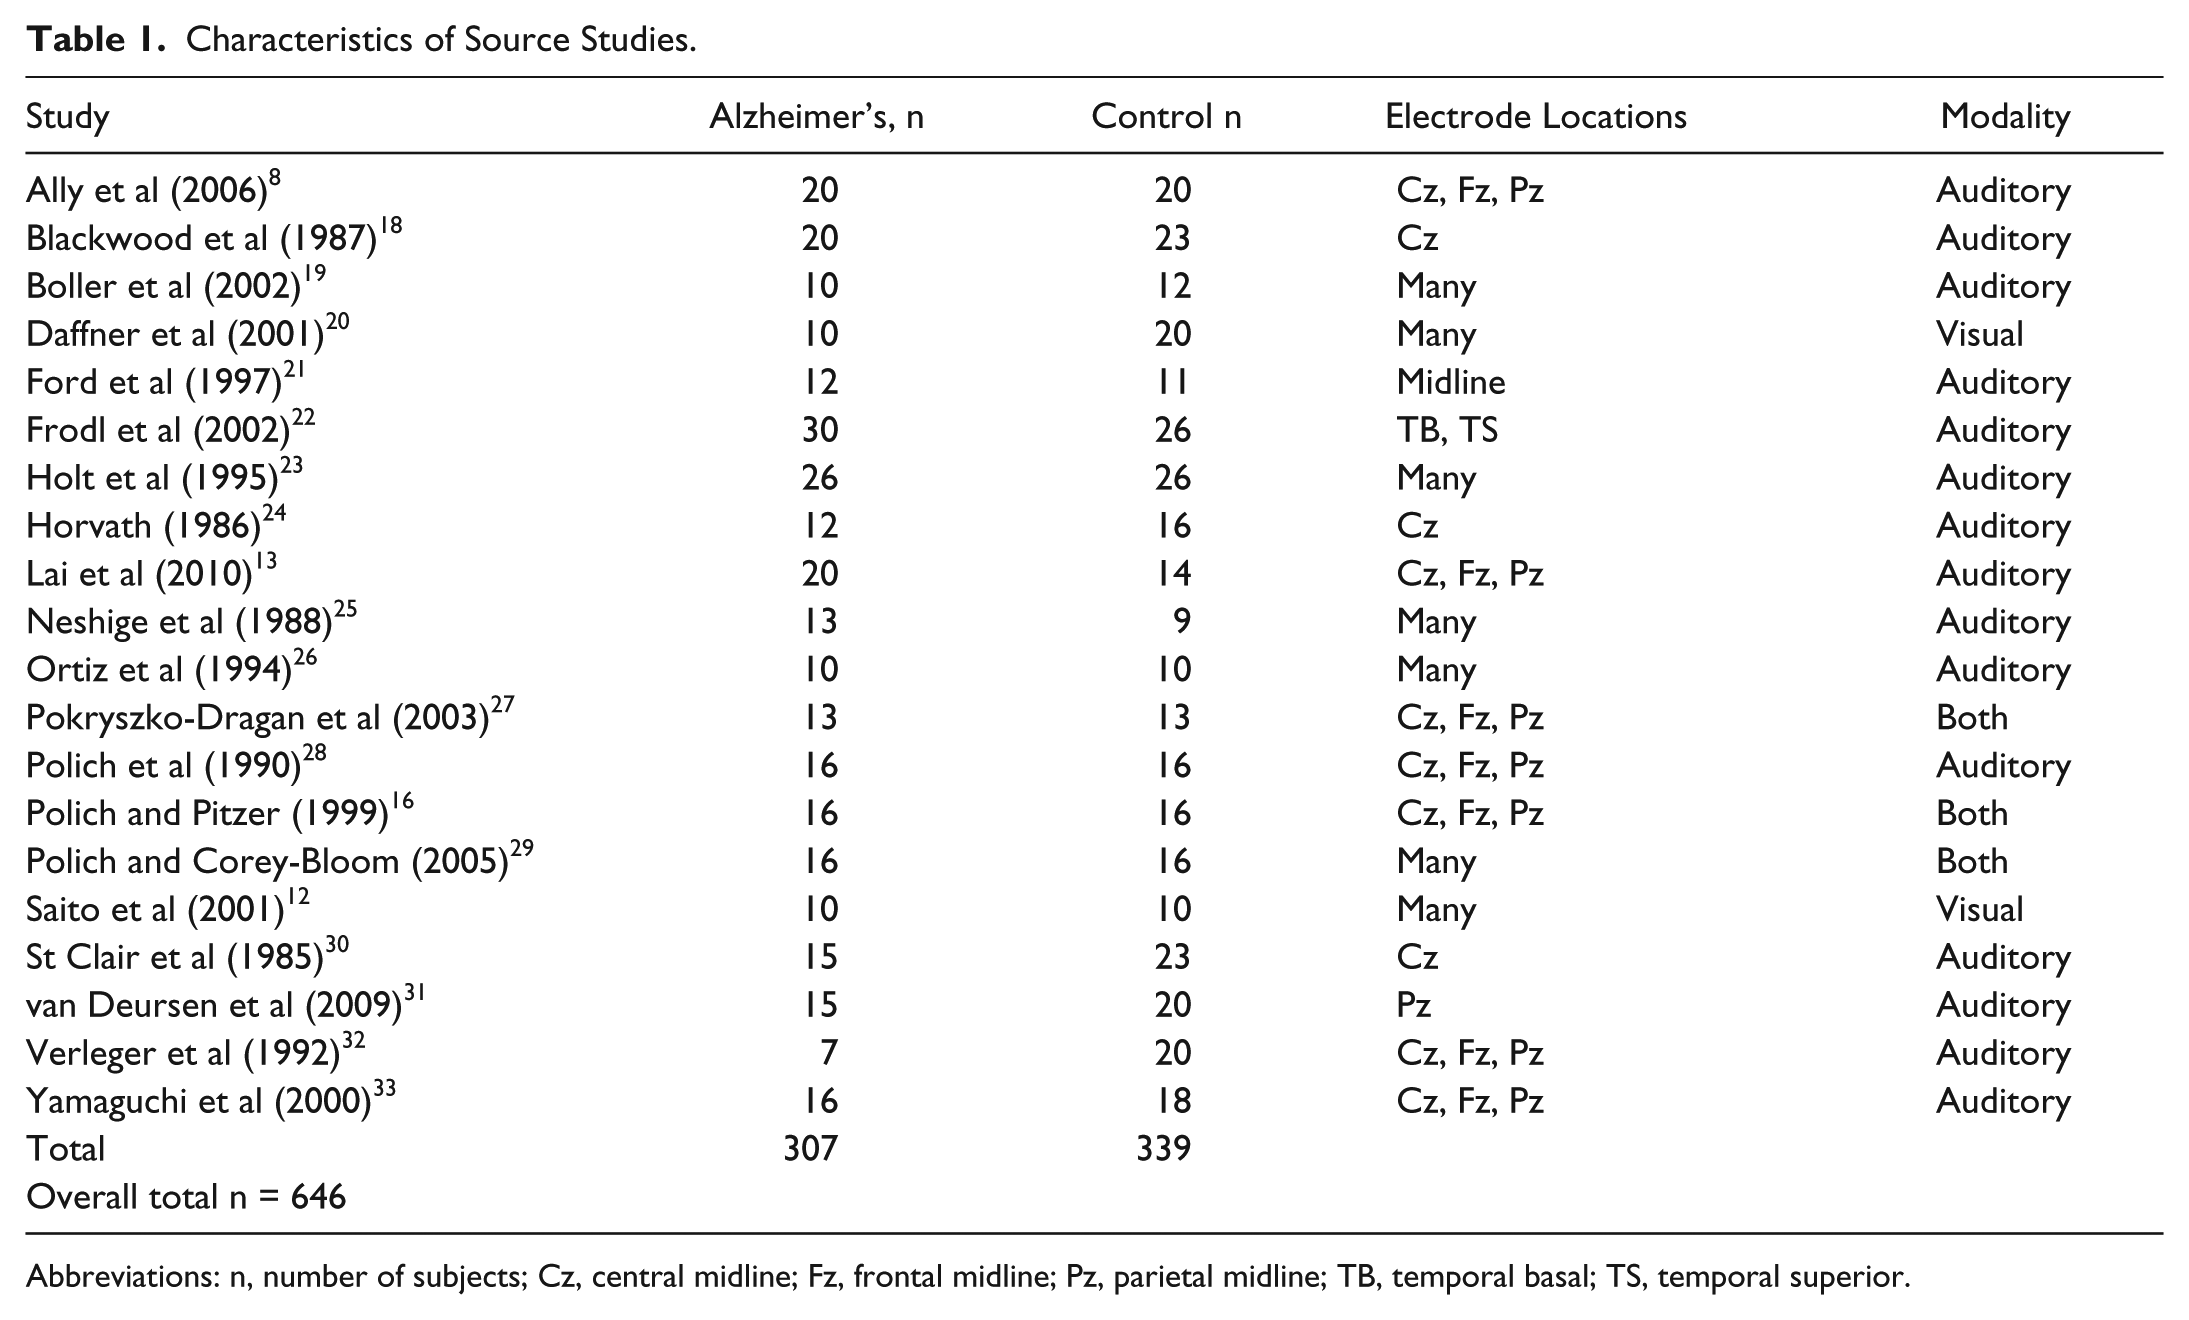
Abbreviations: n, number of subjects; Cz, central midline; Fz, frontal midline; Pz, parietal midline; TB, temporal basal; TS, temporal superior.
Characteristics of Alzheimer’s Disease Groups in Each Source Study.
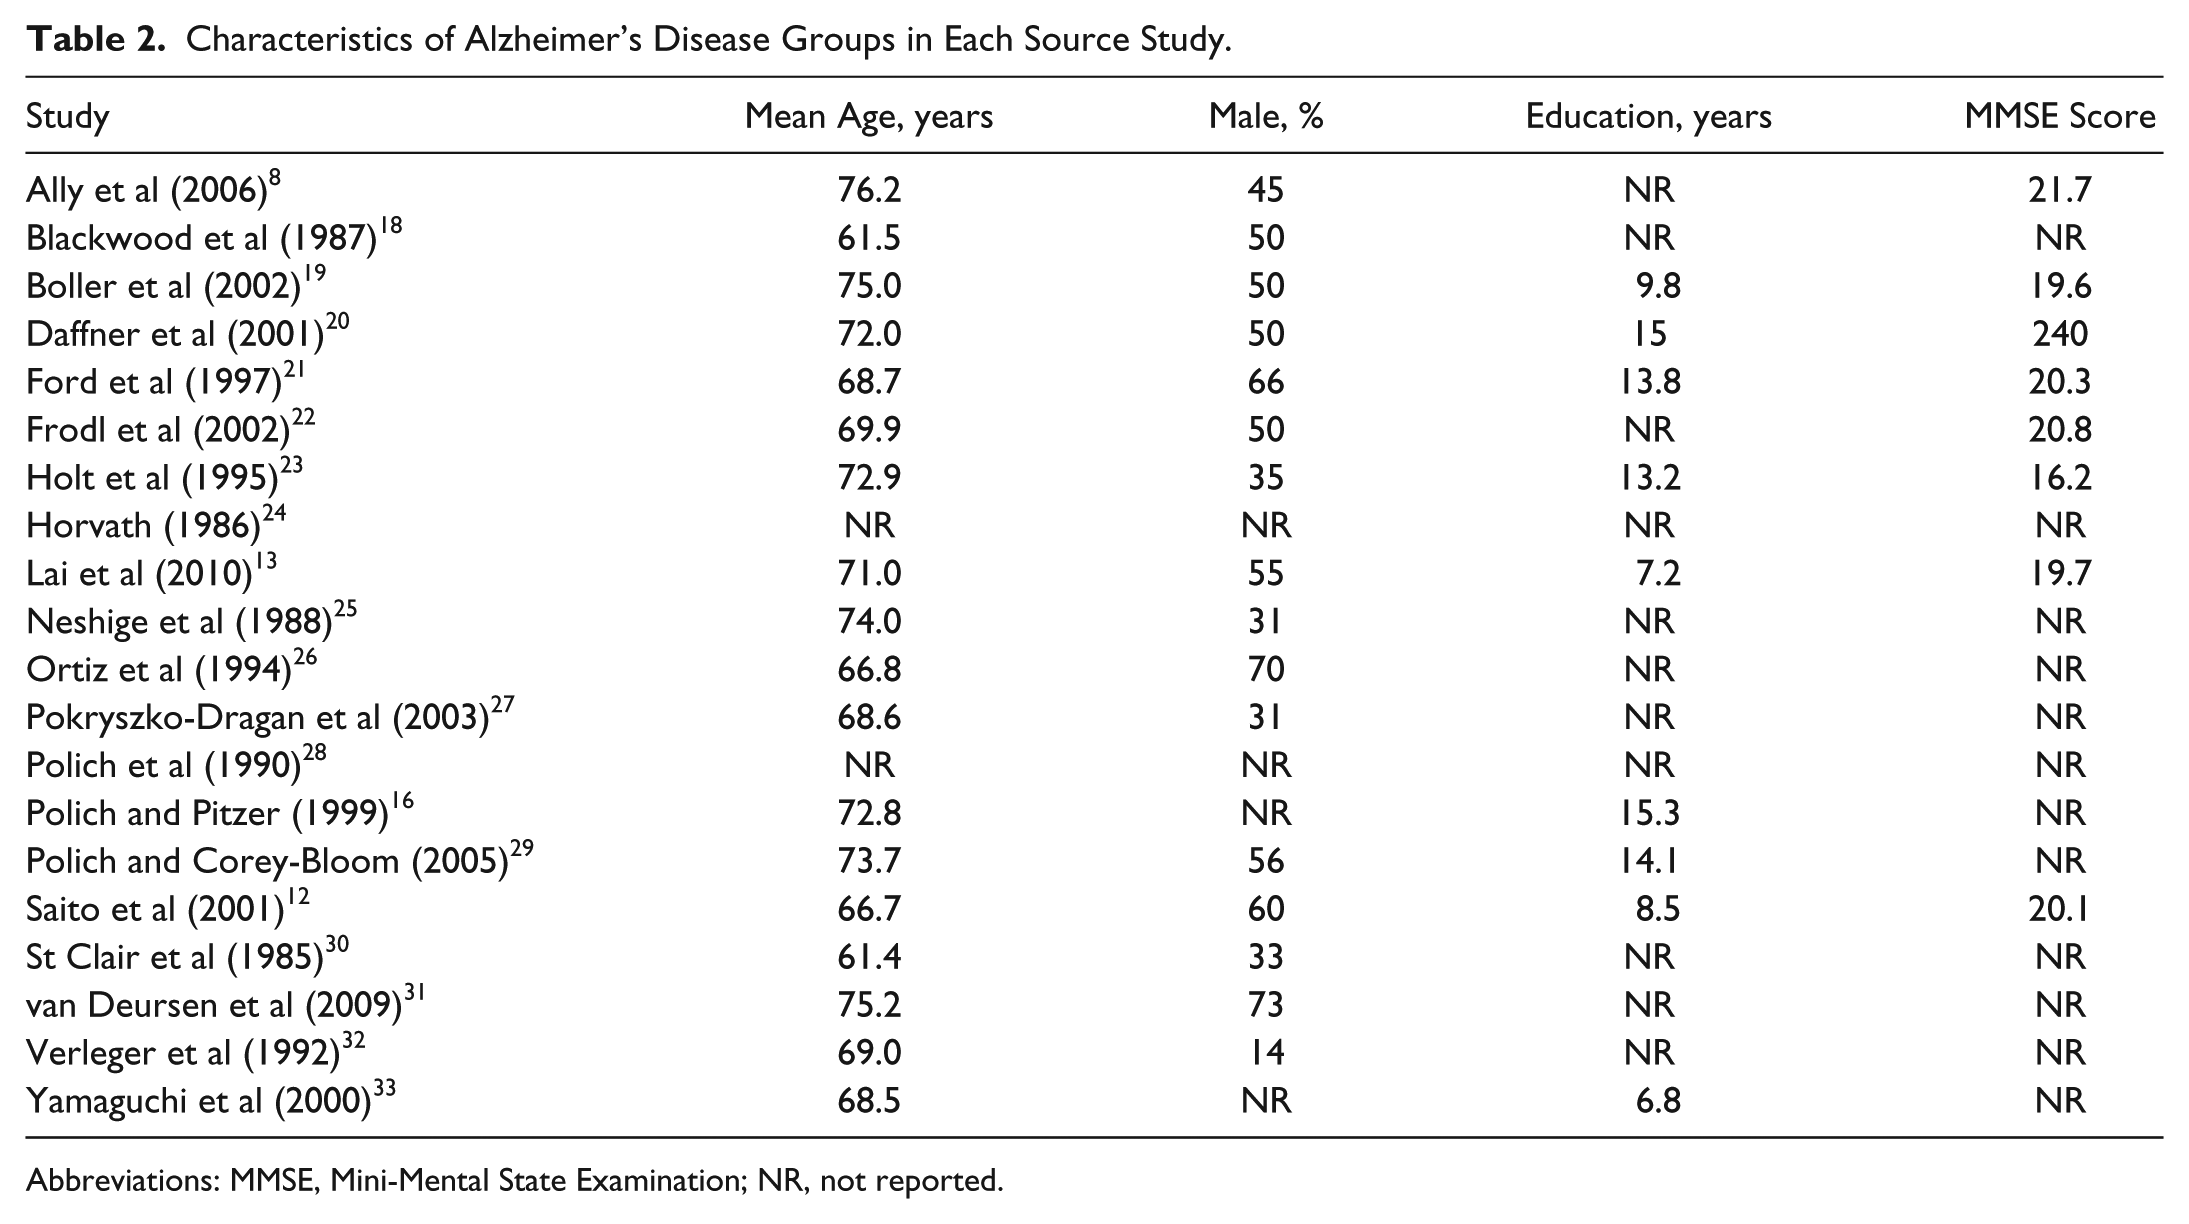
Abbreviations: MMSE, Mini-Mental State Examination; NR, not reported.
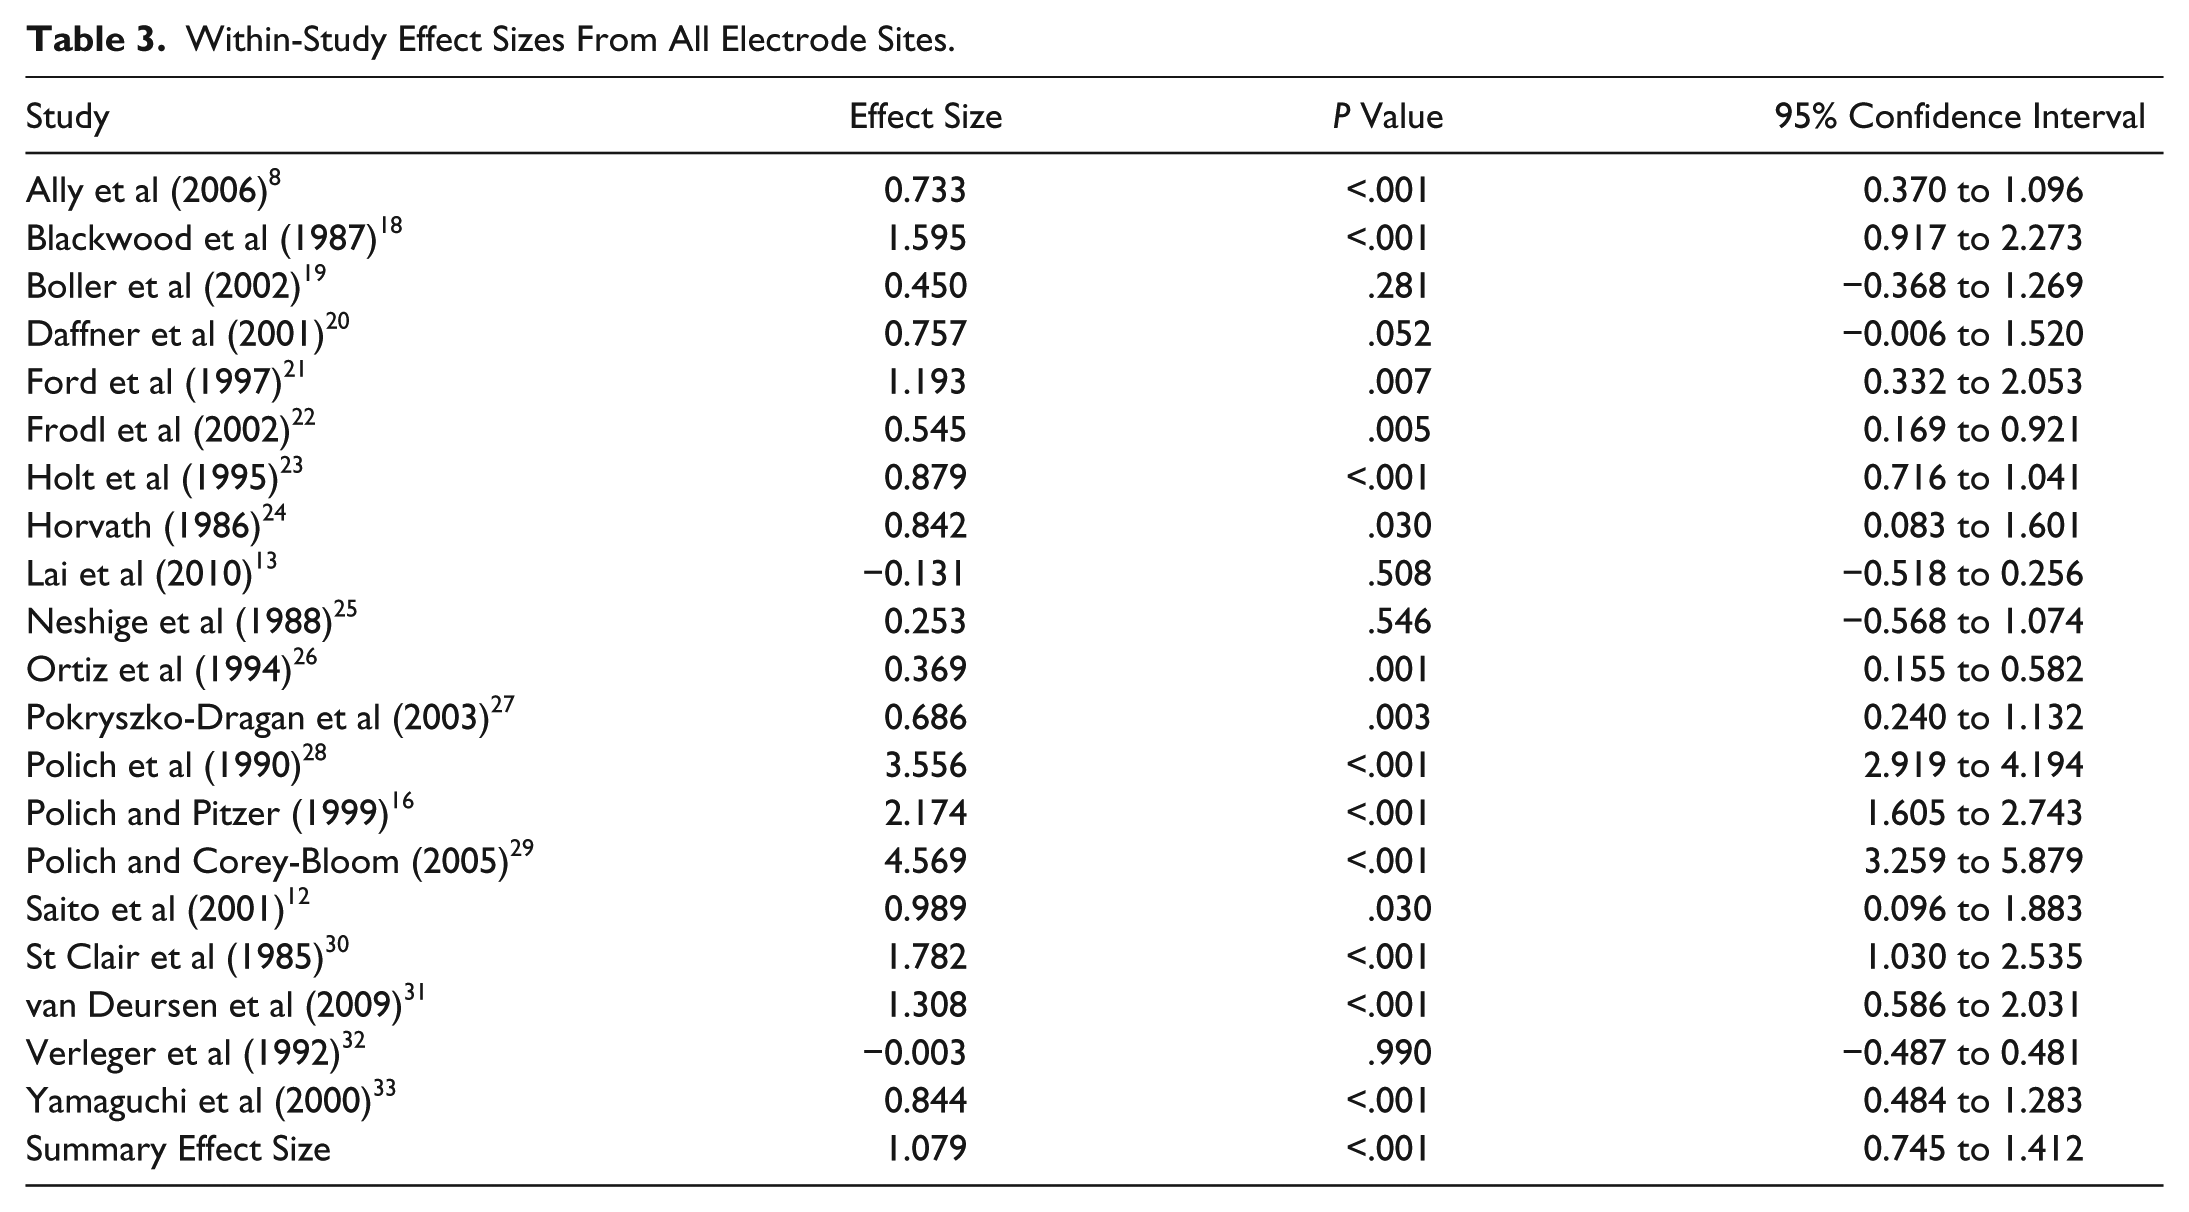
In the meta-analysis of the effect sizes obtained by pooling the effect sizes from all electrode locations reported in the source studies, the Hedges g was 1.079 (95% confidence interval = 0.745-1.412; P < .001 (Table 3). The associated Q value was 199.228 (P < .001), which indicated significant heterogeneity between the source studies. The I2 value was 90.463, indicating that more than 90% of the variance among the source studies was real. 17 The classic failsafe test showed that an additional 1463 studies with an average effect size of zero would be needed to bring the P value of the Hedges g effect size to greater than .05. In the trim and fill analysis, there was no difference between the original and adjusted effect sizes.
Within-Study Effect Sizes From All Electrode Sites.
In the meta-analysis of the 3 individual electrode locations, the Hedges g for the Cz location was 1.226 (P < .001), Q = 68.571 (P < .001). For the Fz location, the Hedges g effect size was 0.724 (P = .0007), Q = 37.690 (P < .001), and for the Pz location, the Hedges g effect size was 1.430 (P < .001), Q = 72.153 (P < .001; Table 4). Furthermore, effects sizes did not differ by electrode location (Q = 2.911, P = .233).
Pooled Effect Sizes for Cz, Fz, and Pz Locations. a

Effect size in Hedges g.
The meta-regression showed that an increase in years of education significantly predicted an increased effect size. None of the other predictors significantly predicted effect size (Table 5).
Meta-Regressions for Effect Size Against Average Age, Percentage Male, Educational Attainment, and MMSE Scores.
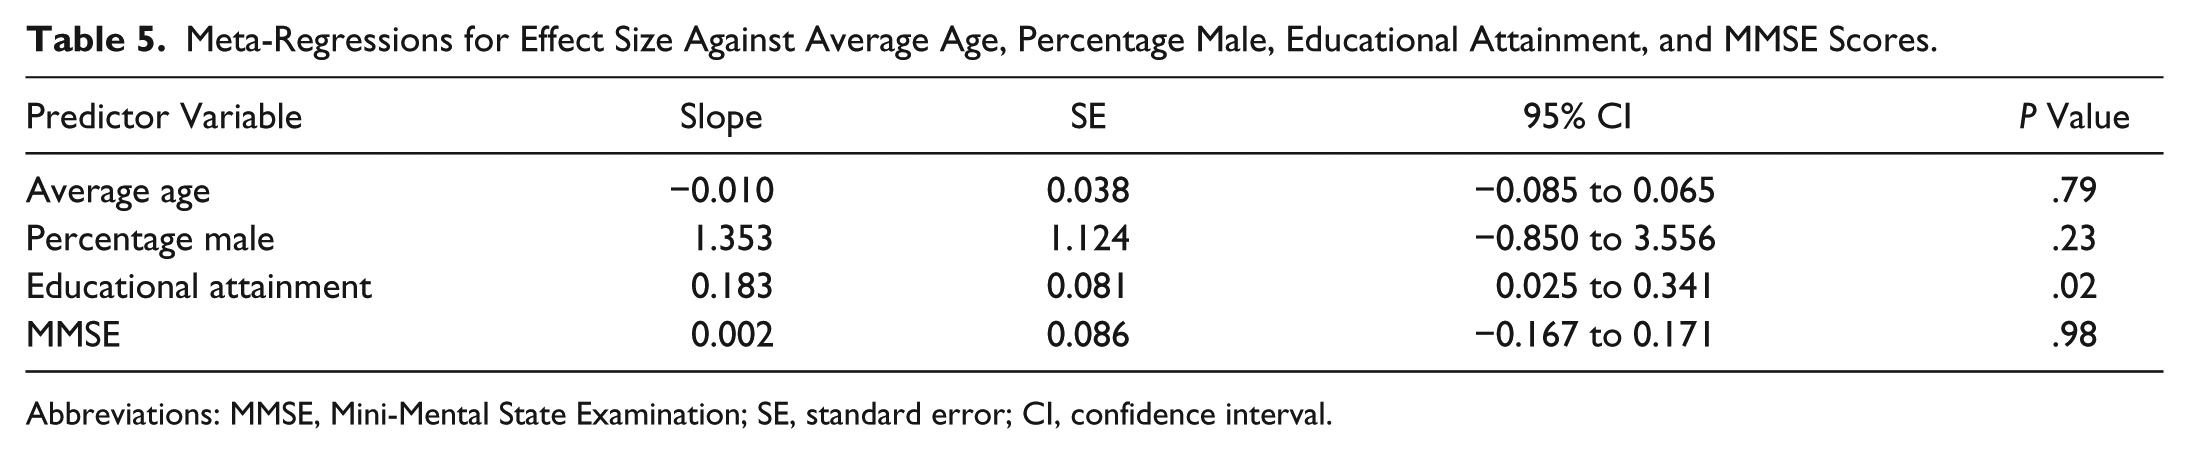
Abbreviations: MMSE, Mini-Mental State Examination; SE, standard error; CI, confidence interval.
Discussion
This meta-analysis and meta-regression contains two main findings. First, the amplitude of the P300 component of the event-related potential in response to an auditory or visual oddball stimulus averaged across different electrode sites was lower in probable Alzheimer’s disease than in healthy controls, and the amplitudes of the P300 at the Pz, Fz, and Cz sites were significantly smaller in probable Alzheimer’s disease than in healthy controls. Second, we found that of the variables we examined in an attempt to explain the large amount of variance between source studies, only years of education was significantly associated with P300 amplitude.
The summary effect size for the pooled effect sizes across all electrode sites reported in the source studies was 1.079, a value generally considered to be indicative of a large effect size. 34 Similarly, effect sizes from the Cz, Fz, and Pz sites were also medium or large. Furthermore, the effect sizes between these three sites were not statistically different from each other, implying that the probable Alzheimer’s disease at the stages reached by the subjects in the source studies was affecting widespread brain regions.
The large effect size in P300 amplitude between the group with probable Alzheimer’s disease and the healthy control group suggests that reduction in the P300 amplitude may be a consistent feature of probable Alzheimer’s disease. The large effect size in the context of considerable heterogeneity between source studies further indicates that decreased P300 amplitude is a robust feature of probable Alzheimer’s disease that is stable across different samples of probable Alzheimer’s disease. Our results differ from those of Pedroso et al, 35 who, basing their systematic review of 5 studies of P300, P3a, and P3b amplitude in Alzheimer’s disease, concluded that there was no consensus about P300 amplitude reduction in Alzheimer’s disease. The difference in the results of Pedroso et al 35 and ours could be because of our increased number of source studies and use of meta-analysis. 35
The findings of reduced P300 amplitude in Alzheimer’s disease are consistent with previous findings showing a reduction of other spontaneous and event-related oscillations in Alzheimer’s disease, including changes in delta and theta bands following an oddball stimulus. 36 In particular, delta event-related oscillatory amplitudes obtained from filtering event-related potentials after an oddball task are significantly higher in healthy controls than in subjects with Alzheimer’s disease 37 and in subjects with mild cognitive impairment. 38
Reduction in P300 amplitude has been reported in a variety of conditions, such as traumatic brain injury, 39 cigarette smoking, 40 and schizophrenia, 41 suggesting that P300 amplitude reduction is not specific for probable Alzheimer’s disease and that further investigation into differences in event-related potentials between neuropsychiatric conditions is warranted. Use of other components of the event-related potential in addition to the P300 could possibly add diagnostic precision to that obtained with just the use of the P300 alone.
Although the P300 amplitude is smaller in Alzheimer’s disease than in healthy controls, it remains unclear how the P300 in groups at risk for, but still asymptomatic for, Alzheimer’s disease compares to the two groups included in the present study. In one study, P300 amplitude was actually higher in at-risk groups, suggesting the possibility of a compensatory mechanism in a still unaffected system. 42 In contrast, Ally et al 8 found decreased P300 amplitude in subjects with a family history of Alzheimer’s disease, discrepancies that may be because of methodological issues that require additional investigation.
Of the other variables that we evaluated to attempt to explain the heterogeneity among the source studies, only years of education was significantly related to P300 amplitude reduction. Given that education is considered to be protective against dementia, 43 we had expected to find an inverse association between years of education and P300 effect size, not the positive association we actually found. However, only nine source studies reported educational data, although the range of years of education varied from a low of 6.8 to a high of 15.3 among the source studies. If future studies support a positive association between years of education and P300 effect size, one possible explanation may be that educational attainment protects against the clinical manifestations of dementia, 43 but not against the underlying pathology of dementia. That is, by the time someone with comparatively high education gets to the point of having diagnosable Alzheimer’s disease, there is more underlying pathological change as identified by P300 amplitude than for someone of comparatively low education with approximately the same severity level of Alzheimer’s disease.
In contrast to the association we found between P300 amplitude and educational attainment, we found no association between P300 amplitude and gender, age, or dementia severity as measured by the MMSE. Because 16 of the 20 source studies reported data on the gender composition of the samples and because there was a reasonable range of percentage males across the source studies (14% to 73%), it is possible that P300 amplitude reduction in Alzheimer’s disease is independent of gender, despite other differences between men and women that have been reported in Alzheimer’s disease.44,45 A narrow age range in the source studies may have masked any potential effect of age on P300 amplitude; alternatively, the association between Alzheimer’s disease and P300 amplitude may be present early in Alzheimer’s disease and not be subject to additional changes as the disease progresses. Additional research delineating the effects of age on P300 amplitude in Alzheimer’s disease is indicated. We had expected that severity would be inversely associated with P300 amplitude. One possible explanation of our finding that dementia severity was not associated with P300 amplitude reduction is that we there were only 8 source studies that contained data on dementia severity. Moreover, the range of severity as assessed by the MMSE was narrow, varying from 16.2 to 24.0. Furthermore, despite its widespread use, the MMSE has several limitations, such as the effects of lifestyle on MMSE score and the need for adjustment for age and education, 46 factors that could have obscured an association between P300 amplitude and severity as measured by the MMSE.
Several limitations temper the interpretation of our results. The meta-analysis contained only a total of 646 subjects, making the results sensitive to additional studies. Factors that we were unable to evaluate by meta-regression, such as diagnostic precision, time since dementia onset, and actual severity of dementia, could have influenced the significant Q statistics we found. From the covariates we were able to evaluate in a meta-regression, we were unable to explain much of the significant heterogeneity we found between source studies, indicating that other factors contributed to the significant between study heterogeneity we found. Also, we exclusively used articles published in peer-reviewed journals. While we hoped this would exclude poorly conducted studies, it may have excluded articles that were not published because they lacked significant results. Like other meta-analyses, this study has the potential for publication bias, wherein negative studies do not get published, thus increasing the effect size of the pooled published studies. However, we found little evidence of publication bias in this study based on 2 standard estimates of publication bias, although statistical tests of publication bias tend to have low statistical power.
In conclusion, we found that the P300 amplitude in Alzheimer’s disease is smaller than in healthy controls. Considering the importance of the early detection of Alzheimer’s disease, these findings suggest that P300 amplitude may also serve to differentiate those at risk to develop Alzheimer’s disease from those who are not. Future meta-analyses should examine P300 amplitude in people with minimal cognitive impairment and in healthy subjects with an elevated genetic risk based on family history. To better define the clinical use of P300-amplitude analysis in Alzheimer’s disease given that P300 amplitude reduction occurs in several neuropsychiatric diseases, additional meta-analyses might delineate differences in spatial and temporal P300 patterns between Alzheimer’s disease and other neuropsychiatric disorders such as schizophrenia. In addition, future meta-analyses might address the effects of medication on P300 amplitude in Alzheimer’s disease, which could provide information about the cognitive response to treatment in Alzheimer’s disease. Of the variables we examined to attempt explain the large amount of variance between source studies, only years of education was significantly associated with P300 amplitude.
Footnotes
Declaration of Conflicting Interests
The author(s) declared no potential conflicts of interest with respect to the research, authorship, and/or publication of this article.
Funding
The authors received support for this research from Brigham Young University.