
Abstract
Assessment of consciousness following severe brain-injury is challenging. Our hypothesis is that electroencephalography (EEG) can provide information on awareness, in terms of oscillatory activity and network task–related modifications, in people with disorders of consciousness. Similar results were obtained with neuroimaging techniques; we aim at demonstrating the use of EEG, which is low cost and routinely implemented, to the same goal. Nineteen-channel EEG was recorded in 7 persons with unresponsive wakefulness syndrome (UWS) and in 10 healthy subjects during the execution of active (attempted movement) and passive motor tasks as well as 2 mental imagery tasks. Event-related synchronization/desynchronization (ERS/ERD), coherence and network parameters were calculated in delta (1-4 Hz), theta (4-8 Hz), alpha1 (8-10 Hz), alpha2 (10-12 Hz), and beta (13-30 Hz) ranges. In UWS subjects, passive movement induced a weak alpha2 ERD over contralateral sensorimotor area. During motor imagery, ERD was detected over the frontal and motor contralateral brain areas; during spatial imagery, ERS in lower alpha band over the right temporo-parietal regions was missing. In UWS, functional connectivity provided evidence of network disruption and isolation of the motor areas, which cannot dialog with adjacent network nodes, likely suggesting a diffuse structural alteration. Our findings suggest that people with a clinical diagnosis of UWS were able to modulate their brain activity when prompted to perform movement tasks and thus suggest EEG as a potential tool to support diagnosis of disorders of consciousness.
Introduction
Assessment of consciousness following severe brain injury is challenging. The inclusion of the Coma Recovery Scale–Revised (CRS-R)1,2 into the routine assessment of disorder of consciousness (DOC) may reduce the number false diagnosis (up to 36%) 3 in distinguishing locked-in syndrome, minimally conscious state (MCS), and unresponsive wakefulness syndrome (UWS). 1 People with UWS, previously known as vegetative state, are clinically characterized by the absence of any discernible behavioral evidence of consciousness.
Electrophysiological exams could contribute with low-cost, routine information on conscious awareness orienting medical treatment and rehabilitation efforts and providing a guide for family counseling.
Previous research has focused mainly on neuroimaging data. Two mental imagery functional magnetic resonance imaging (fMRI) paradigms were applied in a UWS subject, observing activation of supplementary motor area and parahippocampal gyrus. 4 Brain activation reflecting some awareness in UWS people was described 5 during a motor imagery and a spatial imagery task. Subjects were instructed to attempt moving hands during fMRI acquisition: in 2 cases, an activation of the contralateral premotor cortex consistent with movement preparation was recorded despite the lack of overt muscle activity. 6
In addition to cerebral oscillatory activations, how brain areas connect is crucial to understand how it works and its neurobehavioral correlates. Brain connectivity is altered in disorder of consciousness, with a gradient of greater disconnection the more severe the clinical picture.7,8
During resting state, default mode network (DMN) markedly reduces connections with the frontal node 9 ; conversely, neurostimulation apparently enhances connectivity among specific networks (ie, the visuo-motor network 10 ). Alterations of interhemispheric fronto-parietal functional connectivity in the pathophysiology of DOC and an aberrant connectome organization at the network topology level were demonstrated in people with UWS compared with MCS. 7 Concurrently with DMN hypoconnectivity, detected by using MRI, a limbic hyperconnectivity was reported in UWS and MCS reflecting the persistent engagement of residual neural activity in self-reinforcing neural loops. 8 In UWS, a reduced coherence in the damaged hemisphere 11 and a decrease in coherence of the faster electroencephalogram (EEG) frequencies has been reported 12 ; a similar coherence decrease was described in MCS. 13
Level of awareness can be thus quantified using neuroimaging techniques, but they have practical limitations due to patient-related issues. fMRI cannot be used in people unable to be transported to the scanner or with implanted ferromagnetic material; involuntary movements and agitation restrict neuroradiological investigations to a limited cohort of subjects. EEG-based assessments of awareness are part of standard clinical assessments. The EEG is indeed a cheap and more portable technique and it can be used at the bedside.
Routine EEG may support the diagnostic process of DOC, providing a correlation between 3 months CRS-R and EEG amplitude, frequency and reactivity, 14 as well as the prognosis of DOC in considering acute/subacute EEG and long-term outcomes (discharge from rehabilitation unit or 12 months from event).15,16 Background reactivity signals a higher consciousness level. 17 Though part of the diagnostic process, this basic neurophysiological finding does not yet provide unquestionable evidence. More complex experimental EEG tasks have been trialed in the search for additional diagnostic and prognostic biomarkers.
An EEG study investigated brain response to motor and spatial navigation tasks in healthy controls and 3 patients with severe brain injury, reporting EEG oscillatory modulation in MCS subjects. 18 In EEG analysis, the event-related synchronization/desynchronization (ERS/ERD) approach is an efficient tool to evaluate the modifications during active, passive, and imagined movements. 19 It quantifies the alpha and beta power reduction over motor and sensorimotor cortex during simple and complex motor tasks.
Graph-based methods describe network structures, capturing the complexity and providing useful measures to characterize the topological proprieties and the functional organization of the networks. Among standard network indices, node strength and betweenness centrality represent measures of node centrality. They quantify the functional importance of each node with regard to the rest of the network, identifying nodes dubbed “hubs,” which play a key role in functional integration. These nodes could be more critical for information processing and abnormal connectivity between hubs and could cause more deficits compared with peripheral nodes. 20
Our hypothesis is that EEG data can provide information on awareness, in terms of oscillatory activity and network task-related changes, in people with disorders of consciousness. Similar results were obtained with fMRI; we aim at demonstrating the applicability of EEG, which is low cost and routinely implemented, to the same goal.
Materials and Methods
Participants and Controls
Seven subjects (2 women; mean ± SD age 51.57 ± 12.20 years) with a diagnosis of UWS, admitted at the Sacro Cuore Don Calabria Hospital, Negrar, Italy, met the study inclusion criteria: stability of vital parameters, more than 12 months since injury and integrity of auditory pathways assessed by Brainstem Auditory Evoked Potential Examination (BAEP).21,22 The clinical characteristics are reported in Table 1. Clinical features were assessed by the Disability Rating Scale (DRS) and the CRS-R (motor functions subitem score).23,24 Among measures that cross International Classification of Function (ICF) domains, the DRS is widely used. The DRS is a more versatile outcome measure. The DRS was introduced to overcome the poor precision of Glasgow Outcome Scale (GOS). 25 Its main strength rests in the capability of measuring general functional changes throughout the course of recovery. The CRS-R is unique as it expressly incorporates current diagnostic criteria for coma, vegetative state, and the minimally conscious state, allowing the examiner to make a diagnosis based directly on bedside behavioral observations. CRS-R modifications correlate with functional outcome at 1 year.2,25 Diagnosis according to CRS-R relate to levels of functional disability on the DRS. 26
Demographic and Clinical Profiles of Patients.
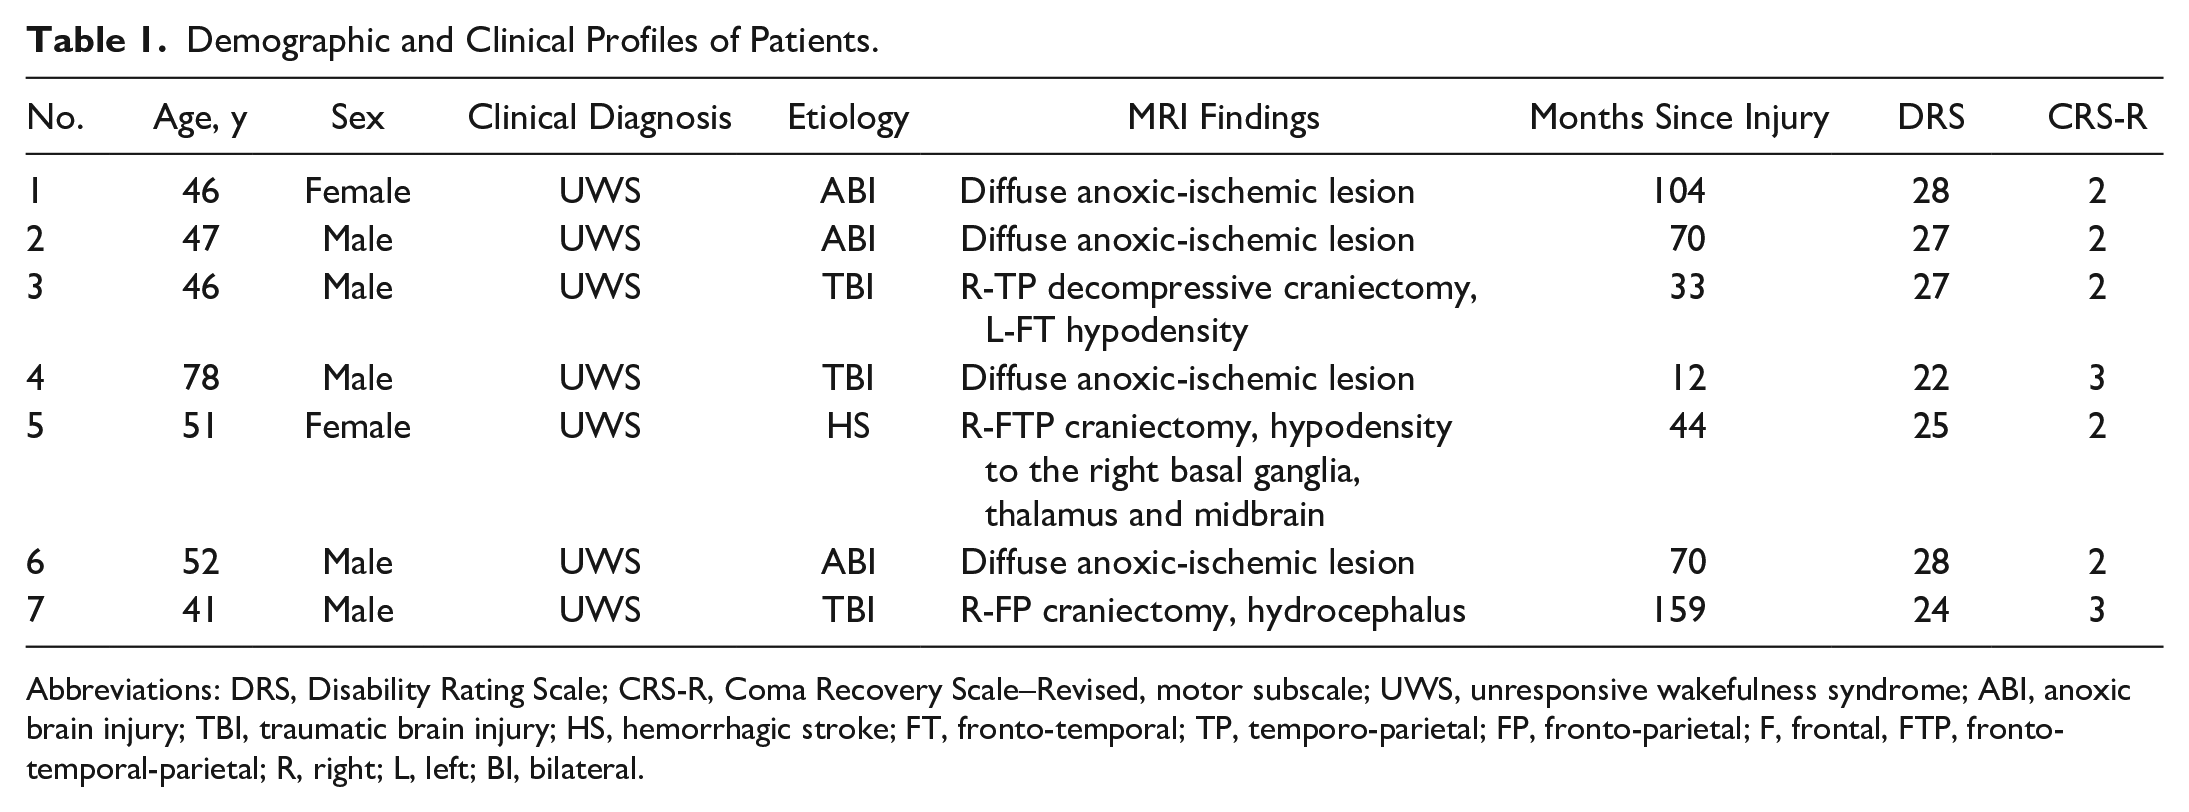
Abbreviations: DRS, Disability Rating Scale; CRS-R, Coma Recovery Scale–Revised, motor subscale; UWS, unresponsive wakefulness syndrome; ABI, anoxic brain injury; TBI, traumatic brain injury; HS, hemorrhagic stroke; FT, fronto-temporal; TP, temporo-parietal; FP, fronto-parietal; F, frontal, FTP, fronto-temporal-parietal; R, right; L, left; BI, bilateral.
In accordance with the Declaration of Helsinki, written informed consent to participate in the study was obtained from the legal representative. Control data were acquired from 10 subjects (6 women; mean ± SD age = 33.9 ± 7.25 years), performing the same experimental paradigm. The study design and protocol were approved by both the Local Ethical Committee of IRCCS San Camillo Hospital and the Sacro Cuore Don Calabria Hospital.
Experimental Setup and Motor Paradigms
Participants were asked to perform four motor tasks on verbal command during EEG recording. A block design protocol alternating rest to task was used. Three runs of rest alternating with three runs of execution were performed in each session (each run lasted about 60 seconds; Figure 1). In the active motor task, each run began with the instruction “Try to move your right hand” and ended with “And now relax.” During passive motor task, the right hand of the patient was squeezed by a neurologist. In the motor imagery task, participants alternately heard the commands “Imagine yourself playing tennis” and “Stop imaging playing tennis.” In the spatial navigation task, the commands were “Imagine walking within your house” and “Stop imagining walking within your house.” The motor imagery and the spatial navigation protocols follow those described in previous studies.4,18,27 In all the 3 runs, the participant was repeatedly invited to perform the task, as a reinforcement. Recording were performed at the same hour of day to avoid circadian confounders. Other potential confounding factors were considered: Subjects were only recorded after a good night’s sleep or if not drowsy. They were not recorded also if they were febrile. Five minutes of resting state EEG data were acquired at the beginning of the session.
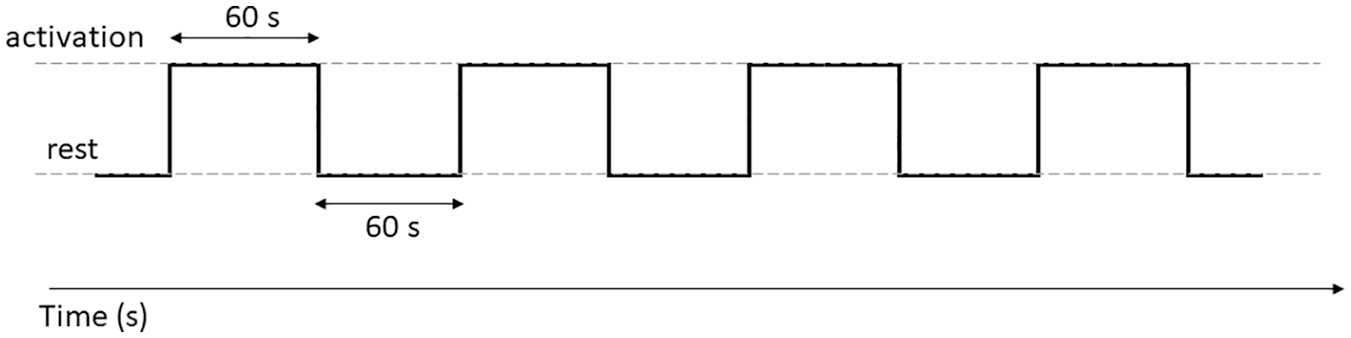
Time schedule for measuring EEG data during a task.
The EEG data were acquired at a sampling rate of 256 Hz using an EEG system (Micromed, Treviso, Italy) and a cap (SEI EMG s.r.l, Padova, Italy) with 19 Ag/AgCl electrodes positioned according to a 10/20 system. The reference was placed anterior to Fz and the ground posterior to Pz.
ERS/ERD Analysis
The data were processed in MATLAB (MathWorks, Natick, MA) using scripts based on EEGLAB (http://www.sccn.ucsd.edu/eeglab), as well as a dedicated home-made code. The EEG recordings were band-pass filtered from 1 to 30 Hz using a finite impulse response filter; visible artifacts, such as eye blink or muscle activity, were removed using an independent component analysis and the data were processed using an average reference. EEG data were divided into epochs of 60 seconds to separate rest from movement condition and each 60-second period was then divided into epochs of 2 seconds. Power spectral density (μV2/Hz) was estimated using a fast Fourier transform (FFT) applied to 2-second period and then averaged separately for each condition (rest and active); an ERS/ERD procedure was used to quantify the EEG power changes in delta (1-4 Hz), theta (4-8 Hz), alpha1 (8-10 Hz), alpha2 (10-12 Hz), and beta (13-30 Hz) ranges. ERS/ERD was defined as the percentage increase/decrease of power spectral density (PSD) during the task with regard to the baseline value (rest), according to the equation:
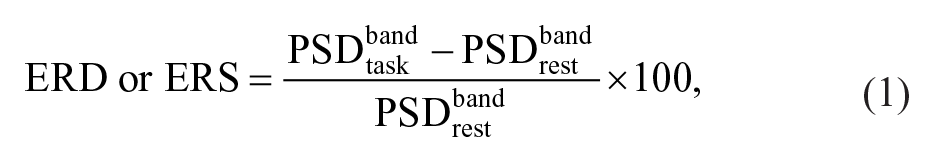
where “band” is the frequency range of interest (delta, theta, alpha1, alpha2, and beta). Event-related PSD decrements, which are representative of a decrease in synchrony of the underlying neuronal populations and indicate cortical activation, are expressed as negative values. Conversely, event-related power increases indicating a cortical idling state are expressed as positive values. Grand-average ERS/ERD values were represented by topographical maps.
Functional Connectivity and Network Analyses
To study the relationship between the 2 conditions (active vs rest), the coherence was computed according to the equation:
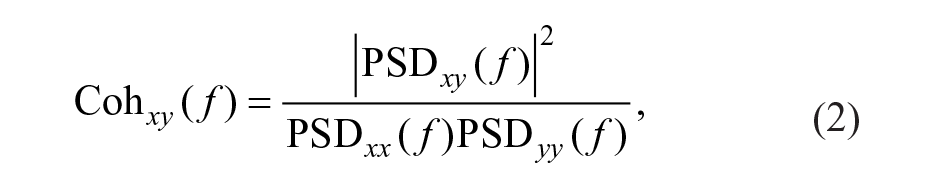
where PSD x (f) and PSD y (f) are the power spectral densities of 2 EEG channels x and y, respectively, PSD xy (f) is the cross power spectral density of x and y, and f is the reference frequency band. Coherence was calculated in the 2-second epochs for each frequency and then averaged in the same frequency ranges.
Graph analysis was used for assessing the network model properties. The brain network was constructed based on the unthresholded spectral coherence values of the EEG channels/nodes, using the coherence value as the weight of the edge connecting 2 nodes (adjacency matrix). To characterize the network graph parameters, node strength (NS) and betweenness centrality (BC) were calculated by using an open-source toolbox (Brain Connectivity Toolbox, BCT, https://sites.google.com/site/bctnet/Home) as well as in-house software (Matlab). NS represents the sum of weights of links connected to the node—that is, the number of connections that a given node has with any other node of the network. Nodes with the highest number of connections have a preeminent function in a given task or state. BC indicates the centrality of a node in a network and is considered equal to the number of shortest paths from all vertices to all others that pass through that node. A node with high BC has a large influence on the transfer of items through the network under the assumption that item transfer follows the shortest paths. Network parameters differences in the active and rest conditions were computed and represented by topographical maps (Figures 4 and 5).
A Mann-Whitney-Wilcoxon test was performed on ERS/ERD data and network parameters (NS and BC) to compare the 7 UWS subjects and 10 controls. Significant P values (P < .05) were displayed on the scalp maps with a cross.
Results
Significant differences between people with UWS and controls and the exact P values are reported in Figures 2–5 and Table 2.
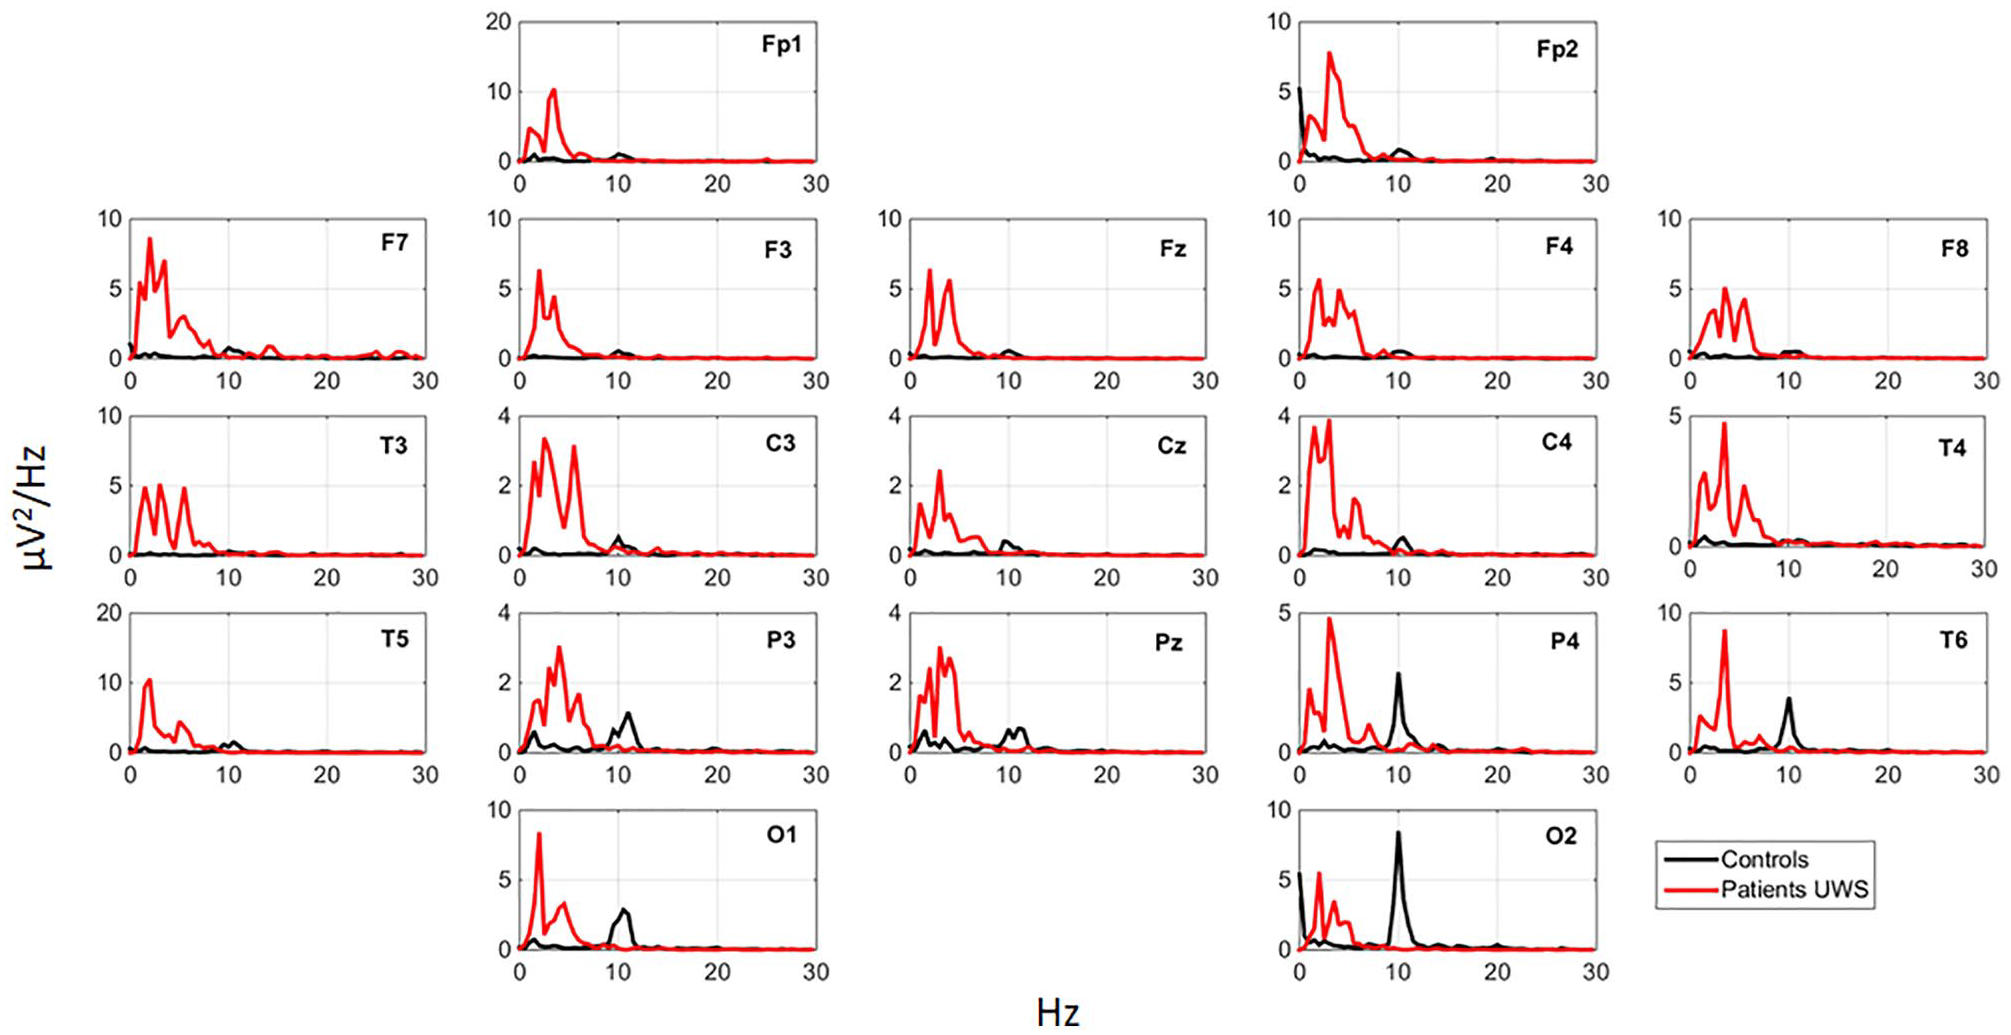
Grand-average power spectral density [µV2/Hz] of the EEG signal in unresponsive wakefulness syndrome (UWS) patients (red) and controls (black).
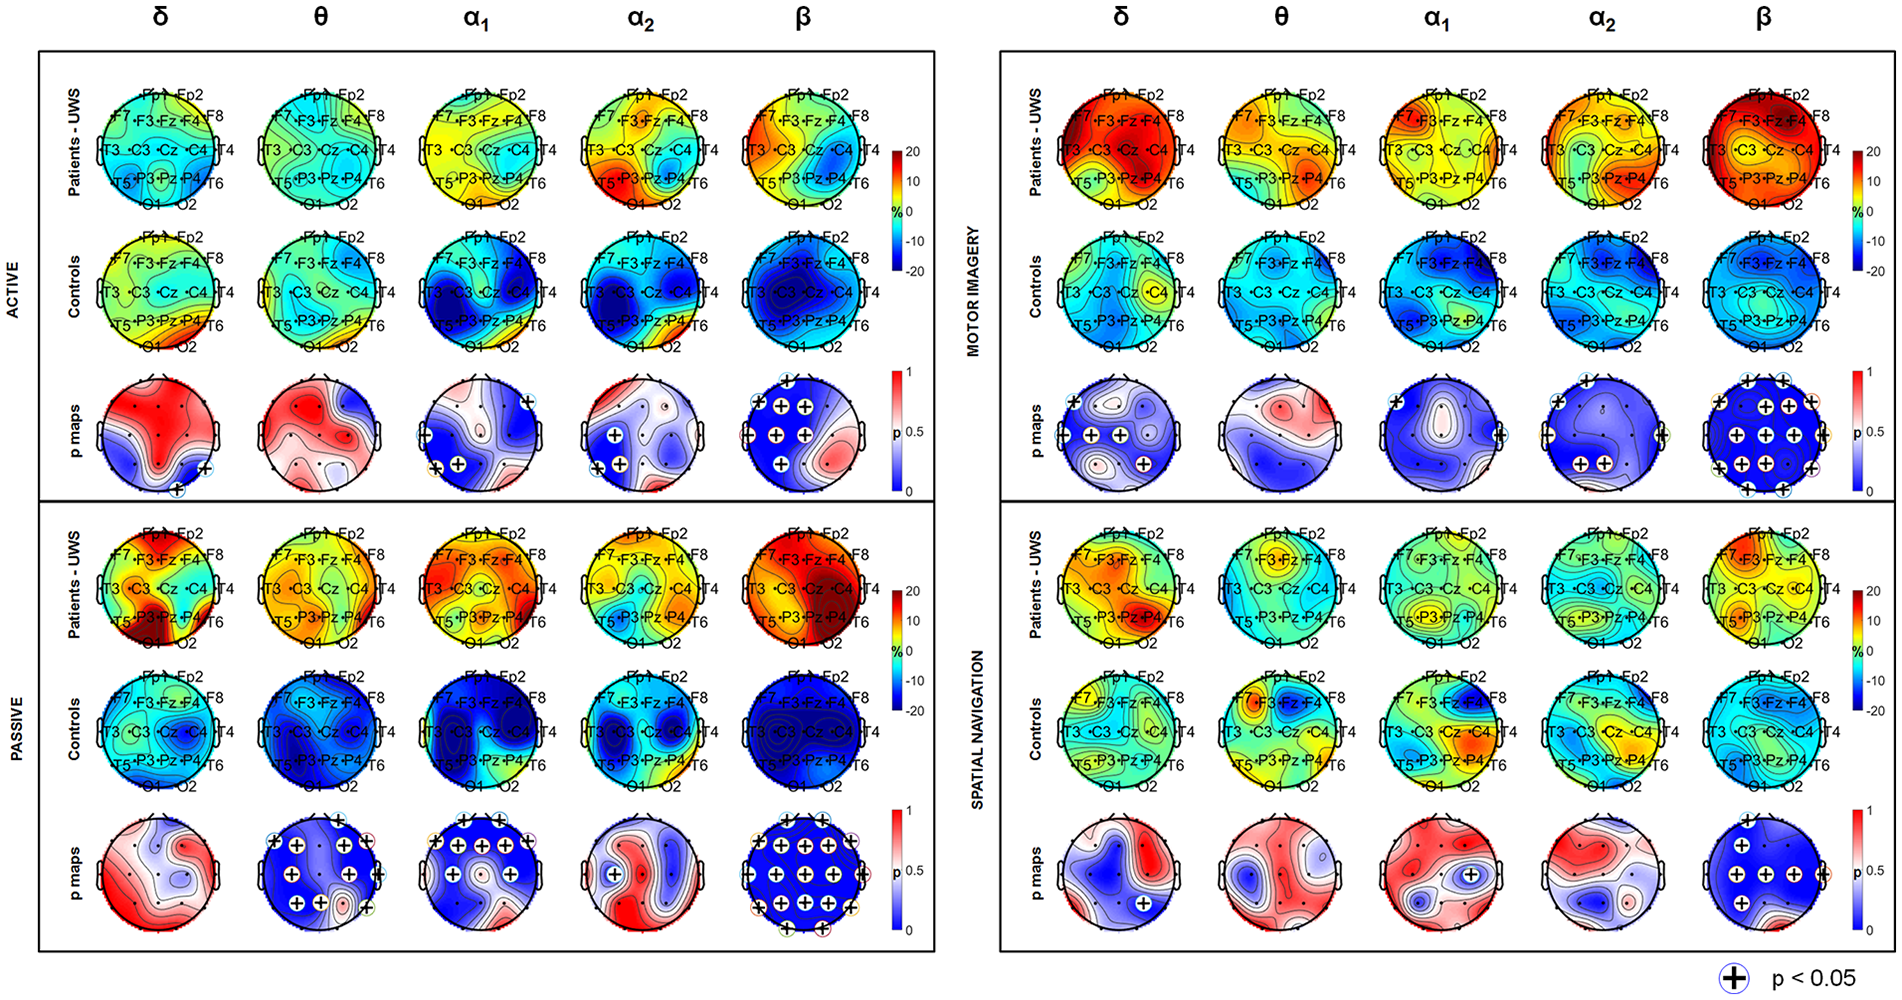
Grand-average event-related synchronization/desynchronization (ERS/ERD) topographies (%) for unresponsive wakefulness syndrome (UWS) subjects (first row) and controls (second row) and P-maps (third row) derived from Mann-Whitney-Wilcoxon test (UWS subjects vs controls), during active, passive, motor imagery, and spatial navigation tasks. (+) indicates significance for P < .05.
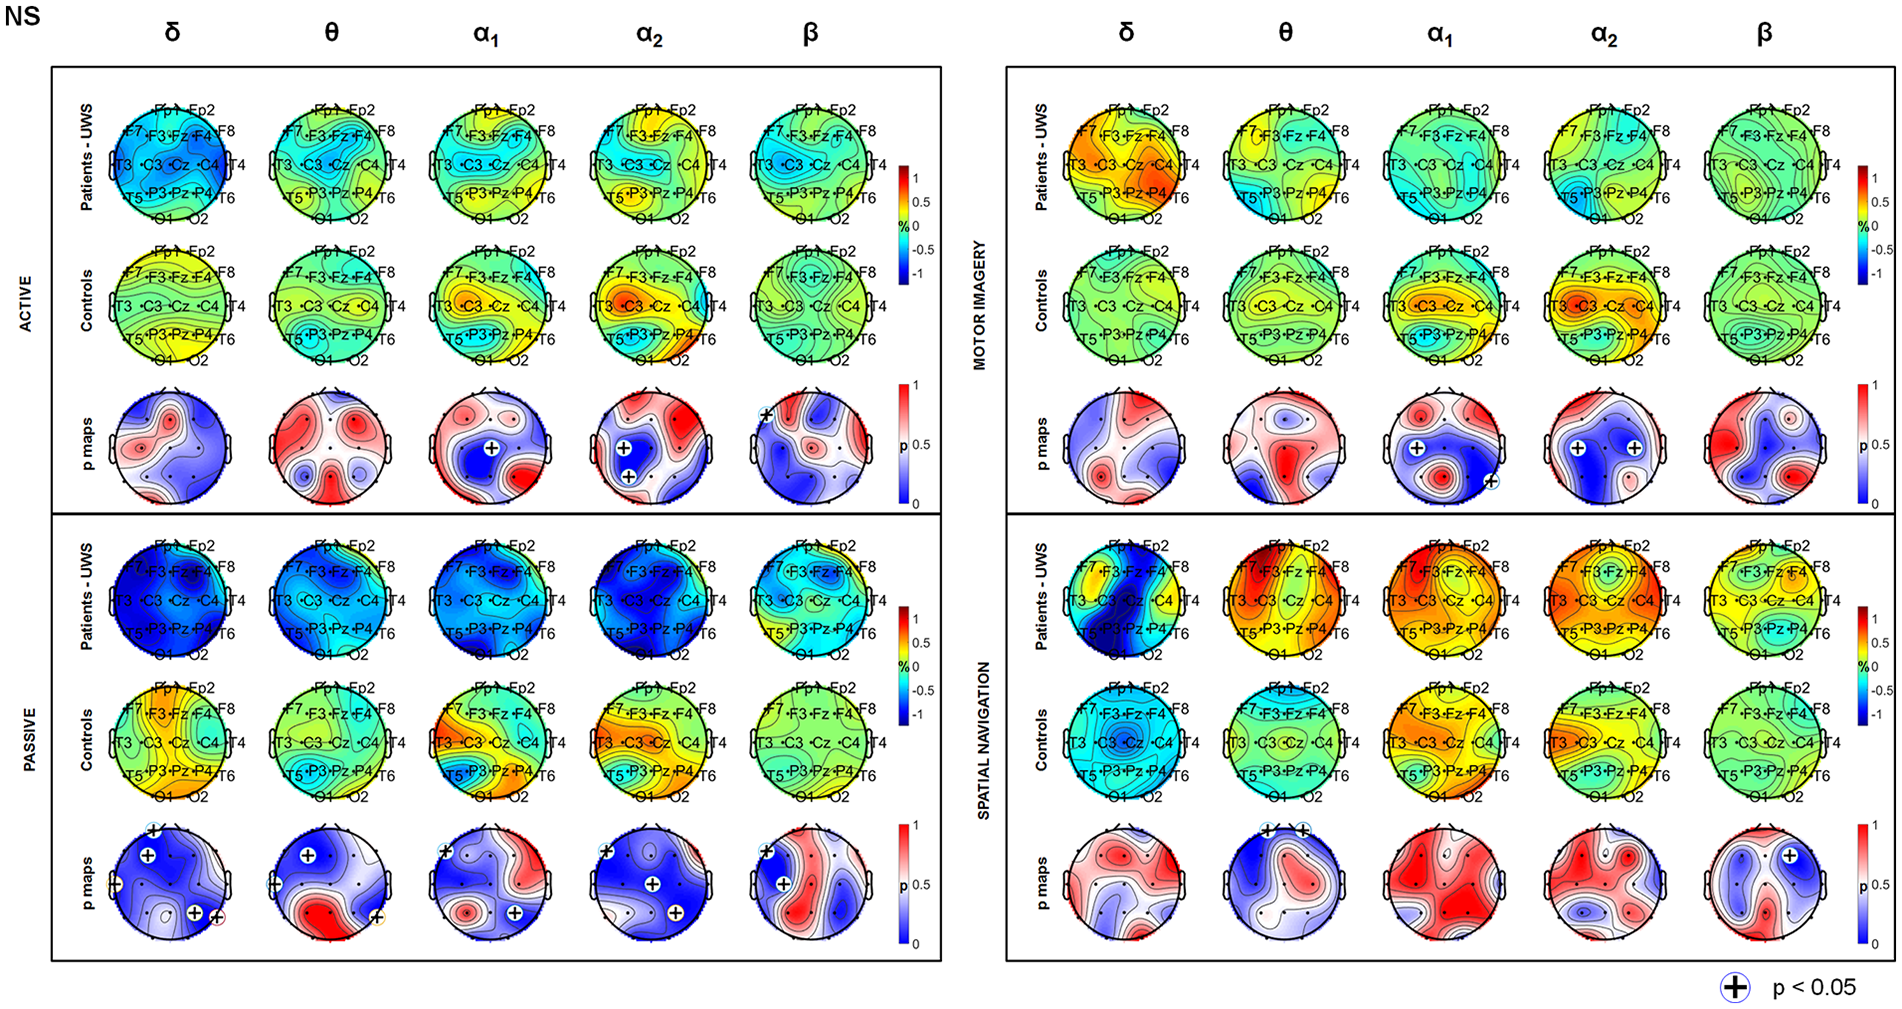
Task-induced modulation in network parameters. The reported values represent the node strength (NS) differences between active and rest conditions for unresponsive wakefulness syndrome (UWS) subjects (first row) and controls (second row), during active, passive, motor imagery, and spatial navigation tasks. Third row represents P-maps derived from Mann-Whitney-Wilcoxon test (UWS subjects vs controls). (+) indicates significance for P < .05.
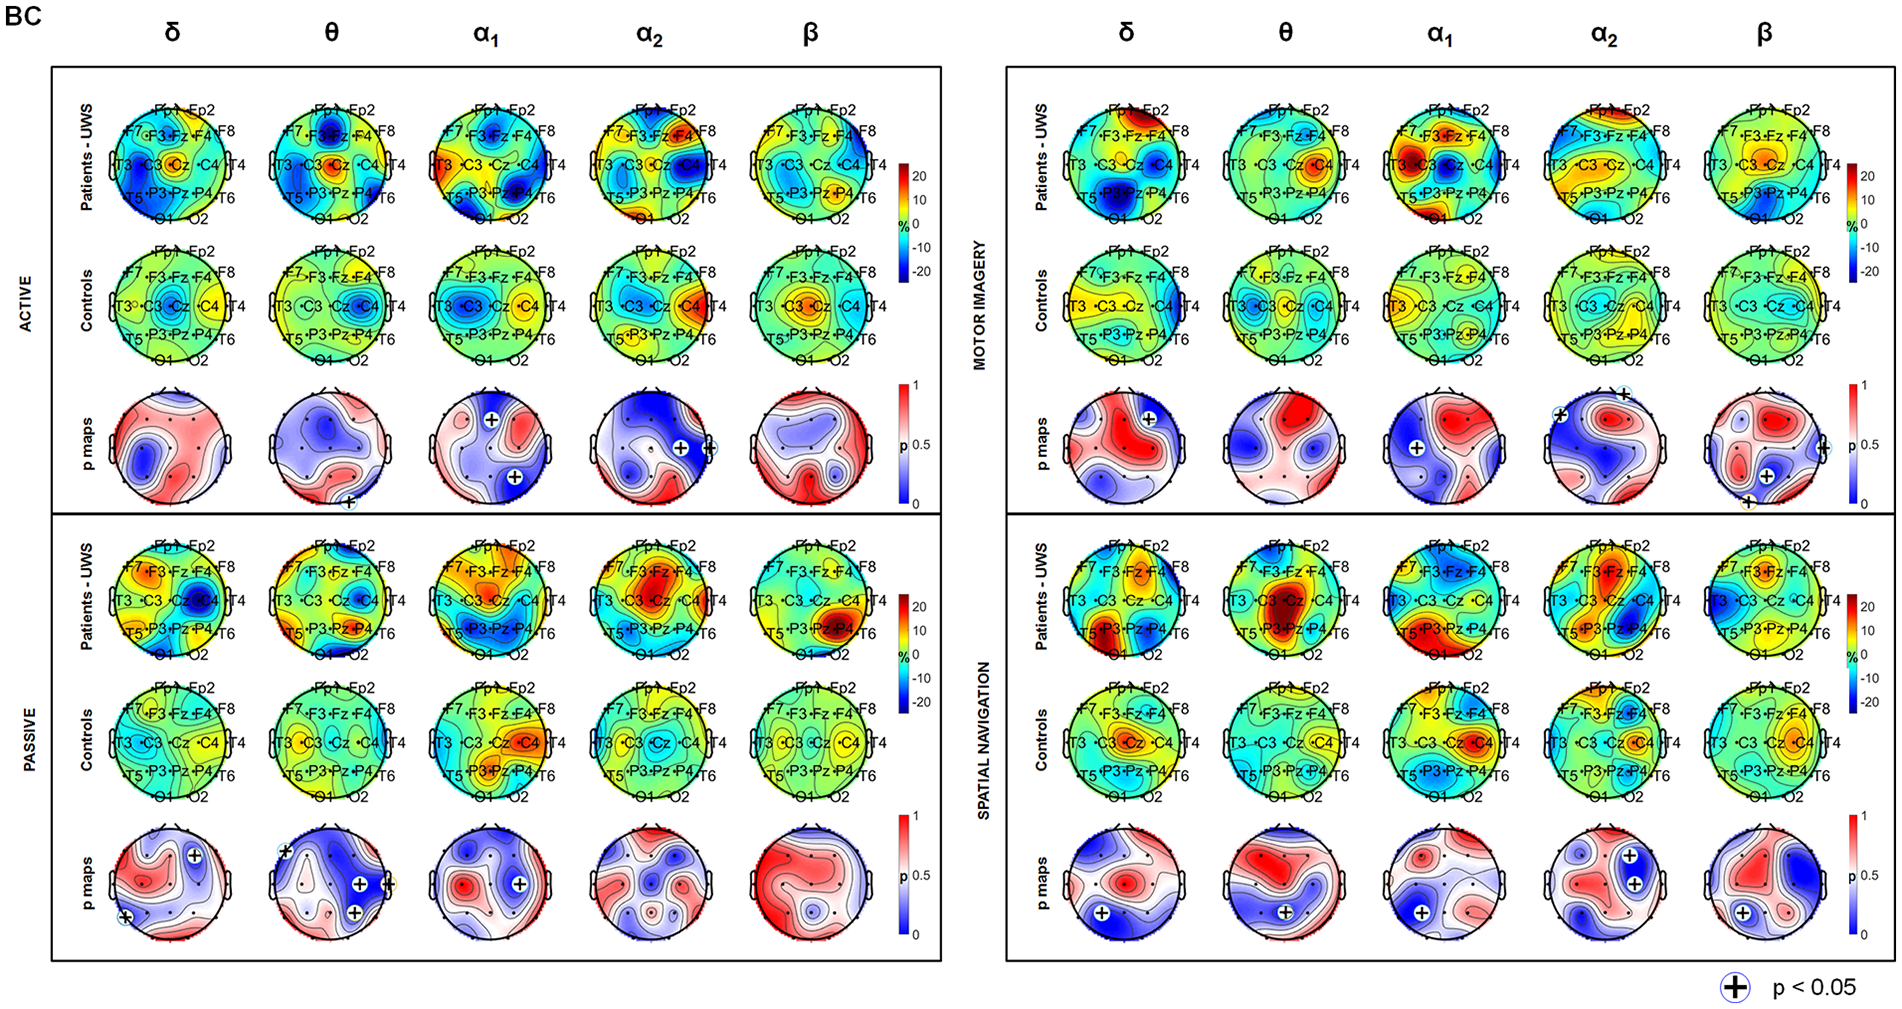
Task-induced modulation in network parameters. The reported values represent the betweenness centrality (BC) differences between active and rest conditions for unresponsive wakefulness syndrome (UWS) subjects (first row) and controls (second row), during active, passive, motor imagery, and spatial navigation tasks. Third row represents P-maps derived from Mann-Whitney-Wilcoxon test (UWS subjects vs controls). (+) indicates significance for P < .05.
ERS/ERD and Network Results. a
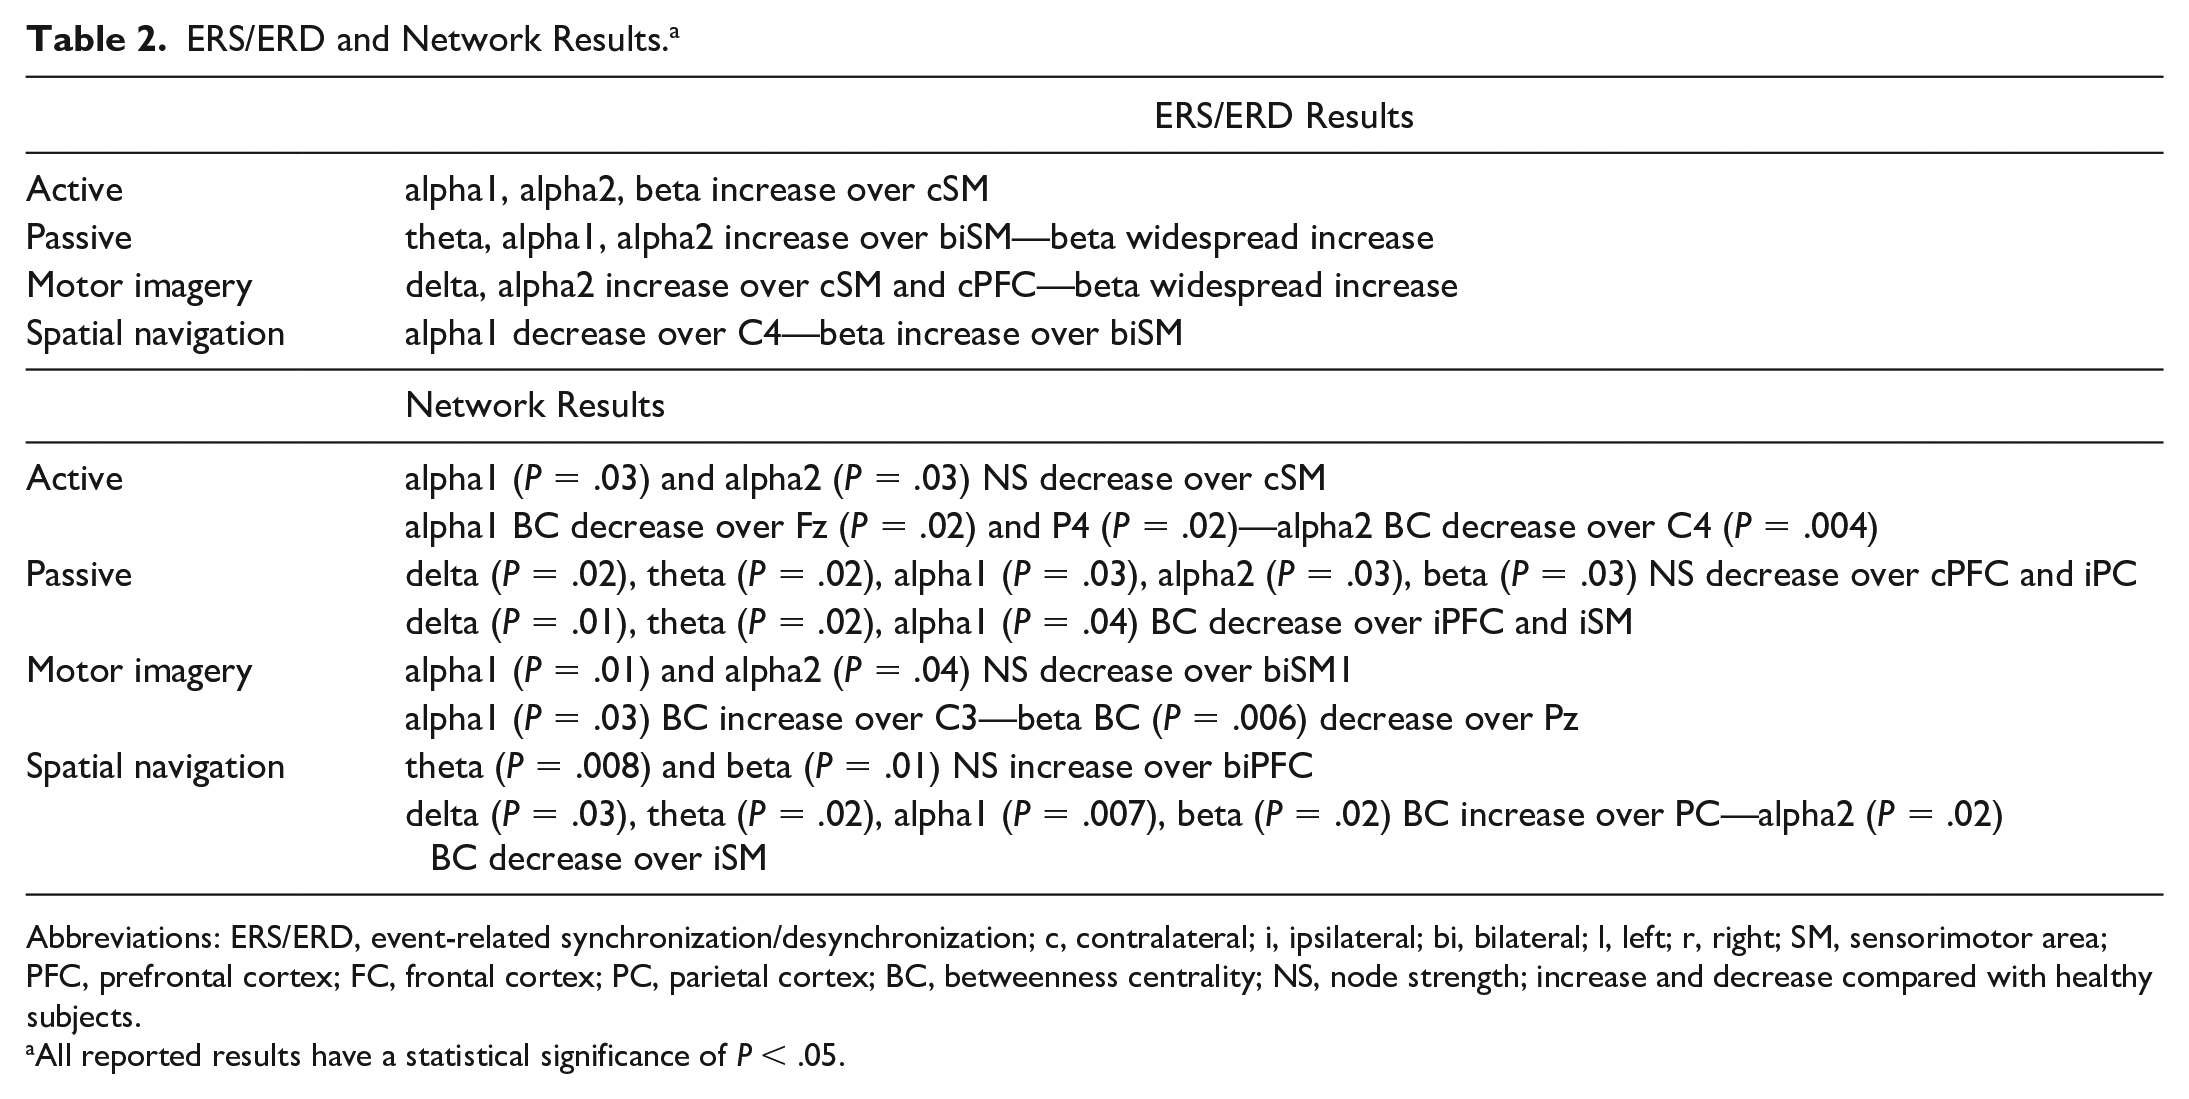
Abbreviations: ERS/ERD, event-related synchronization/desynchronization; c, contralateral; i, ipsilateral; bi, bilateral; l, left; r, right; SM, sensorimotor area; PFC, prefrontal cortex; FC, frontal cortex; PC, parietal cortex; BC, betweenness centrality; NS, node strength; increase and decrease compared with healthy subjects.
All reported results have a statistical significance of P < .05.
Resting state EEG data show that UWS subjects have a peak around 1.5 to 2 Hz, showing higher delta power as previously reported. 27 The power spectral density profiles highlight the shift toward slower frequency in patients compared with controls (Figure 2).
ERS/ERD Results
During attempted right-hand movement, significant (P < .05) alpha1, alpha2, and beta ERD were observed over ipsilateral motor area (C4) in UWS participants compared with controls (Figure 3).
Passive movement in UWS participants produced ERD over Cz and P3 in upper alpha range; a reversed pattern, with synchronization instead of desynchronization as in controls (P < .05), was detected over frontal and central electrodes in theta, alpha1, alpha2, and beta bands.
The motor imagery task in UWS participants produced a slight alpha2 desynchronization over C3 and P3 and a diffuse synchronization in beta band; in the spatial navigation task the synchronization in alpha band over the right temporo-parietal regions (involved in the navigation process) was not detectable in UWS compared with healthy subjects.
Network Results
During active and passive movement, a significant (P < .05) alpha1, alpha2, and beta NS reduction was observed over C3, with a significant reversed pattern in UWS participants compared to healthy subjects (ie, in controls during movement the strength of C3 increases) (Figure 4). BC decreased over bilateral sensorimotor (SM) areas in alpha2 and beta whereas in healthy subjects an increase of C4 (P < .05) was detected (Figure 5).
Differently from healthy subjects (P < .05), alpha and beta NS increase over motor areas was not observed in UWS subjects during motor imagery task; BC increased instead.
Spatial navigation task in UWS participants produced a NS increase over C3 and C4 in theta and alpha ranges, as observed in controls; theta and alpha1 BC increase over central and temporo-parietal nodes (P < .05) whereas a decrease in controls was detected.
Discussion
This study provides evidence of the sensitivity of EEG oscillatory and connectivity modifications following mental imagery paradigms to assess awareness in people with a clinical diagnosis of UWS.
Brain activations in response to these tasks have previously been described using fMRI. EEG is a low-cost technique routinely used in clinical settings, which can overcome most of the limitations imposed by MRI.
EEG signal can be analyzed in terms of oscillatory modifications induced by a task, whether motor or cognitive, or in terms of functional connectivity, which explores the interactions between different brain areas in specific conditions.
Both active and passive hand motor activation induces a desynchronization of sensorimotor rhythms, namely alpha and beta bands, in healthy subjects. 19 In the study sample of subjects with DOC, passive hand movements induce a slight desynchronization over the contralateral motor cortex. This finding suggests that a functional reactivity of sensorimotor areas is still evoked, although the integrity of the network is not fully comparable to that of healthy individuals.
Oscillatory activity during imagery tasks shows a preferential activation during the motor imagery paradigm: a slight desynchronization is detected over the frontal and motor contralateral brain areas, concordant with the activation of executive and motor cortices. Despite the lesser degree of activation in comparison to healthy subjects, this finding suggests nonetheless that our UWS subjects could work out a complex motor task.
During spatial imagery, an important synchronous activity in lower alpha band emerged over the right temporo-parietal regions in healthy subjects. Here we observed an apparently opposite phenomenon in people with UWS: although the physiopathological interpretation remains unclear, it suggests a modification with regard to the resting state and can be indicative of a brain reactivity.
Additional information on brain functioning can be provided by connectivity, which offers insight into the reciprocal interactions of brain areas. Among the different indexes, node strength and betweenness centrality offer details over the role of a given node/brain region in terms of number and strength of links with adjacent nodes (NS) or with regard to the centrality of a given node in a network (BC)—how many connections the node manages to maintain the network.
During any motor tasks, passive or active, healthy controls show an increase of NS over the motor area contralateral to the moving hand, signaling how this area is crucial in the motor network. In UWS people the motor cortex behaves in the opposite direction, with a functional isolation of the area (strong reduction of motor area NS). The neurophysiological interpretation of this finding is the disruption of the network and the isolation of the primary motor area, which cannot dialog with adjacent network nodes, in line with diffuse axonal injury structural alterations. Similar findings emerge during imagery, where the task complexity draws even more on composite networks. During motor imagery, no clear-cut centrality can be recognized in UWS.
Last, betweenness centrality appears reduced or anatomically shifted during active and passive movement in UWS: the motor cortex is thus not a critical node during motor execution but becomes disentangled from the wider network contributing to motor control. During imagery, whether motor or spatial, we observe that critical nodes—that is, motor cortex or central interhemispheric regions connecting temporo-parietal regions—BC increases, with the likely significance of a tentative vicarious activation of contiguous areas or more distant nodes to accomplish the task.
Considering the shift of the EEG frequencies power spectrum in UWS to the lower band, we focused our interpretation of data on lower EEG bands. In fact, especially for oscillatory activations, beta band shows a substantial, diffused difference between participants and controls, which both supports the notion of an overall slowing of EEG activity in these patients and the decision to neglect beta band activity in data interpretation. In fact, EEG slowing in UWS has already been described 28 and confirmed by our resting state results.
According to the results reported in Cruse et al, 28 we found ERD over the left sensorimotor area in alpha range and over the posterior regions in theta range during both motor imagery and spatial navigation tasks. Functional connectivity provided an additional information: the disruption of the network and the isolation of the motor areas, which cannot dialogue with adjacent network nodes. The idea of higher-order cerebral connectivity modification or interruption, while preserving lower-order sensory networks (ERS/ERD), suggests that brain connectivity can provide additional insight into consciousness and its neural correlates.5,9
The main limitation of the present study is the small sample size. An additional limitation, intrinsic in the computational method, may be the contamination of coherence by volume conduction effects. It is not possible to accurately predict these effects on scalp coherence estimates without both an accurate volume conductor model and prior knowledge on source configuration. Last, although all UWS subjects have diffuse axonal damage, 3 subjects present a restricted focal size lesion which could have slightly distorted some signal diffusion. Moreover, we did not compare UWS subjects with MCS subjects.
Our findings suggest that EEG may be helpful in distinguishing activations at cerebral level in people with UWS: some of them may be able to modulate their brain activity when prompted to perform movement tasks. The neural responses that characterize these tasks are not automatically produced by the stimulus but rather depend on the intention of the patient to generate a response to a given instruction. Based on the hypothesis that some patients have a higher degree of consciousness than clinically classified, the use of brain computer interface or other communication aids should be considered. EEG may also contribute to reduce the rate of false diagnosis, improving the prospective for people with DOCs.
Footnotes
Acknowledgements
The authors would like to thank the physiotherapist Giulia Tamellini for her contribution to EEG data acquisition.
Author Contributions
EF contributed to analysis and interpretation, drafted manuscript, and gave final approval. ADF contributed to interpretation, critically revised manuscript, and gave final approval. MC contributed to interpretation, critically revised manuscript, and gave final approval. SFS contributed to interpretation, critically revised manuscript, and gave final approval. CA contributed to acquisition and critically revised manuscript. CT contributed to acquisition and critically revised manuscript. LS contributed to conception and critically revised manuscript. RA contributed to conception and critically revised manuscript. FP contributed to conception, critically revised manuscript, and gave final approval. PM contributed to conception and design, critically revised manuscript, and gave final approval. All authors agree to be accountable for all aspects of work ensuring integrity and accuracy.
Declaration of Conflicting Interests
The author(s) declared no potential conflicts of interest with respect to the research, authorship, and/or publication of this article.
Funding
The author(s) received no financial support for the research, authorship, and/or publication of this article.