
Abstract
Introduction
Depressive disorders are one of the most common mental disorders worldwide. According to the WHO global health estimate 322 million people suffer from depression globally. 1 According to the National Mental Health Survey 2016 of India, the lifetime prevalence of depressive disorder is estimated to be 5.2%. 2 It is one of the largest contributor of non-fatal health loss (Global Health estimates 2017). Antidepressants are the main stay of its treatment. However, response rate with SSRI in depression is found to be around 47%. 3 This highlights that more than 50% of the patient had to undergo sequential trials of treatment for achieving adequate response. In these sequential trials each drug is tried for at least 4 weeks duration. 4 This delay has impact on treatment outcome as it leads to decreased hope, early discontinuation and can cause treatment resistance.5,6 This delayed response is the major limitation today in treatment of depression as the clinicians are unable to timely change the drug in non-responders. Overcoming this limitation will be a major relief in avoiding unnecessary trials. Over the past years, there has been a growing research in identifying the predictors of treatment response. Studies have been conducted to find the clinical correlates7,8 and genetic marker9,10 for antidepressant treatment response. However, no single gene variant has been associated with antidepressant treatment response and studies related to clinical predictors have inconsistencies and have not given a reliable pre-treatment variable to predict the treatment response. However, research in Quantitative Electroencephalography (QEEG) has generated some evidence in its role as a biomarker in accurately predicting treatment response. QEEG is processing of digital EEG record to find specific waveform components and then associate numerical results with EEG data for further review or comparison. 11
Ulrich et al used the spectral analysis of EEG to predict the treatment response to antidepressants (amitriptyline and pirlindole) and reported that reduction in alpha power is seen post treatment in responders. 12 Later on, many studies revealed that out of all the frequency bands theta band was more specifically related with treatment response. Knott et al reported that theta value changes were observed as early as 3 h after administration of drug and even after 2 weeks of treatment. 13 Later, Knott et al conducted similar study with larger sample size and using a SSRI, paroxetine and reported that lesser pre-treatment theta value in frontal region was associated with greater reduction in severity of illness. 14 This pre-treatment EEG parameters successfully differentiated responders and non-responders in another study using fluoxetine. 15 This study had limited number of subjects i.e 24 and didn’t look at changes in QEEG measures over time. Later, Cook et al conducted a study with larger sample size (n = 51), studied QEEG changes over time and included 2 drugs Fluoxetine and Venlafaxine. 16 The study reported that cordance (combination of absolute and relative power) in prefrontal region decreases significantly over time (48 h and 1 week) in responders and level of decrease in cordance was associated with magnitude of response. The relative theta power in frontal area again emerged as a useful measure to predict treatment response in a study involving trial of both SSRI and SNRI. 17 The early changes (in one week) in the theta power predicted the treatment response with 70% accuracy. The QEEG has also been used to differentiate responders from non-responders in patients of treatment resistant depression.18-20 The predictive ability of QEEG is not only limited to antidepressants, recently studies have shown that QEEG parameters are also differentiating responders in other forms of treatment like Electroconvulsive Therapy (ECT) 21 and repetitive transcranial magnetic stimulation (rTMS). 22
However, recently contrary findings have also emerged in few studies, where theta prediction studies lacked a strong predictive effect.23-25
Majority of the studies have identified theta band changes in treatment response with anterior region of the brain being implicated consistently. The predictive ability of QEEG is also seen in treatment resistant cases and even for somatic therapies with few studies showing mixed results. Thus, QEEG have a potential to provide some insight in prediction of antidepressant treatment response.
All these studies involve western population and to the best of our knowledge no such study has been done in Indian population. Thus, this study was conducted to identify its replicability in Indian population. As theta band in anterior region of the brain is more commonly linked with response this study was planned to look specifically for theta value changes in frontal and prefrontal area.
Methods
Description
Participants were inducted from Department of Psychiatry, Government Medical College and Hospital, Chandigarh between year 2019 to 2020. A total of 80 consecutive patients diagnosed with DSM-5 diagnosis of Major depressive disorder meeting the inclusion criteria:- age group 18−65 years; Hamilton Rating Scale for Depression (Ham-D; 17 item) Score more than 14 were included in the study after taking the written informed consent. Exclusion criteria were Bipolar disorder or psychosis; Epilepsy or any other condition requiring anticonvulsants; Dementia; Anxiety Disorders; patients on any treatment in current episode; patient on any psychotropic drug in past 2 weeks; dependence on any substance (including nicotine and caffeine) in past 6 months; pregnant or breastfeeding female, significant suicidal risk. Baseline socio-demographic and clinical profile of the patient was recorded. Severity of the illness was measured with Hamilton Rating Scale for Depression. A baseline EEG was recorded before initiating the treatment. Patients were prescribed any of the SSRIs and dose adjustment was allowed according to the patient's clinical condition. During the entire 8-week course of the treatment patients were maintained on same drug and if augmentation or switching to different class of drug was required patients were dropped-out from the study. During the first week of the course of treatment no benzodiazepines were given. After 1 week of treatment patients were assessed for severity of illness with Ham-D, any side effects (using UKU side effect check list) and EEG was recorded again. Ham-D was applied fortnightly and UKU side-effect checklist was applied weekly thereafter. After 8-week course of treatment patients were divided into two groups: - Responders- patients who showed 50% decrease in Ham-D score from baseline and Non-Responders- patients who didn't show a decrease in Ham-D score by 50% from baseline (Figure 1). Frontal and prefrontal relative theta and theta cordance values were assessed at baseline and 1-week in both the groups.
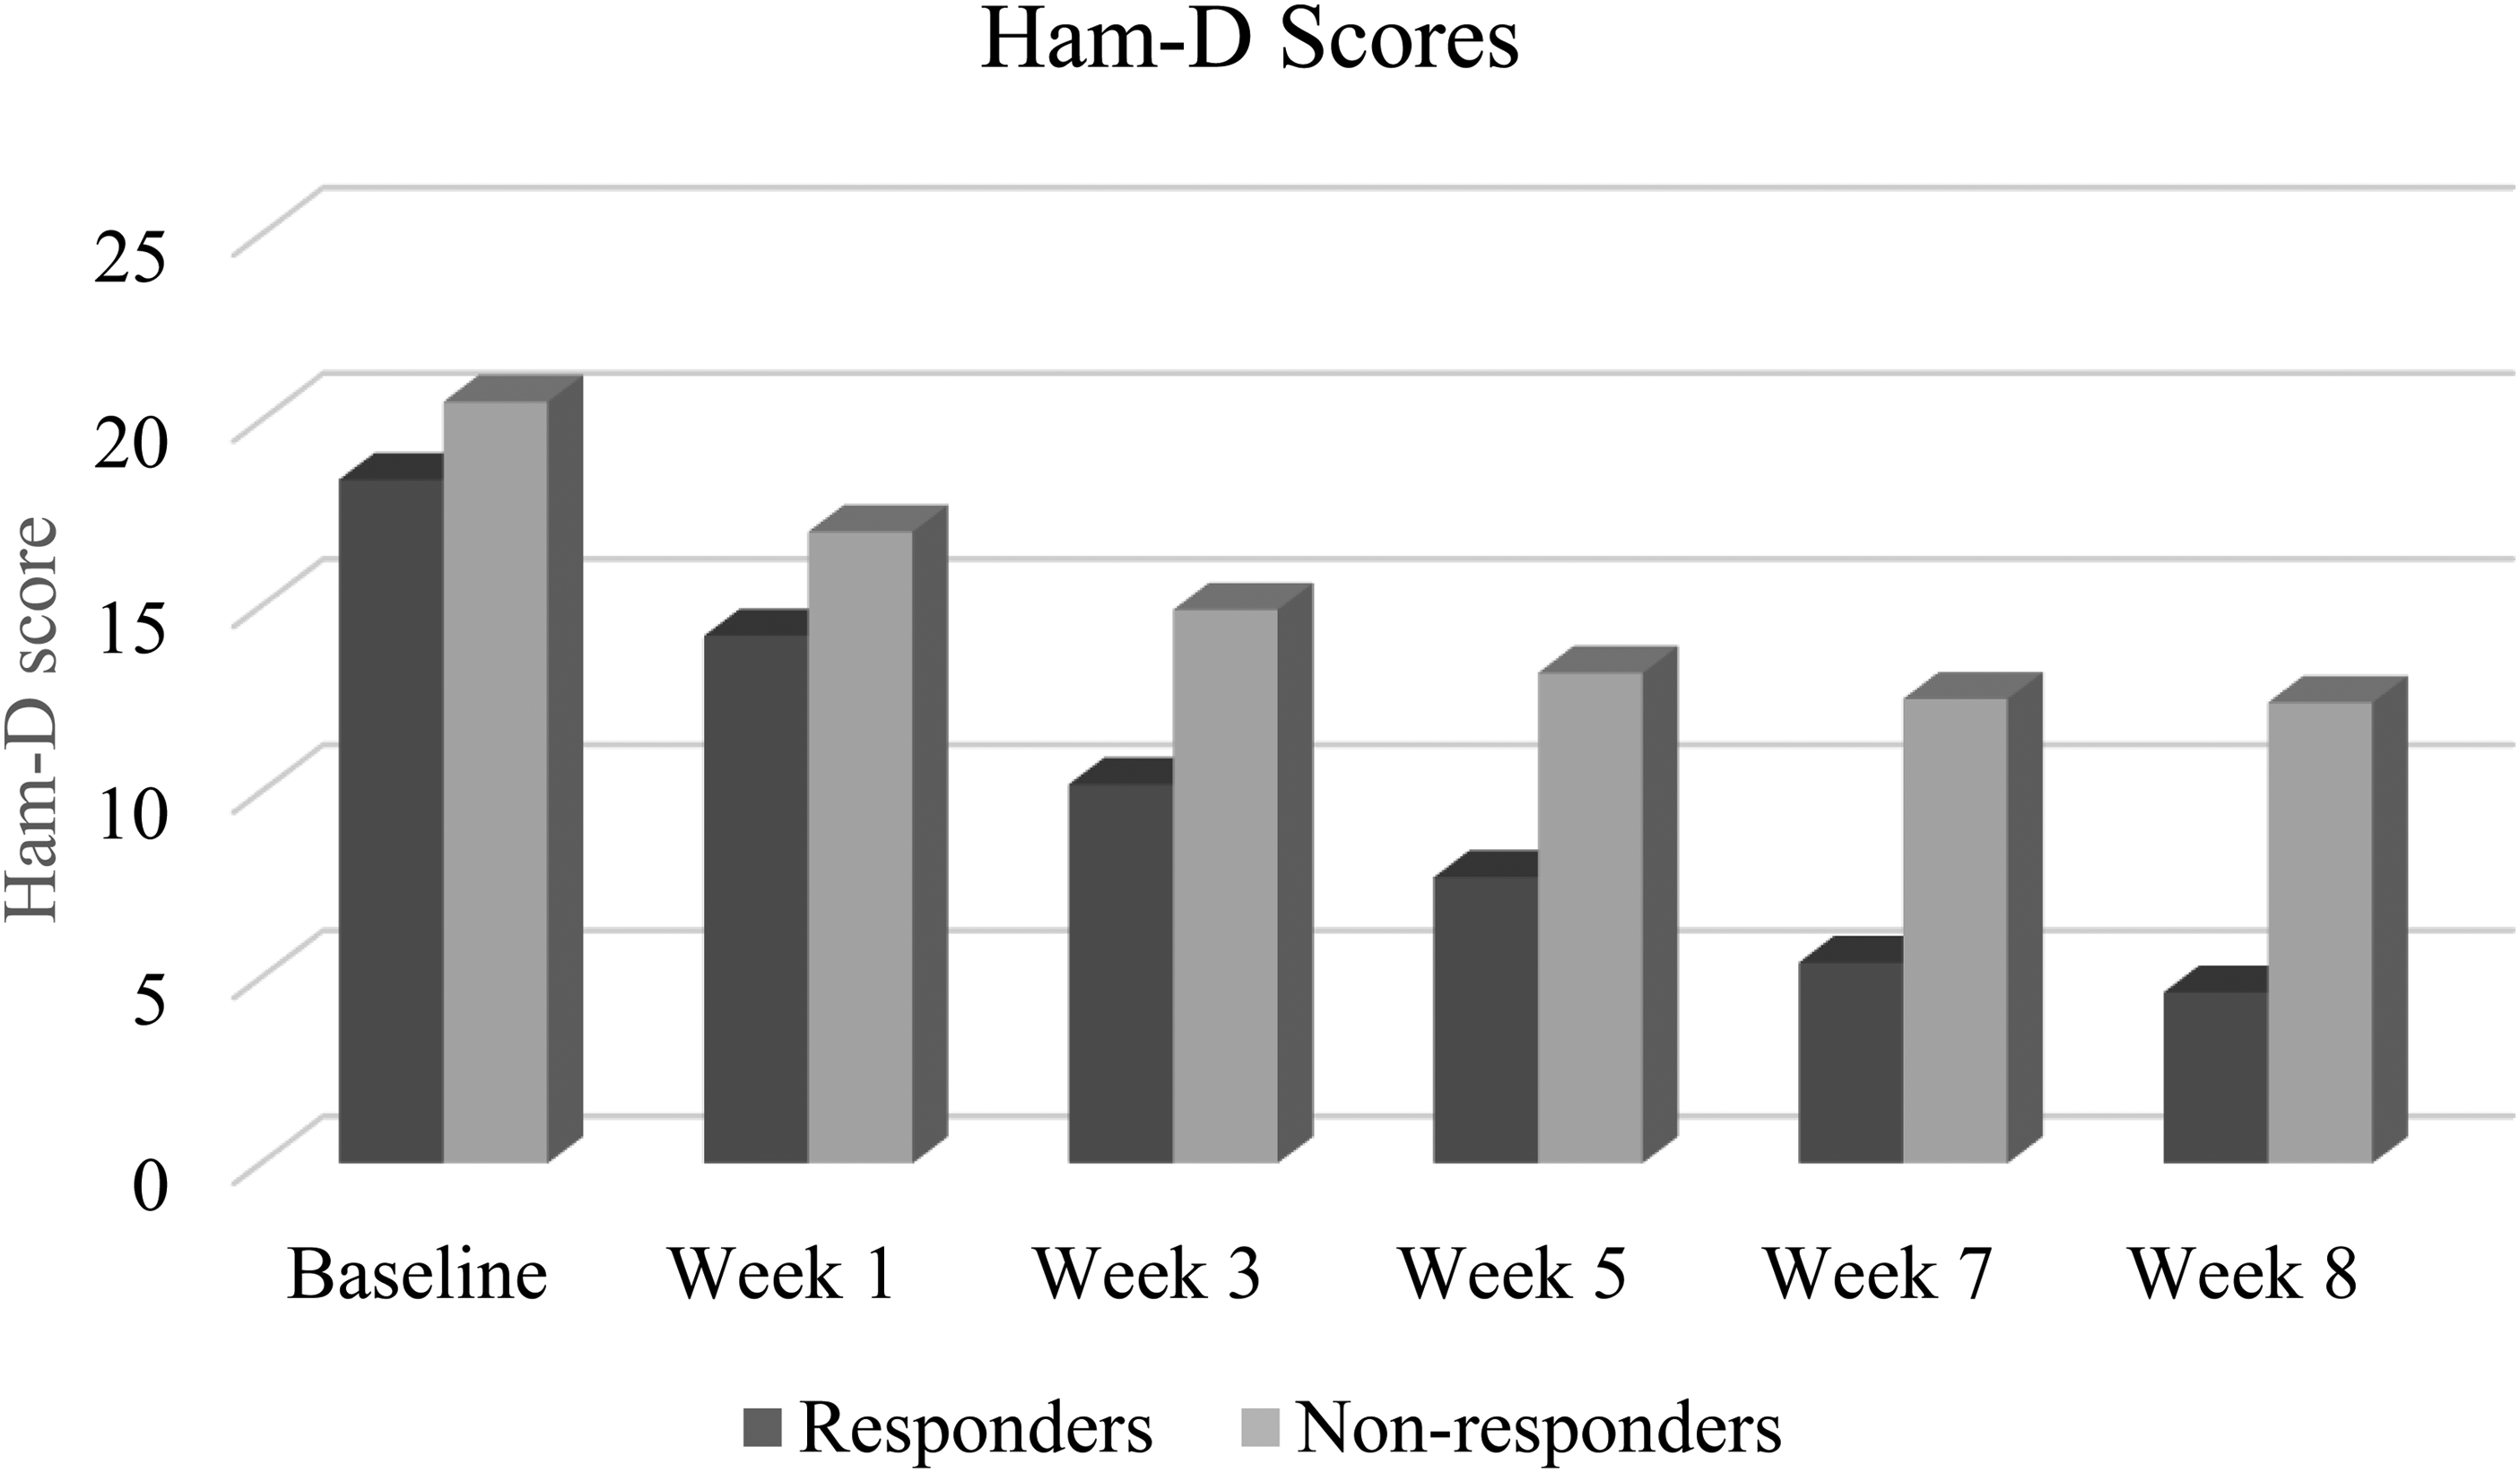
Bar chart depicting comparison of mean Ham-D scores in responders and non- responders at various time intervals.
Ethical Considerations
The purpose and design of the study was explained to the patient in the language they understood. Patient had right to withdraw from the study anytime without giving any reason. The confidentiality of the information gathered was maintained. Study was conducted in accordance to the defined guidelines of Central Ethics Committee and principles enunciated in the ‘Declaration of Helsinki’. Study was approved by Institutional Ethics committee and registered with Clinical Trial Registry-India.
EEG Acquisition
Patients were briefed about the procedure of EEG recording. A written consent was taken for the recording. Patients were given the instruction before recording to remain awake while keeping the eye closed. EEG was recorded by the investigator in psychiatry ward in a sound-proof room using Clarity EEG BrainTech 40 + , single ended amplifier, Agcl electrodes according to international 10/20 system with 36- channel machine referenced to linked earlobes. Data was recorded in alert state with eyes closed for period of 10 min. Participants were requested to lie quietly on bed, not to fall asleep, and not to think about anything in particular. Immediately after resting state session, the investigator spoke briefly with the participants. All the participants reported that they had not fallen asleep. Impendence of electrodes was kept below 5 KU. Data was sampled at a rate of 256 Hz with 12 bit resolution. Data was recorded at baseline ie before starting the treatment and at 1 week after starting the treatment.
EEG Analysis
The EEG data were acquired from 19 electrodes (Fp1- (Prefrontal-1), Fp2(Prefrontal-2, F7(Frontal-7), F8(Frontal-8), F3(Frontal-3), Fz(Frontal-zero), F4(Frontal-4), C3(Central-3), Cz(Central-zero), C4(Central-4), P3(parietal-3), Pz (parietal-zero), P4 (Parietal-4), T3(Temporal-3), T4(Temporal-4), T5(Temporal-5), T6(Temporal-6), O1(Occipital-1) and O2(Occipital-2). These electrodes were placed on the scalp according to international 10–20 system. The recording parameters were as follows: bandpass finite impulse response filter (FIR) 0.1–70 Hz, sample rate of 256 Hz, and notch filter of 50 Hz. The EEG time-series data of all electrodes were exported to MATLAB platform for further processing. Continuous EEG data were segmented into 2-s epochs and artifacts were rejected using standard thresholding techniques available in EEGLAB toolbox of MATLAB. EEG epochs with amplitude of more than ± 75 μV were rejected. In alpha rhythm, amplitude can range from 2 to 100 µV. Whereas in theta rhythm, amplitude of normal EEG signal goes up to 10 µV (Keenan et al 2005), 26 therefore rejection criterion of >75 µV was used.To detect linear drifts due to artefactual currents data was fitted to a straight line and epoch was rejected if the slope exceeded 50 μV. Standard deviation of mean probability distribution and limit setting for single channel and all channels to 5 standard deviation were used to reject the improbable epochs. Epochs with peaky activity distribution were rejected using a kurtosis measure. Epochs with power spectra beyond the range of − 100 to 25 dB in the frequency window of 20–40 Hz were rejected as they might represent muscle activity. Epochs left after removing artifacts were in the range of 180 to 220. Artifact-free EEG signal was segregated into frequency bands, to extract theta (4-8 Hz) band with the help of discrete wavelet transform. Thus, the signal was decomposed to 5 levels with “sym8” as mother wavelet function. A Fast Fourier Transform (FFT) was performed separately on the wavelet reconstructed signals obtained through approximation and detailed coefficients at different levels. The FFT was used to find the power spectral density for the signal in theta band. Relative power and cordance power were calculated for theta band activity in frontal (F3, F4, F7 and F8) and prefrontal area (Fp1 and Fp2).
Relative power was computed as the ratio of the power spectral density to the frequency band to be analysed and the total frequency band. The advantage of the relative power is that in the conduction of the skull and scalp, the inter-individual deviation associated with absolute power due to the inter-individual difference is reduced.
Cordance values were calculated using an algorithm provided by the UCLA Laboratory of Brain, Behavior, and Pharmacology, as defined in Leuchter et al (1999). 24 This algorithm involves the computation of a re-attributed montage in which absolute and relative power are calculated for each bipolar pair of neighbouring electrodes, followed by a square-root and a z-transformation. The normalized absolute and relative values are then summed for each electrode and for theta band. Average cordance values were used for further analysis.
Statistical Analysis
Normality of quantitative data was measured using Kolmogorov Smirnov tests of Normality. For skewed data comparisons for two groups were made by Mann-Whitney test. For Normally distributed data, Student t-test was applied to compare 2 groups. Group comparisons were made with the Chi-Square test or Fisher's exact test. For time related (comparison of 2 different timings) variables of skewed data Wilcoxon Signed rank test was applied. As cordance power values were less than zero so these were multiplied by 10 10 to properly represent the data. Logistic regression which is used to predict a categorical (usually dichotomous) variable from a set of predictor variables, was carried out to assess the independent contribution of changes in EEG on response. All statistical tests were two-sided and performed at a significance level of α = .05. Analysis was conducted using IBM SPSS STATISTICS (version 22.0).
Results
Out of the 80 patients included in the study 50 patients completed the 8-week follow-up and 30 patients dropped out of the study. Out of 30 drop-out patients 21 were lost to follow-up, 7 refused for second EEG and in 2 cases medication change was required before 8 weeks due to increased intensity of symptoms and patient then refused to be part of the study. Out of 50 patients who completed the study, 36 patients were responders (72%) and 14 patients were non-responders (28%).
Socio-Demographic and Clinical Profile
Mean age of the sample was 39 ± 10 years. Majority of the patients were female (64%), married (78%), educated (88%), home-maker (48%), belonging to nuclear family (66%) and urban background (62%). There was no significant difference among socio-demographic variables in the responder and non- responder groups (Table 1). Mean Ham-D score at baseline was 19 ± 2.7 and 6.8 ± 4.7 after treatment (week 8). There was no significant difference found in the clinical profile of responders and non-responders (Table 1). Majority of the patients in both the groups were those who had first episode of depression, moderate severity, had no comorbidity and no family history of mental illness.
Sociodemographic and Clinical Profile Responders and Non-Responders.
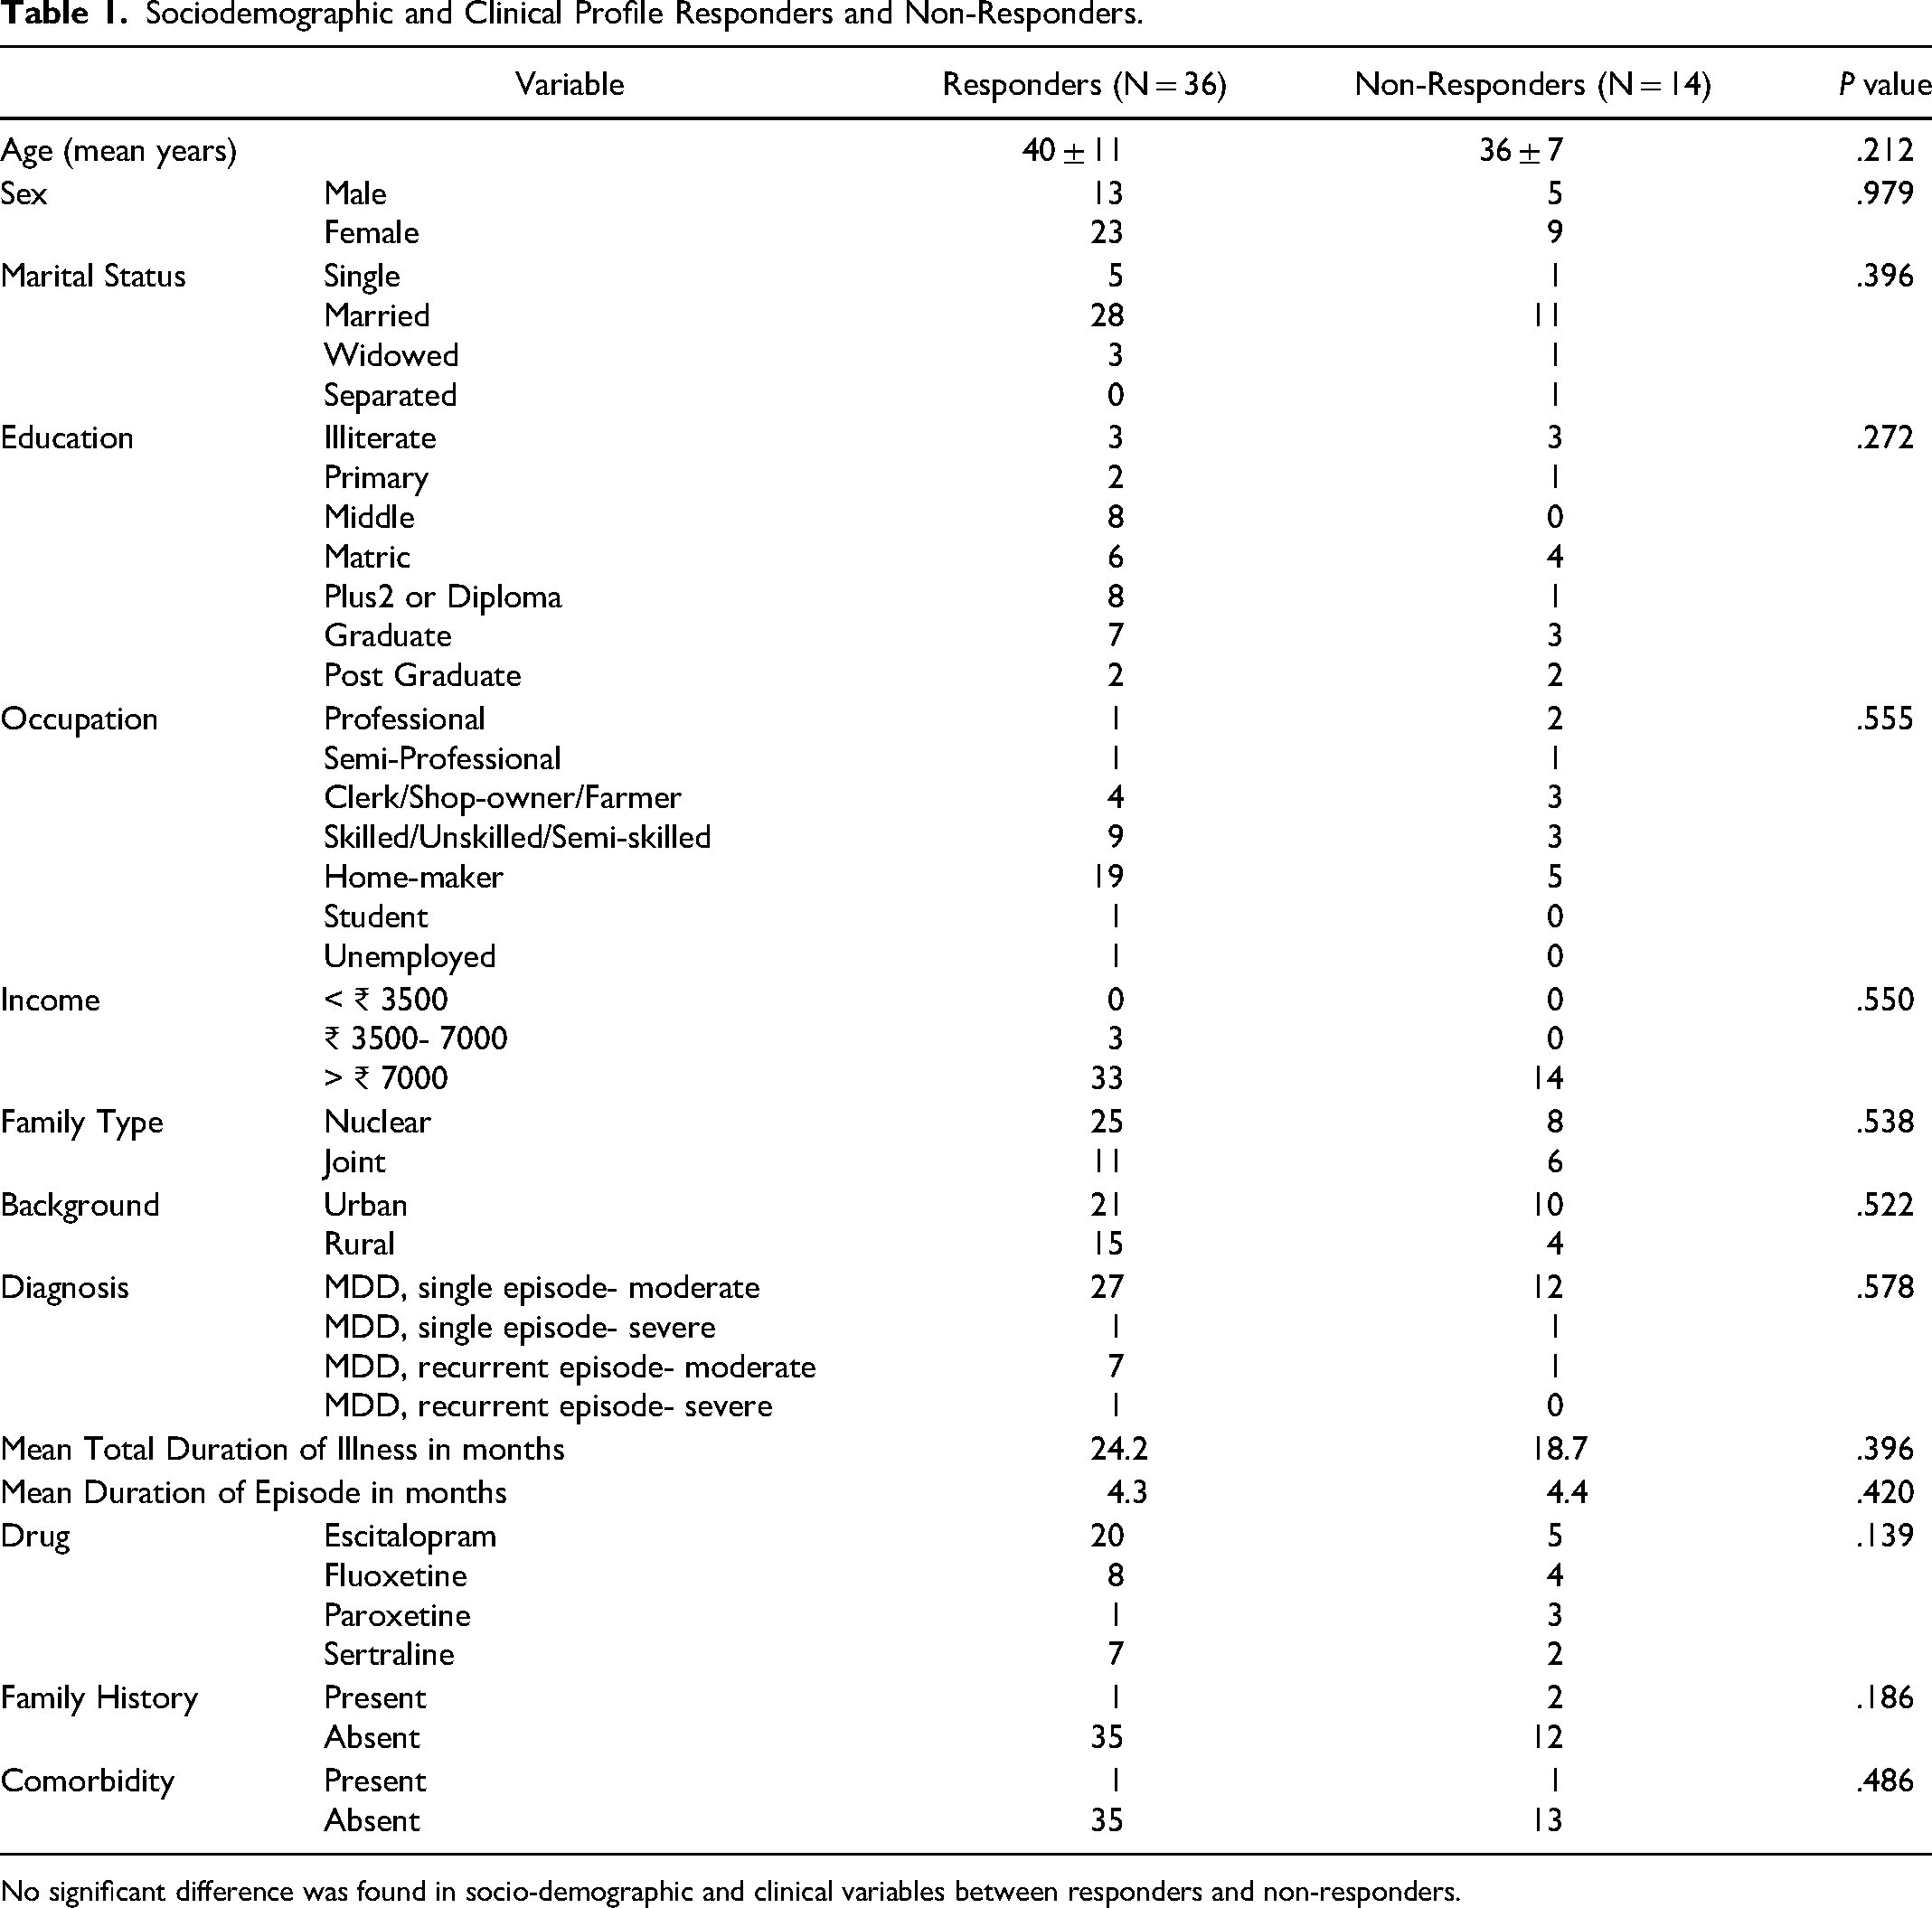
No significant difference was found in socio-demographic and clinical variables between responders and non-responders.
Side Effects
Majority of the patients received Escitalopram. Comparison of various side effects show that Nausea was the most common side effect experienced by the patients followed by increased dream activity and sedation. Few of the patients experienced decreased sleep and weight gain (Figure 2).
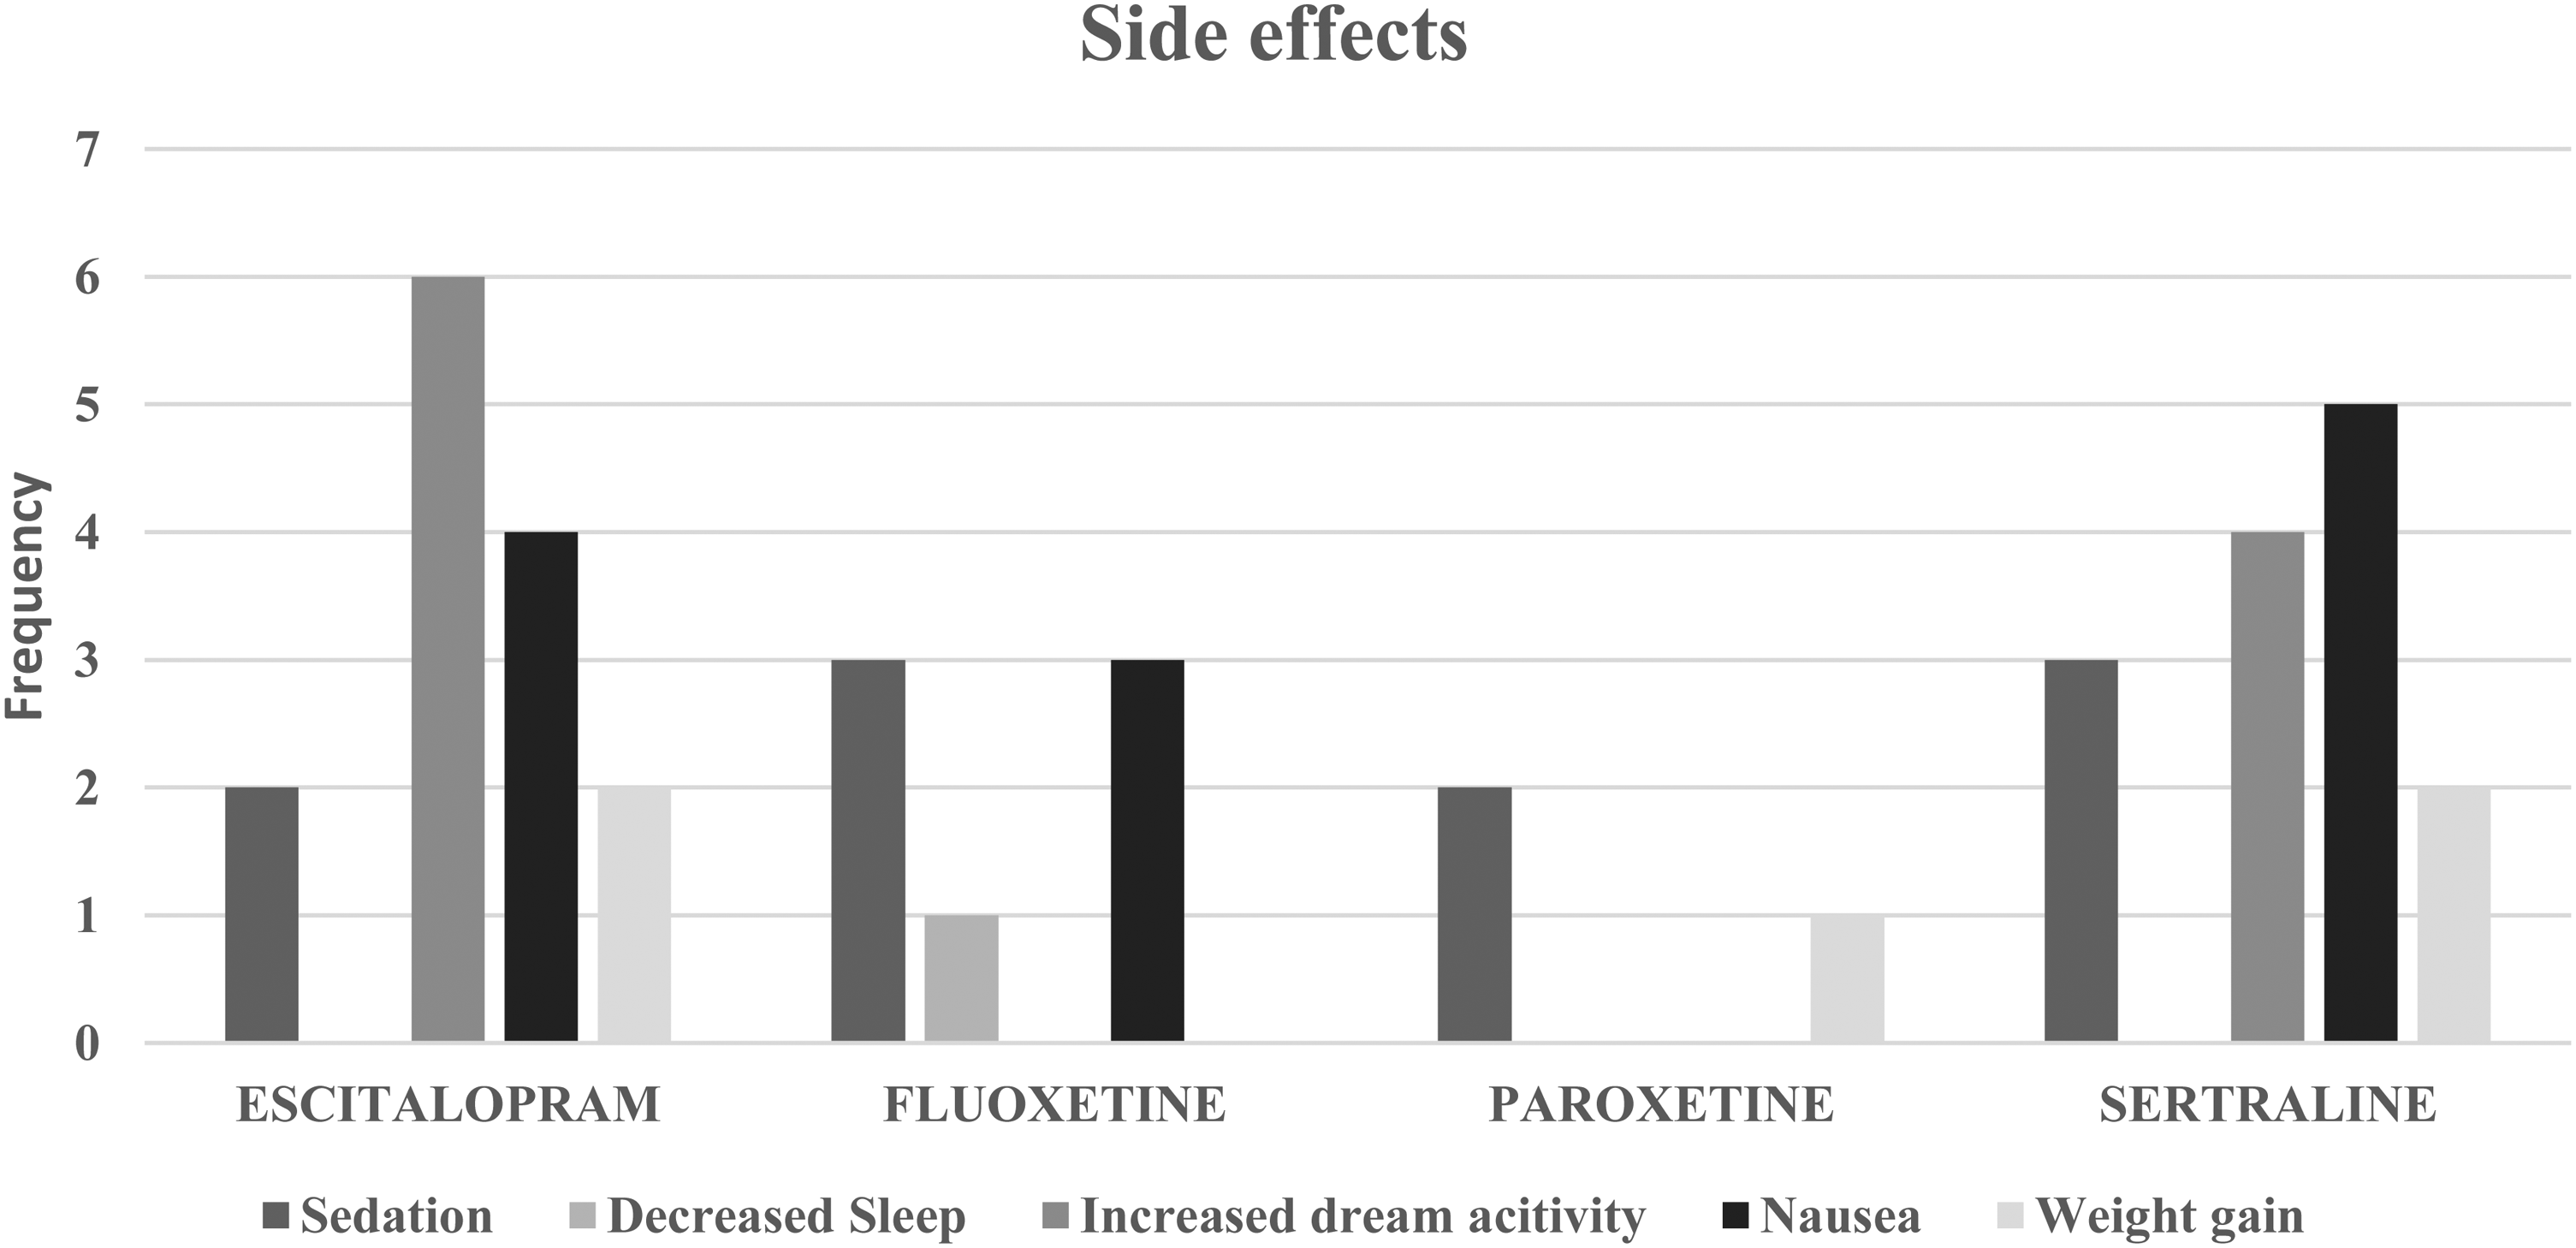
Bar chart depicting side effects of antidepressants.
QEEG Changes
Relative frontal and pre-frontal theta value
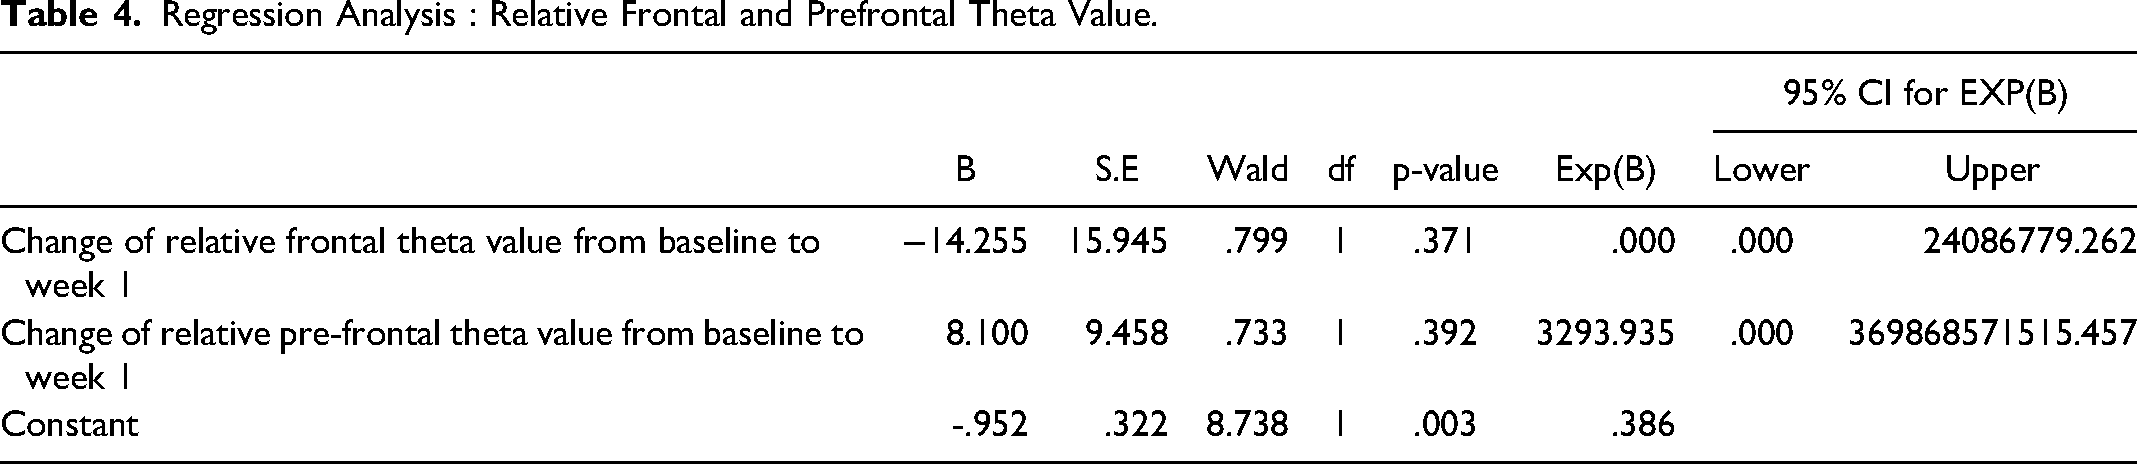
Comparison of relative frontal theta value between responders and non-responders show that there was significant decrease in relative frontal theta value from baseline to week 1 in responders (p = 0.021) and no significant decrease was observed in non-responders(p = 0.140) (Table 2). Whereas no significant decrease was observed in relative pre-frontal theta value between responders and non-responders (p = 0.080 & p = 0.177 respectively) (Table 2). Analysis of relative theta value of individual electrodes show that there was a significant difference observed in values from baseline to week one at prefrontal-1 (p = 0.029), frontal-3 (p = 0.036) and frontal-4 (p = 0.008) in responders while no significant difference was observed in non-responders (Table 3). However, regression analysis revealed that this decrease in relative frontal and pre-frontal theta value from baseline to one week could not predict treatment response (p = 0.371 & p = 0.392 respectively) (Table 4).
Comparison of Frontal and pre-Frontal Theta Value(Relative Theta and Cordance) Between Responders and non-Responders at Baseline and Week 1.
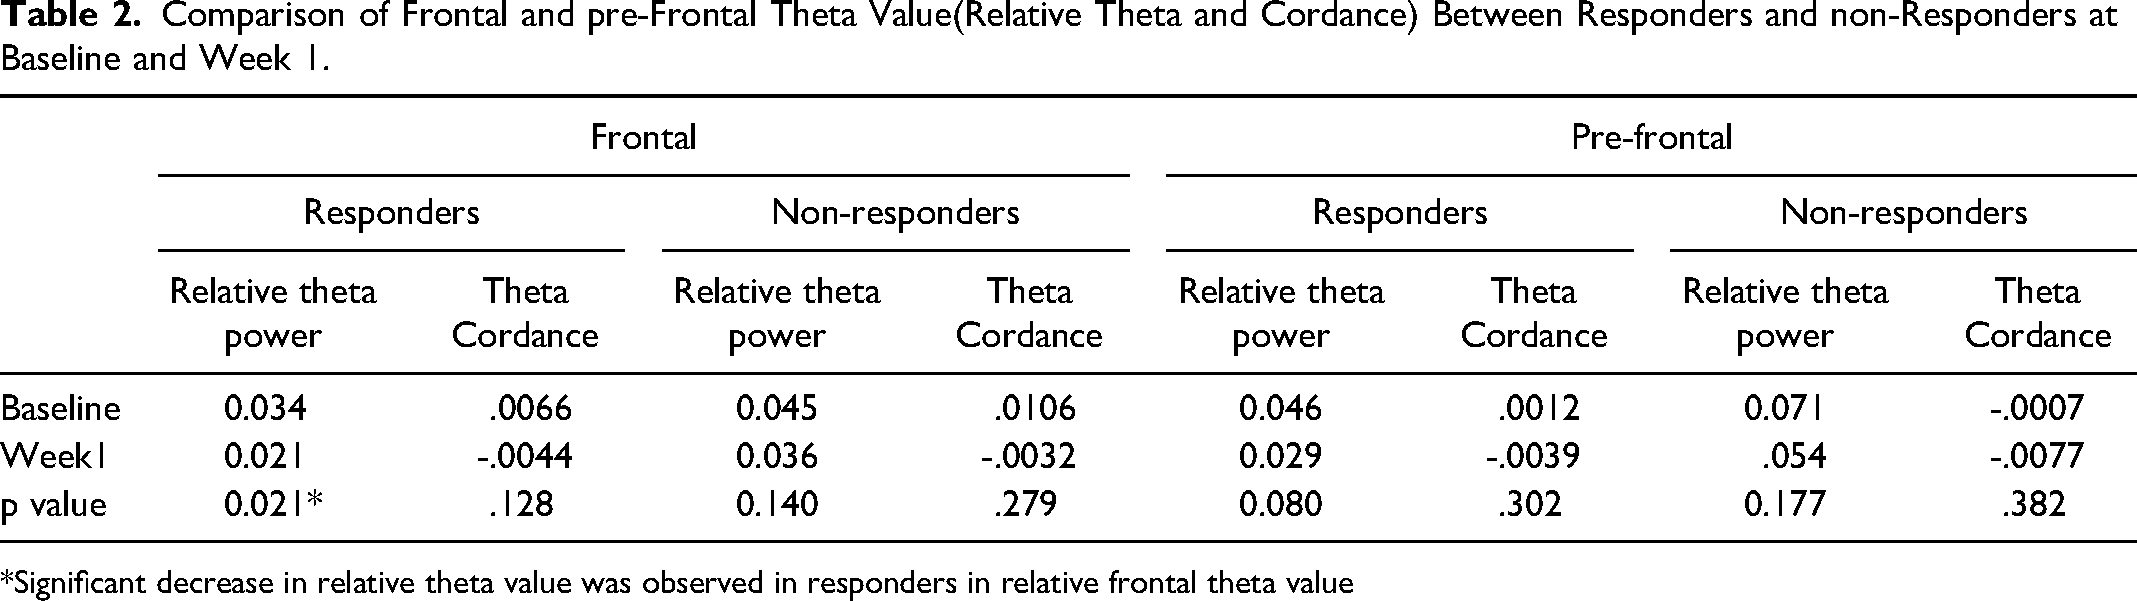
*Significant decrease in relative theta value was observed in responders in relative frontal theta value
Change in Relative Frontal and pre-Frontal Value from Baseline to Week 1 for Individual Electrodes.
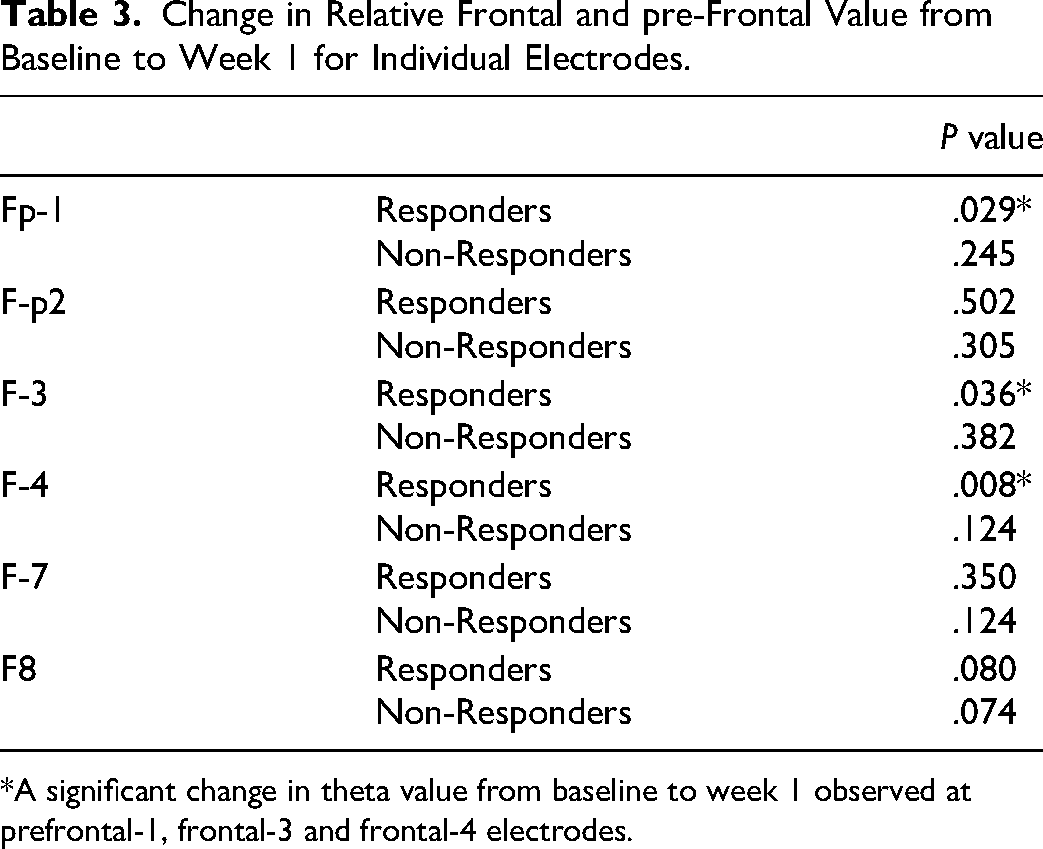
*A significant change in theta value from baseline to week 1 observed at prefrontal-1, frontal-3 and frontal-4 electrodes.
Regression Analysis : Relative Frontal and Prefrontal Theta Value.
Frontal and pre-frontal theta cordance values
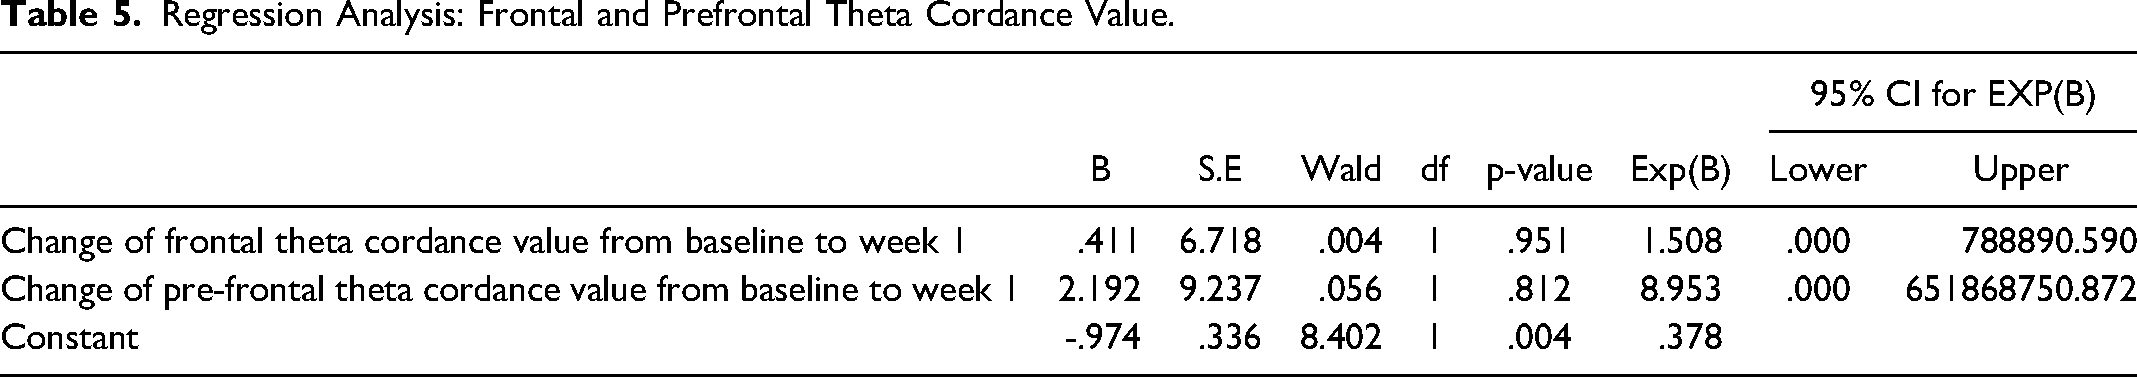
Comparison of frontal theta cordance value between responders(p = 0.128) and non-responders(p = 0.279) show that there was no significant difference in value from baseline to week 1 in both the groups. Similarly, no significant difference was observed in prefrontal theta value of responders and non-responders (p = 0.302 & p = 0.382 respectively) (Table 2). In regression analysis, changes in frontal(p = 0.951) and pre-frontal(p = 0.821) cordance value couldn't predict treatment response (Table 5)
Regression Analysis: Frontal and Prefrontal Theta Cordance Value.
Baseline comparison
Baseline comparison of theta cordance and relative theta power between responders and non-responders as well as remitters and non-remitters show that there is no significant difference. (Tables 6 and 7)
Baseline Comparison of QEEG Parameters Between Responders and non-Responders.
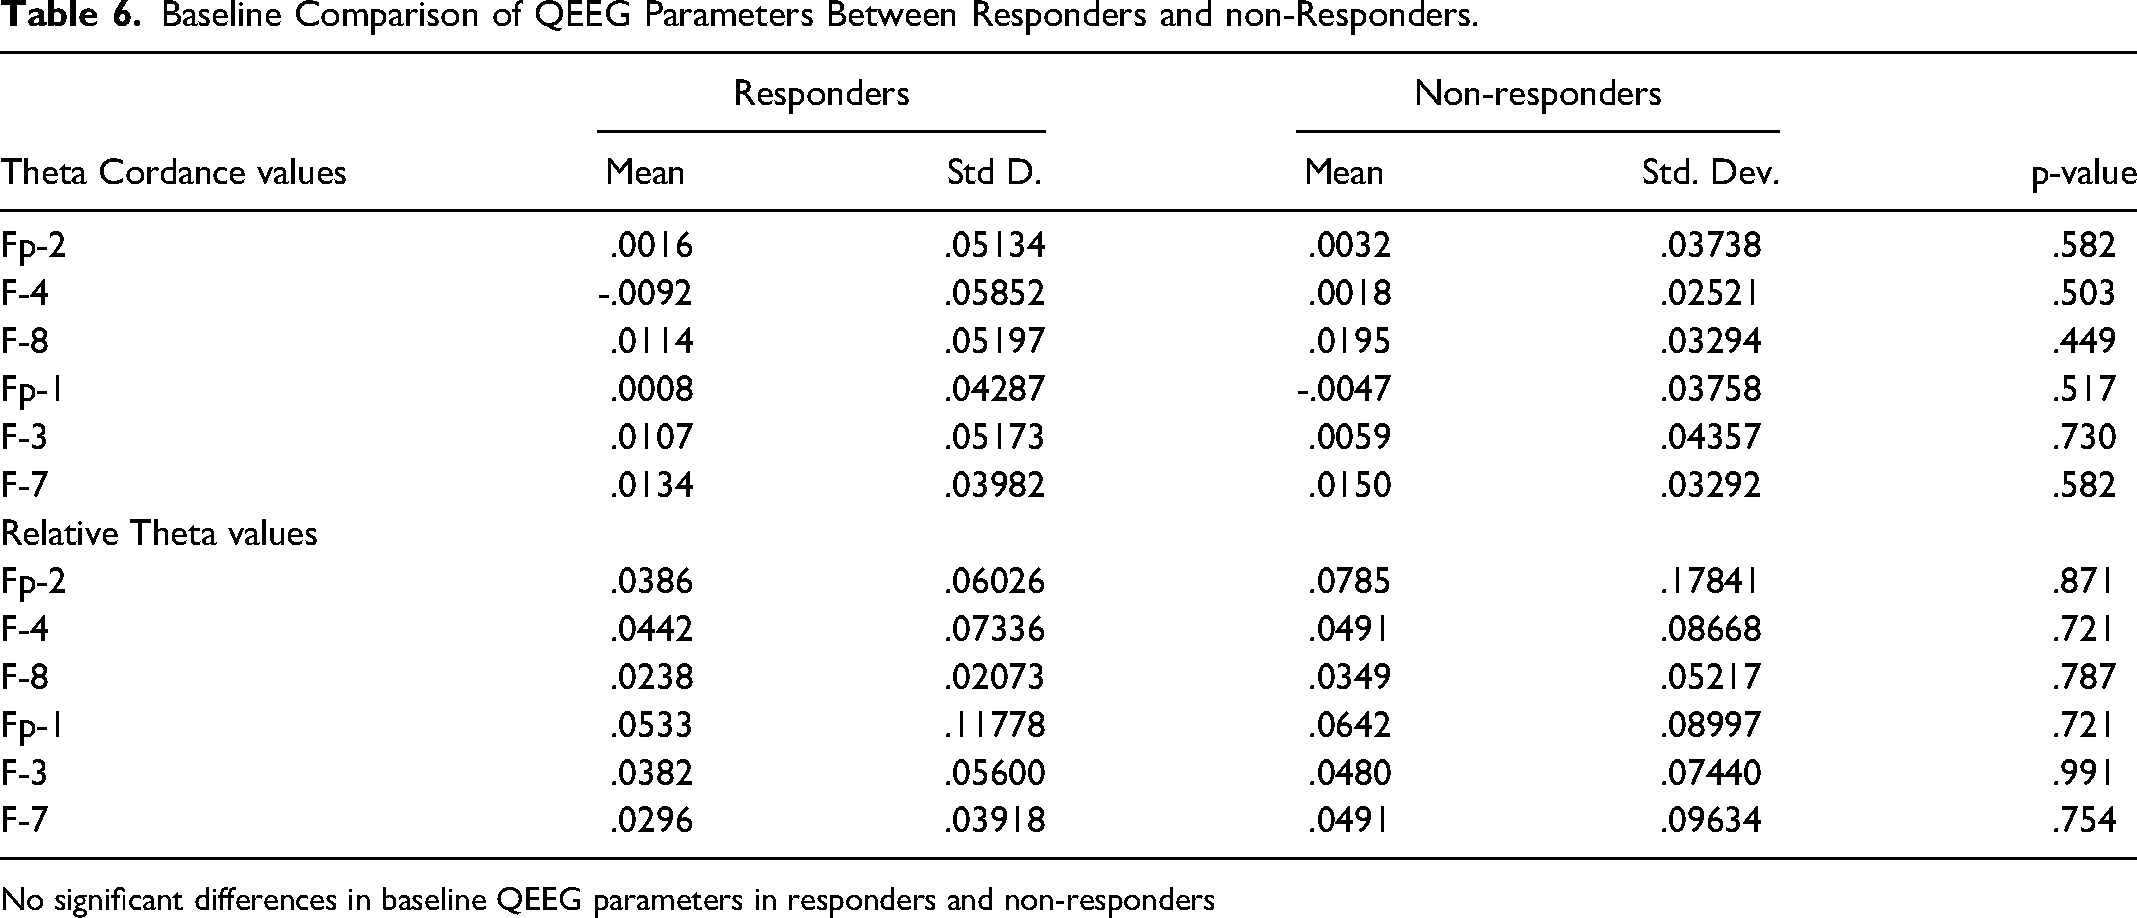
No significant differences in baseline QEEG parameters in responders and non-responders
Baseline Comparison of QEEG Parameters in Remitters and Non-Remitters.
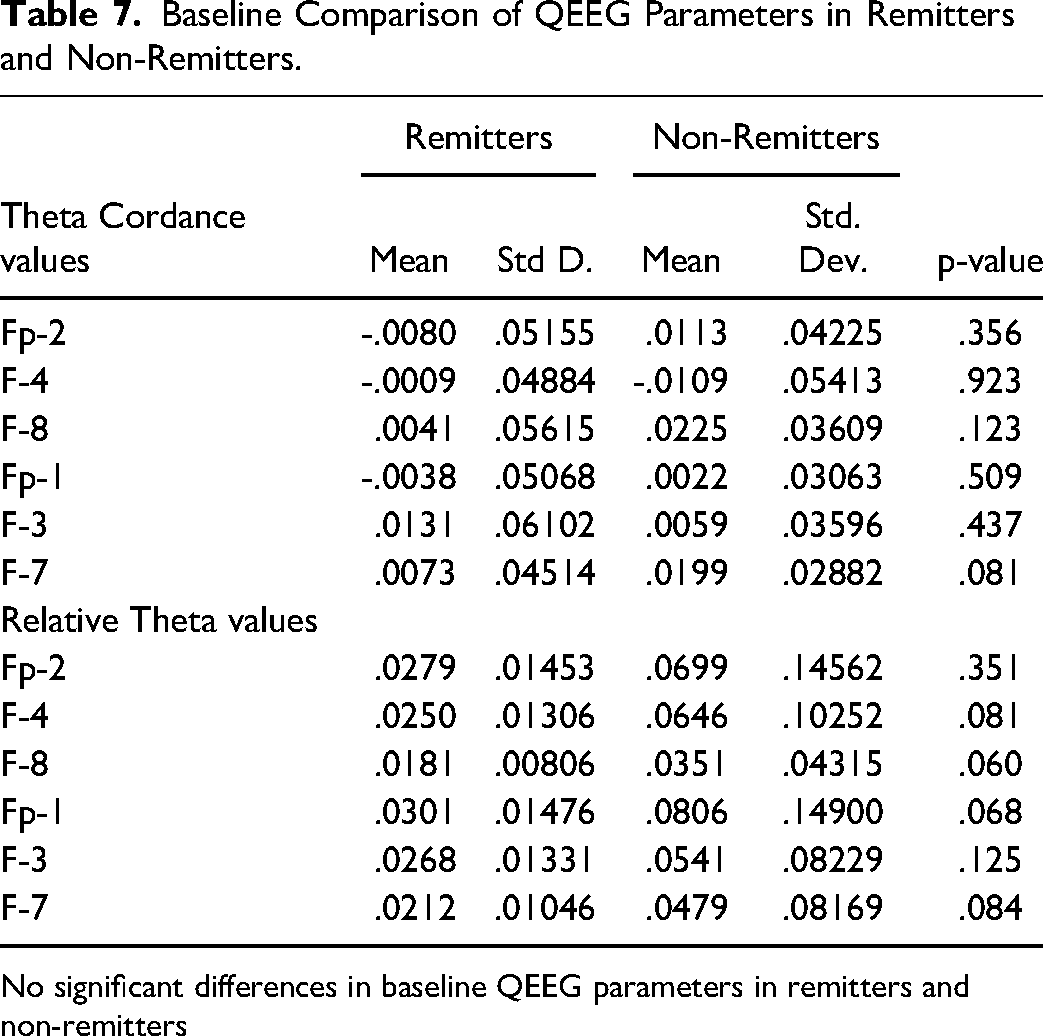
No significant differences in baseline QEEG parameters in remitters and non-remitters
Effect size
Cohen d effect size of difference between Responders and Non-responders and baseline-week one analysis was 0.044.
Discussion
This study was carried out to predict the antidepressant treatment response with early changes seen in frontal and prefrontal theta values using QEEG. A total of 50 patients completed this study, out of which 36 (72%) patients responded to the treatment and 14(28%) were non-responders. The response rate in this study was higher as compared to previous study in which it was found to be around 47%. 3 Similarly response rate with SSRI was found to be 53–64% in a review of comparative efficacy of antidepressants. 27 Smaller number of cases with severe depression in present study may have led to this difference in response rate. A total of 50% patients experienced side effects with antidepressant in present study. Overall psychic side effects were more as compared to neurological, autonomic or other side effects. In psychic side effects increased dream activity and sedation was most frequently reported. In analysis of individual side effects, it was found that nausea was most common among all. This finding is consistent with results of a previous study. 28
In this study no significant association was found between sociodemographic variables and response. This finding is consistent with findings of a study on socio-demographic and neurocognitive predictors in which no socio-demographic variable could predict treatment response. 29 However some studies have reported few association with response like higher level of education, employed, female gender, higher income having better outcome 3 and increased age with poor response. 30
No association was found between other clinical variables and response in this study. In the past studies 30,31 have shown that various clinical variables could predict treatment response. Comorbid psychiatric and medical illness has been associated with poor response. Age of onset of first episode, duration of episode and number of hospitalisations all have been associated with response. Many of these variables were not included in the present study.
Our study has shown that mean relative theta power in frontal area shows a significant reduction in relative theta value from baseline to week 1 in responders. Further analysis revealed that out of all the frontal electrodes only frontal-3 and frontal-4 showed significant early change in theta value in responders. This early change in theta value however couldn't predict the treatment response.
In the past, theta power has been found to be specifically related with treatment response. Early changes in theta value in anterior region after starting antidepressant have been observed in the past. 13 However, contrary to the finding of our study increase in theta value after treatment have also been associated with better outcome. 13
A similar study conducted using paroxetine found that EEG predictors were again localised to frontal region. Lesser pre-treatment theta value in frontal region was associated with better response. 14 Pre-treatment EEG parameters could differentiate responders from non-responders in a study conducted with Fluoxetine. 15
This relative theta power in frontal region again differentiated responders in a study involving wide variety of drugs among SSRI and SNRI. Early changes in theta value were associated with better outcomes. 17
In the present study theta cordance couldn't predict the treatment response. No significant change in theta cordance value was found in both the responders or non-responders after one week of antidepressant treatment. This finding is contrary to the earlier studies15,16,18-20 where theta cordance especially in prefrontal area could predict treatment response with different types of antidepressant. Responders have been associated with significant decrease in prefrontal region as early as 48 h. 16 Similarly this decrease in theta cordance has also been seen in patients of treatment resistant depression. 18 This finding has been consistent in venlafaxine 19 and Bupropion. 20
Although cordance, an EEG measure calculated by combination of absolute and relative power has consistently predicted the treatment response but its interpretation is not without limitations. As compared to other EEG parameters no significant pre-treatment difference has been observed in cordance value in responders and non-responders. 32 No clear cut association have been found with cordance and specific brain area in neuroimaging studies. 32 As study was conducted in specific geographical area with limited sample size it may have contributed in non-replication of findings. Future studies conducted without these limitations will provide better understanding regarding role of QEEG in treatment prediction.
Strenghts & Limitations
Although this study was conducted with sound methodology. To decrease the confounding variables – only those patients were inducted who were not on treatment in past 2 weeks, benzodiazepines were not used in first week of the treatment and no non-pharmacological intervention was carried out during 8-week follow-up period. All the commonly prescribed antidepressant
Conclusion
Although there has been a growing evidence that QEEG measures can predict antidepressant treatment response and theta band has emerged as a useful predictor in past studies. However, our study points out that early changes are observed in theta value with antidepressant but it doesn't predict the treatment response. This study adds up a negative evidence for QEEG as a predictor of antidepressant treatment response.
Footnotes
Acknowlegment:
None
Disclosures
None
Declaration of Conflicting Interests
The author(s) declared no potential conflicts of interest with respect to the research, authorship, and/or publication of this article.
Ethical Approval
The study was approved by Institutional Ethics Committee.
Funding
The author(s) received no financial support for the research, authorship, and/or publication of this article