
Abstract
Background: People diagnosed with substance use disorders (SUDs) are at risk for impairment of brain function and structure. However, physicians still do not have any clinical biomarker of brain impairment that helps diagnose or treat these patients when needed. The most common method to study these patients is the classical electroencephalographic (EEG) analyses of absolute and relative powers, but this has limited individual clinical applicability. Other non-classical measures such as frequency band ratios and entropy show promise in these patients. Therefore, there is a need to expand the use of quantitative (q)EEG beyond classical measures in clinical populations. Our aim is to assess a group of classical and non-classical qEEG measures in a population with SUDs. Methods: We selected 56 non-medicated and drug-free adult patients (30 males) diagnosed with SUDs and admitted to Rehabilitation Clinics. According to qualitative EEG findings, patients were divided into four groups. We estimated the absolute and relative powers and calculated the entropy, and the alpha/(delta + theta) ratio. Results: Our findings showed a significant variability of absolute and relative powers among patients with SUDs. We also observed a decrease in the EEG-based entropy index and alpha/(theta + delta) ratio, mainly in posterior regions, in the patients with abnormal qualitative EEG. Conclusions: Our findings support the view that the power spectrum is not a reliable biomarker on an individual level. Thus, we suggest shifting the approach from the power spectrum toward other potential methods and designs that may offer greater clinical possibilities.
Introduction
Substance use disorders (SUDs) are a leading cause of morbidity and mortality worldwide. 1 Given the global burden of disease associated with SUDs, substance use remains a severe public health concern. 2 Individuals diagnosed with SUDs are at increased risk for impairment of both brain function and structure. 3 However, physicians still lack any clinical biomarker of brain impairment that helps diagnose or treat these patients when needed. Therefore, reliable and valid measures of brain health in SUDs are an essential component of research to successfully identify etiologic factors, effective treatments, and associated adverse outcomes.
Electroencephalography (EEG) is, by far, the most used neurobiological research tool for assessing individuals with SUDs. Several studies have been conducted to address issues related to screening individuals with SUDs from healthy controls using event-related potentials (ERPs) 4 and resting-state EEG (rEEG). 5 ERPs represent the average electrical activity appearing after specific cognitive, emotional, and sensory stimuli. They are composed of different components named according to their polarity (positive or negative) and the moment when they occur (in milliseconds; for instance, P300). 4
Resting-state EEGs are primarily represented by the quantitative analysis of brain oscillations reflecting the sum of postsynaptic potentials generated by a neuronal field close to an electrode when the patient is resting awake with eyes closed. 5 The most common method is to analyze constituents of spectra, and the classical measures include absolute and relative powers. However, most of the results of both ERP and rEEG studies come from group investigations with averaged data (group-design approach). Therefore, the individual applicability of the results is limited and consequently their clinical utility.
There is still considerable debate about the clinical utility of quantitative (q)EEG. 6 On the one hand, some studies have proven qEEG unnecessary and misleading, as it neglects morphology, context, and detailed time behavior.7,8 And on the other hand, other studies have demonstrated that qEEG is a valid and reliable indicator of brain function relevant to many conditions and disorders.9,10 However, despite the ongoing debate, we have seen a surge in the clinical use of qEEG in the last two decades, such as continuous EEG in critically ill patients in Intensive Care Units11–13.
Therefore, there is a need to expand the use of qEEG beyond classical measures in different clinical populations. Regarding these classical measures, chronic substance use has been generally associated with neural hyperactivation (ie, increased power for higher frequency bands). On the other hand, abstinence has been usually associated with neural hypoactivation (ie, increased power for lower frequency bands). 14 For example, it has been reported higher power in low-frequency bands (delta and theta) during abstinence in alcohol use disorder.15,16 Other studies also noted changes in theta and alpha bands in relation to abstinence and relapse.15,16 In addition, patients with chronic alcohol use disorder have shown an increase in beta power. 14 Therefore, a ratio combining different frequency bands could be a potential biomarker worth it to explore. For example, the alfa-delta/theta ratio has been clinically validated and used for brain monitoring in selected patients.17,18 Thus, in SUD populations during abstinence, it would be expected to find an increase in the slow-frequency powers and therefore a decrease in any fast frequencies/slow frequencies ratio.
Other authors have found signs of brain dysfunction, which has been associated with a decrease in the complexity of the EEG signal. 19 Entropy is a nonlinear measure of uncertainty and degree of complexity in a time series and has been shown to represent the level of chaos in the brain. 20 Therefore, it would also be expected to find a decrease in the complexity of the EEG signal and consequently, a decreased entropy index in these kinds of patients. Taking all this into account, we aim to assess a group of classical and non-classical qEEG measures in a population with SUDs to find whether these objective (quantitative) measures could replicate the main subjective (qualitative) findings observed in their routine EEGs.
Material and Methods
Participants and Study Design
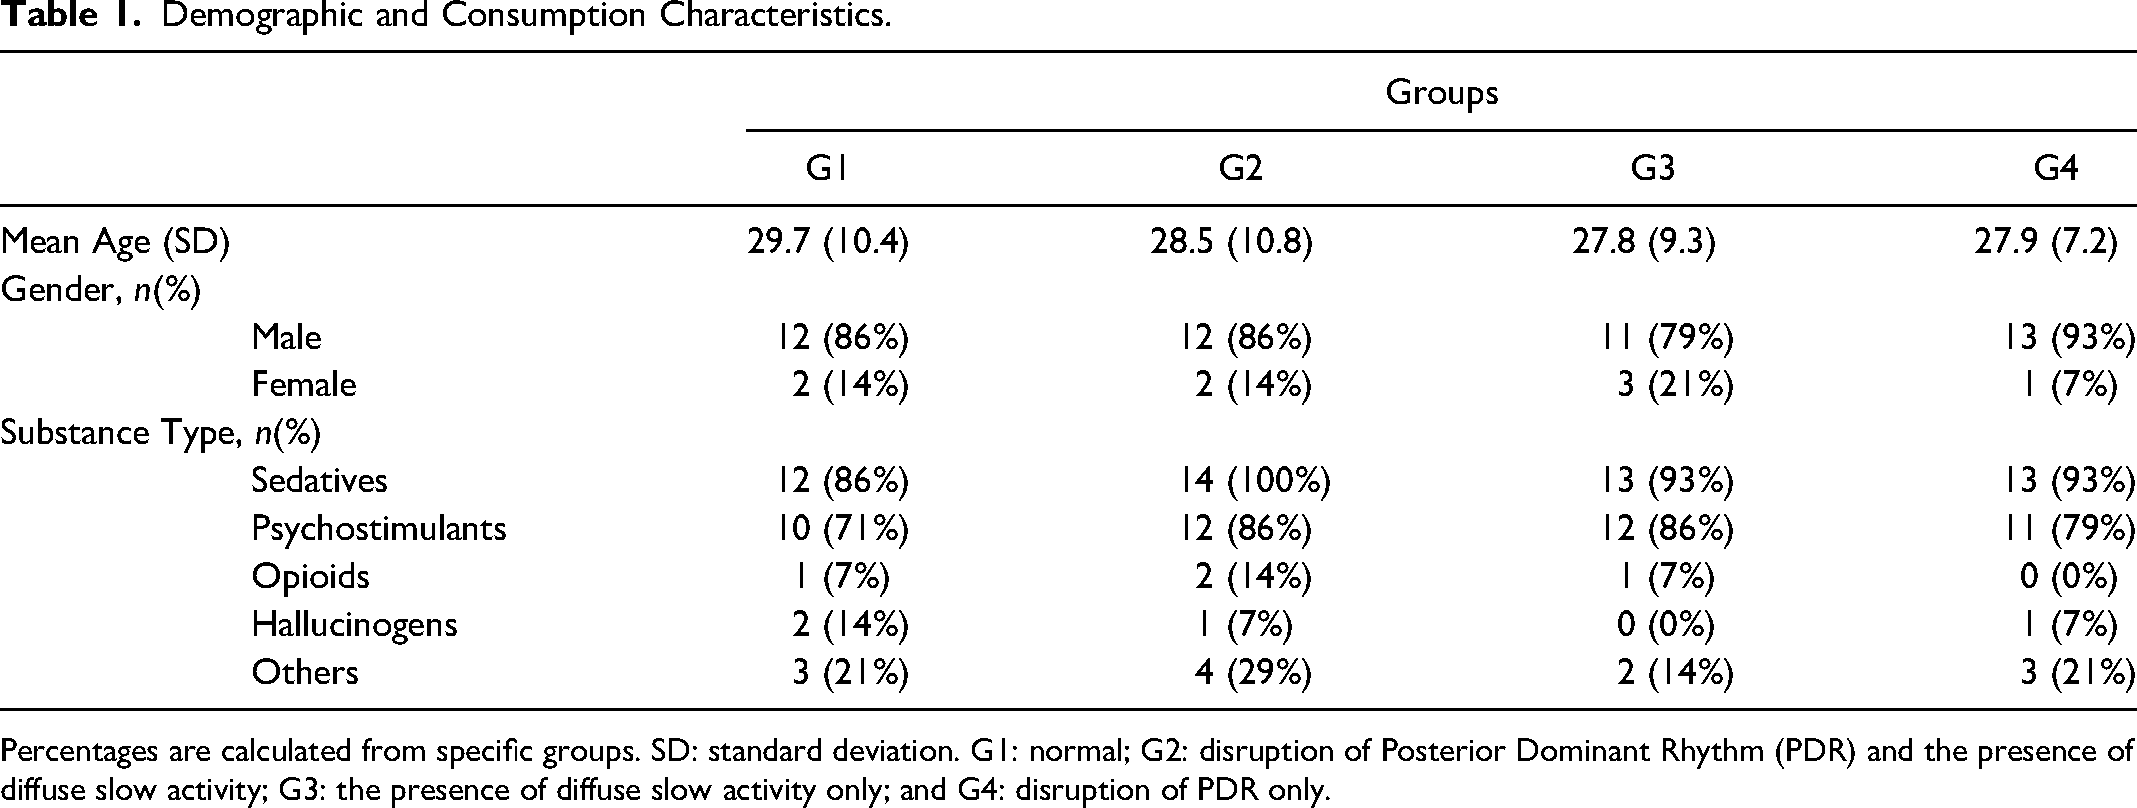
Fifty-six non-medicated, drug-free, and right-handed adult patients (30 males) admitted to Rehabilitation Clinics were selected. All the patients were diagnosed with SUDs by an experienced psychiatrist according to the criteria established by the American Psychiatric Association's Diagnostic and Statistical Manual of Mental Disorders, Fifth Edition (DSM-V). In addition, all the clinics had a protocol in which patients get a routine EEG during the second week of their admission. Patients with current psychiatric comorbidity, serious unstable medical illness, and neurologic disorders were excluded from the study. All patients consumed two or more substances, and the combination of alcohol and methamphetamine was the most frequent. Table 1 shows the main demographic and consumption characteristics of the participants.
Demographic and Consumption Characteristics.
Demographic and Consumption Characteristics.
Percentages are calculated from specific groups. SD: standard deviation. G1: normal; G2: disruption of Posterior Dominant Rhythm (PDR) and the presence of diffuse slow activity; G3: the presence of diffuse slow activity only; and G4: disruption of PDR only.
According to qualitative EEG findings, patients were divided into four groups (14 patients each). Groups were as follows, G1: normal; G2: disruption of Posterior Dominant Rhythm (PDR) and the presence of diffuse slow activity; G3: the presence of diffuse slow activity only; and G4: disruption of PDR only. The disruption of PDR was defined as slow, asymmetric, and/or lacking reactivity. The diffuse slow activity was defined as the presence of diffuse irregular/polymorphic slowing during the awake state. All patients with normal variants that could potentially change the spectral content of the signal (ie, Ciganek rhythm, Mu rhythm, etc) were identified and these EEG segments were not included in the processing. The study was carried out in accordance with the Declaration of Helsinki and was approved by the local Ethics Committee of our center.
EEGs were recorded with 21 electrodes positioned according to the International 10–20 System using a Cadwell Arc Essentia 32 Channel (Cadwell Industries, Inc. Washington, US) Clinical EEG system (high-pass filter: 0.53 Hz; low-pass filter: 70 Hz; sampling rate: 256 Hz; impedances < 5 kΩ). Routine EEGs were acquired following the American Clinical Neurophysiology Society (ACNS) recommendations. 21 Two board-certified and experienced clinical neurophysiologists reviewed and classified all the EEG studies.
EEG Preprocessing
All EEG recordings were trimmed into three 25-s segments from each participant's awake eyes-closed resting condition, and an artifact removal algorithm was applied using the blind source separation technique. 22 The artifact cleaning procedure consisted of the following steps: (a) source separation of the EEG signals of each of the 25-s windows using the Second Order Blind Identification with Robust Orthogonalization (SOBI-RO) algorithm, (b) eyeblink artifacts were visually identified in the record by the clinical neurophysiologists, (c) a temporal relationship was made between the artifacts of the noisy records and the sources obtained through the algorithm, (d) once the sources of artifacts had been identified, they were eliminated assigning the value of zero to the corresponding source and finally the reconstruction of the records was performed, keeping the information free of artifacts. After the artifact cleaning process, the 75 s of recording for each participant were segmented into 1-s duration windows to guarantee stationarity processes in the signals.23,24
EEG Processing
Seventy-five 1-s preprocessed windows were selected for each participant for each electrode. For each of these windows, the power spectrum was calculated using the fast Fourier transform algorithm, and the absolute and relative powers were estimated for the delta (1–3 Hz), theta (4–7 Hz), alpha (8–12 Hz), and beta (12–30 Hz) bands. Considering the sampling frequency of the recordings (256 Hz) and adhering to the Nyquist theorem, we were able to study frequencies up to 128 Hz. With a sample size of 256 data points, we achieved a spectrum resolution of 1 Hz, which is optimal for this frequency band analysis. At this stage, the alpha/(delta + theta) ratio, using the absolute powers, was also calculated, resulting in 75 indices per electrode per participant. We also calculated the Shannon Entropy index, or information entropy, which is computed as the sum of the probabilities of each event multiplied by the base-2 logarithm of the inverse of that probability. 25
For each of the indices estimated in each of the 75 recording windows of each participant, the median was obtained since the median represents a more general behavior of the data and is not affected by the extreme values that may occur in any recording windows.
Statistical Analysis
The obtained indices were analyzed using the SPSS software package (IBM Corp., version 23, 2015 release). Statistical significance was evaluated using a repeated-measure ANOVA with Group as the between-group factor. Topography was used as the within-group factor (midline electrodes [Fz, Cz and Pz]; left posterior [T5, P3, and O1]; left centrotemporal [T3 and C3]; left frontal [F7, F3 and Fp1]; right posterior [T6, P4, and O2]; right centrotemporal [T4 and C4]; right frontal [F8, F4 and Fp2]). All analyses considered a significance threshold of p < 0.05. A Greenhouse-Geisser correction was applied when required. Finally, post hoc tests were performed using a Bonferroni correction adjusted for multiple comparisons.
Results
Absolute Powers
Figure 1 shows the four groups’ absolute power for each frequency band. In the delta band, no significant difference was observed between the groups (F (3,52) = 2.02, p = 0.12, η2 = 0.10, 1-β = 0.49). In the theta band, a significant group effect was found (F (3,52) = 4.01, p < 0.05, η2 = 0.19, 1-β = 0.81) with a higher power in the G3 compared to the G4 group (p < 0.05). Regarding the alpha band, it was found a significant difference between groups (F (3,52) = 5.53, p < 0.01, η2 = 0.24, 1-β = 0.92). Individual comparisons showed that the G4 group presented a lower power compared to the G3 (p < 0.01) and G1 groups (p < 0.05). Finally, in the beta band, a significant group effect was also found (F (3,52) = 4.76, p < 0.01, η2 = 0.21, 1-β = 0.88) with the G3 group showing a higher power than the G4 group (p < 0.01).
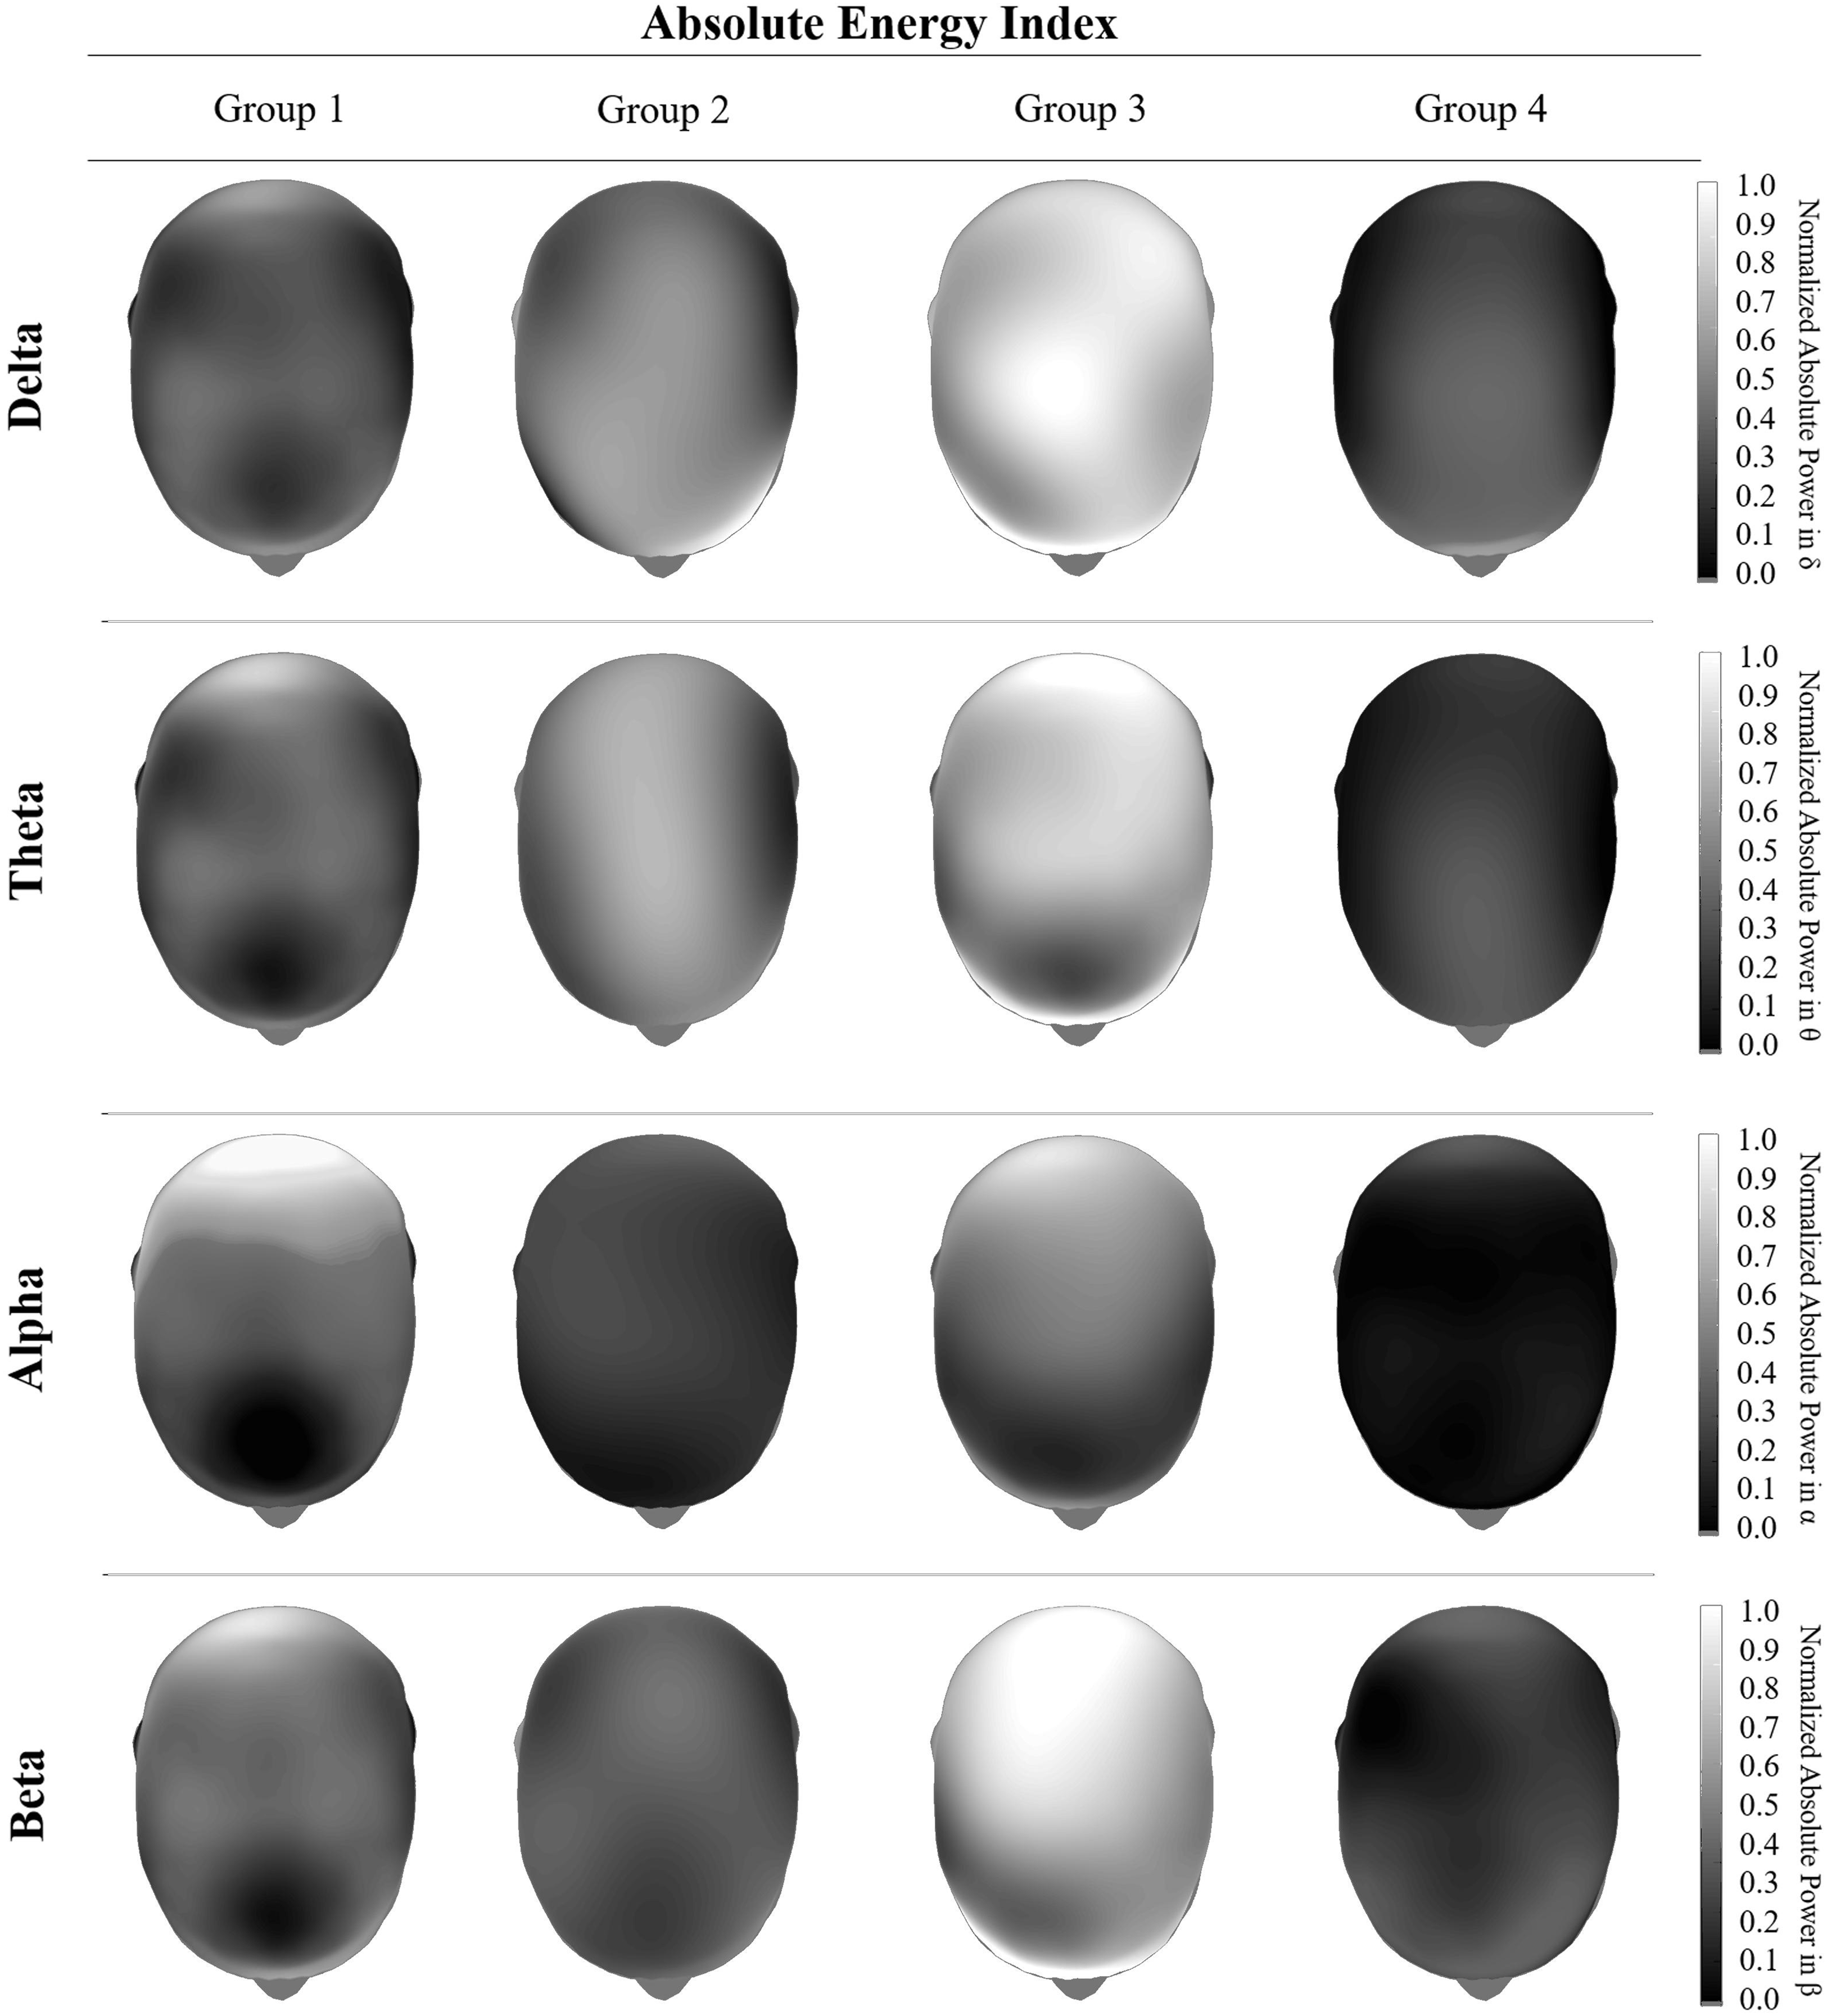
Graphical representation of the behavior of the Absolute Energy Indices in each of the electrophysiological bands. For visual representation purposes, a normalized monocromatic scale is used with respect to the magnitude of each band of interest. The behavior of each of the study groups is represented vertically and corresponds to the following classification: G1: Normal; G2: Disruption of Posterior Dominant Rhythm (PDR) and the presence of slow activity; G3: The presence of diffuse slow activity only; and G4: Disruption of PDR only.
The power analysis by region showed a significant topography effect in the delta band (F (5.24, 272.25) = 3.36, p < 0.01, η2 = 0.06, 1-β = 0.91) and no statistical difference in the interaction of group and topography factors (F (15.71, 272.25) = 1.07, p = 0.38, η2 = 0.06, 1-β = 0.71). Post hoc analyses showed that patients in the G3 group presented higher power with respect to the G1 group in the midline (p < 0.01), left temporal (p < 0.05) and central regions (p < 0.01), as well as in the right frontal region (p < 0.05). Patients from the G3 group also showed higher power compared to the G4 group in the midline (p < 0.05) and left central region (p = 0.01). Finally, patients from the G3 group showed a higher power compared to the G2 group in the left central region (p < 0.05).
Regarding the theta band, the power analysis showed a significant topography effect (F (5.27, 274.12) = 4.90, p < 0.01, η2 = 0.09, 1-β = 0.99). However, the interaction between topography and group did not reach statistical significance (F (15.82, 274.12) = 1.65, p = 0.06, η2 = 0.09, 1-β = 0.91). Post hoc analyses showed higher power in the G3 group with respect to the G1 group (p < 0.05) in the whole brain except in the left temporal and posterior regions. The G3 group also showed higher power with respect to the G2 group but only in the left central region (p < 0.05). On the other hand, the G2 group showed higher power in the left temporal region (p < 0.05) and the midline region (p < 0.05) with respect to the G4 group.
In the alpha band, the power analysis by region showed a significant topography effect (F (3.89, 201.20) = 25.55, p < 0.01, η2 = 0.33, 1-β = 1.00) and a significant interaction of group and topography factors (F (11.61, 201.20) = 3.62, p < 0.01, η2 = 0.17, 1-β = 0.99). In the post hoc analyses were observed a higher power in the G1 group of subjects with respect to the G2 group of patients in the posterior regions (p < 0.01). The G2 group also showed less power compared to the G3 group in the left central (p < 0.05) and in the right frontal regions (p < 0.05).
Regarding the beta band, the power analysis showed a significant topography effect (F (5.96, 310.13) = 2.95, p < 0.01, η2 = 0.05, 1-β = 0.90) but did not show a significant interaction (F (17.89, 310.13) = 1.23, p = 0.24, η2 = 0.07, 1-β = 0.82). Post hoc analyses showed that the G1 group presented less power with respect to the G3 group in the midline (p < 0.01), left temporal (p < 0.01), and central regions (p < 0.05), as well as in the right central (p < 0.05) and right frontal (p < 0.05) regions. The G3 group showed higher power compared to the G2 group in the midline (p < 0.05) left posterior (p < 0.05) and central regions (p < 0.01), as well as in the right central (p < 0.05) and frontal regions (p < 0.05).
Relative Powers
Figure 2 shows the four groups’ relative power for each frequency band. In the delta band, a significant difference was observed between the groups (F (3, 52) = 5.68, p < 0.01, η2 = 0.25, 1-β = 0.93). Individual comparisons showed that the G1 group presented less power than the G4 group (p < 0.01). In the theta band, a significant group effect was also found (F (3,52) = 5.15, p < 0.01, η2 = 0.23, 1-β = 0.90) with a higher power in the G2 compared to the G1 group (p < 0.01).
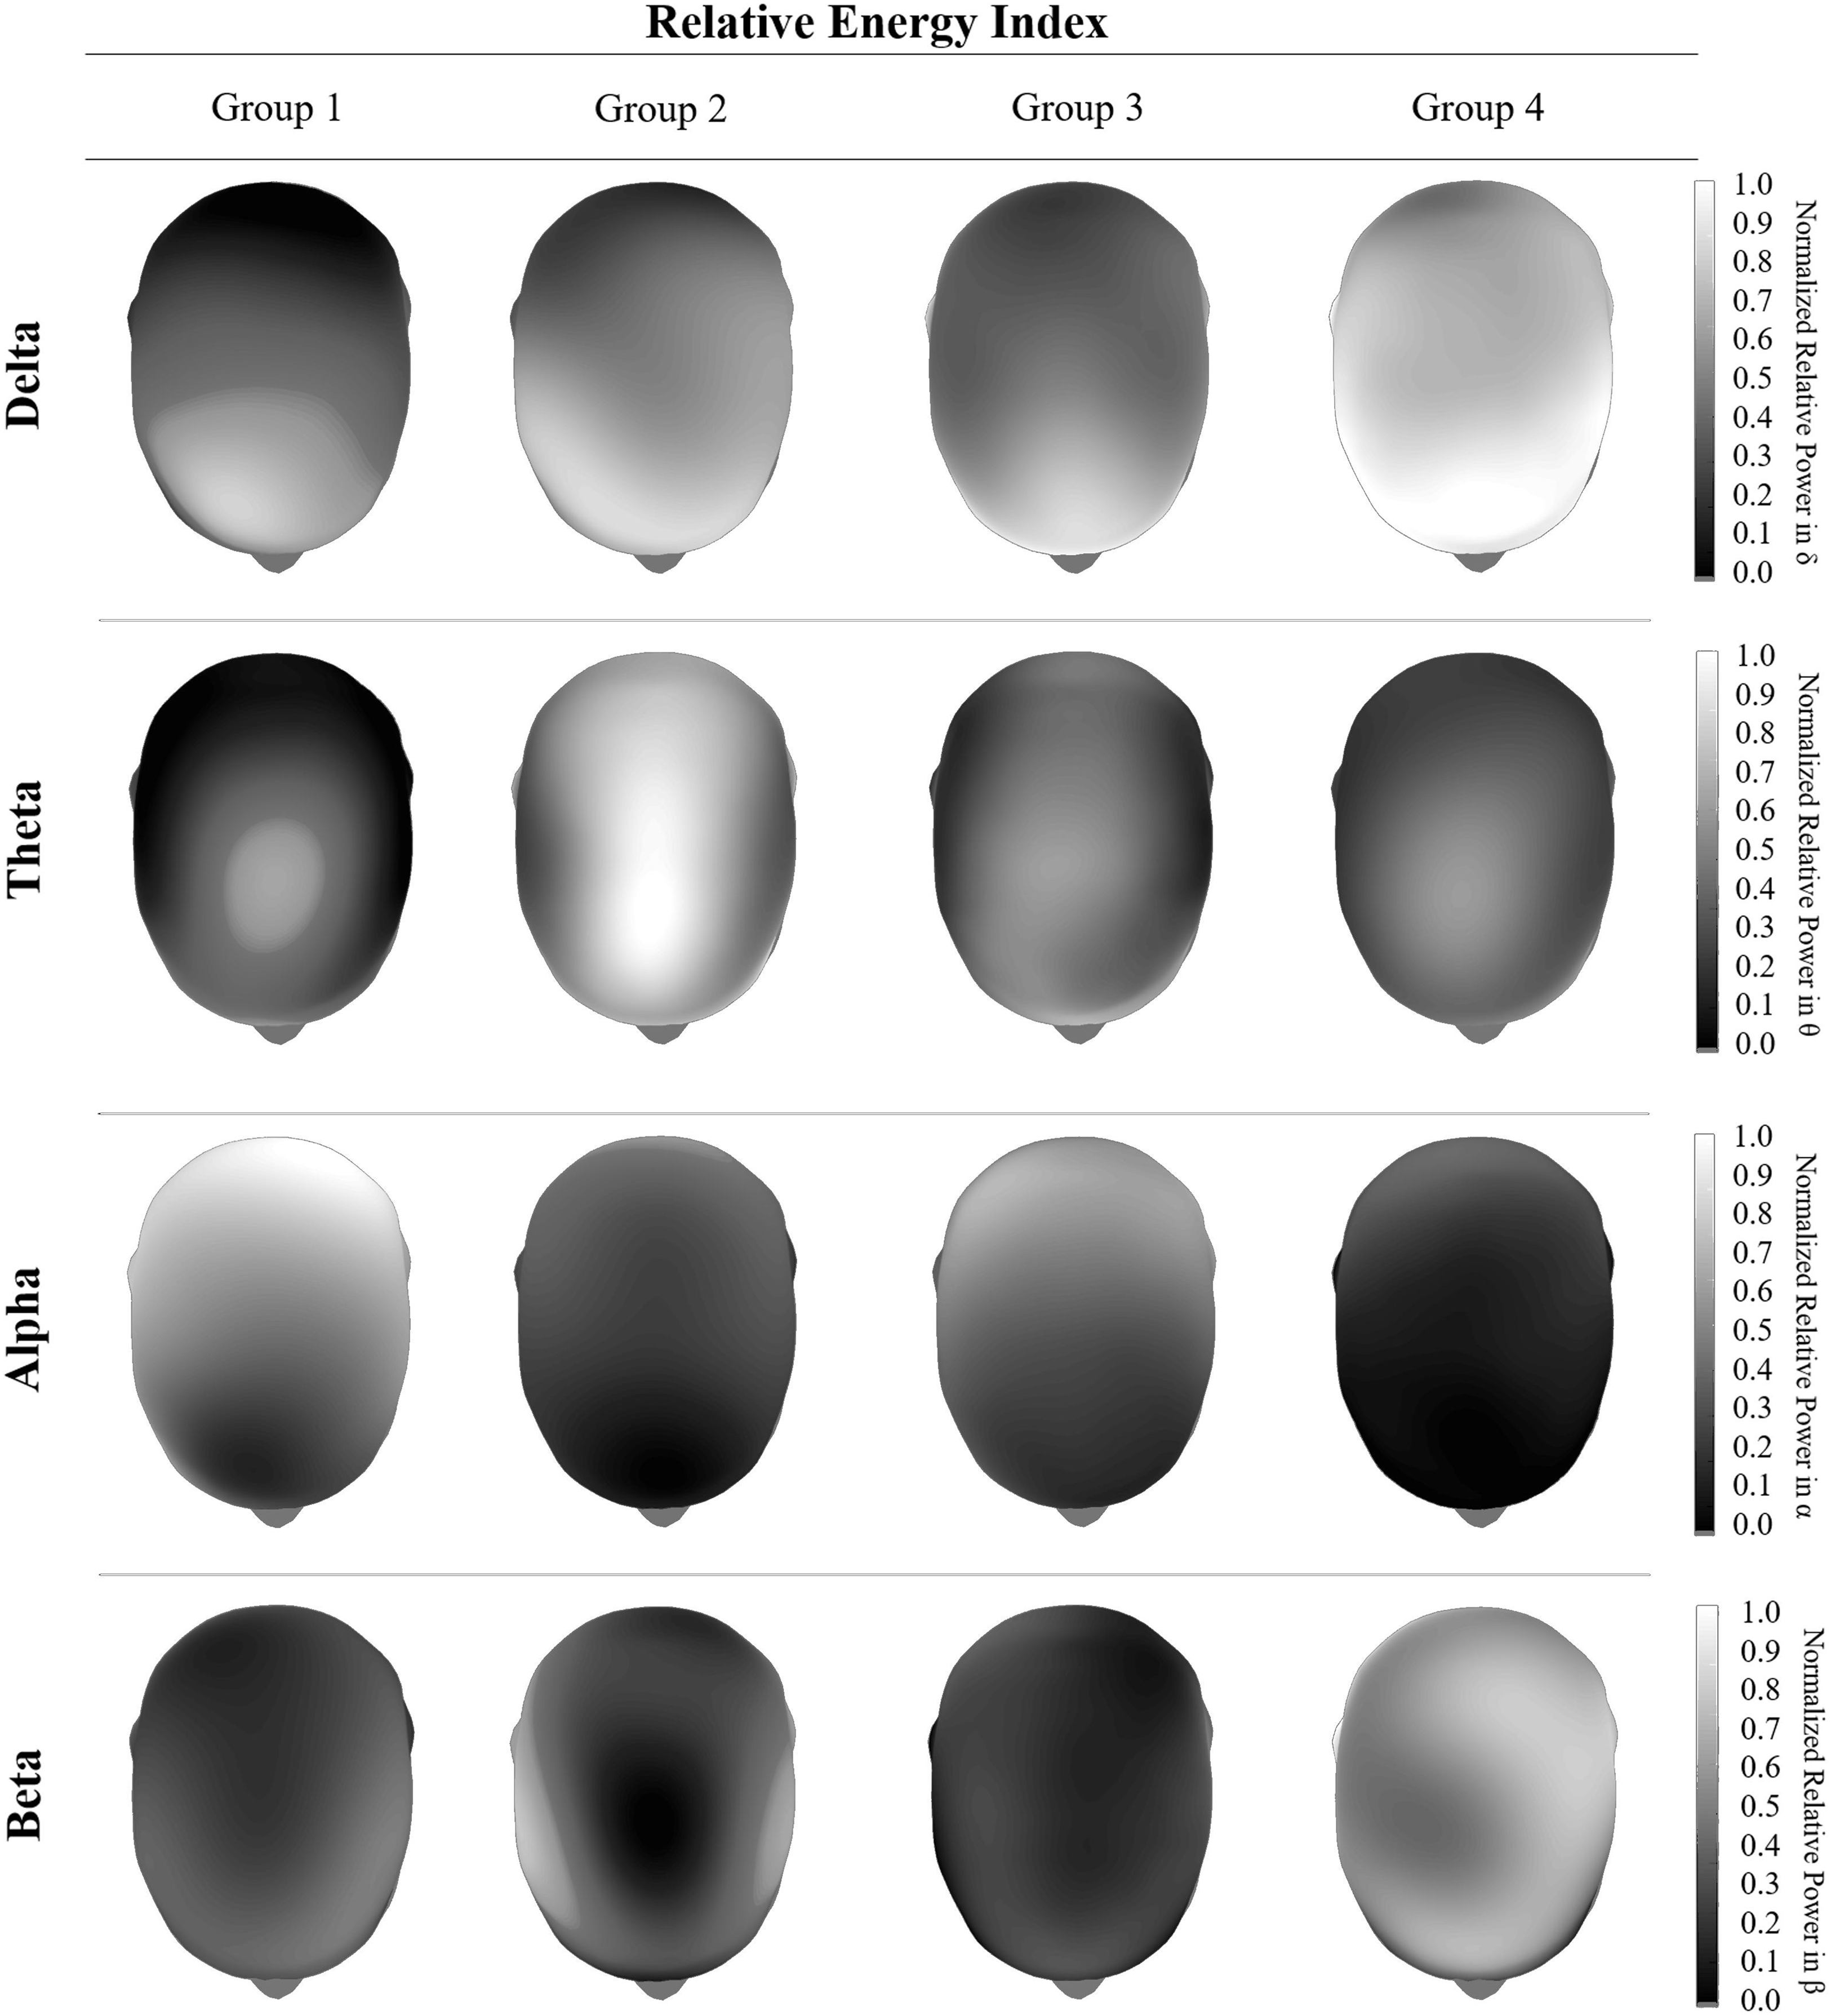
Graphical representation of the behavior of the Relative Energy Indices in each of the electrophysiological bands. For visual representation purposes, a normalized monocromatic scale is used with respect to the magnitude of each band of interest. The behavior of each of the study groups is represented vertically and corresponds to the following classification: G1: Normal; G2: Disruption of Posterior Dominant Rhythm (PDR) and the presence of slow activity; G3: The presence of diffuse slow activity only; and G4: Disruption of PDR only.
Regarding the alpha band, it was found a significant difference between groups (F (3,52) = 10.46, p < 0.01, η2 = 0.38, 1-β = 0.99). Individual comparisons showed that the G1 group presented a higher power compared to the rest of the groups: G2 (p < 0.01), G3 (p < 0.05), and G4 (p < 0.01). Finally, in the beta band, there were no significant differences between groups (F (3,52) = 0.47, p = 0.71, η2 = 0.03, 1-β = 0.14).
The power analysis by region showed a significant topography effect in the delta band (F (5.96, 310.13) = 2.95, p < 0.01, η2 = 0.54, 1-β = 0.90) and no statistical difference in the interaction of group and topography factors (F (17.89, 310.13) = 1.23, p = 0.24, η2 = 0.07, 1-β = 0.82). Post hoc analyses showed that the G3 group presented higher power in the midline compared to the G1 (p < 0.01), G2 (p < 0.05), and G4 (p < 0.01) groups. The G3 group also showed higher power compared to the G4 group in the left posterior, temporal, and central regions (p < 0.01) and in the right posterior, temporal, and frontal regions (p < 0.05). Likewise, the G3 groups showed higher power compared to the G2 group in the left posterior and central regions (p < 0.05) and in the right central and frontal regions (p < 0.05). In the same way, the G3 group showed higher power compared to the G1 in the left temporal region (p < 0.01), the right frontal (p < 0.05), and central regions (p < 0.05). The G2 group presented higher power than the G4 group in the left temporal region (p < 0.05).
In the theta band, a significant topography effect was observed (F (5.90, 306.63) = 55.20, p < 0.01, η2 = 0.52, 1-β = 1.00) and no statistical difference in the interaction of group and topography factors (F (17.69, 306.63) = 1.11, p = 0.34, η2 = 0.06, 1-β = 0.77). Post hoc analyses showed a lower power in the G1 group with respect to the G3 and G4 groups in the left posterior region (p < 0.05), and in the right central region but only compared to the G4 group of patients (p < 0.05). On the other hand, the G2 group showed a higher power with respect to the G3 group in the midline (p < 0.01) and right posterior regions (p < 0.05) and with respect to the G4 group in the midline (p < 0.01), posterior (p < 0.05), left central (p < 0.05), right temporal (p < 0.05), and frontal regions (p < 0.05).
In the alpha band, a significant topography effect was also observed (F (4.12, 214.12) = 85.25, p < 0.01, η2 = 0.62, 1-β = 1.00), as well as a significant interaction between group and topography factors (F (12.35, 214.12) = 2.65, p < 0.01, η2 = 0.13, 1-β = 0.98). Post hoc comparisons showed that the G3 group presented a higher power compared to the G4 group in the midline (p < 0.05), both central (p < 0.05), and frontal regions (p < 0.05), as well as in the right temporal region (p < 0.05).
No significant differences were found between groups or interactions with regions in the beta band.
Entropy Index and Band Ratio
Figure 3 shows the entropy indices and alpha/(delta + theta) ratio in the four groups. No significant difference in entropy was observed between the study groups (F (3,52) = 1.187, p = 0.32, η2 = 0.06, 1-β = 0.30) neither between regions (F (6.08,316.02) = 0.70, p = 0.66, η2 = 0.01, 1-β = 0.28). Nevertheless, a significant interaction between groups and regions was found (F (18.23, 316.02) = 2.40, p < 0.01, η2 = 0.12, 1-β = 0.99). Post hoc analyses showed that the G1 group presented a higher entropy index in the posterior regions (p < 0.05) compared to the G2 group; in the posterior (p < 0.01) and left temporal regions (p < 0.05) compared to the G3 group; and in the posterior (p < 0.05) and right temporal regions (p < 0.05) compared to the G4 group of patients.
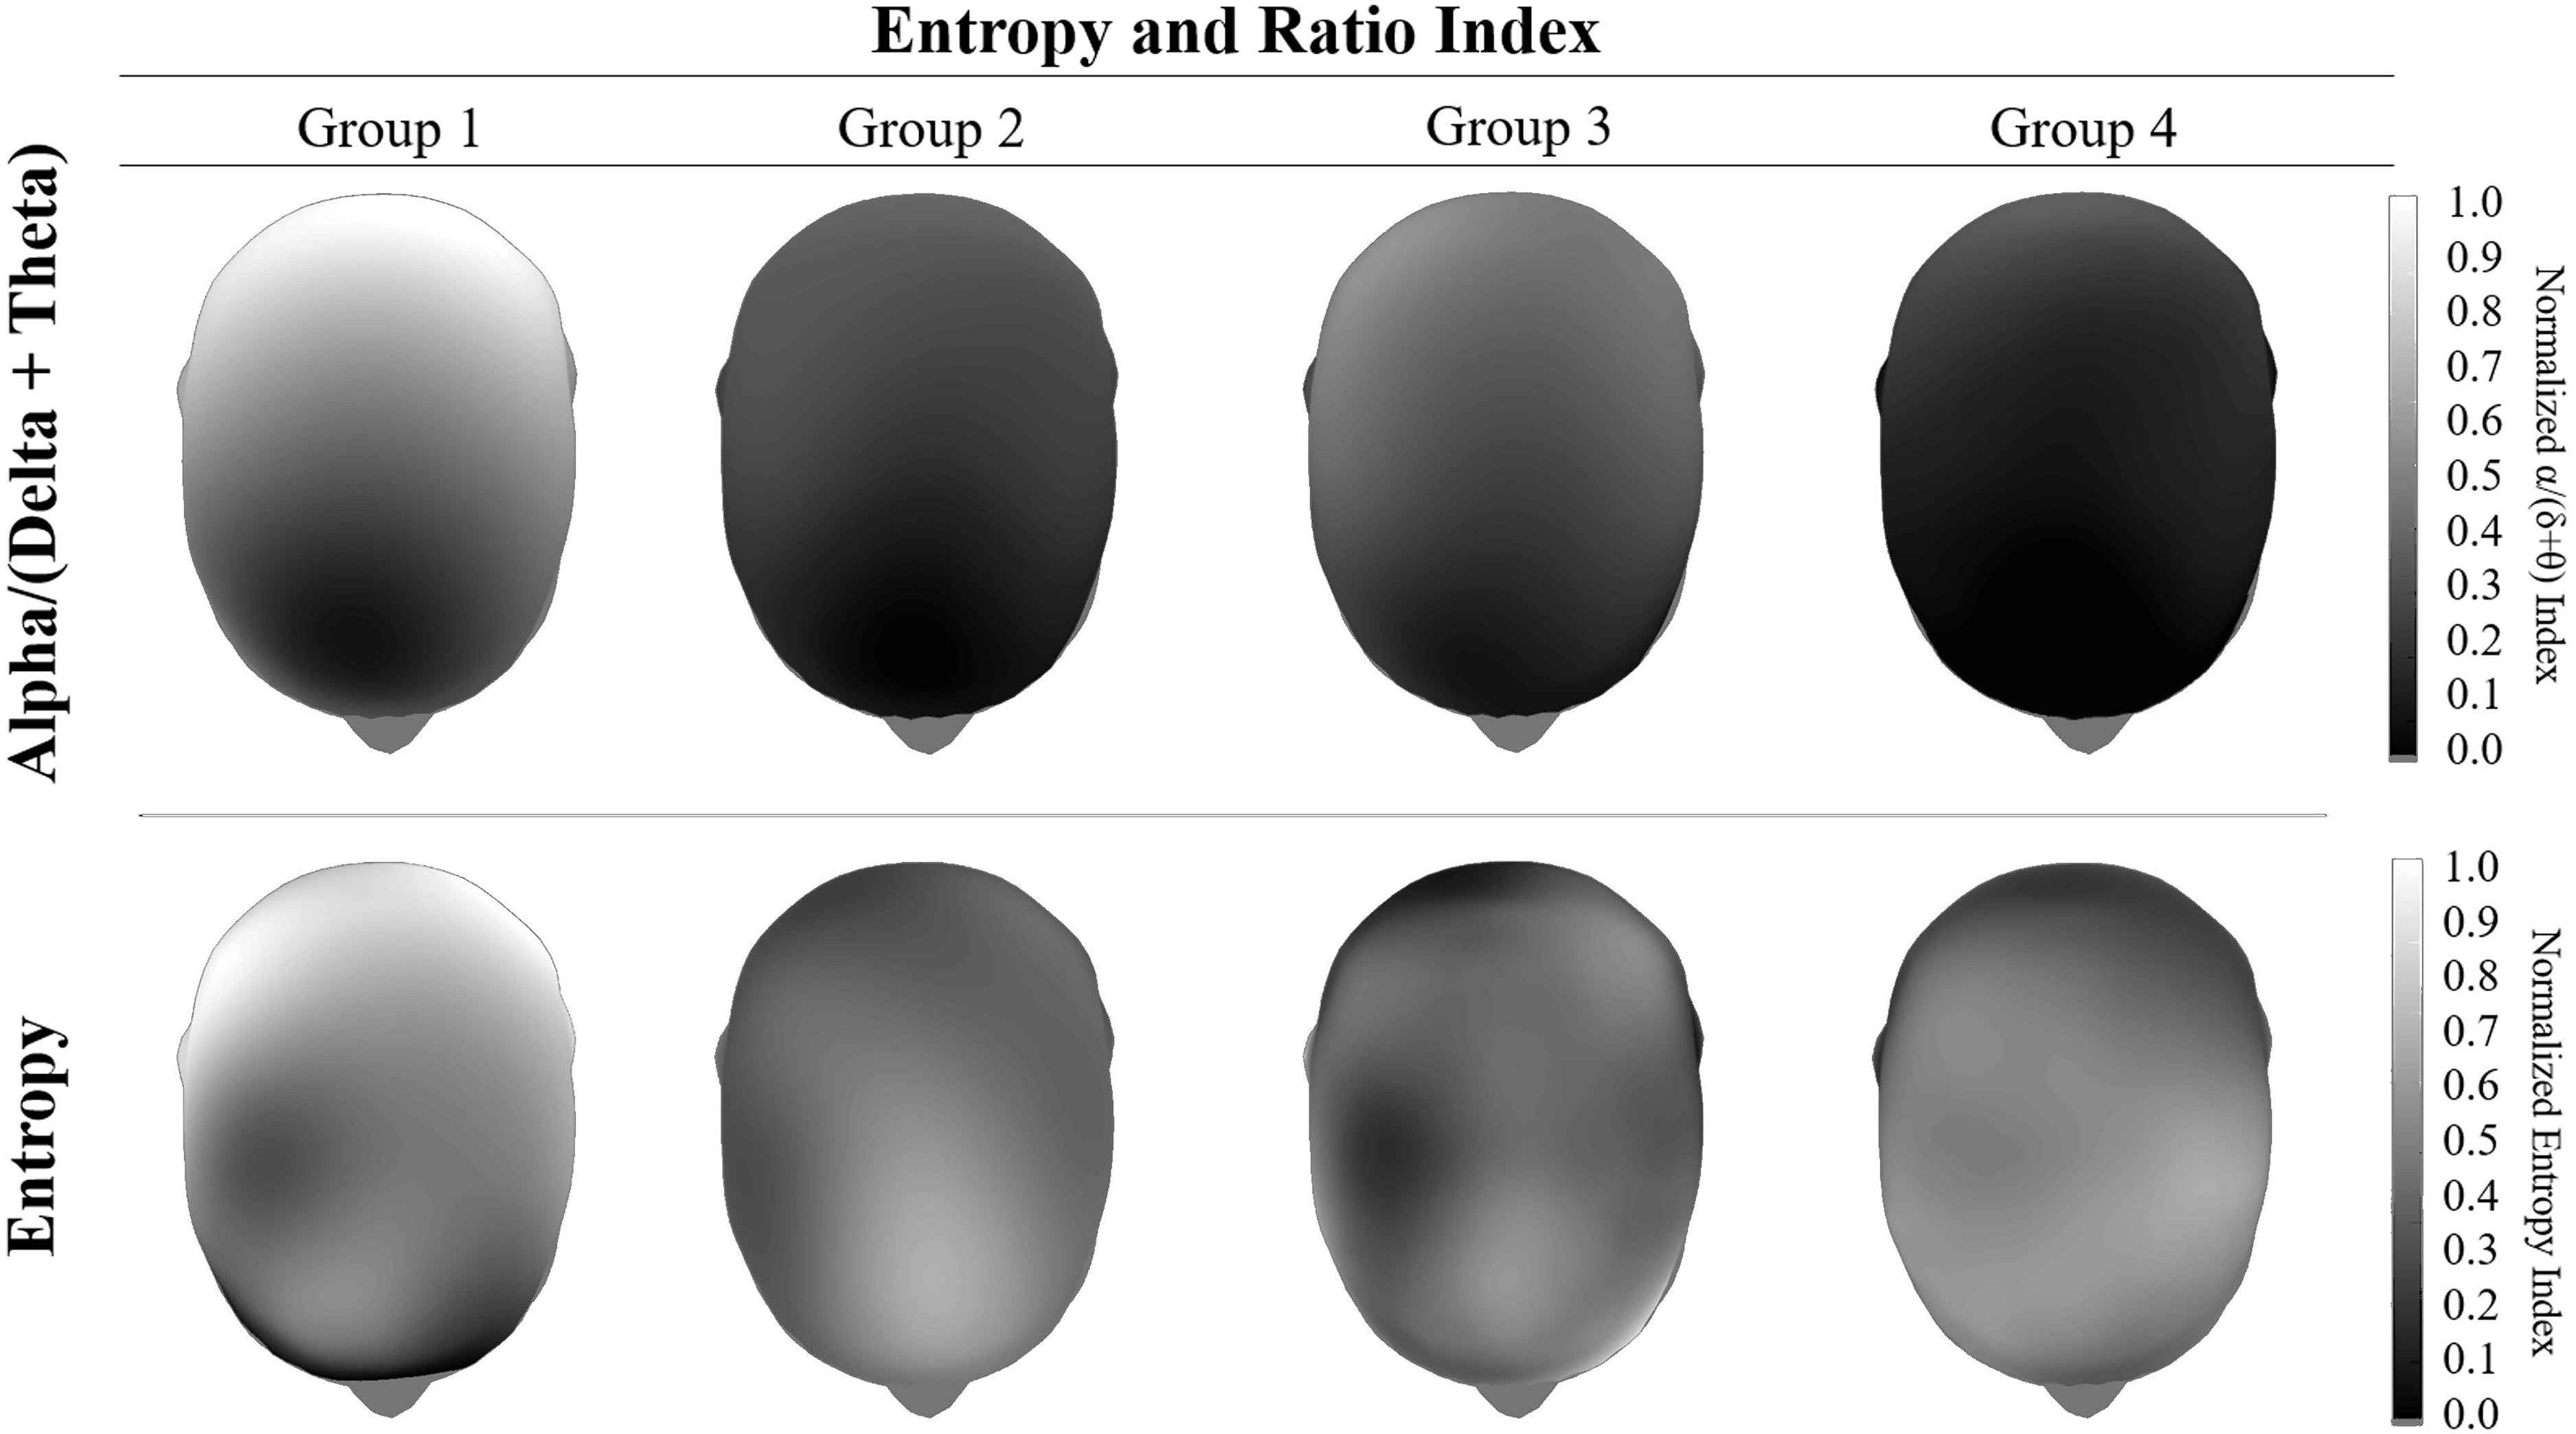
Graphical representation of the behavior of the Alpha / (Delta + Theta) Ratio at the top and the Entropy Index at the bottom. For visual representation purposes, a normalized monocromatic scale is used with respect to the magnitude of each index. The behavior of each of the study groups is represented vertically and corresponds to the following classification: G1: Normal; G2: Disruption of Posterior Dominant Rhythm (PDR) and the presence of slow activity; G3: The presence of diffuse slow activity only; and G4: Disruption of PDR only.
On the other hand, the alpha/(delta + theta) ratio showed a significant effect of groups (F (3,52) = 10.95, p < 0.01, η2 = 0.39, 1-β = 0.99), regions (F (3.79, 197.15) = 66.11, p < 0.01, η2 = 0.56, 1-β = 1.00), as well as a significant interaction between both factors (F (11.37, 197.15) = 3.60, p < 0.01, η2 = 0.17, 1-β = 0.99). Post hoc analyses showed that G1 group presented a higher ratio compared to G2 (p < 0.01), G3 (p < 0.05), and G4 (p < 0.01) groups.
Additionally, the analysis by regions showed that the G3 group presented higher ratios in the midline (p < 0.05), central (p < 0.05), and left posterior (p < 0.05) as well as in the right temporal (p < 0.01) and frontal (p < 0.01) regions compared to the G4 group of patients.
It is essential to mention that we did not aim for the typical approach of comparing EEG variables between a population with a clinical disorder (in this case SUDs) and a group of healthy controls. Instead, our study aimed to assess whether a group of classical and non-classical qEEG measures (objective) could replicate the main qualitative (subjective) findings observed in the EEG in a population with SUDs. As far as we know, this is the first study with this approach in patients with SUDs.
Regarding the classical qEEG measures, our findings showed an increase in the absolute and relative power for the slow bands (delta and theta) in those patients with diffuse slow activity in the EEG. Our findings also showed an increase in the absolute and relative power for the alpha band in those patients with normal PDR. Additionally, the increase in the absolute and relative powers in the slow bands predominates in the midline. In contrast, the increase in the absolute and relative powers in the alpha band predominates in the posterior regions. These results partially agree with previously published reports. For example, the most consistent finding in patients with alcohol use disorder has been the increase in beta power. 14 However, other findings have also been reported such as an increase in theta and a decrease in alpha powers. 26 The most reported finding in patients with methamphetamine use disorder is the increase in lower frequency bands (delta and theta) powers. 27
Our study cannot be directly compared to other studies in the field due to different approaches. Nevertheless, we think some factors contribute to the main observed differences. For example, we included poly-substance users instead of patients with SUDs related to only one substance. Poly-substance use is a prevalent phenomenon, and in our data, the most common substances were alcohol and methamphetamine. Thus, we think this could partially explain our mixed results. On the other hand, our EEG recordings were obtained during the second week of abstinence and some EEG differences between active users and abstainers have been demonstrated. 28
Additionally, we performed our study in a real-life clinical scenario, thus preventing the control of several confounders such as consumption time, onset age of use, previous EEG before consumption, consumption severity, family history (genetic predisposition), etc. Notwithstanding, our findings highlight the significant variability even among SUDs patients. The traditional approach in this field is to select a group of patients with SUDs, control as many confounder factors as possible, and compare it with a group of healthy controls. This approach assumes a homogenous neurobiological activity among patients. However, our findings provide some evidence supporting the contrary.
Regarding the non-classical EEG measures, our findings showed that the G1 group presented a higher entropy index than the rest of the groups, mainly in the posterior regions. Entropy is a nonlinear measure of uncertainty and degree of complexity in a time series and has been shown to represent the level of chaos in the brain. 20 It can be deduced that a system is more complex or chaotic when the entropy is higher. Translating this into brain physiology, there is increasing evidence that various pathological processes are associated with atypical and often, but not always, reduced measures of brain physiological complexity or entropy.29,30
Some authors have previously shown a significant entropy decrease in methamphetamine abusers compared to healthy controls suggesting a decrease in cortical complexity in the first ones. 31 Other authors have also found a reduction in entropy in patients with alcohol use disorder. 32
Our findings showed a significant decrease in entropy in those patients with qualitative alterations (brain dysfunction) in the EEG, and mainly in the posterior regions. The G1 group, despite being conformed by patients with SUDs too, showed a normal EEG with a normal PDR. Thus, these patients are expected to show complex cortical activity in posterior regions and therefore, higher entropy indices than the rest of the groups. However, what is surprising again is the significant variability within the group of patients with SUDs. These results suggest that the commonly used approach of comparing these kinds of patients and healthy controls may not be, at least, optimal. In addition, our findings indicate that an EEG-based entropy index in the posterior regions could be a potential clinical biomarker to assess brain dysfunction in patients with SUDs and a no definitely abnormal qualitative (visually inspected) EEG.
Regarding alpha/(delta + theta) ratio, our findings showed a significant increase in the G1 compared to the rest of the groups. This EEG ratio is an index that shows the percentage of alpha versus delta/theta spectral power during the waking state at rest. Some authors have previously shown a low alpha/theta ratio in patients with early and moderate Alzheimer's Disease. 17 On the other hand, other authors have also shown a decrease in the alpha/delta ratio in patients with acute reductions in brain metabolism (ie, stroke). 18
From a clinical point of view, the presence of slow frequencies (delta and theta) in a routine EEG recorded from an awake adult is generally associated with some degree of brain dysfunction (except for the presence of normal variants, ie, Ciganek rhythm). Many authors have reported an increase in slow-frequency powers in patients with SUDs. 33 Thus, we decided to include the combination of delta and theta for calculating the ratio instead of selecting only one. However, further combinations (ie, including beta) should be formally explored in future research.
Our study has several significant limitations that prevent the generalization of the findings. First, we recognize that we have a small sample size, which must have led to an underpower of the results. However, our findings are just quantitatively representing the distinction made by a qualitative analysis of a well-established and clinically helpful study. Therefore, a clinical difference may be of value even with underpowered statistical analysis.
Second, we are aware that our different approach prevents the direct comparison with traditional previously published studies. This limitation is mainly related to the fact that we did not include a healthy control group. However, we think any significant difference (or similarity) between a control and a clinical group may be misleading considering the significant variability found in the SUDs patients in our study. Notwithstanding, this should be formally explored in future studies. Third, we performed this study in a real-life clinical scenario, thus preventing the control of several confounders/sample biases and therefore limiting the generalizability of our findings.
Despite these limitations, our findings support the view that the power spectrum is not a reliable biomarker on an individual level. 33 Thus, we suggest shifting the approach toward other potential methods and designs which may offer greater clinical possibilities. In this regard, routine EEG-based entropy and alpha/(delta + theta) ratio could be potential and easy-to-obtain clinical biomarkers to confirm the presence of some degree of brain dysfunction in patients with SUDs. Recently, other interesting EEG-based approaches are emerging and need further research to better characterize patients with SUDs, mainly at the individual level. This is the case of connectivity measures, 14 microstates analysis, 34 and machine learning. 35
Footnotes
Declaration of Conflicting Interests
The authors declared no potential conflicts of interest with respect to the research, authorship, and/or publication of this article.
Funding
The authors received no financial support for the research, authorship, and/or publication of this article.
Ethical Policy
We confirm that we have read the Journal's position on issues involved in ethical publication and affirm that this report is consistent with those guidelines.