
Abstract
Introduction
EEGLAB is a widely used software for analyzing electroencephalography (EEG) datasets, with over 20 years of global use. This bibliometric study investigates EEGLAB publications in the Asia-Pacific and Arabian regions, focusing on Scopus and Web of Science (WoS) indexed sources, to understand regional contributions and trends in EEG research across 80 countries and territories.
Methods
Bibliometric analysis was conducted using the Bibliometrix package in R, focusing on citations from WoS and Scopus indexed sources. The study covers data from the United Nations Economic and Social Commission for Asia and the Pacific (ESCAP) and West Asia (ESCWA), including 58 ESCAP countries and 22 ESCWA countries, with data collected until March 2024. Bibliometric indices such as Lotka's law, Bradford's law, co-citation networks, and in-depth historiography were analyzed to explore global and regional trends.
Results
EEGLAB's main article has received 22 298 citations on Google Scholar, with 14 958 (67.1%) citations in WoS and 15 827 (70.1%) in Scopus. The top ten WoS countries by citations are China, Australia, Japan, Republic of Korea, India, Iran, Russian Federation, Singapore, New Zealand, and Malaysia/Türkiye. Recent research themes include emotion recognition, driver distraction detection, deep learning, schizophrenia detection, and the cognitive impacts of COVID-19. China and the USA are the leading international collaborators.
Conclusions
Approximately 35% of WoS documents and 41% of authors are from the ESCAP and ESCWA regions. The average citation per document in these regions is half of the global average. The study highlights EEGLAB's growing role in EEG research and collaborative trends.
Keywords
Key Messages
Bibliometric analysis of all EEGLAB Citations from Scopus & Web of Science
Focusing on 80 countries & territories including the United Nations Economic and Social Commission for Asia and the Pacific (ESCAP) and West Asia (ESCWA)
Estimation and Comparison of Lotka’s Law Coefficients estimation for Authors with Functional Data Analysis in Bibliometric Studies
Provided the Bradford Law, The Most Global Cited Documents, The Co-Occurrence Network of WoS subject, The Co-Citation Network Papers, Collaboration Network Between Institute, The Country Collaboration Map and Authors production over time
The study includes two extensive appendices: 1) Further analysis for each subregion and 2) in-depth historiographies with summaries
Specific analysis for China, Japan, India, Russian Federation and Iran in appendix
Introduction
Since Hans Berger's development of the electroencephalogram (EEG) in 1929, it has become a cornerstone diagnostic tool in neuroscience, widely utilized around the world from as early as 1936.1–3 Beginning in the 1990s, a range of academic software applications were developed for EEG-based brain mapping, 4 including EEGLAB, 5 FieldTrip, 6 and SPM, 7 along with more recent advances in Python, such as MNE. 8 EEGLAB, an open-source platform, was developed by a team led by Professors Arnaud Delorme and Scott Makeig from the Swartz Center for Computational Neuroscience, Institute for Neural Computation at the University of California, San Diego. 5 Key features of EEGLAB include Independent Component Analysis (ICA), time-frequency analysis, various artifact removal methods, a user-friendly graphical user interface (GUI), multi-format data importation, and interactive plotting. To date, EEGLAB has been downloaded over 350 000 times by more than 15 265 researchers, with over 160 available plug-ins in 2024. 9
More than 12 700 research articles and documents indexed in Web of Science have cited EEGLAB papers worldwide, with an estimated international co-authorship rate of 37.27%. 10 As highlighted in various bibliometric analyses—such as those in Construction Health and Safety Management, 11 Visualizations in Computer Graphics, 12 Brain-Computer Interface, 13 and Good Scientific Practice 14 —EEGLAB stands out as the primary software used in these fields.
Bibliometric studies focusing on geographically specific regions have become increasingly important in neuroscience. For instance, previous research has analyzed neuroscience publications in Saudi Arabia, 15 Turkey, 16 Iran, 17 Latin America, 18 Brazil, 19 neurosurgical research in Southeast Asia, 20 Egyptian neurosurgical publications, 21 neurodegenerative disorders in Arab countries, 22 and Alzheimer's disease globally and in China. 23 However, these studies have predominantly focused on research topics rather than the tools and software utilized, although the latter is a common focus in statistical software analyses.24,25 Typically, the most cited articles come from the United States, North America, and European countries, with other regions receiving less attention. 10 To date, however, no bibliometric analysis has specifically examined EEGLAB paper citations in regions such as the Asia-Pacific or the Arabian states, which together encompass 80 countries and territories. The importance of these regions is exemplified by initiatives such as the International Brain Research Organization (IBRO) Asia-Pacific Regional Committee (APRC), 26 the Synchrotron for Neuroscience – an Asia Pacific Strategic Enterprise (SYNAPSE), 27 Arabs in Neuroscience 28 and Federation of Asian Oceanian Neuroscience Societies (FAONS), which includes over 10 national neuroscience societies. 29 In this study, we analyzed these regions using the SCOPUS and Web of Science (WOS) databases, along with the bibliometrix R package. 30
Material and Methods
Selected Regions
The countries and territories in two of the five regional commissions under the jurisdiction of the United Nations Economic and Social Council are considered.
31
They are including: 1-United Nations Economic and Social Commission for Asia and the Pacific (
Databases
The Web of Science (WoS) and Scopus are used as two citation databases. The search strategy considers all citations grouped by regions, subregions, and countries of the Delorme A, Makeig S. EEGLAB: an open source toolbox for analysis of single-trial EEG dynamics including independent component analysis. Journal of neuroscience methods. 2004 Mar 15;134(1):9–21. 5 The date of searching and downloading was 03/28/2024.
Statistical and Data Analysis
Bibliometric analysis is done with Bibliometrix, 30 functional data analysis with fda.usc for comparison between Lotka's Law curves, 34 and artificial neural networks using nnet and NeuralNetTools for stuyding the average citation per doc 35 packages in R software with POSIT (https://www.r-project.org/). 36 ChatGPT (GPT-4) was utilized as an invaluable tool for editing, data collection, and summarizing complex information (https://openai.com/chatgpt).
Results
The Descriptive Statistics
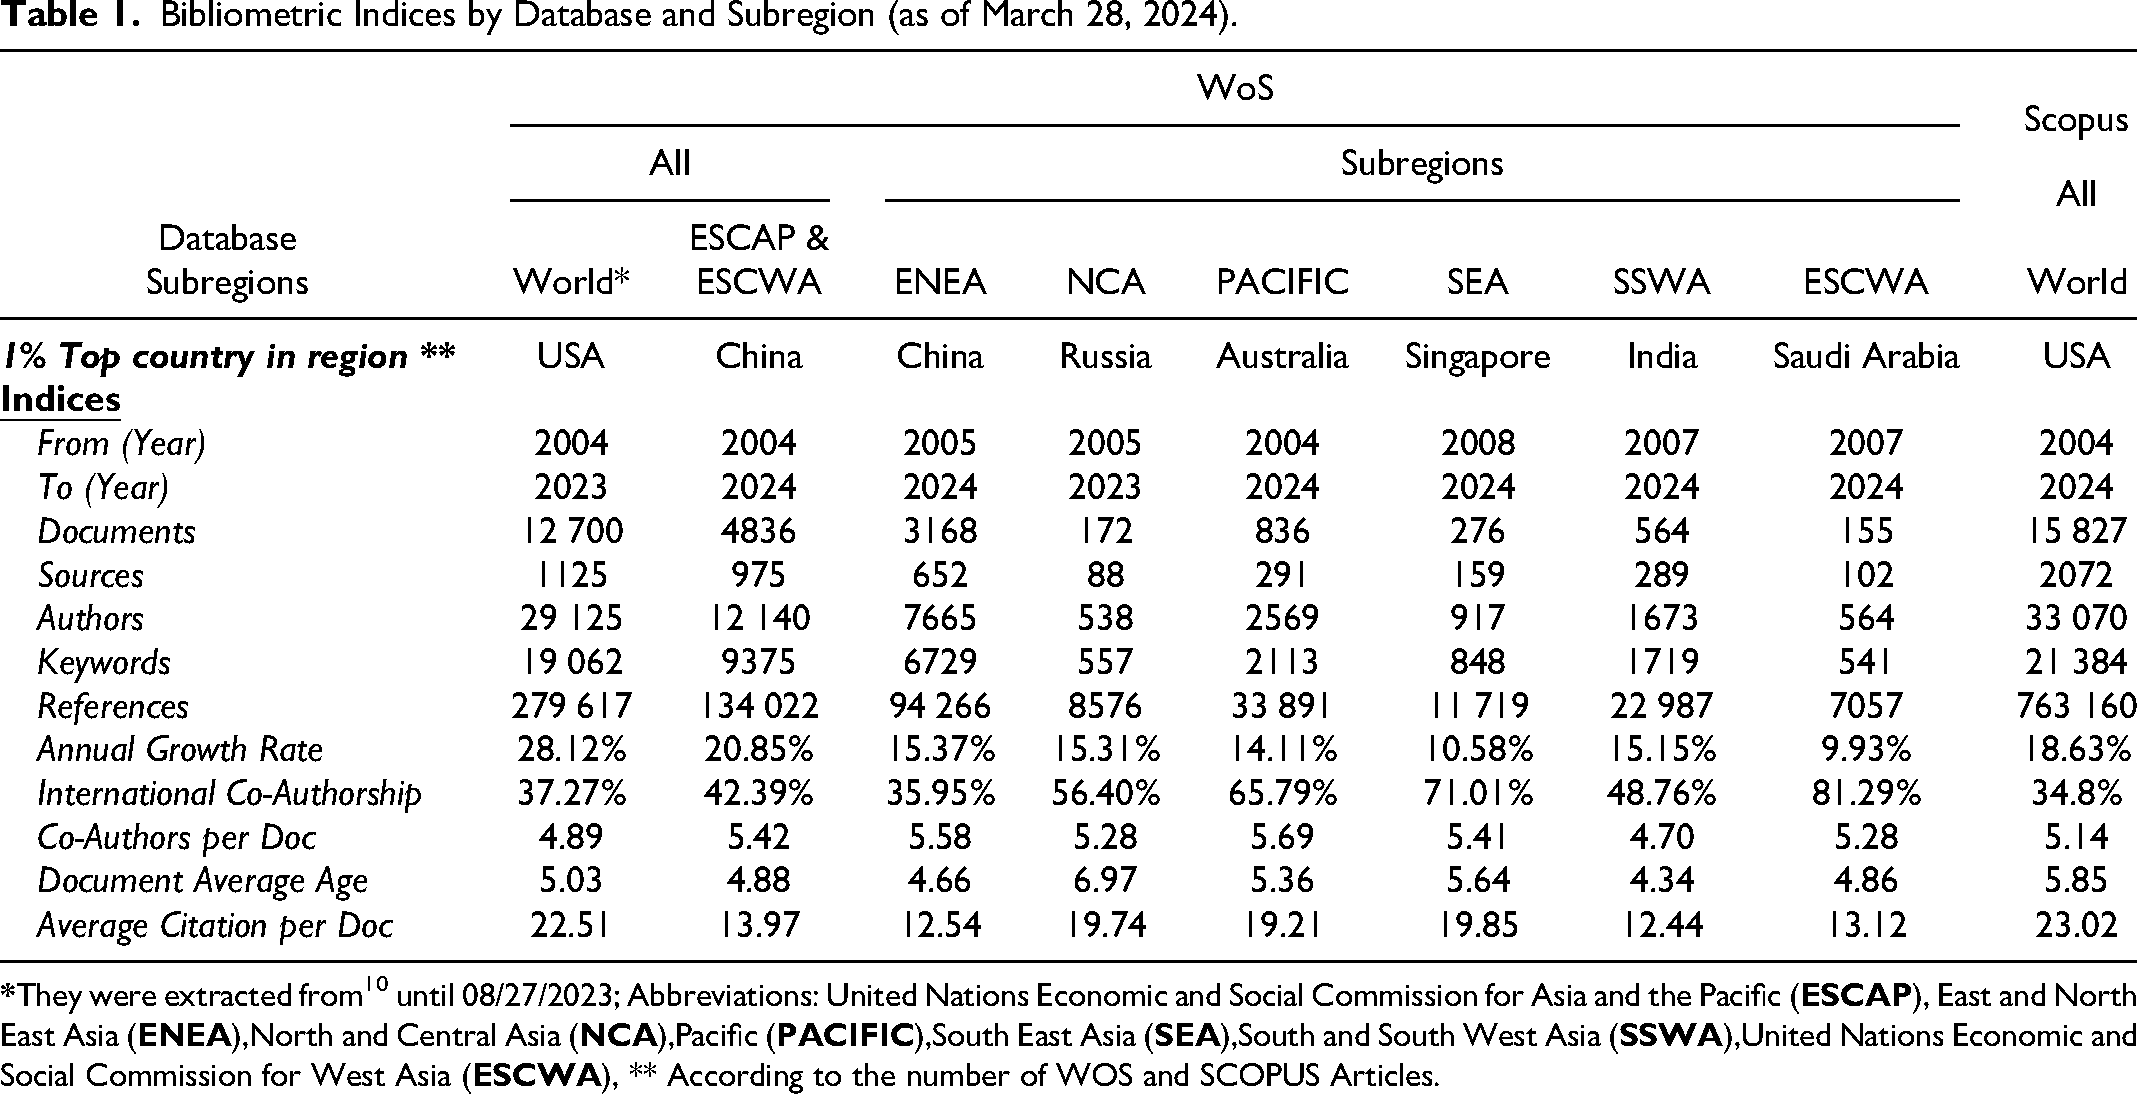
As of 03/28/2024, EEGLAB software has accumulated 22 298 citations in Google Scholar. 5 In comparison, there are 14 958 citations (≈ 67.1% of Google Scholar's total) in Web of Science (WoS) and 15 827 citations (≈ 70.1% of Google Scholar's total) in Scopus. According to Table 1, the total number of citations in WoS across all selected regions is 4836 (≈ 21.6% of the total), with the following distribution: ENEA (3168 citations, ≈ 14.2%), NCA (172 citations, ≈ 0.77%), PACIFIC (836 citations, ≈ 3.75%), SEA (276 citations, ≈ 1.23%), SSWA (564 citations, ≈ 2.52%), and Arab states (155 citations, ≈ 0.69%). These citations were published between 2004 and 2024 across 975 sources (journals, conference proceedings, etc), authored by 12 140 researchers, and referencing a total of 134 022 unique sources. ENEA, comprising China, Japan, and the Republic of Korea, is a strong research cluster with a notable average citation per document of 12.54 and a solid document output of 3168. However, compared to other subregions like NCA, PACIFIC, and ESCWA, ENEA has a relatively lower international co-authorship rate of 35.95%, and its annual growth rate of 15.37% lags behind more dynamic regions like SEA (15.15%) and PACIFIC (14.11%). ESCWA, on the other hand, stands out with a high international co-authorship rate of 81.29% and a good average citation per document of 13.12. However, its document output of just 155 and relatively low author count of 564 suggest limited research activity and fewer contributions from authors in the region. The table shows that the USA leads globally, while China tops the ESCAP & ESCWA region. In ENEA, China and Japan are the leaders, with Russia at the top in NCA. Australia and New Zealand rank first and second in the PACIFIC, while Singapore and Malaysia lead in SEA. India and Iran are the top countries in SSWA, and Saudi Arabia and the UAE dominate ESCWA. Additionally, the Republic of Korea and Türkiye are among the top contributors in their regions.
Bibliometric Indices by Database and Subregion (as of March 28, 2024).
Various factors influence citation rates, a separate analysis is needed to investigate the main reasons.37,38 Nevertheless, we found that Document Average Age, Co-Authors per Document, and International Co-Authorship have the highest relative importance across the three algorithms—Garson's algorithm, Olden's algorithm, and Lek's profile method—in a single-layer fitted artificial neural network model for these six regions. 35 In Figure 1, the Olden's algorithm plot shows the positive and negative relationships of variables with the outcome. Additional plots are available in Appendix A, Part K.
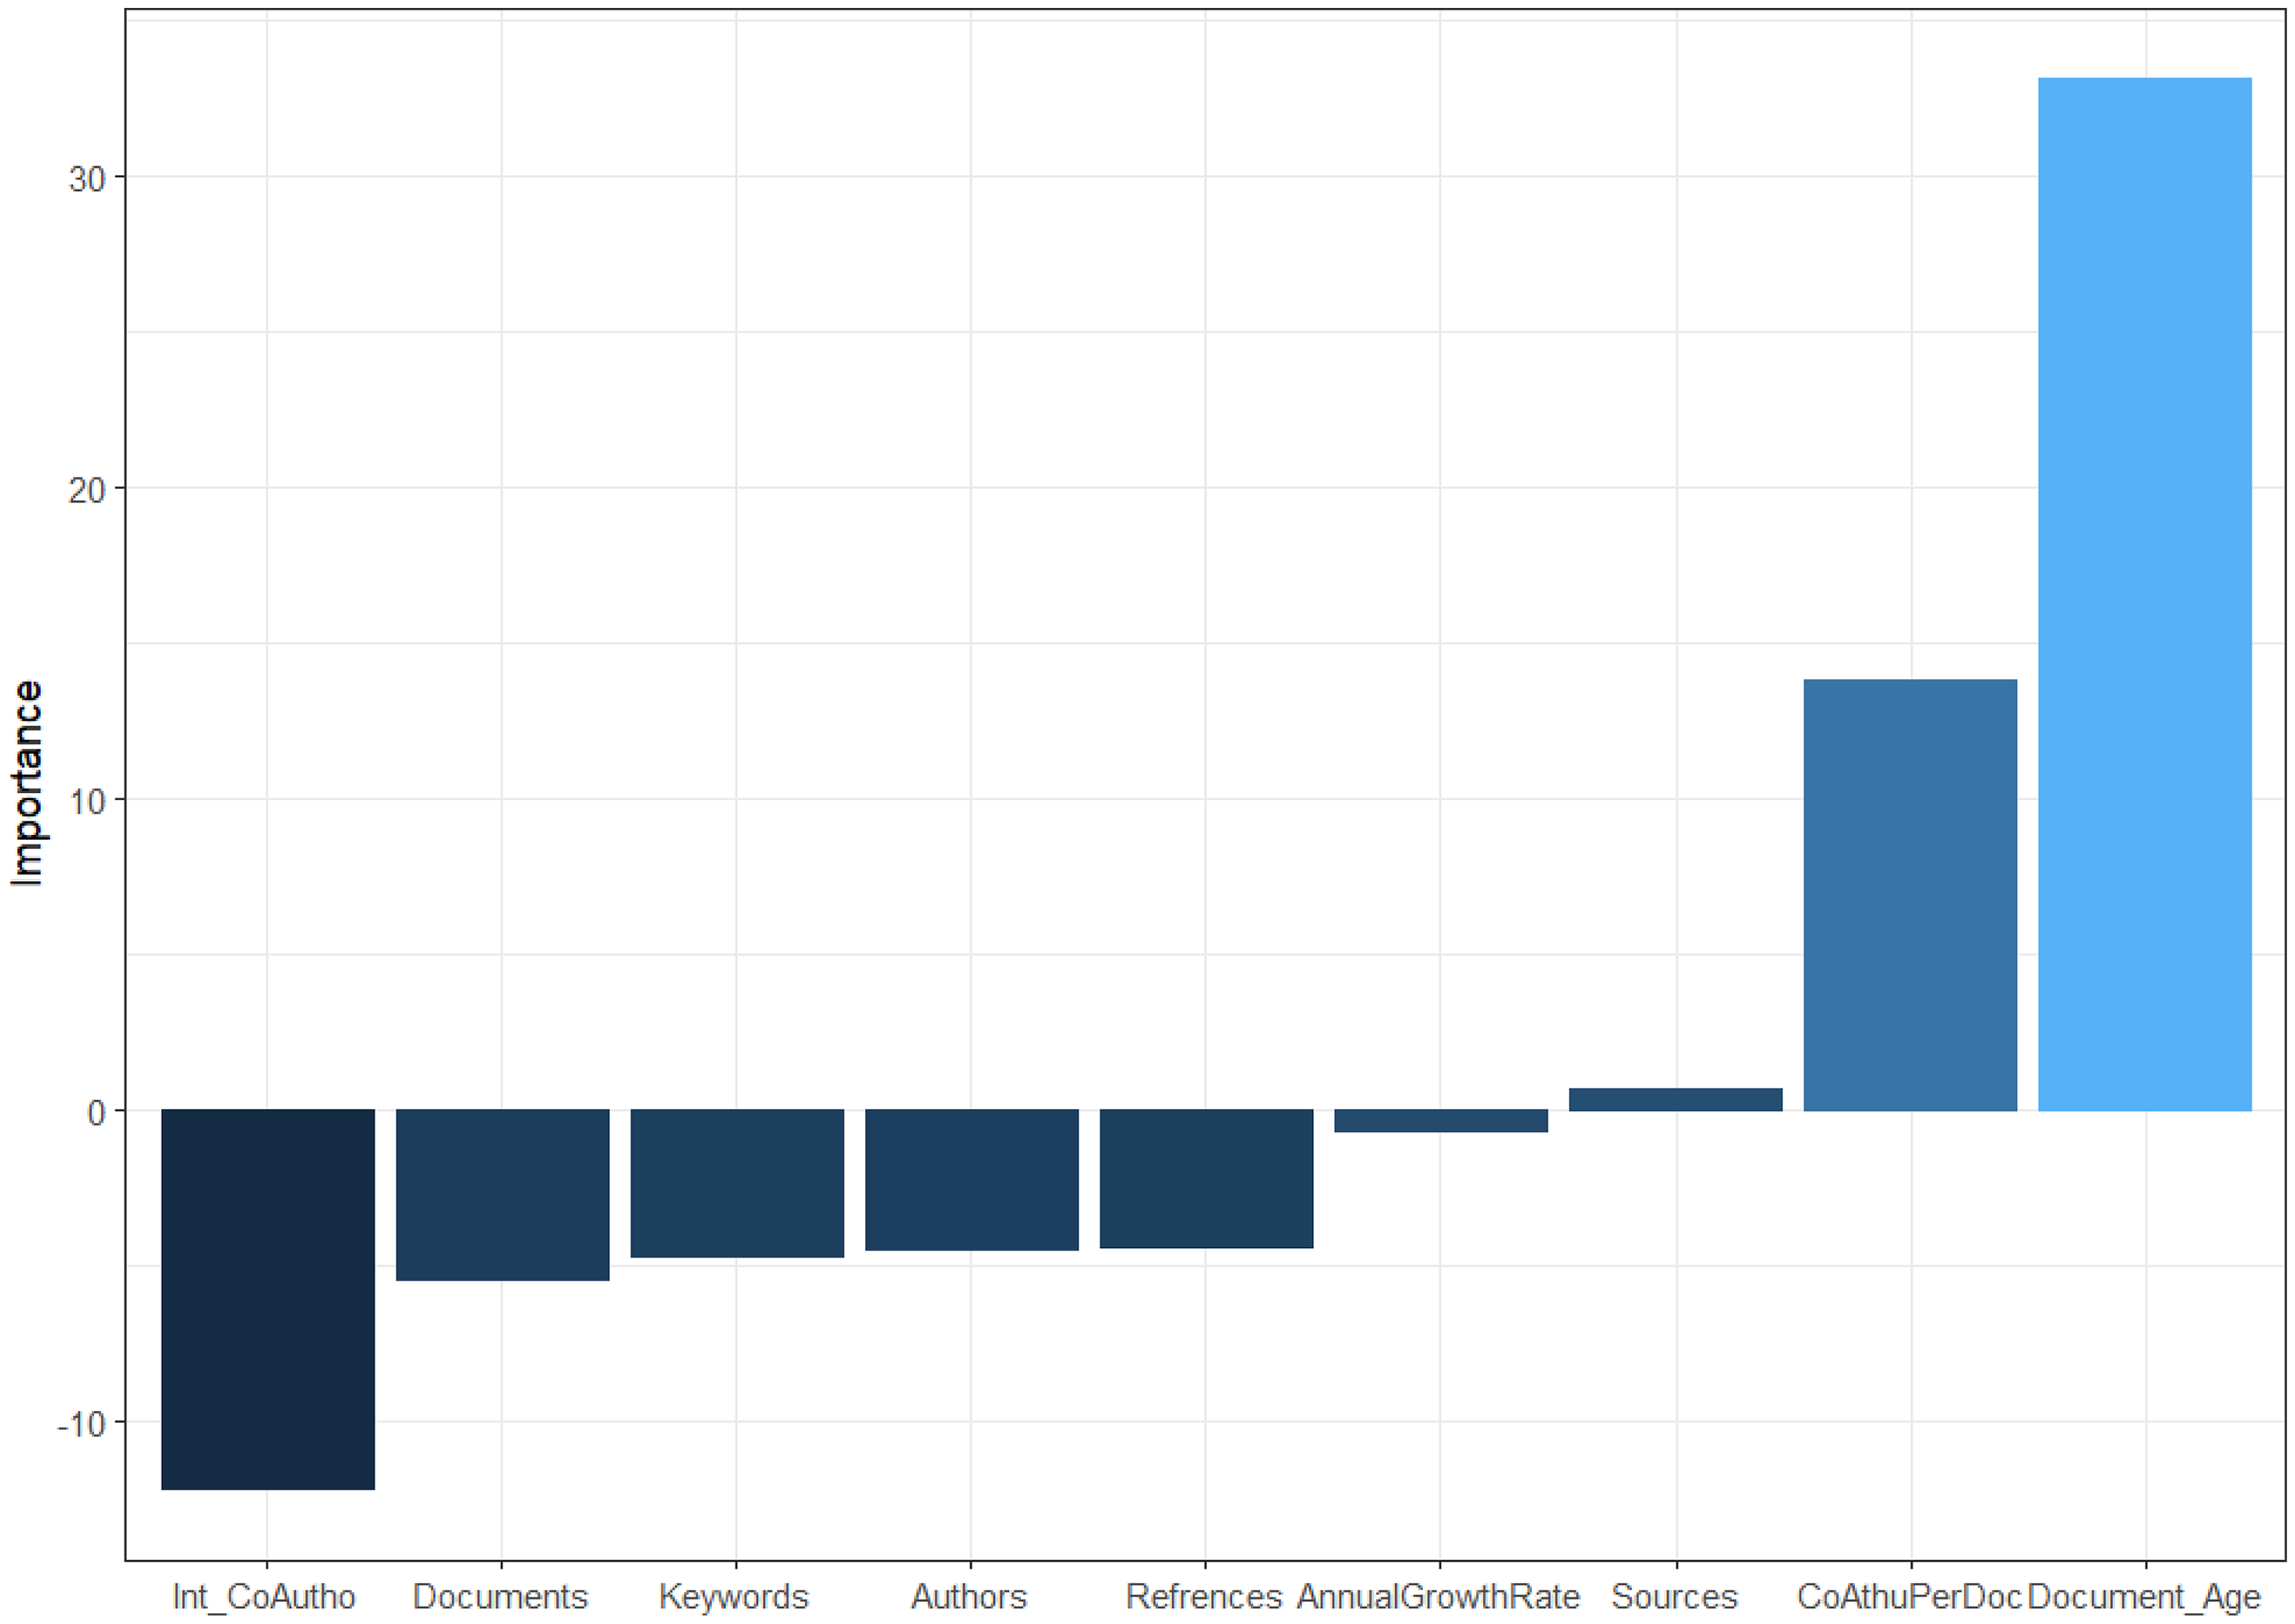
The Variable Importance plot. The x-Axis is th Variable Names and y-Axis is the Variable Importance Weights with Olden's Algorithm.
The list of citations, grouped by country name and region, is presented in Appendix A, Table A-1 for both the WoS and Scopus databases. According to this table, the top ten countries based on WoS citations are China (2257), Australia (755), Japan (574), the Republic of Korea (392), India (231), Iran (191), the Russian Federation (163), Singapore (151), New Zealand (103), and both Malaysia (79) and Türkiye (79). The difference in the number of citations between WoS and Scopus for each country is calculated as Diff = #WoS − #Scopus. Countries with a citation difference (Diff) of 40 or more include Hong Kong (China), India, Japan, China, the Russian Federation, Iran, and Macao (China). A more detailed analysis, including a country-specific profile based on Scopus citations for these specific countries, is provided in Appendix A, Part A and Part B.
Lotka's Law Coefficient
Lotka's Law coefficient, which describes the frequency of publication by authors in a field as an inverse square law, where the number of authors publishing a certain number of articles is proportionate to the number of authors publishing a single article, is estimated using the lotka() function in the R bibliometrix package.30,39 Table C1 in appendix A presents the Lotka's statistics across different regions. The Beta values range from 2.12 in ENEA to 2.71 in SSWA, indicating some variability in author productivity patterns across regions. The R2 values are consistently high, ranging from 0.93 in Arab States to 0.99 in ENEA, suggesting a strong fit of the data to Lotka's Law. The p-values for all regions, such as 0.98 for ENEA and 0.75 for NCA, are greater than 0.05, indicating that there is no significant difference between the observed and expected distributions of author productivity. Overall, the All regions category, with a Beta of 2.22, R2 of 0.99, and p-value of 0.75, reflects a solid adherence to Lotka's Law across the entire dataset. To compare Lotka curves between regions, two groups were formed: 1) ENEA, PACIFIC, and SEA representing East Asia regions, and 2) NCA, SSWA, and ESCWA representing Central and West Asia regions. The Lotka curves were compared using an ANOVA test for functional data with the fanova.onefactor() function from the fda.usc package.34,40 The p-values based on 1000 bootstrap resamples for the number and proportion of authors were 0.174 and 0.226, respectively, indicating no significant statistical difference between these two groups (Figure 2) and (Appendix A, Part C).
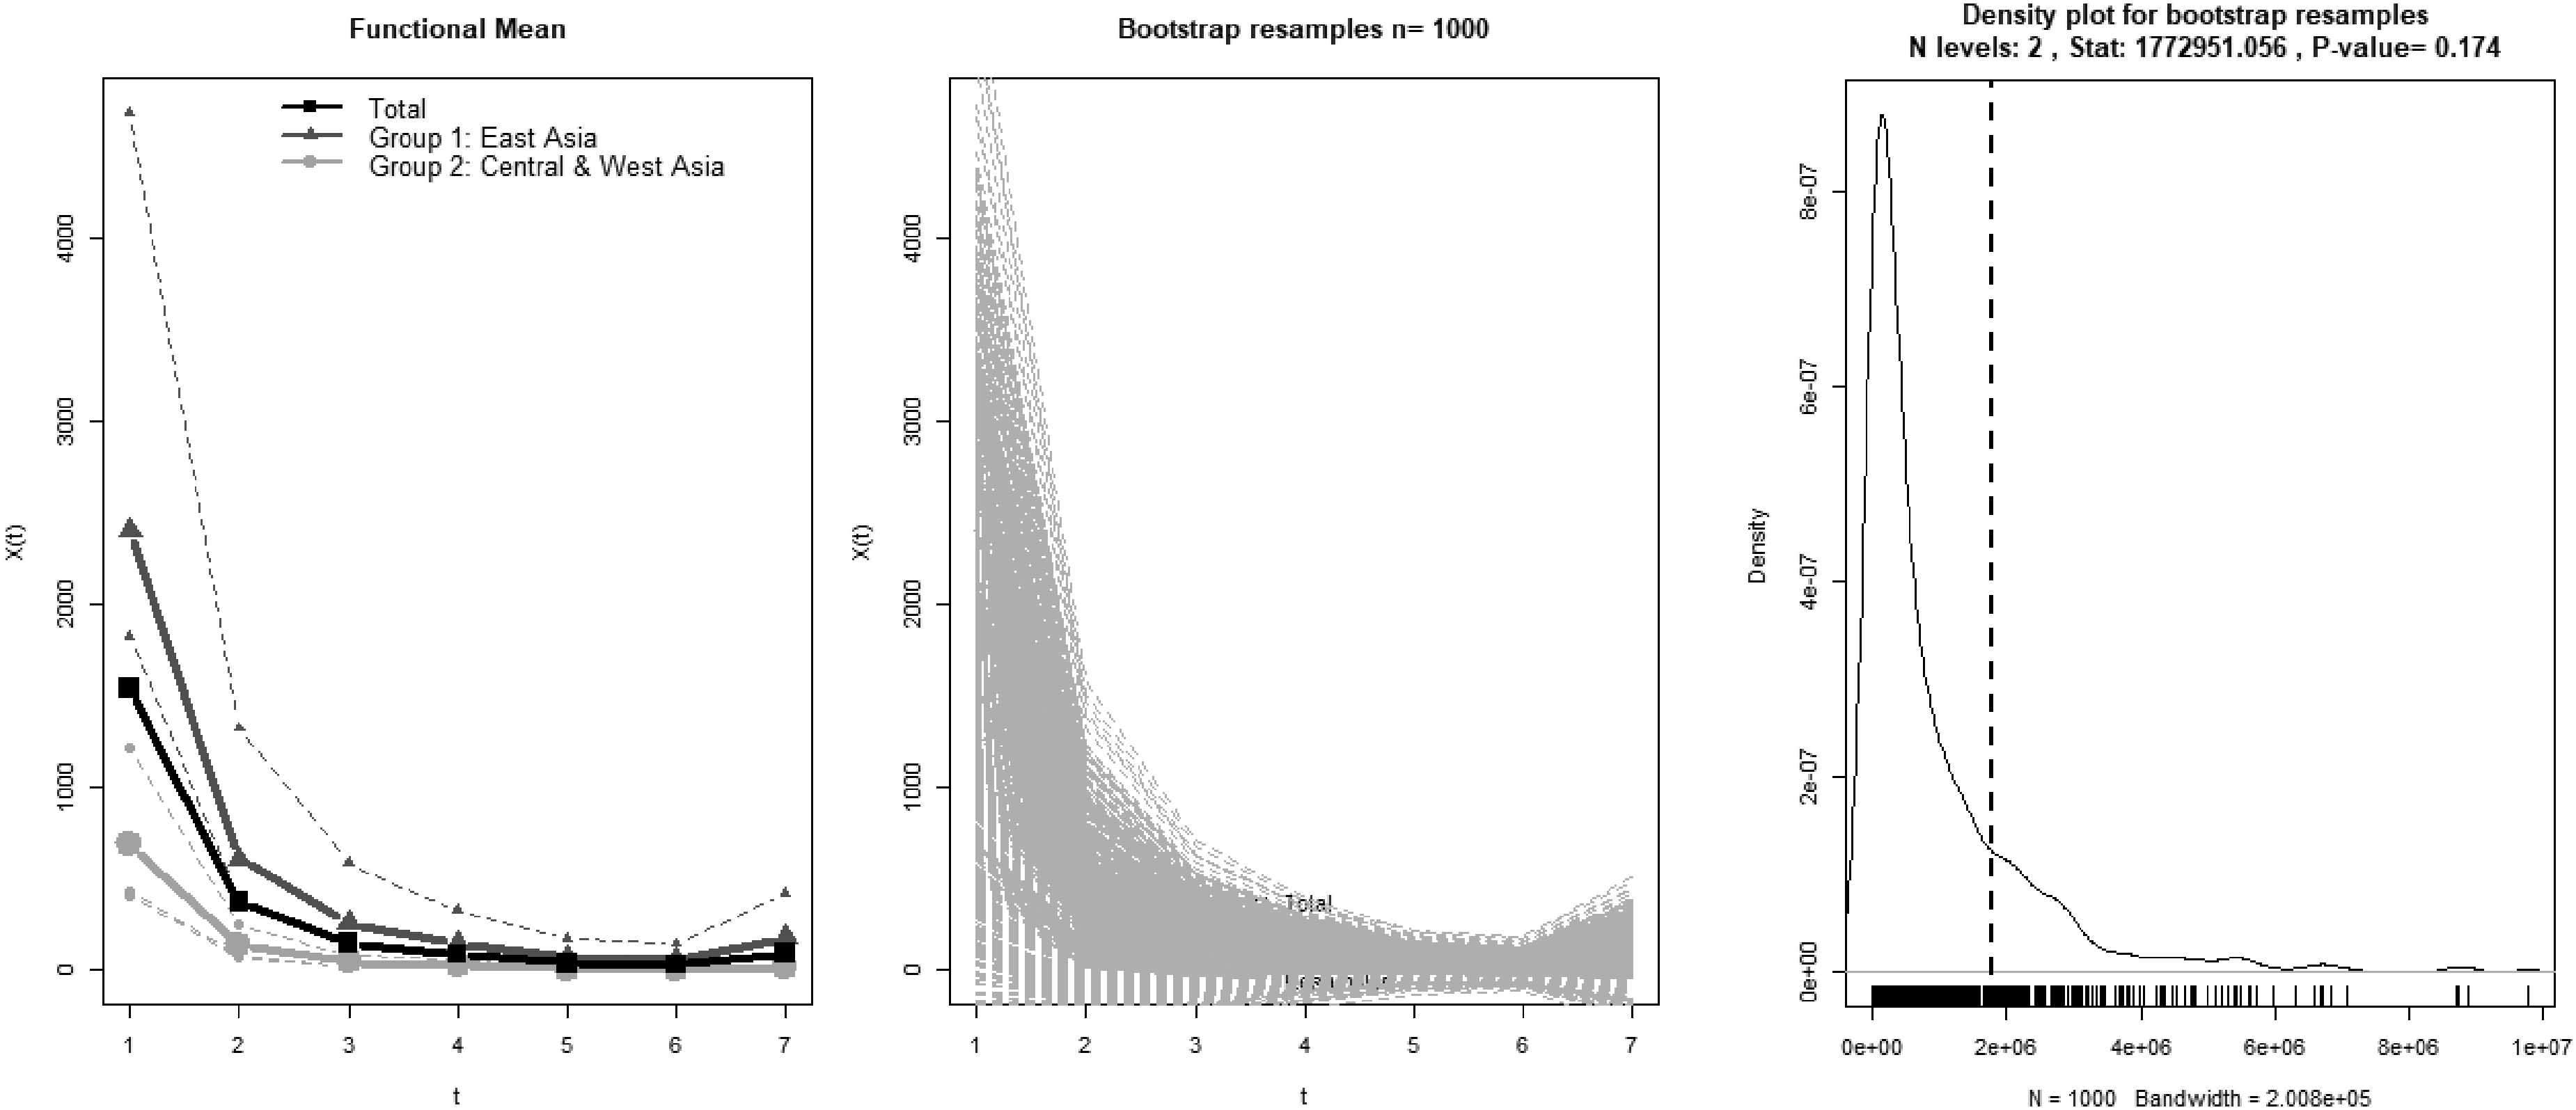
The Functional ANOVA Result Plots. Left: The Functional Mean for Group 1 in Dark Grey with Triangle Symbols (ENEA, PACIFIC, and SEA or “East Asia”) and Group 2 in Light Grey with Circle Symbols (NCA, SSWA, and ESCWA or “Central or West Asia”), with a Solid Black Line Representing the Overall Functional Mean and Dashed Lines for Each Region in the Background. Center: The 1000 Bootstrap Resamples. Right: The Density of Bootstrap Resamples and the p-Value.
Bradford Law
The core sources based on Bradford's Law are estimated using the
The Most Global Cited Documents
Table 2 presents the two most globally cited documents for each region, grouped by all-time citations and those published after 2020, as we aim to find the most recent papers reflecting changes in technologies trends, based on the SCOPUS database. The table includes the total citation (TC) frequency and average citations per year for each document. Note that some authors have multiple affiliations across different countries or their affiliation has changed over time. Therefore, only the affiliation listed in the published papers is considered in the table.
The Most Global Cited Documents Group by Region and Period Based on SCOPUS.
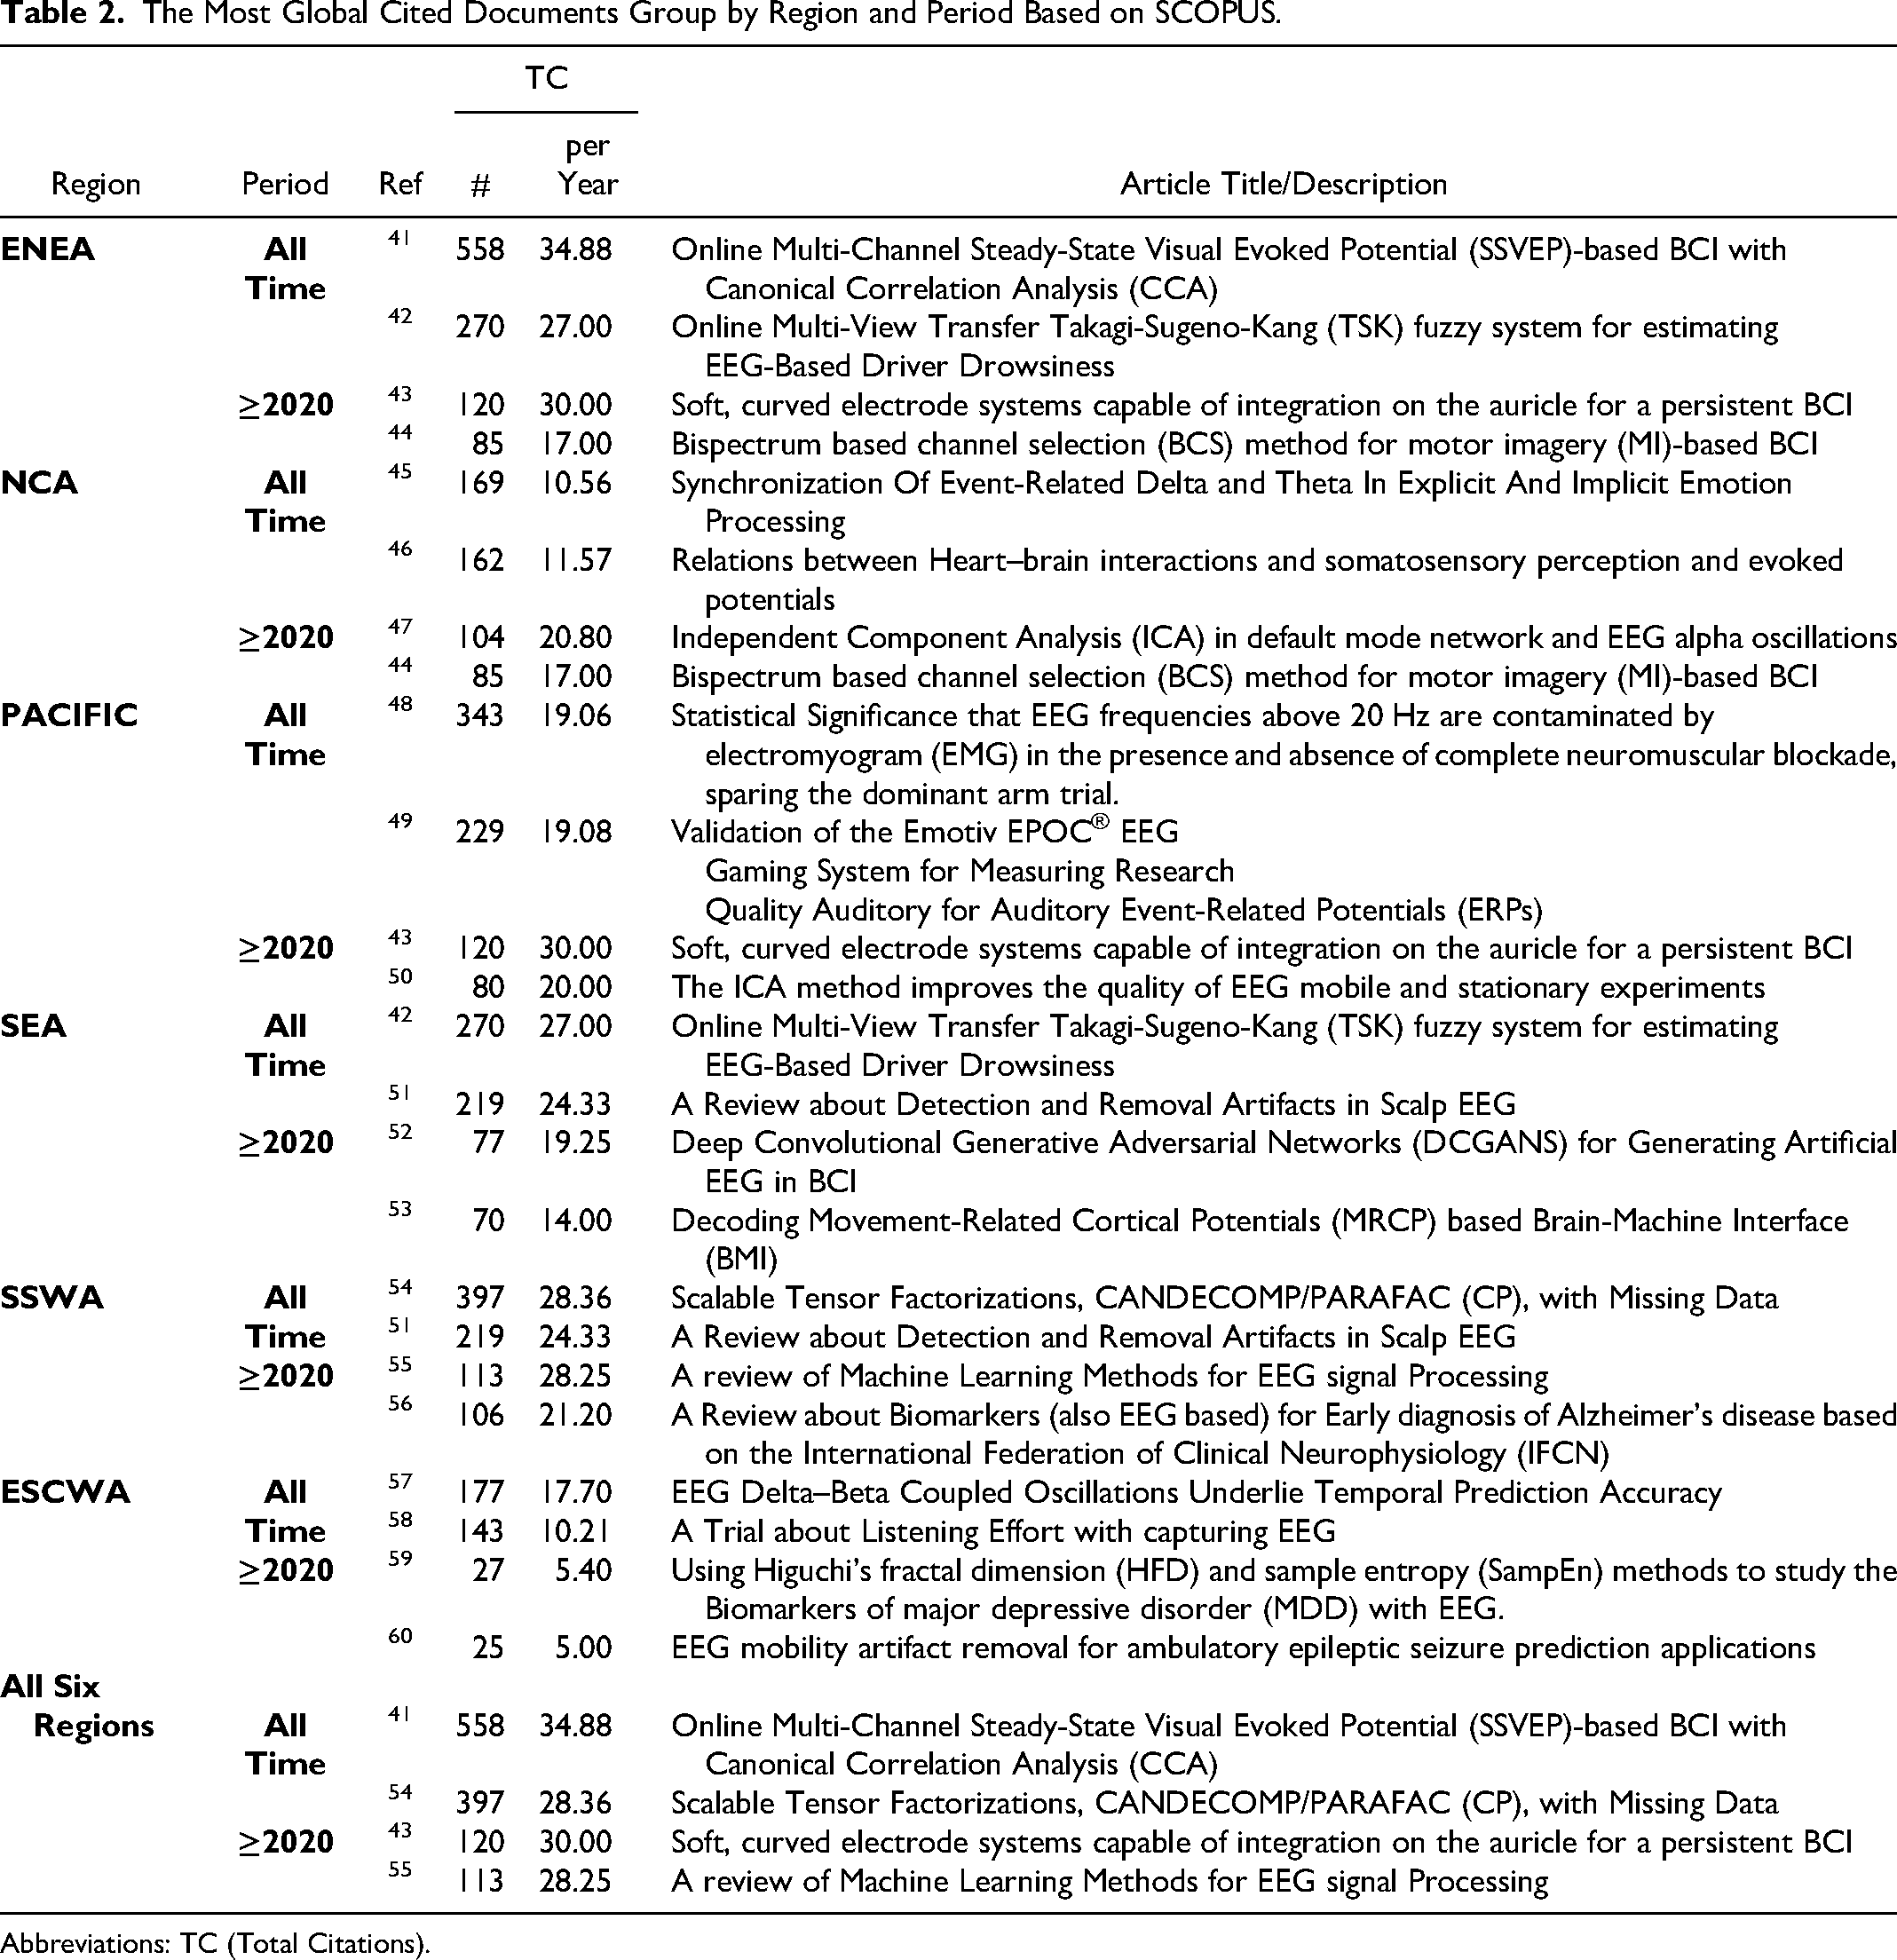
Abbreviations: TC (Total Citations).
The Co-Occurrence Network of WoS Subject
The Co-Occurrence Network of WoS (Web of Science) subjects identifies relationships between academic fields based on their co-occurrence in research papers. This network includes various clusters, such as subjects in Neurosciences, Psychology, Computer Science, Engineering, Statistics, Probability, Mathematics, Environmental Studies, Transportation and Ergonomics, Applied Physics, Material Sciences, Medicine and Health Care, Energy and Fuels, Language and Linguistics, Educational Research, Sports Science, Management, Library Science, Biology, and Robotics. These clusters cover diverse disciplines, with further analysis provided in the appendix A, part E.
The Co-Citation Network Papers
A co-citation network is a method used to visualize and analyze the relationships between scholarly papers based on how often they are cited together in other research. This network helps identify key papers that influence a field and understand how research evolves over time. In the context of EEG research, 5 plays a pivotal role as a central reference, with significant connections to foundational works such as,61,62 and. 63 The network also includes later influential papers like,64,65 and, 66 which collectively track the development of EEG signal processing, analysis techniques, and cognitive neuroscience. The latest addition to this co-citation network is, 67 which introduces the ICLabel MATLAB plug-in, offering a significant advance in automatic EEG artifact classification. These interconnected references illustrate the progression of EEG methodologies and their application to understanding brain activity, making the co-citation network a valuable tool for mapping the intellectual landscape of the field such as ICLabel Python package. 68 Other papers in this network are6,69–83: and 84 . (Appendix A, Part F provides a separate analysis for each region)
Collaboration Network Between Institute
The Collaboration Network Between Institutes refers to the connections formed through joint research, co-authored papers, and collaborative projects among academic institutions. In this region, three main collaboration clusters are identified: 1) the Chinese Academy of Sciences, University of Chinese Academy of Sciences (CAS), Southwest University, Beijing Normal University, Shanghai Jiao Tong University, Shenzhen University, and Peking University; 2) Zhejiang University and National University of Singapore; and 3) the University of California, UC San Diego, Monash University, Seoul National University (SNU), University of Toronto, and University of Tokyo. Additional universities are present in other subregions, including the Russian Academy of Sciences and HSE University in NCA, University of Technology Sydney and National Yang Ming Chiao Tung University in the Pacific, the Indian Institute of Technology (IIT), Shahed University, and Islamic Azad University in SSWA, and the Institut National de la Santé et de la Recherche Médicale (INSERM), Lebanese University, and Université de Rennes in ESCWA. Further details on other universities are available in Appendix A, Part G.
The Country Collaboration Map
The Figure 3 shows the frequency of collaborations between various countries, highlighting key international partnerships. China and the USA are the most frequent collaborators, with 308 joint activities, indicating a strong partnership. Australia and the USA follow with 132 collaborations, while China also has notable collaborations with the United Kingdom (131), Australia (102), Germany (89), and Canada (84). Australia collaborates not only with the USA but also with Germany (79) and the United Kingdom (77). Other significant collaborations include the USA and South Korea (77) and Japan and the USA (70). Overall, China, the USA, and Australia emerge as major hubs for international collaborations, with strong research and joint efforts occurring between these countries. The subregion analysis are in the appendix A, Part H.
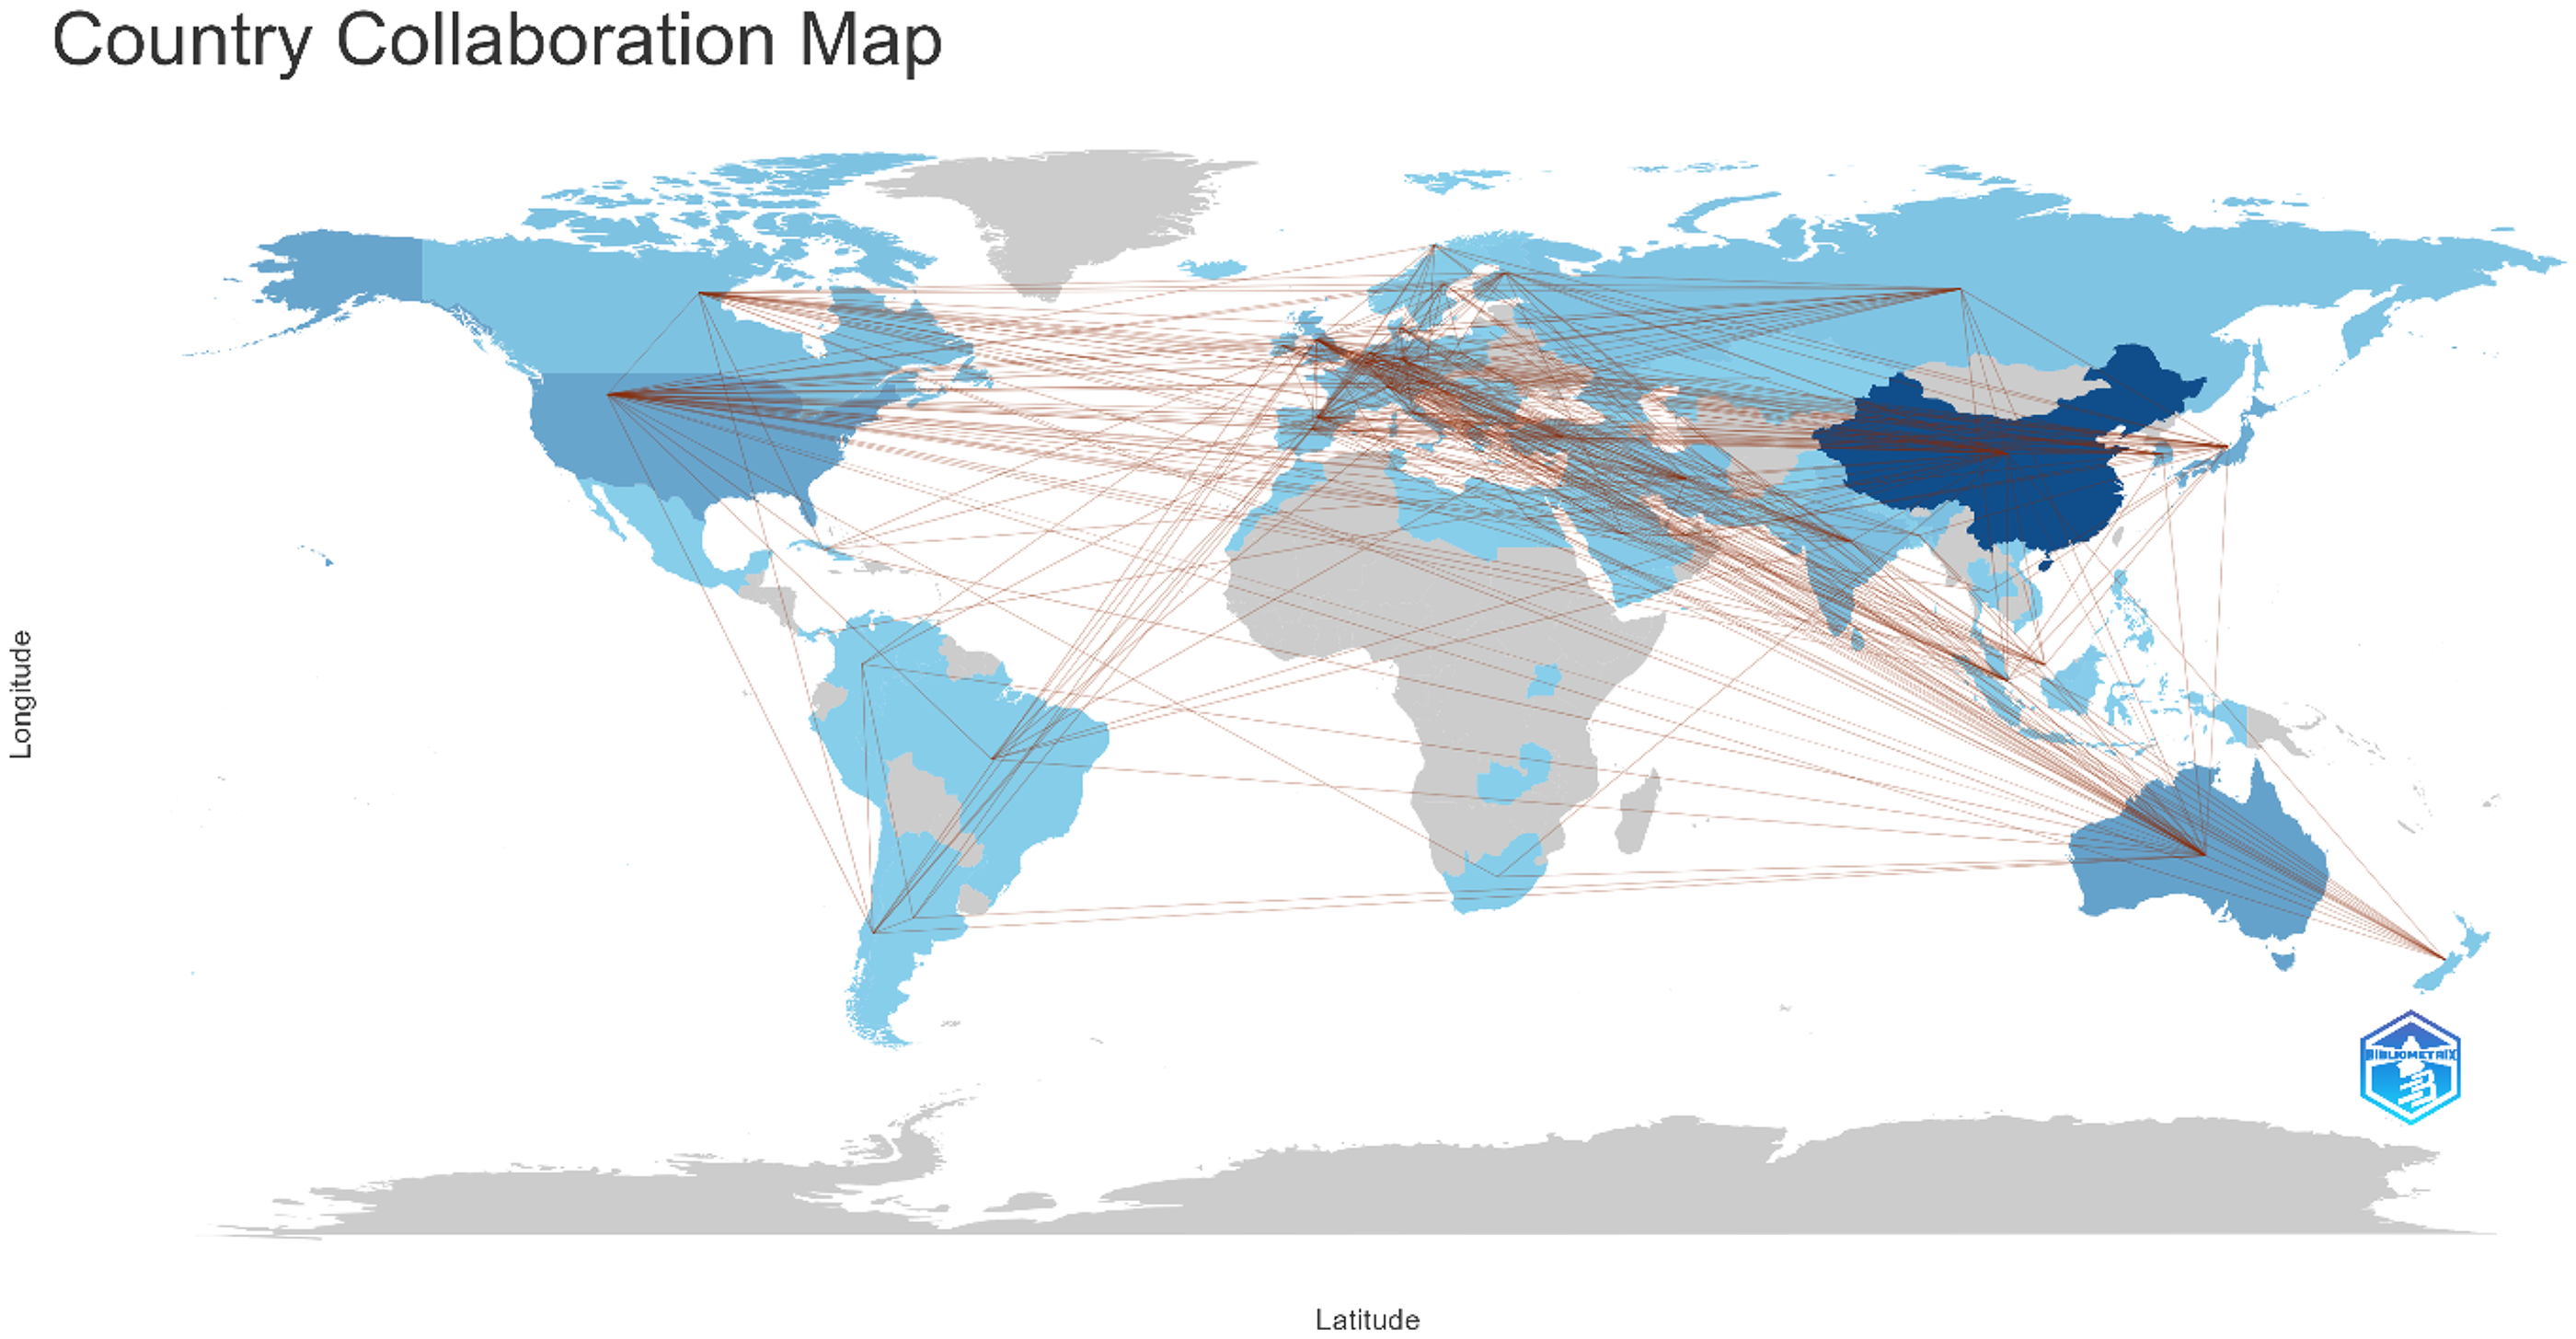
The Country Collaboratin Map of Studied Regions.
Authors Production Over Time
Chin-Teng Lin from the University of Technology Sydney and Li Hu (胡理) from the Institute of Psychology, Chinese Academy of Sciences are ranked first and second, respectively, based on the number of articles published and total citations per year from 2006 to 2024. Their consistent research output and influence in their fields are reflected in these rankings. The production over time for other authors in each region is provided in Appendix A, Part I.
The Further Analysis
The Further analysis, grouped by subregions, including Keyword Plus Trend Topics and historiography with a summary of the main findings, can be found in Appendix A, Part J and Appendix B, respectively.
Discussion
In the year marking the 20th anniversary of EEGLAB (2004-2023), the EEGLAB Newsletter issue 17, published in February 2024, 85 and a bibliometric analysis of all 12 700 Web of Science (WoS) citations of EEGLAB software up until 8/27/2023 were conducted. 10 The updated analysis, incorporating both Scopus and WoS citations, now totals 15 827 citations as of 03/28/2024. This new data shows that EEGLAB was published in 2072 sources, written by 33 070 authors, cited 763 160 references, and presented 21 384 keywords. The annual growth rate of publications is 18.63%, and the international co-authorship rate stands at 34.8%. Additionally, a comparison of total citations from the World, ESCAP, and ESCWA regions revealed 10 that approximately 35% of all WoS documents and 41% of authors came from these regions. However, the average citation per document globally is twice that of these regions.
The significance of countries in the Asia-Pacific region for neuroscience was previously emphasized. In this regard, Table 3 compares the top 10 articles with the highest number of total global citations after 2022 between the ESCAP & ESCWA regions in the WoS database, as well as all countries worldwide in the SCOPUS database. Focusing on articles published after 2022 allows us to identify recent trends and emerging research, driven by technological advancements. The first three articles from WoS in the ESCAP & ESCWA regions and the first three from SCOPUS globally present common themes centered on EEG-based applications in emotion recognition, 86 driver distraction detection, 87 and mental health diagnosis. Both sets of articles utilize advanced deep learning models and EEG data to enhance recognition accuracy, with a strong emphasis on using spatial and temporal information for more accurate predictions. However, differences arise in scope and application. The WoS articles focus on specific, localized issues like emotion recognition and mental health detection, typically applying specialized models (eg, transformer-based models, 86 deep learning for schizophrenia detection 88 *). In contrast, the SCOPUS abstracts explore broader, global problems such as multi-modal affective computing 89 and the cognitive impacts of COVID-19, 90 reflecting a wider international perspective. A unique aspect is the repetition of86,87 and, 88 which are present in the ESCAP & ESCWA and all world but have different citation counts between the two databases, illustrating the varying academic reach across platforms.
The Most Global Cited Documents Group by Database and Region After 2022.
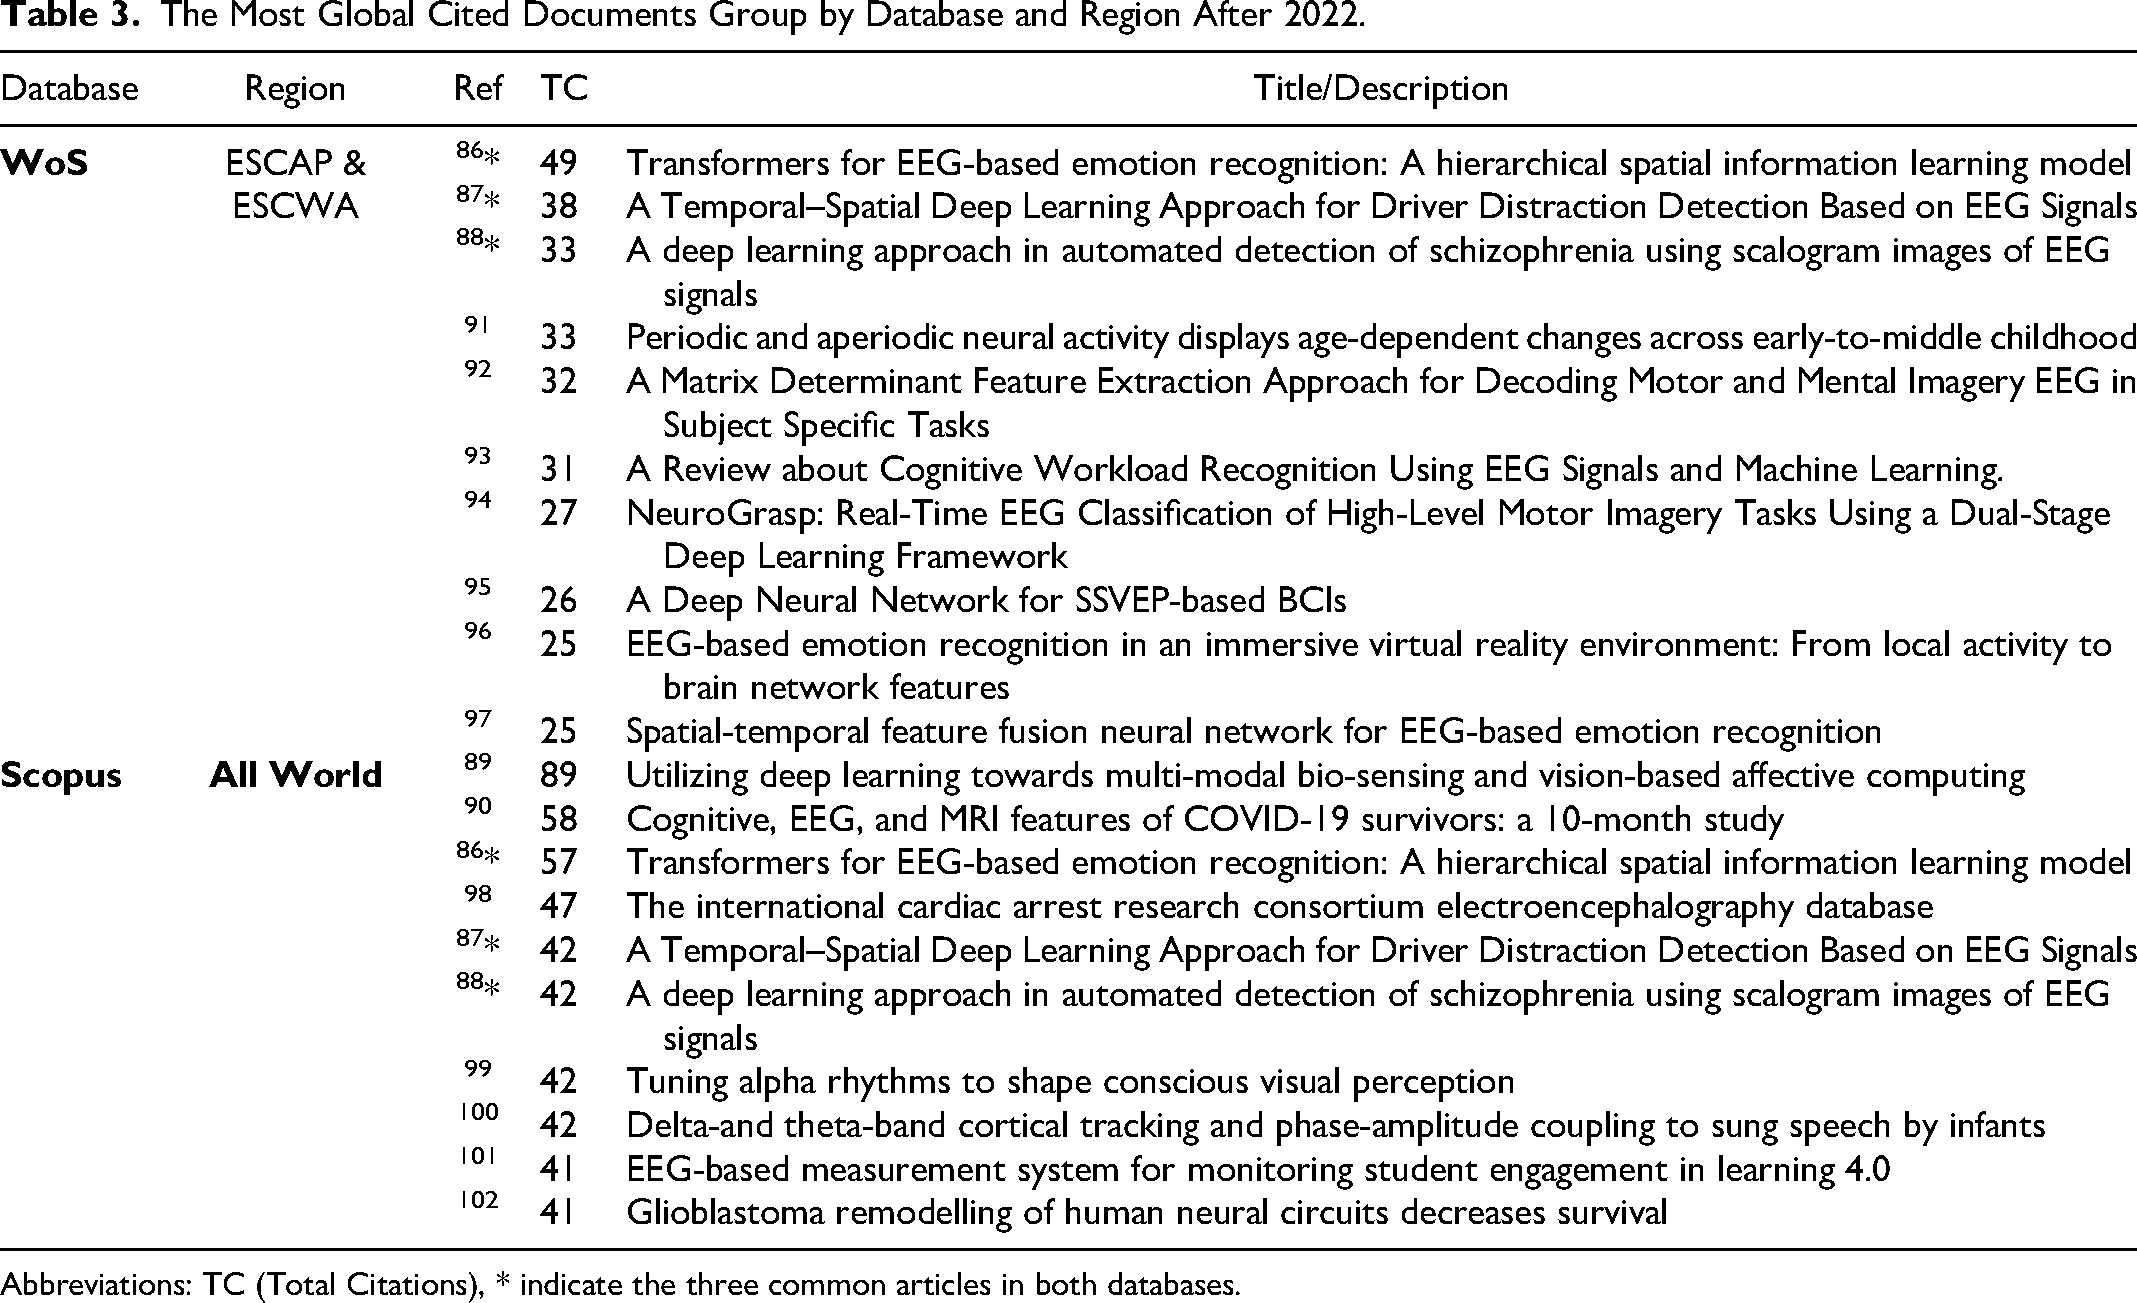
Abbreviations: TC (Total Citations), * indicate the three common articles in both databases.
One of the main direction for future research is the bibliometric analysis of some specific topics in these regions and its relations with EEGLAB and EEG such as Traditional Chinese Medicine like Herbs and Acupuncture103,104 Islamic health-related topics, 105 and Yoga and meditation. 106 Other methodological direction is combing bibliometric analysis with functional data analysis such as Functioanl Clustering of knowledge-based system (KBS) 107 and Spatio-Temporal Dynamics of European Innovation. 108 The main limitation of this research is that it only considers the papers that cited the EEGLAB main paper, therefore many more articles are not considered and other databases such as DOAJ indexed-only or articles with other languages are not provided.
Supplemental Material
sj-docx-1-eeg-10.1177_15500594261428714 - Supplemental material for A Bibliometric Examination of EEGLAB Publications in Scopus and WoS Indexed Sources: A 20-Year Study of Asia-Pacific and Arabian Countries
Supplemental material, sj-docx-1-eeg-10.1177_15500594261428714 for A Bibliometric Examination of EEGLAB Publications in Scopus and WoS Indexed Sources: A 20-Year Study of Asia-Pacific and Arabian Countries by Mohammad Fayaz and Nadhim Azeez Sayel in Clinical EEG and Neuroscience
Supplemental Material
sj-docx-2-eeg-10.1177_15500594261428714 - Supplemental material for A Bibliometric Examination of EEGLAB Publications in Scopus and WoS Indexed Sources: A 20-Year Study of Asia-Pacific and Arabian Countries
Supplemental material, sj-docx-2-eeg-10.1177_15500594261428714 for A Bibliometric Examination of EEGLAB Publications in Scopus and WoS Indexed Sources: A 20-Year Study of Asia-Pacific and Arabian Countries by Mohammad Fayaz and Nadhim Azeez Sayel in Clinical EEG and Neuroscience
Footnotes
Acknowledgements
I would like to acknowledge that educational programs, such as organizing conferences, training workshops, and supporting researchers in these regions, play a crucial role in advancing research. For example, the 2021 Virtual EEGLAB Workshop Pacific/Asia was a significant event that contributed to this goal, with the support of Professors Arnaud Delorme, Scott Makeig, and Tzyy-Ping Jung (鍾子平) from the Swartz Center for Computational Neuroscience, University of California San Diego, La Jolla, CA, USA, along with Professor Makoto Miyakoshi (宮腰誠) from the Division of Child and Adolescent Psychiatry, Cincinnati Children's Hospital Medical Center, Cincinnati, Ohio.
Ethical Considerations
There is no clinical trial or human subjects in this study.
Funding
The authors received no financial support for the research, authorship, and/or publication of this article.
Declaration of Conflicting Interests
The authors declared no potential conflicts of interest with respect to the research, authorship, and/or publication of this article.
Data Availability Statement
The datasets are available in request from authors.
Pre-Print Hosting
Preprint reference: Fayaz, M.; Azeez Sayel, N. How ASIA-PACIFIC and Arabian Countries Published Articles in the Scopus and WoS Indexed Sources with EEGLAB in 20 Years: A Bibliometric Study. Preprints 2024, 2024110750. https://doi.org/10.20944/preprints202411.0750.v1 Direct link: https://www.preprints.org/manuscript/202411.0750
Registered Clinical Trials (RCTs)
There is no clinical trial or human subjects in this study.
Supplemental Material
Supplemental material for this article is available online.
References
Supplementary Material
Please find the following supplemental material available below.
For Open Access articles published under a Creative Commons License, all supplemental material carries the same license as the article it is associated with.
For non-Open Access articles published, all supplemental material carries a non-exclusive license, and permission requests for re-use of supplemental material or any part of supplemental material shall be sent directly to the copyright owner as specified in the copyright notice associated with the article.