
Abstract
Background
There is a great need in distinguishing Dementia with Lewy Body (DLB) from Alzheimer's disease (AD) and elucidating its pathophysiology. Transcranial magnetic stimulation (TMS) evoked potentials (TEPs) offer a non-invasive measure of neurophysiological alterations associated with underlying disease pathology.
Methods
A total of 39 participants were included: 12 DLB, 10 AD, and 17 age-matched healthy controls (HC). TEPs were measured in the dorsolateral prefrontal cortex (DLPFC), primary motor cortex (M1), and primary visual cortex (V1).
Results
Global mean field potential (GMFP) TEP (130-250 ms) showed a significant interaction of group and stimulation site (p = .0101, ηp2 = 0.175) with a significant group effect (p = .0071, ηp2 = 0.234), attributed to higher GMFP in DLB compared to AD and HC in response to V1 stimulation (p = .001, p = .001, respectively). TEP amplitude corresponding to P60 displayed a significant group*stimulation site interaction (p = .0037, ηp2 = 0.202) arising from differences in DLPFC stimulation, between DLB compared to AD (p = .0013) and HC (p = .0032). DLPFC N45 presented a significant stimulation site effect not associated to a specific group in addition to DLPFC N45 amplitude being correlated to the UPDRS-III score (r = 0.9, p = .0002). A relative higher left over right DLPFC P30 amplitude was correlated with poorer MoCA scores in AD (r = −0.84, p = .002), as indicated by others before.
Conclusions
DLPFC may be a target for both diagnosis and assessment of severity of motor symptoms in DLB and cognitive impairment in AD. These results propose a promising method to non-invasively distinguish DLB from AD and monitor disease, based on DLPFC and V1 network characteristics.
Keywords
Introduction
Alzheimer's disease (AD) and dementia with Lewy bodies (DLB) are the two most prevalent forms of neurodegenerative dementia. Clinically differentiating between these two diseases can be challenging.1–3 The differential diagnosis of DLB and AD is particularly important in the era of disease modifying drugs, aimed at specific pathological process underlying neurodegeneration. Furthermore, it has implications for clinical management and prognostication. For example, Using Transcranial magnetic stimulation (TMS) with simultaneous EEG has shown as a useful tool to objectively detect treatment effects in Alzheimer's Disease, both with novel pharmacological agents 4 as well as with neuromodulatory interventions.5–7 Therefore, a direct method for measuring and mapping changes of functional brain network's activity responsible for disease manifestation could improve accuracy of diagnosis. Neurophysiological modalities may provide an accessible tool for recording such measures, however, at present, neurophysiological tools are generally not utilized to that end.
Transcranial magnetic stimulation (TMS) has been investigated as a diagnostic tool in various neurological diseases, as it can noninvasively measure cortical excitability and connectivity even at very early stages of disease. 8 Transcranial magnetic stimulation combined with EEG (TMS-EEG) provides a non-invasive, cost-effective method to quantify cortical excitability, inhibition, and connectivity.9–11 TMS-evoked potentials (TEPs) display reproducible components positive and negative peaks at specific latencies (P30, N45, P60, N100 and P180) that index distinct neurochemical mechanisms.12,13 Pharmacologic studies link N45 to GABA-A and NMDA activity,14–16 P60 to AMPA-mediated excitation14,15 and N100 to GABA-B inhibition,17–19 while P30 and P180 are modulated by voltage-gated sodium channel blockade. 19 More specifically, AD is characterized by increased cortical excitability measured by motor threshold (MT) and reduced cortical inhibition measured by short latency inhibition (SAI), while DLB is presented with no changes in MT and decreased SAI. 20 The combination of TMS and electroencephalography (EEG) allows for examination of motor and non-motor cortico-cortical interactions at millisecond timescales, of plasticity mechanisms, and of interactions between excitatory and inhibitory responses. Hence, TMS–EEG enables to probe brain function across almost all areas of the cortical mantle and associated cortical networks, making it a powerful tool to study clinical populations. 21
TMS–EEG is characterized by a typically highly reproducible waveform with specific positive and negative deflections.12,22 Following the application of magnetic stimulation, locally evoked action potentials are thought to propagate along anatomical connections across cortical layers within the same cortical column and to other cortical and subcortical regions and can result in entire network activation.23,24 These attributes provide the ability to ‘probe’ specific brain networks by measuring their TMS-induced evoked potentials (TEPs) response.
Various time-domain features including some related to local and distributed evoked activity were calculated from TMS-EEG data to differentiate between AD patients and healthy controls.25–27 Most of these studies indicate increased excitability levels in AD patients.26,27 One study showed that the maximum TEP amplitude, its complexity and the amplitude (at 45-80 ms after the TMS-pulse), enables to distinguish between AD and healthy controls. 26 While many studies have focused on AD, very few investigated DLB. 28
In this exploratory study, we aimed to elucidate disease specific pathophysiological differences between DLB, AD and HC, manifested network excitation patterns of both intra and inter-hemispheric dynamics, as reflected in TEP measures recorded in Dorso-lateral pre-frontal cortex (DLPFC), motor and occipital networks.
Methods
Patient Population and Ethical Considerations
Patients with a diagnosis of either AD or DLB, were offered to participate in the study following their routine visit to the Cognitive Neurology Unit at Tel-Aviv Medical Center (TLVMC). DLB patients were diagnosed according to the Fourth Consensus Report of the DLB Consortium Mckeith diagnostic criteria, 1 based on a multidisciplinary clinical evaluation in a tertiary cognitive neurology clinic. Core clinical features including visual hallucinations, parkinsonism, and cognitive fluctuations were systematically assessed, and structural MRI and medical history were reviewed to exclude alternative diagnoses. Patients with AD were diagnosed in accordance with the Revised criteria for the diagnosis and staging of Alzheimer's disease and were all Amyloid PET or CSF beta-amyloid positive. In addition, we included age-matched healthy controls (HC) who had no history of neurological disease and MOCA scores of 24 and above. This threshold was chosen as it provides a more accurate and generalizable cutoff for individuals over 50 from diverse ethnic, racial and socioeconomical background, 29 and has also been identified as the optimal data-driven threshold in a meta-analysis. 30
All participants underwent neurological and cognitive evaluation including the Montreal Cognitive Assessment (MoCA). Patients with DLB underwent Unified Parkinsons’ disease Rating Scale part 3 (UPDRS III) to evaluate motor symptoms 31 and the occurrence of visual hallucinations was recorded as well. Brain MRI scans, medical history, and medications were reviewed to rule out other neurological disorders. The study was approved by the local institutional review board (IRB) and all participants signed informed consent in accordance with Good Clinical Practice (GCP) guidelines.
TMS-EEG Procedure
TMS-EEG acquisition was performed with the Delphi system version 1.0 including Delphi acquisition and analysis software (QuantalX Neuroscience), EEG compatible TMS stimulator and 65 mm figure 8 coil (MagPro R30 stimulator (MagVenture, Denmark) and an MCF-B65-HO figure-8 Coil (MagVenture, Denmark), TMS compatible DC coupled amplifier with sampling rate of 5 KHz (Delphi Amplifier, QuantalX Neuroscience) and 34 electrode cap with Ag\AgCl sintered electrodes (Delphi MCS cap, QuantalX Neuroscience). The stimulation protocol included six stimulation sites: left and right dorso-lateral pre-frontal cortex (DLPFC), left and right M1, and left and right primary visual cortex (V1). Each stimulation site was averaged with its contralateral counterpart, representing the entire left and right network of this cortex, resulting in three output stimulation sites (DLPFC, M1 and V1).
All participants performed the same TMS-EEG (Delphi) evaluation. The left and right resting motor threshold (RMT) were obtained, according to guidelines, 32 Single pulse (<0.3 Hz), with 85% of RMT intensity was applied to all stimulation sites. For the full procedural protocol please refer to Supplemental material.
TEPs Analysis
Data acquisition, pre-processing, and cleaning of the transcranial evoked response was performed with Delphi software 1.0 (QuantalX Neuroscience) with automatic automatic noise detection, removal and feature extraction.33–37 For the full procedural protocol please refer to Supplemental material.
Regional and network TEPs are the electrical responses recorded from specific regions of the brain (regional- adjacent to stimulation site) and the connections between different brain regions (network) in response to stimulation (further from stimulation site). The strength (amplitude) of the electrical signal was measured at specific time points (latencies) after the stimulation. Peaks of TEPs (P30, N45, P60, N100, and P180) represent specific points in time where the signal reaches maximum or minimum values. The amplitudes for these components (P30, N45, P60, N100 and P180) were indexed to specific latencies (30 msec, 50 msec, 75 msec, 115 msec and 190 msec, respectively) based on the detected peaks contralateral (ipsilateral for P30) to stimulation, in previous normative data collected with Delphi and in Louimise et al 2009. 12 Global Mean Field Potentials (GMFPs) are the overall electrical activity across all EEG electrodes at different time points. 38 It is a measure of the standard deviation of the potentials across all electrodes, reflecting the overall activity of the brain. The GMFP signal was then divided into three-time intervals: early (15-45 ms), mid (45-130 ms), and late (130-250 ms). This segmentation allows for the analysis of different phases of brain activity following stimulation. We also evaluated the relationship of symptoms’ severity to the relative difference left versus right TEP of each stimulated cortex (left-right/ left + right) in order to understand if the balance of homologous cortices is related to disease manifestation. Higher (positive) values indicate left dominance/hyperexcitability and lower (negative) values represent right dominance/hyperexcitability. Delphi algorithm automatically analyses the regional and network TEPs recorded in response to each stimulation site and extracts numeric output of TEPs features.33–37
Statistical Analysis
A 3 × 3 mixed effects two-way ANOVA was used to determine the effect of group, stimulation site and group by stimulation site interaction on the Delphi TEP measures. Multiplicity adjustments were applied by controlling for false discovery rate using two stage step-ups suggested by Benjamini, Kreiger and Yekutieli, 2005. 39 P-values represents the group effect (G), stimulation site (SS) effect and group by stimulation site (SS*G) interactions, based on the linearly independent pairwise comparisons among the estimated marginal means. Pairwise post-hoc analysis of differences in TEP measures between subgroups within each stimulation site was done using Bonferroni. Pearson correlation was used to test associations between disease characteristics and Delphi TEP measures, with Bonferroni correction to control for type I error due to multiple comparisons. Statistical analysis was performed with GraphPad Prism version 10.1.2.
Results
Participants Characteristics
Twelve patients with DLB (mean age 73 ± 6.15), 10 patients with AD (mean age 75 ± 3.83), and 17 age-matched HC (mean age 73.5 ± 1.82) were included. No significant differences in age, age at onset of symptoms (AAO), disease duration, or years of education were observed between the groups (p = .42, p = .39, p = .22, p = .16, respectively) (Table 1). Both DLB and AD patients had significantly lower MoCA scores compared to HC (p < .0001, p = .0003, respectively), however no difference was observed between the DLB and AD groups (p = .22). The DLB group had significantly fewer females compared to HC (p = .01) but not compared to AD (p = .14). The DLB group had only one female patient, thus testing of gender effect in a factorial ANOVA analysis was denied (See Table 1). Among the DLB patient group 83% (10/12) reported visual hallucinations at some point during their disease course and 50% (6/12) reported hallucinations on the day of the evaluation. No adverse events were reported.
Patient Characteristics.
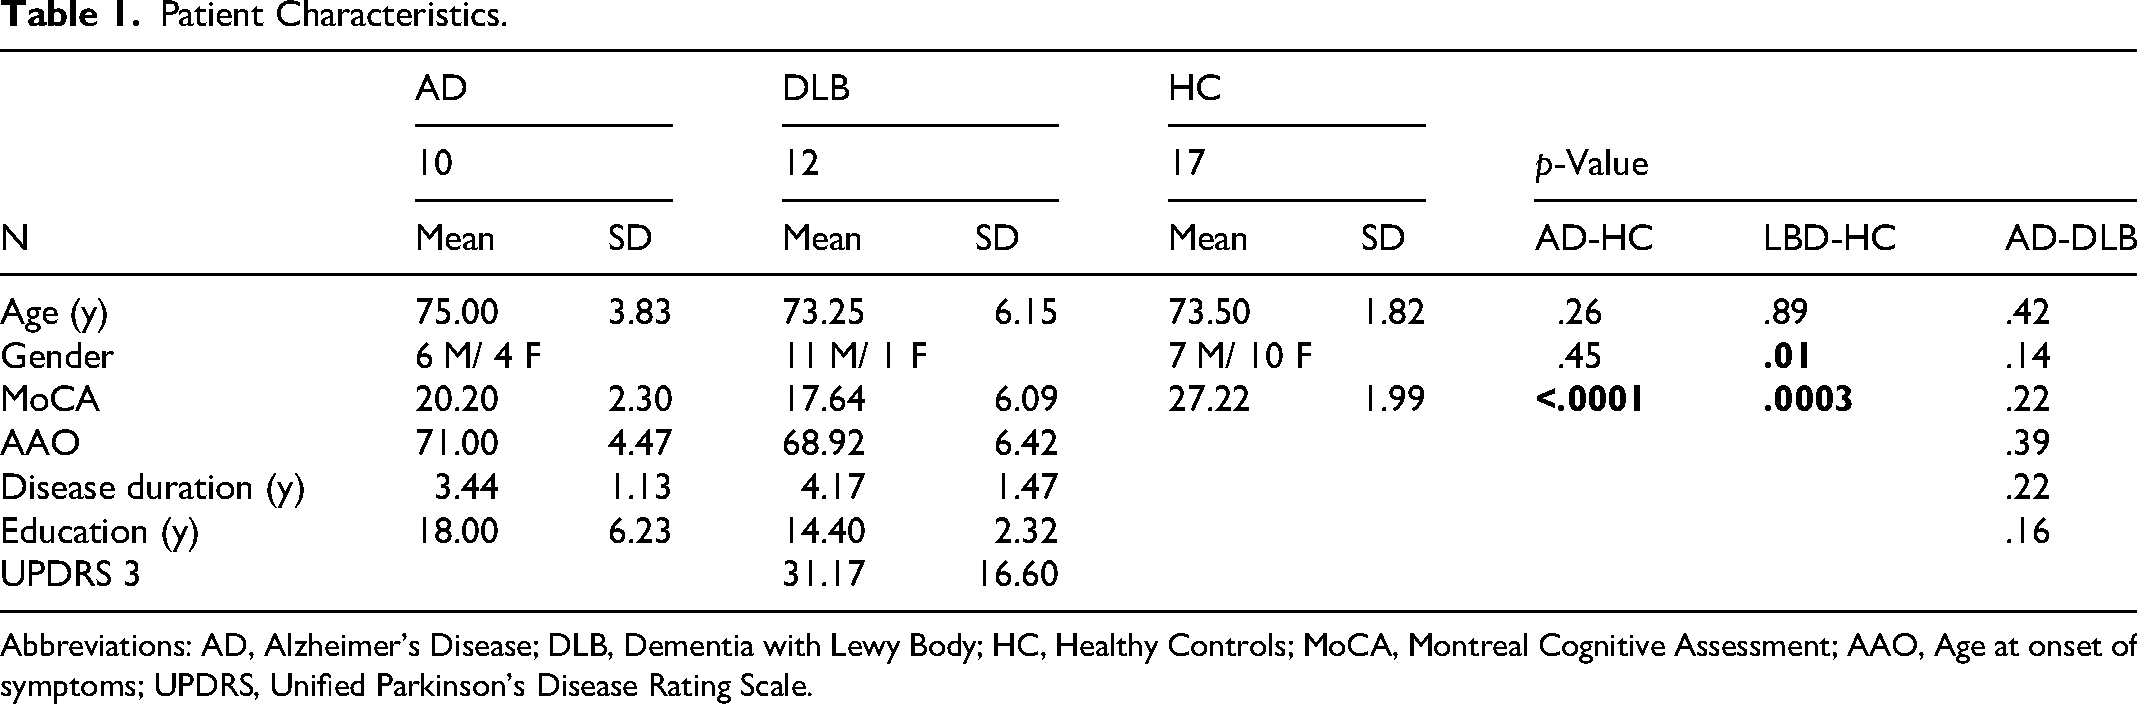
Abbreviations: AD, Alzheimer's Disease; DLB, Dementia with Lewy Body; HC, Healthy Controls; MoCA, Montreal Cognitive Assessment; AAO, Age at onset of symptoms; UPDRS, Unified Parkinson's Disease Rating Scale.
Differences in TEP Peaks Between DLB, AD and HC in Response to M1, DLPFC, and V1 Stimulation
There was no significant interaction or group effect in N45 and P30 amplitude, however, a significant stimulation site effect was observed (F (1.778, 60.46) = 9.8, p = .0125, ηp2=0.224 and F (1.95, 66.29) = 4.746, p = .0003, ηp2 = 0.123 respectively) with generally more pronounced N45 and P30 amplitudes in response to M1 stimulation and less pronounced in response to V1 stimulation (Table 2, Figure 1a–c, e). No significant interaction effect was observed (p = .27). No group or stimulation site effect was observed in P60 amplitude (p = .99, p = .89 respectively). A significant interaction of group by stimulation site effect was observed in P60 amplitude (F (4, 68)= 4.301, p = .0037, ηp2=0.202), with post-hoc pairwise comparisons revealing a significantly higher P60 amplitude in response to DLPFC stimulation in DLB compared to AD (adjusted p = .0013) and HC (adjusted p = .0032) (Table 2, Figure 1a–c, f). Additionally, a significant group effect was observed in P180 amplitude (F(2, 37) = 3.545, p = .039, ηp2=0.161) with no stimulation site effect and no group by stimulation site interaction (p = .27, p = .41 respectively), with HC generally showing higher amplitude than DLB (Table 2, Figure 1a–c, h). Although displaying large changes in average TEP trace in response to M1 and DLPFC stimulation, both P30 and N100 did not demonstrate any significant effects after multiple comparisons correction.
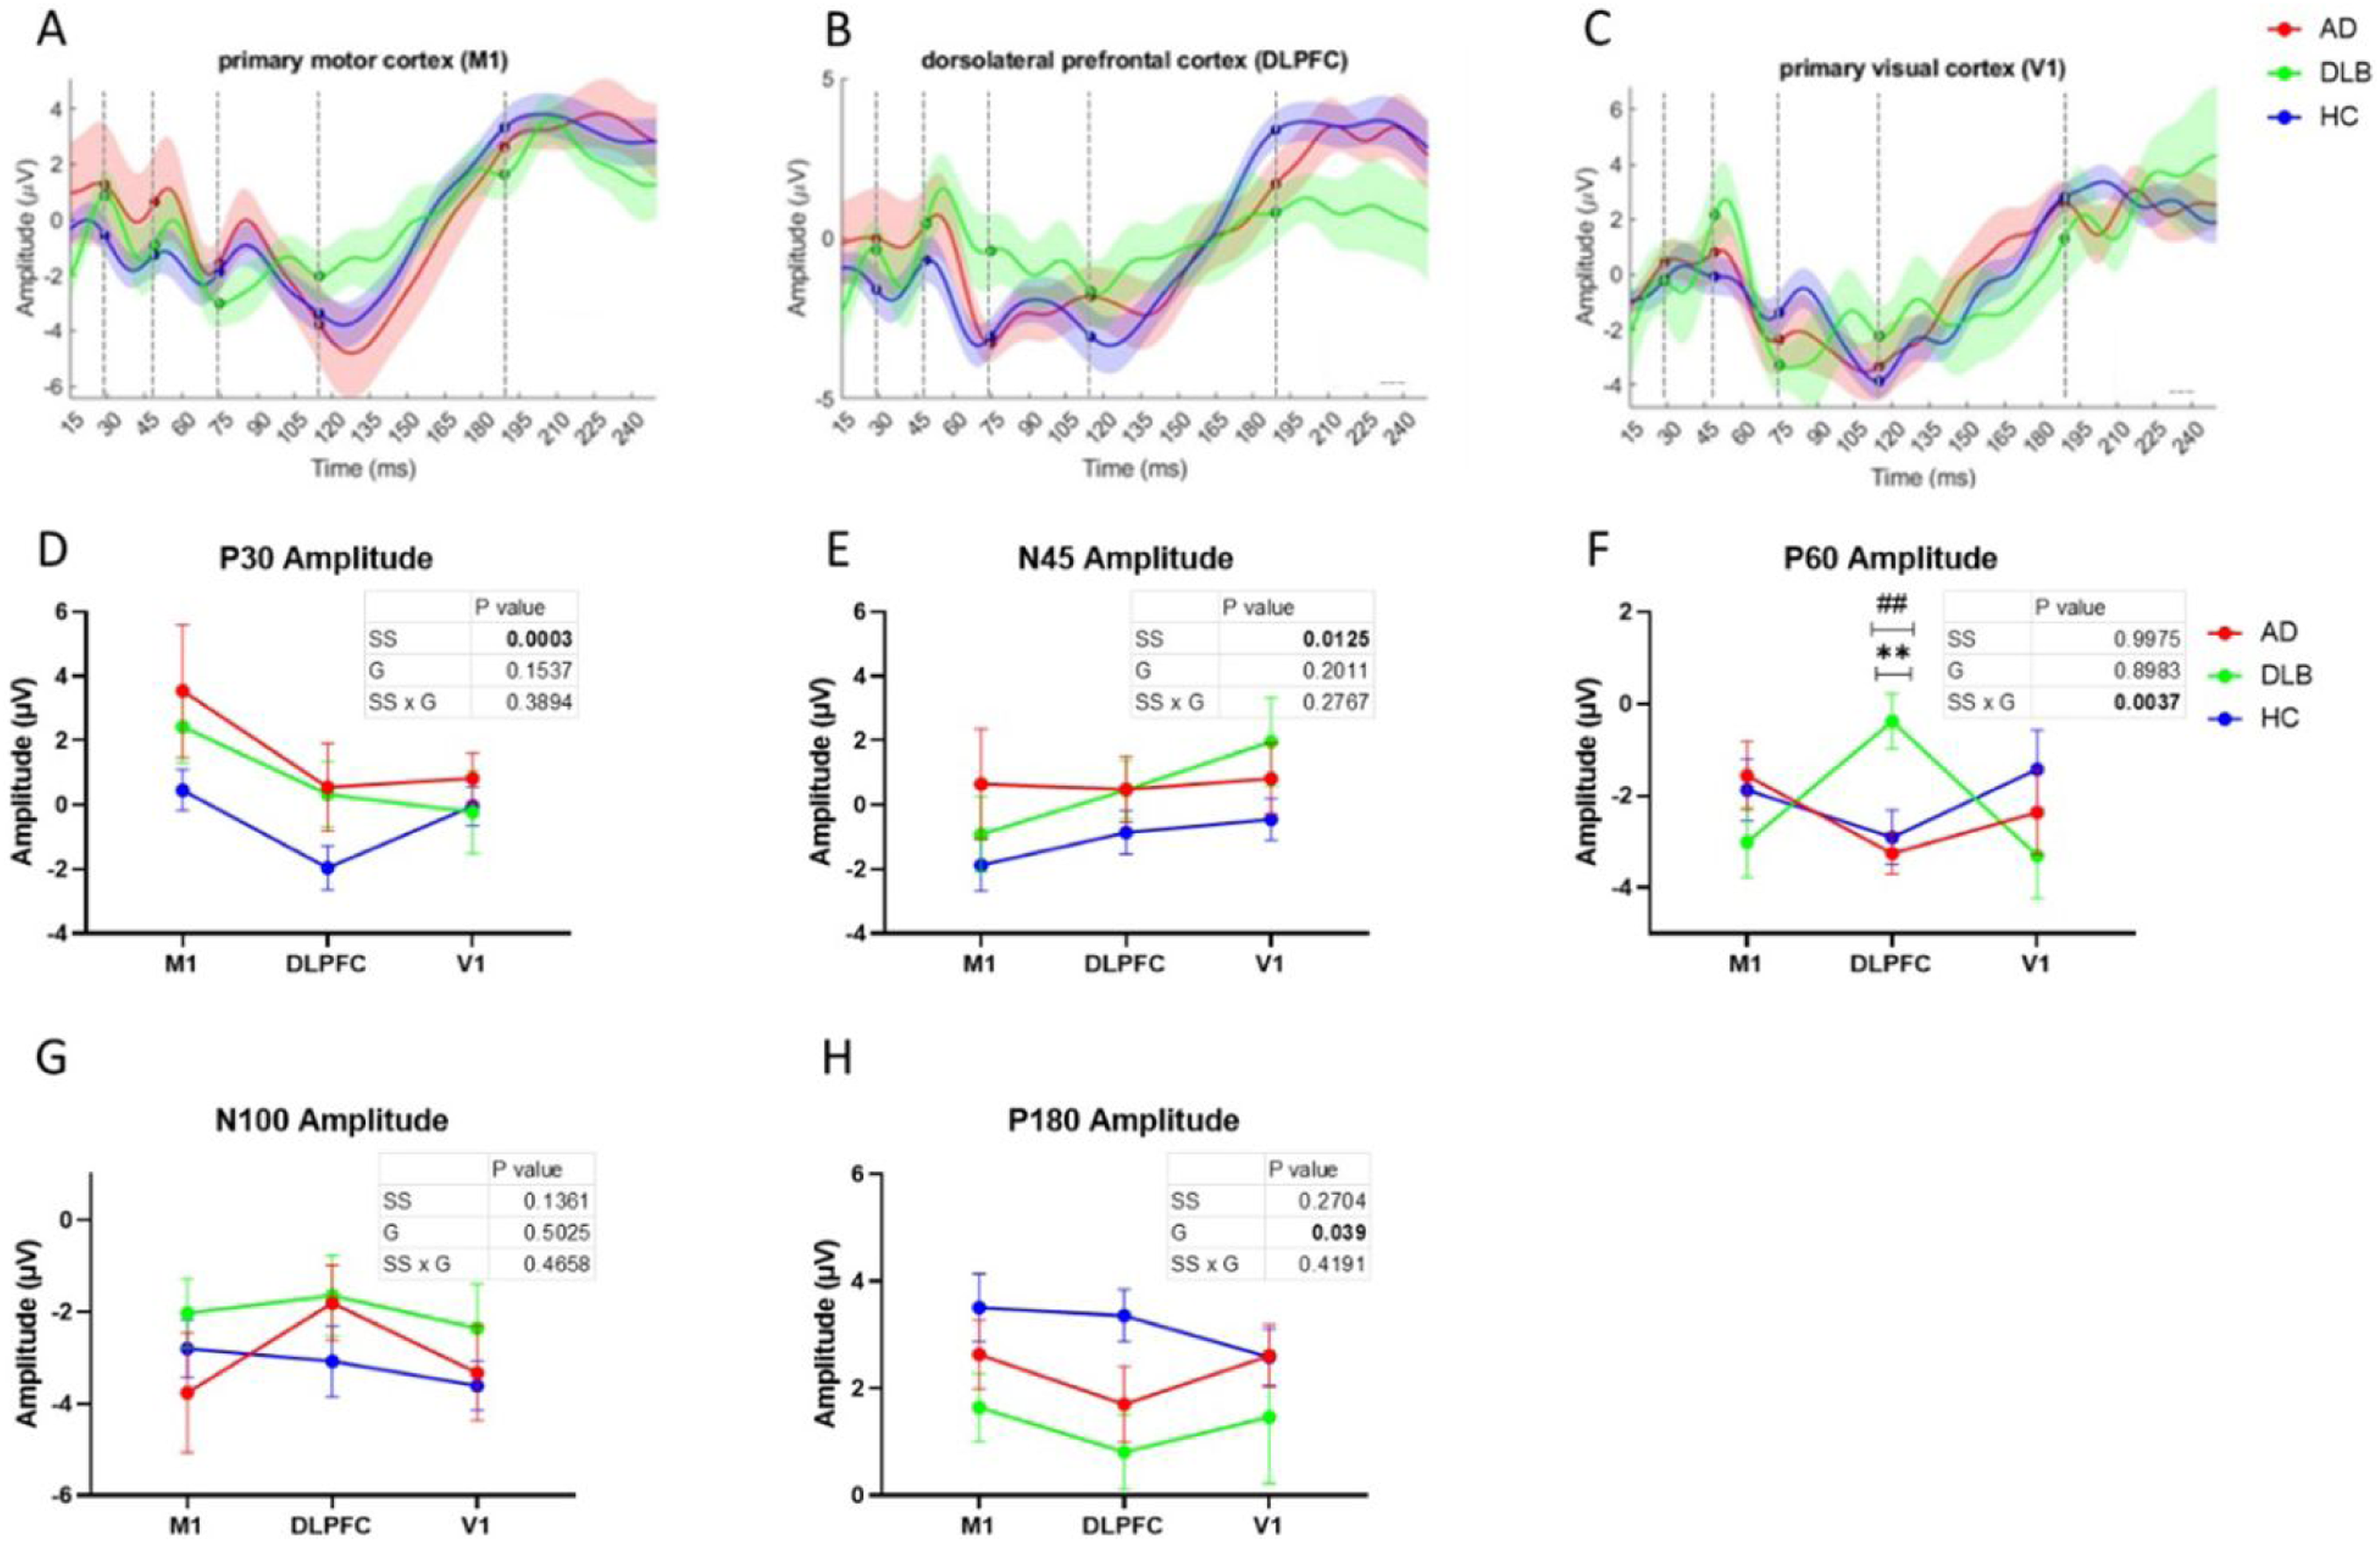
Illustration of the mean (±SE) TEP of each clinical group in response to M1, DLPFC and V1 stimulation.
Two-way ANOVA Results- Effects of Group and Stimulation Site on Delphi TEP Measures.
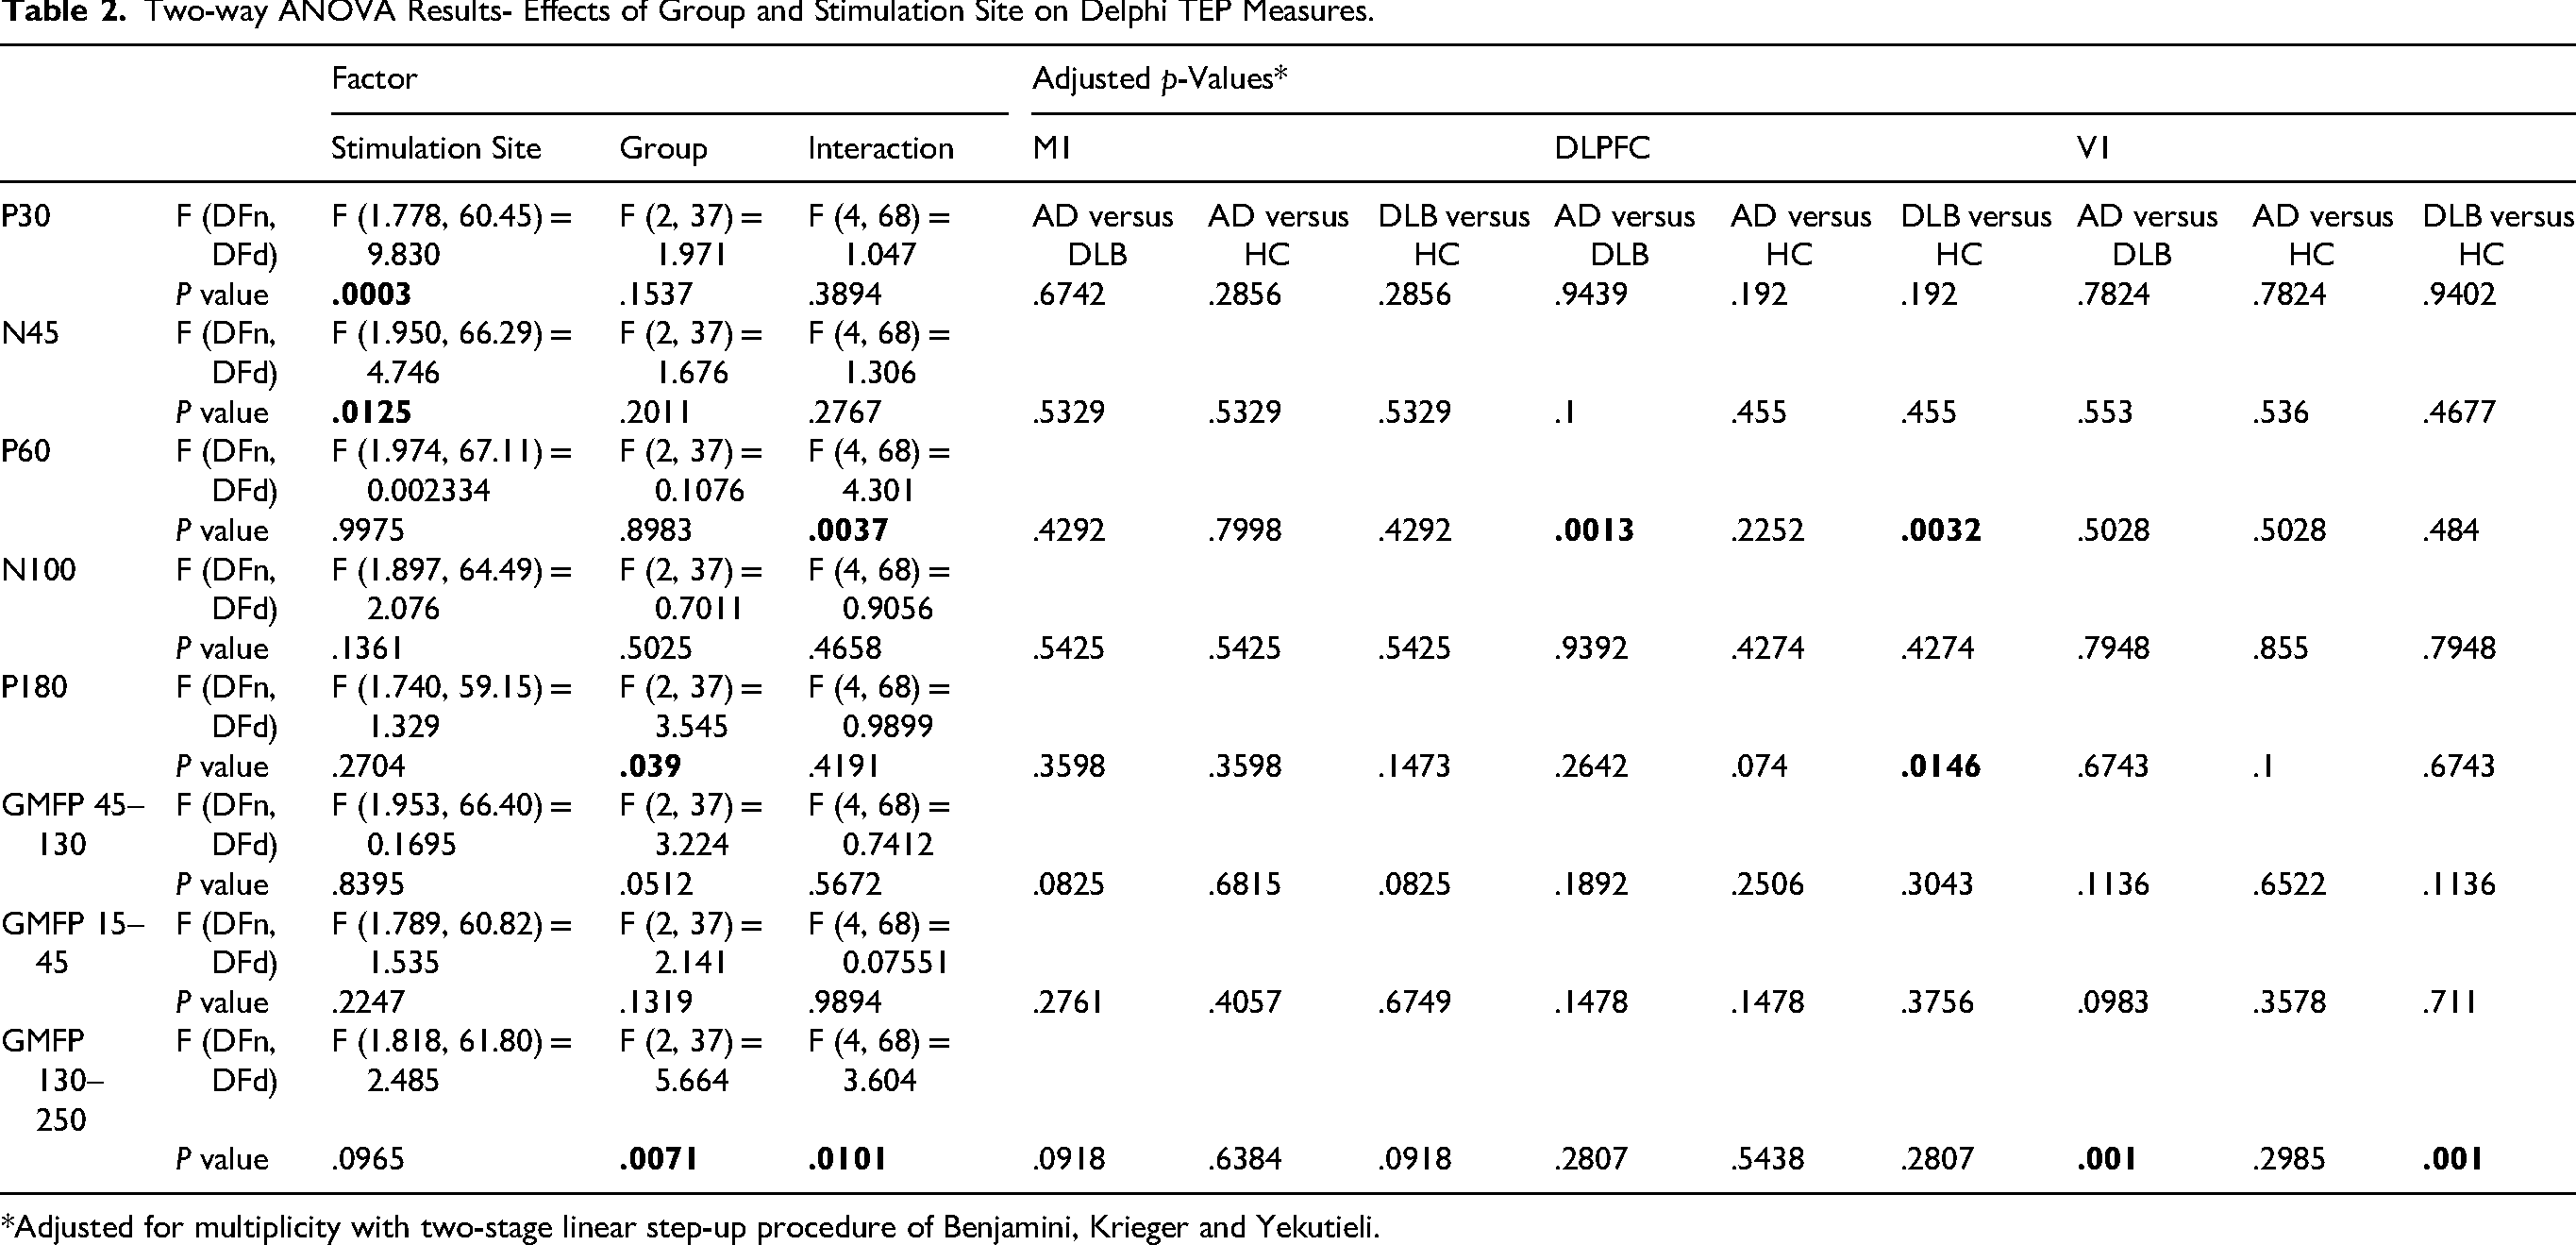
*Adjusted for multiplicity with two-stage linear step-up procedure of Benjamini, Krieger and Yekutieli.
Differences in GMFP TEP Between DLB, AD and HC in Response to M1, DLPFC, and V1 Stimulation
The late phase (130-250 ms) of GMFP demonstrated significant group effect (F (2, 37) = 5.664, p = .0071, ηp2=0.234). Non-significant stimulation site effect (p = .14) and a significant group by stimulation site interaction (F (4, 68) = 3.604, p = .0101, ηp2=0.175) were found in (Table 2). The DLB group showed higher late phase GMFP amplitude than the AD and HC groups in response to V1 stimulation (p = .001, p = .001) (Figure 2a–c and f). No significant differences were found in the early and mid-phases of GMFP amplitudes (Table 2, Figure 2a–c, d and e).
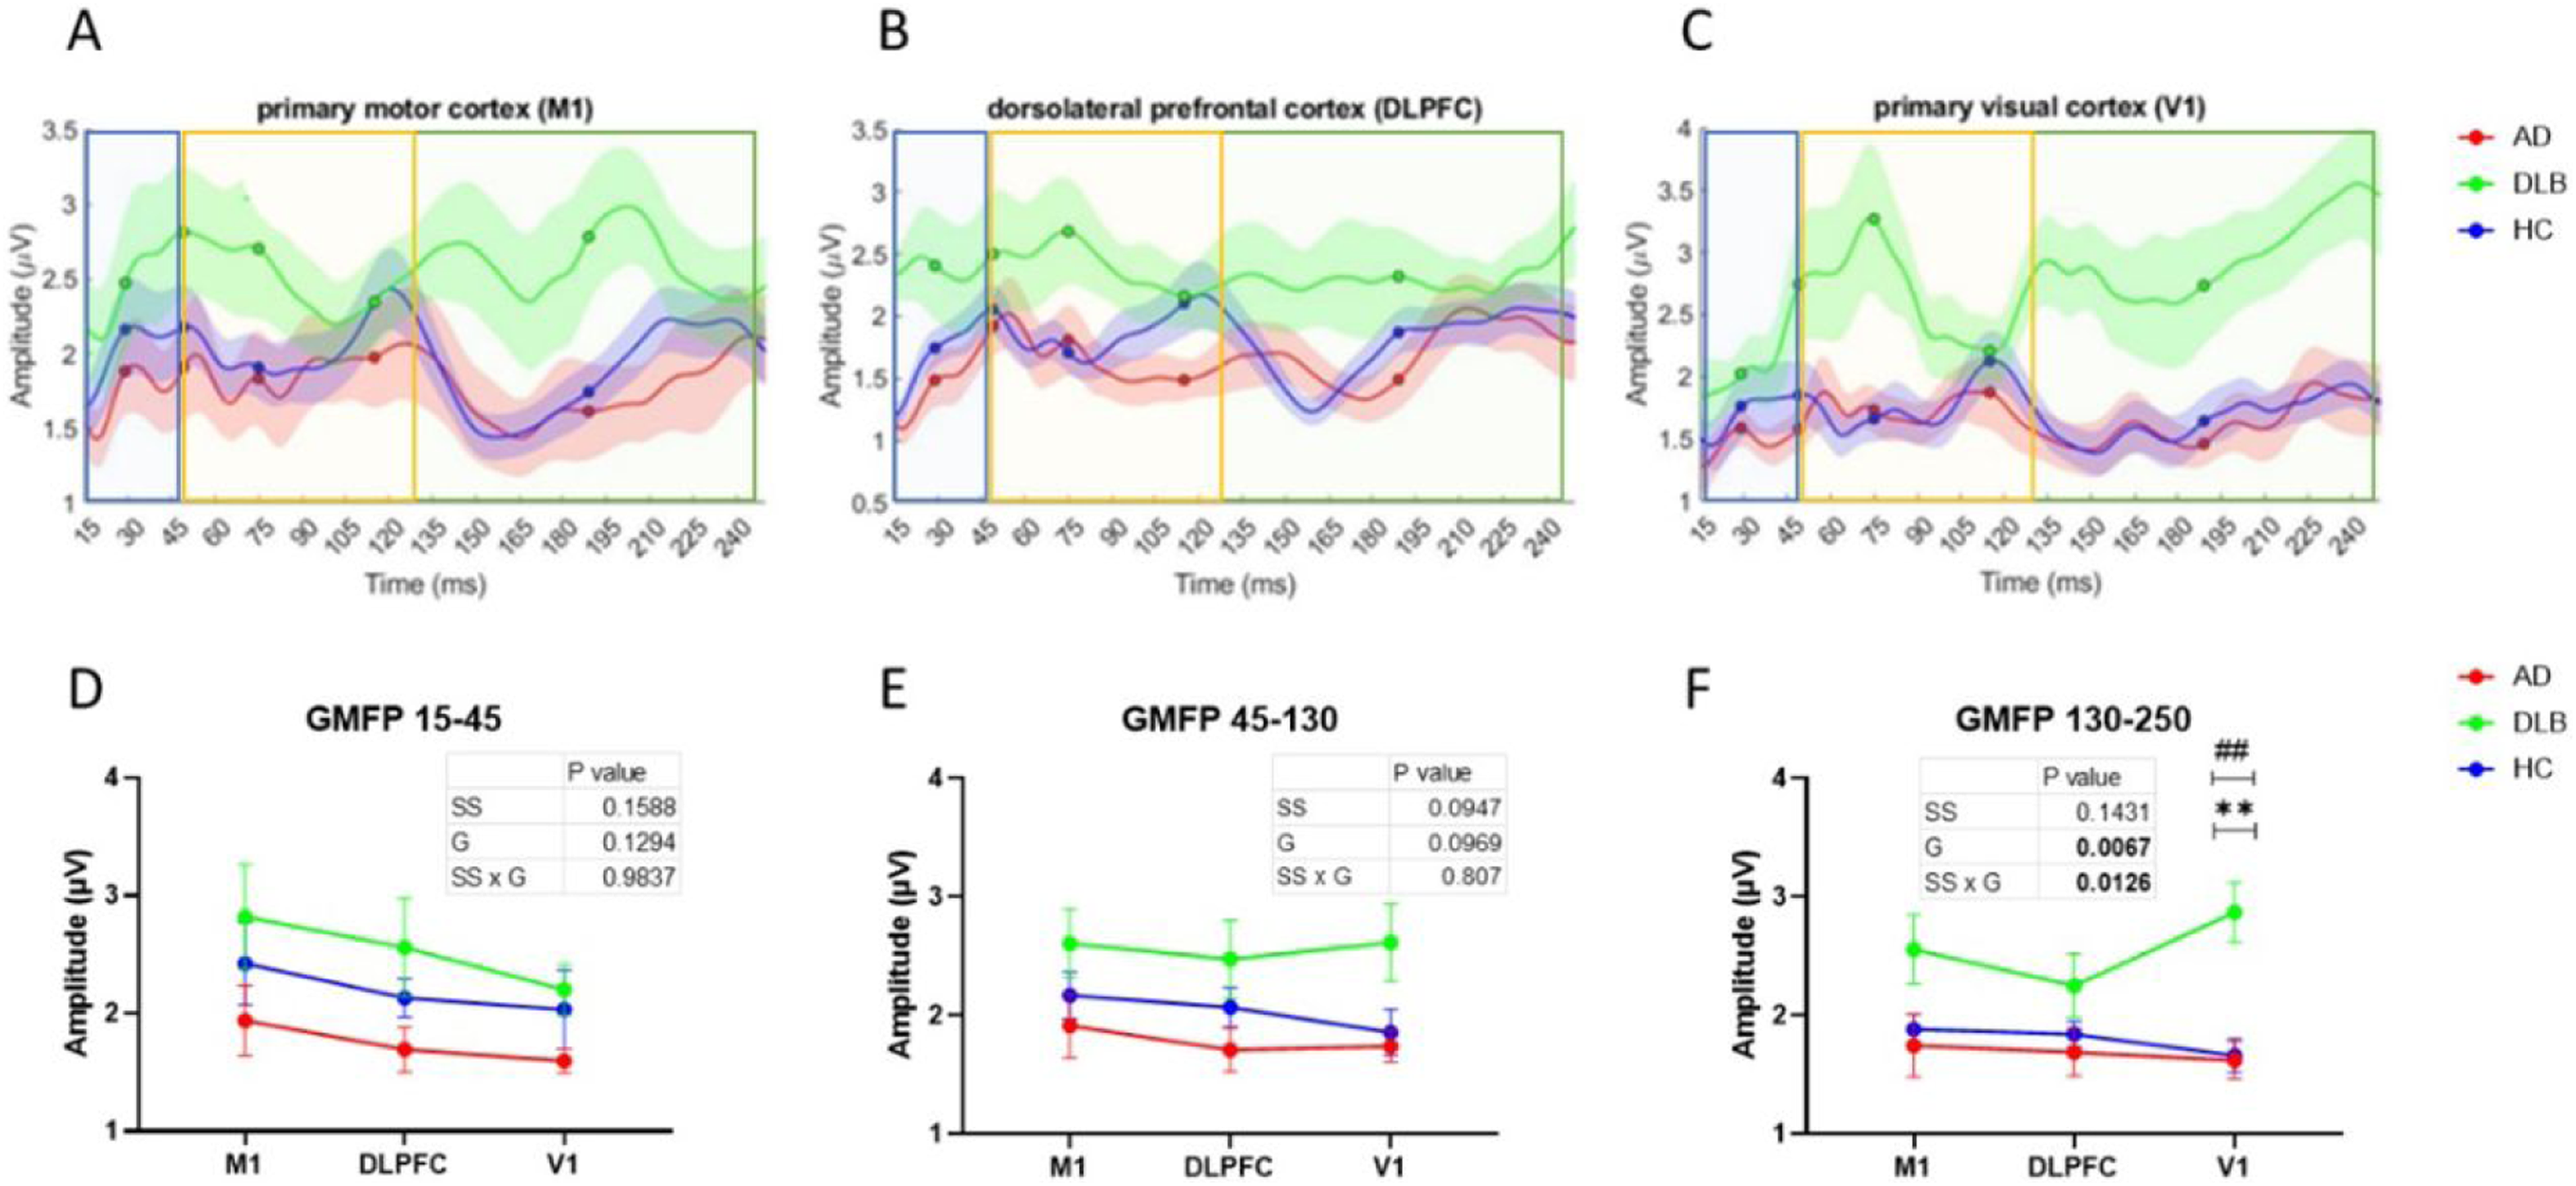
Illustration of the mean (±SE) delphi TEP GMFP of DLB, AD and HC in response to M1, DLPFC and V1 stimulation.
Correlations Between TEP Measures and Disease Symptoms
A significant positive association between the N45 DLPFC TEP amplitude and the UPDRS-III score (r = 0.9, p = .0002) was evident in the DLB group, N45 amplitude becomes less pronounced as UPDRS-III scores increase (higher disease severity) (Figure 3a). Additionally, the relative difference between left versus right DLPFC P30 was negatively correlated to MoCA score in AD patients, but not in DLB (r = −0.84, p = .002) (Figure 3b) indicating that left over right DLPFC excitability are expressed along lower MoCA scores. Other TEP features including P60, N100 and P180 did not display any significant correlations to disease symptoms following multiplicity adjustments in the AD or DLB groups.
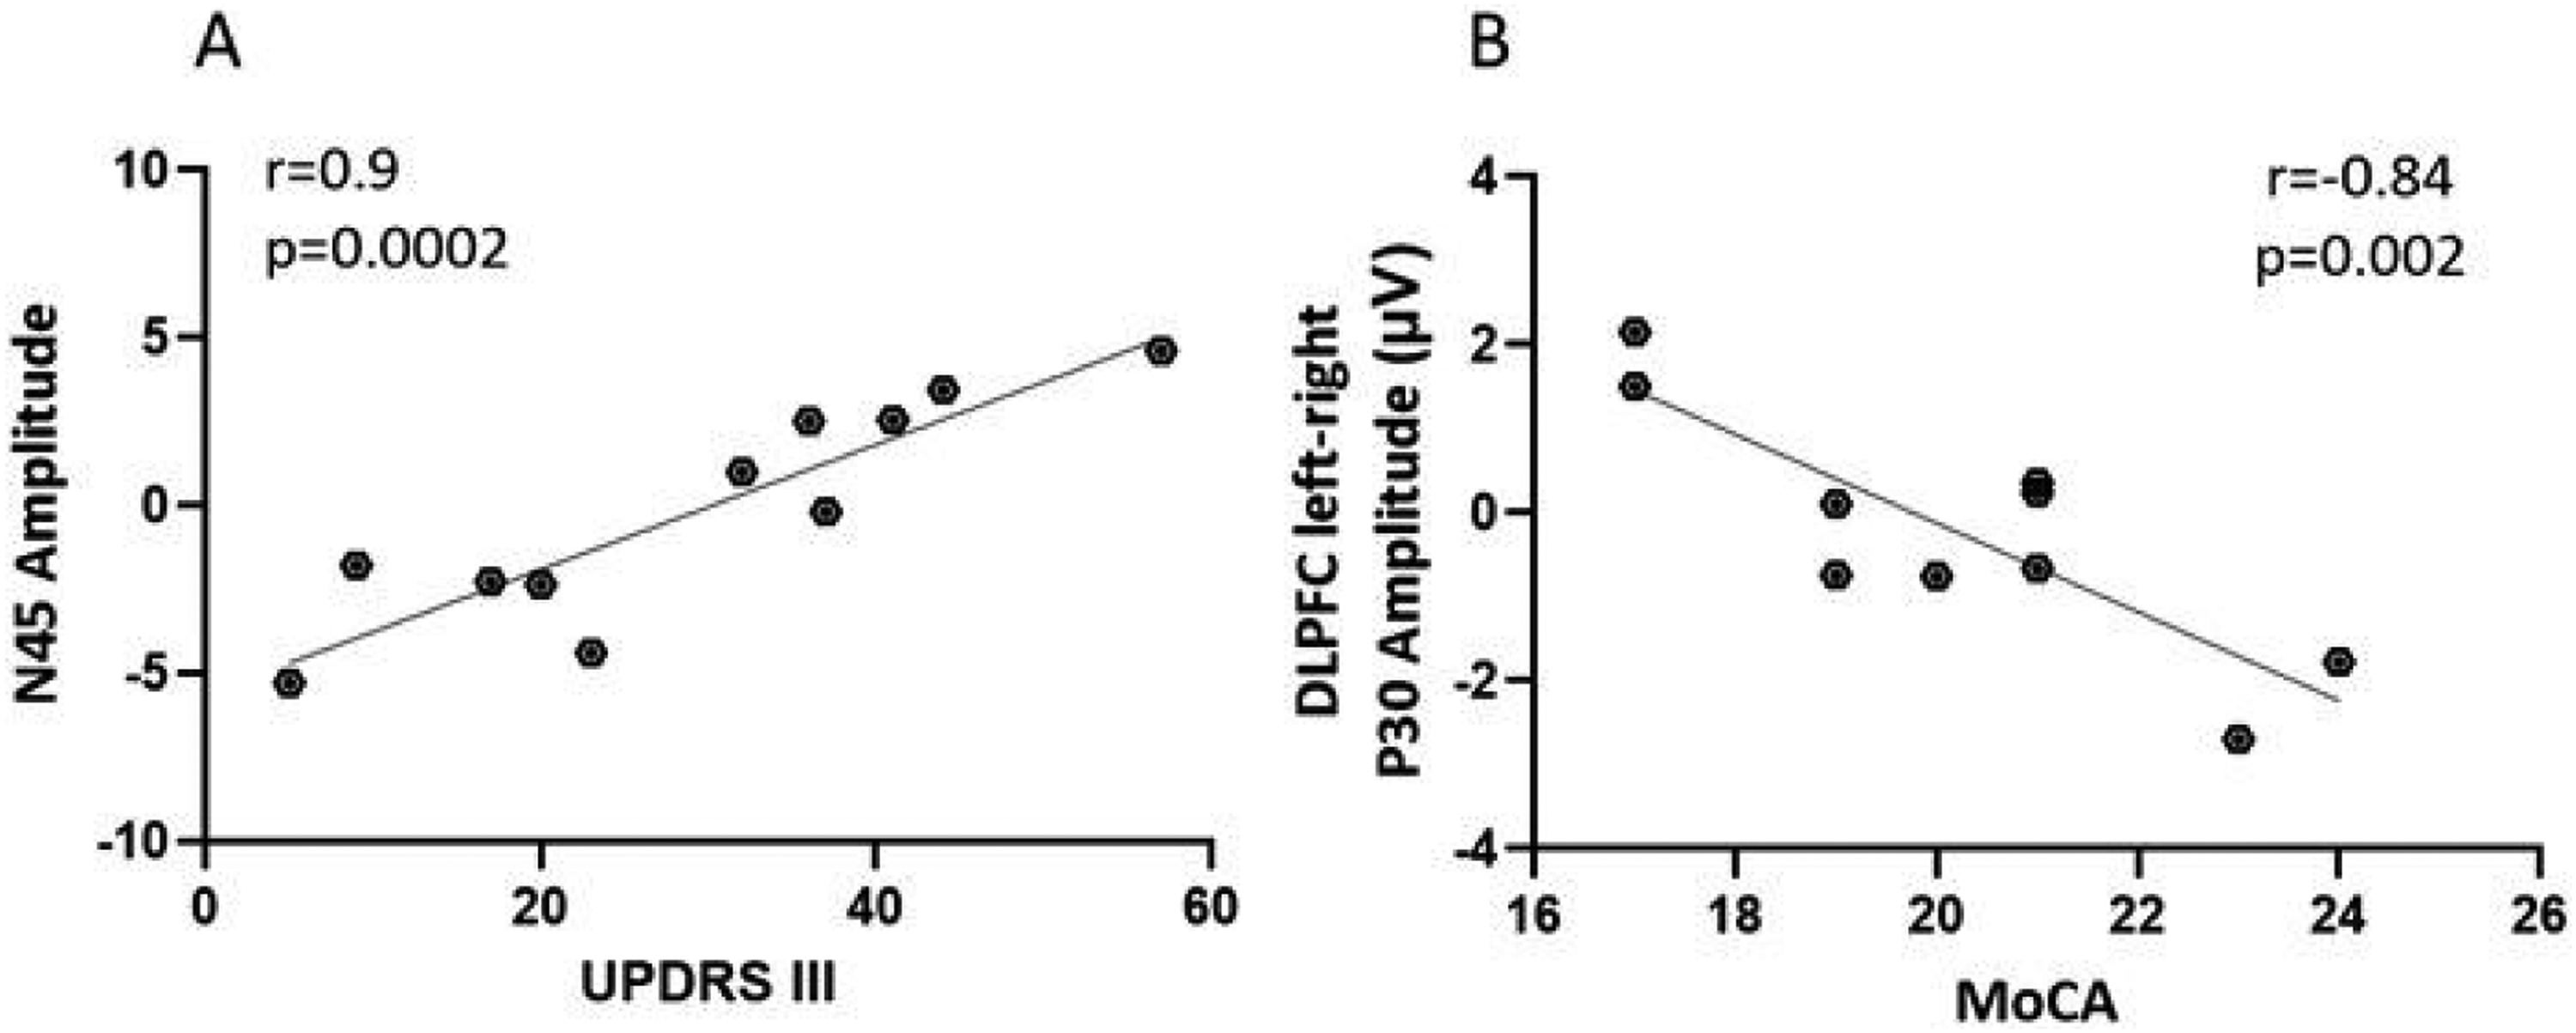
Correlation of TEP amplitudes to motoric symptoms and cognitive function.
Discussion
Our results demonstrated that DLB and AD patients have different neural responses to TMS-EEG recordings despite not differing in MoCA scores. DLB patients’ TEP response to DLPFC and V1 stimulation were significantly different from both HC and AD groups. Specifically, in the DLB group P60 amplitude was higher compared to HC and AD in response to DLPFC stimulation, and DLPFC N45 amplitude, negatively correlated to severity of motor symptoms. N45 was shown to be site specific consistent with the perception of early TEP latencies reflecting networks adjacent to stimulation site. 10 Both P60 and N45 have been shown to reflect excitation\inhibition related changes. P60 amplitude has been shown to reflect glutamatergic (interhemispheric) signal propagation mediated by AMPA receptor activation, while N45 amplitude was associated with glutamatergic, NMDA mediated transmission and GABA-A related excitation\inhibition balance.15,16,19 These results support the reports of increased excitability levels in dementia patients and specifically increased glutamatergic release due to α- synucleinopathy in DLB.40–42
An additional aspect that may contribute to the observed electrophysiological differences between DLB and AD relates to cholinergic dysfunction. DLB is known to be associated with more severe cortical cholinergic deficits than AD. 43 Cholinergic projections from the basal forebrain play an important role in modulating cortical excitability and network synchronization. 44 Therefore, the altered TMS-EEG responses observed in DLB, particularly in the prefrontal and occipital networks, may reflect the combined effects of cholinergic depletion together with glutamatergic and GABAergic imbalance. Future studies integrating TMS-EEG with cholinergic biomarkers or pharmacological probes could further clarify the contribution of cholinergic dysfunction to these network alterations.
A significant correlation was observed between DLB motor symptom severity and DLPFC TEP. The link between DLPFC and motor symptoms was also demonstrated through studies that utilized the DLPFC as interventional targets to effect motor symptoms in PD, with one reporting tDCS to the left DLPFC improved balance and functional mobility compared to sham-tDCS 45 and the other presented the effect of DLPFC r-TMS, expressed in a decrease in UPDRS-III scores. 46 Microstructural alterations of the Substantia Nigra (SN) tracts to the dorsal striatum and DLPFC were associated with SN dopaminergic degeneration and Lewy neurite pathology in DLB, 47 which are core features of the disease burden.
Additionally, a significant group effect was observed in DLPFC P180 amplitude with HC showing higher amplitude than DLB. It has been suggested that the early phase of the TEPs reflects direct connections within functional local networks while later components of TEPs (>80 ms) reveal connections with distal synaptic nodes and more complex network interactions. 10 These results support previous works using other modalities that show the dramatic changes in network connectivity in DLB patients.48–53 Studies utilizing functional-MRI (fMRI) demonstrated that the connectivity of the default mode network, frontal-parietal network, sensorimotor network related brain regions48,49 and visual network 50 of DLB were disrupted. Other studies have displayed increased connectivity within networks but decreased connectivity between networks 51 with the occipital lobe being the most functionally disconnected region. 50 Diffuse Tensor Imaging (DTI) studies in DLB patients have identified deterioration in white matter connectivity in the longitudinal fasciculus fibers which is also associated with visual hallucinations.52,53 Also, changes to the primary visual cortex in DLB indicate that reduced GABAergic transmission may contribute to recurrent complex hallucinations. 54 These results are in line with previous data showing the ability of TEP to predict white matter fibers damage 34 and changes in transmission related to inhibition/excitation balance,15,16,19 that occur in these DLB patients. A further key finding was related to the GMFP response, whereby the late phase of GMFP response to V1 stimulation was significantly increased in DLB patients compared to HC and AD groups. Interestingly, the increased amplitude of GMFP, evident in the mean GMFP (Figure 3c), displaying significant increase in late phase of response was not evident in the TEP response (Figure 1c). This implies that the increase in GMFP is caused by the increased variability between recording electrodes, indicating large difference in dispersion of signal, particularly in response to V1 stimulation in DLB, which is consistent with previous findings.
Although no significant differences in P30 amplitudes were detected between the different groups in our study, a trend of increased P30 amplitude was displayed for both DLB and AD groups in response to DLPFC and V1 stimulation. P30 was also site-specific, as was N45, consistent with the perception of early TEP latencies reflecting activation of brain regions adjacent to stimulation site. 10 Previous TMS-EEG studies emphasized changes in P30 amplitude in AD.26,27,55 It is important to note that these studies included only left DLPFC and M1 stimulations, even though it was the right DLPFC that was shown to be a useful target for improving memory performance through appliance of low frequency r-TMS in a controlled study conducted in AD. 56 Here we looked at the balance of left and right DLPFC reflected by TEP and found it to be a useful indirect measure of cognitive performance, in line with previous results, where P30 was correlated to cognitive scores in AD. 55 Our results showed that in AD, a modest cognitive decline coincides with right over left cortical excitability which shifts towards left over right DLPFC cortical excitability as cognitive performance deteriorates. It was previously established that in AD, gray matter loss rates were faster in the left hemisphere than in the right hemisphere compared to healthy ageing. 57 This finding is further supported by the decrease in motor threshold, which is known to decrease as cortical excitability increases. 58 AD patients’ TEP responses were not significantly different from those of the HC group, but they differed significantly from the DLB group. Among AD patients, the TEP response to DLPFC stimulation was significantly negatively correlated with cognitive decline. Our results did not show a significant correlation with changes in left or right P30 amplitude, but rather with their balance, indicating shifts towards left over right cortical excitability as cognitive impairment worsens. These results may shed some light on the contradicting results relating to P30 in AD patients that might be explained by a compensatory mechanism of the left DLPFC occurring in early-mid AD stages. Previous studies in early AD presented an asymmetric disruption of the connectivity of the right DLPFC along with the right Thalamus and left PCC-hippocampus. 59 In addition, our study included AD subjects in various disease stages, therefore, it is possible that changes in P30 amplitude were masked by these different stages of the disease and were only evident once the relative right to left excitability levels were calculated.
In conclusion, this study utilized TMS-EEG methodology for evaluating key hubs of interest physiology in two of the most common dementias, AD and DLB, which are often difficult to differentiate clinically, by probing the frontal, motor and occipital cortices. The use of TEP enables the direct probing of specific brain regions of interest and connectivity patterns and could provide a useful aid to improve diagnostic accuracy.
The DLPFC is involved in motor planning, organization and regulation, 60 while V1, plays a role in early visual processing and has been implicated in the complex neural mechanisms underlying visual hallucinations. 53 Reductions in DLPFC N45 and increases in DLPFC P60 or P30 may indicate changes in the excitatory/inhibitory balance of the DLPFC that could contribute to motor and cognitive symptoms in DLB and AD, respectively. These findings may have clinical relevance beyond diagnostic discrimination by supporting the development of noninvasive physiological markers that reflect network-specific dysfunction in DLB and AD. If validated longitudinally, DLPFC- and V1-derived TEP measures could help identify patients at risk for greater motor or cognitive decline, improve stratification for clinical trials, and provide objective biomarkers for monitoring target engagement and disease progression. This could ultimately affect quality of life by enabling earlier and more precise diagnosis, more appropriate symptom-oriented management, and better selection of patients for interventions aimed at specific network dysfunctions. The next step is therefore not only replication in larger cohorts, but prospective longitudinal studies testing whether these markers predict clinical trajectory, treatment response, or conversion patterns, as well as multimodal studies integrating TMS-EEG with imaging and fluid biomarkers to position these measures within disease mechanisms. In the longer term, such network-based physiological signatures may serve as enrichment or pharmacodynamic biomarkers in trials of disease-modifying or circuit-based interventions, helping to identify biologically defined subgroups and assess whether therapies normalize aberrant excitatory/inhibitory balance or network reactivity.
Limitations
Cognitive assessment relied primarily on the MoCA total score, which provides a global screening measure but does not allow detailed characterization of domain-specific cognitive deficits. Future studies incorporating comprehensive neuropsychological batteries or domain-specific MoCA analyses may further clarify relationships between electrophysiological findings and cognitive profiles in AD and DLB. As this was an exploratory study with a relatively small sample size, the findings should be interpreted cautiously and require replication in larger cohorts with more homogeneous clinical phenotypes and earlier disease stages.
Supplemental Material
sj-docx-1-eeg-10.1177_15500594261452759 - Supplemental material for Prefrontal and Occipital Network Excitability Differences in Dementia with Lewy Bodies and Alzheimer's Disease
Supplemental material, sj-docx-1-eeg-10.1177_15500594261452759 for Prefrontal and Occipital Network Excitability Differences in Dementia with Lewy Bodies and Alzheimer's Disease by Noa Bregman, Noa Zifman, Hilla Fogel, Eden Abulher, Inbal Maidan and Tamara Shiner in Clinical EEG and Neuroscience
Footnotes
Acknowledgements
The TMS and EEG devices and Delphi software analysis were loaned to the research facility by QuantalX Neuroscience, the company that manufactures Delphi.
conceptualization, methodology, project administration, data Curation, supervision, writing – original draft, visualization, and writing – review & editing.
Ethical Considerations
The study was approved by the local institutional review board (IRB) and all participants signed informed consent in accordance with Good Clinical Practice (GCP) guidelines and local regulations.
Consent to Participate
All study participants signed a written informed consent that was approved by the ethical committee, in accordance to GCP guidelines and local regulations.
Funding
The authors received no financial support for the research, authorship, and/or publication of this article.
Declaration of Conflicting Interests
The authors declared the following potential conflicts of interest with respect to the research, authorship, and/or publication of this article: QuantalX Neuroscience is the company developing Delphi software used for acquisition and analysis of the TMS-EEG data. The company loaned the medical institute the hardware and software and supported the performance of the Delphi evaluations. NZ, HF and EA are employees of QuantalX Neuroscience. Remaining authors have no disclosures or potential competing interests regarding this paper. No other funding was provided by the company for the conduct of the study. There is no other competing interest to report.
Data Availability
The data that support the findings of this study are available from the corresponding author, [author initials], upon reasonable request.
Supplemental Material
Supplemental material for this article is available online.
References
Supplementary Material
Please find the following supplemental material available below.
For Open Access articles published under a Creative Commons License, all supplemental material carries the same license as the article it is associated with.
For non-Open Access articles published, all supplemental material carries a non-exclusive license, and permission requests for re-use of supplemental material or any part of supplemental material shall be sent directly to the copyright owner as specified in the copyright notice associated with the article.