
Abstract
Background
Preschool children born preterm are at risk of developmental delay and cognitive deficits. However, the neurocognitive underpinnings of the cognitive deficits in preterm children remain unclear.
Aims
This study aimed to compare quantitative EEG (qEEG) profiles and cognitive function between preterm and full-term children aged 4 to 6 years.
Method
Children's cognitive ability was assessed using the Griffiths Development Scales-Chinese (GDS-C). Resting-state EEG was recorded, and spectrum analysis was conducted. In addition to conventional band power analysis, aperiodic components (exponent and offset) and center frequency of the dominant oscillatory peak were calculated by fitting oscillations and one-over-f (FOOOF).
Results
The study recruited 28 preterm-born children (15 girls, mean age = 62.14 months, SD = 7.31) and17 age-matched full-term children (7 girls, mean age = 59.8 months, SD = 8.49) Preterm children showed significantly elevated aperiodic offset and exponent. They also exhibited significantly slower center frequency of the dominant oscillatory peak and higher delta and theta band power compared to full-term children.
Conclusion
Preterm children demonstrated elevated aperiodic offset and exponent and slower center frequency of the dominant oscillatory peak compared to full-term children, at preschool age. These findings suggest that preschool children born preterm may exhibit less efficient functional neural connections and delayed brain maturation.
Keywords
Introduction
Despite advances in perinatal care and improved survival rates, 1 preterm births remain a significant risk factor for neurodevelopmental disabilities, especially those delivered at earlier gestation.2–4 Infants born prematurely are at high risk of neurodevelopmental disorders such as global developmental delay, 5 cognitive deficits, 6 and attention deficit hyperactivity disorder (ADHD). 7 Such neurocognitive and behavioral impairments affect executive function, learning, and academic performance, which often persist well beyond middle childhood. 8 The majority of enhanced developmental surveillance programs for preterm children advocate comprehensive developmental assessments when children are around 18-24 months old. The National Institute for Health & Care Excellence (NICE) also recommends further evaluations by multidisciplinary health professionals in preterm children at the uncorrected age of 4. 9 However, there are no further evaluations by healthcare professionals after the age of 4. The period between ages 4 and 7 is a critical period, in which children further improve their cognitive development, and their logic and reasoning changes from symbolic thought to intuitive thought. This is represented by a greater dependence on deductive thinking rather than primitive thinking. 10 Previous study found that preterm children had poorer cognitive outcomes compared with their term peers at preschool age. 11 However, the underlying neurological mechanism of this gap is not clear.
Few studies have investigated the neural electrophysiological differences between preterm and term children beyond the neonatal period. In adolescents, Rommel et al 12 found that preterm adolescents had increased low-frequency EEG spectral power (delta power) during the eyes closed condition compared to term adolescents. 12 Additionally, Twihaar et al 13 found that preterm adolescents showed decreased high-frequency EEG spectral power (beta power) compared to age-matched term children. 13 In young school-aged children, Rozhkova 14 reported preterm children had increased low-frequency activities, 14 whereas Poorun et al 15 found preterm children had decreased high-frequency activities under anesthesia. 15 The majority of the studies showed there were distinct differences in the qEEG profiles between preterm and full-term school-aged children or adolescents. Specifically, qEEG profiles of preterm children were characterized by elevated slow frequency activities (delta and theta band power) and attenuated high-frequency activities (alpha and beta band power).
Recent advances in EEG time-frequency signal processing have suggested that the canonical frequency band analysis might not show the full picture of the neural activities reflected in electrophysiological recordings. 16 It is argued that the conventional method of calculating the average power of a given frequency band (absolute power) does not consider the impact of the background aperiodic component of human neural electrophysiological signals, resulting in confounding information.16,17 This is also the case for secondary neural metrics based on absolute power, such as the ratio of power between two frequency bands or the relative power (ie, the ratio of power in one frequency band divided by the total absolute power), commonly interpreted as the relative strength of periodic oscillation. The aperiodic component shows a 1/f-like shape in the signal's power spectrum, ie, the power of a frequency band is inversely proportional to its frequency. Because of overlapping, the aperiodic component becomes entangled with the periodic oscillation pattern in canonical frequency band analysis, leading to misinterpretation of the electrophysiological neural activity in different frequency bands. For example, the theta/beta ratio, a commonly suggested biomarker for the attentional process,18–21 would show a greater effect from the aperiodic non-oscillatory component than the hypothesized periodic oscillatory component. Furthermore, a growing body of evidence suggest that the 1/f-like aperiodic component is not background noise, but actually reflects fundamental brain functions. For instance, 1/f-like brain activity was found to be correlated with cognitive processing 22 and age-related changes in the aperiodic component in adults 23 and children. 24 Moreover, previous research suggests that the aperiodic and periodic components of spontaneous brain activities reflect distinct aspects of cognitive functions, 25 and the 1/f-like brain dynamics might be associated with neuroplasticity moderated by neuromodulator systems. 26 Taken together, it is imperative to separate the aperiodic and periodic components in electrophysiological signals to more accurately dissect brain activities and their functional roles.
The goal of the current study was to use new analytical EEG methods to compare both aperiodic components and periodic dominant oscillations in the qEEG profiles in preschool children aged 4-6 years born preterm and full-term. This study also aimed to characterize the associations between cognitive ability and qEEG parameters between preterm and full-term children.
Methods
Participants
Participants were recruited from the preterm database at local clinics, which contains data on over 700 children born at ≤33 weeks with very low birth weight <1.5 kg who visited local clinics between 2008 and 2020. All of them received complete comprehensive developmental assessment using the GDS-C at 18-24 months. Inclusion criteria included children born preterm aged between 4 and 6 years with their first assessment showing normal development. Age-matched healthy control subjects were recruited from the community. The exclusion criteria included neurological symptoms or diseases, neurodevelopmental disorders (eg, ADHD, ASD); psychiatric disorders, diagnosis of cerebral palsy; history of structural brain abnormalities on CT/ MRI or grade III or IV IVH on either side of the brain; genetic/ syndromal disorders; or history of seizure or electroencephalogram abnormalities related to epilepsy and intellectual disability.
Parents of the participating children were invited to fill in a questionnaire to report their basic demographic details, their children's emotional, behavioral, ADHD symptoms and psychosocial well-being. Children were given a developmental assessment and an EEG.
Questionnaires and Assessments
EEG Experimental Procedures
Single-channel EEG was used to assess the qEEG profiles of participants. We used three gold cup surface electrodes (Cz, A1 and A2), which were positioned on the scalp according to the international 10-20 system. The Cz electrode was placed at the midpoint between the nasion and inion, whereas A1 and A2 reference electrodes were attached on the mastoid region, the bony prominence behind the ears. The electroactivity of Cz was referenced to the average electroactivity of A1 and A2 at a sampling rate of 256 sample per second. The impedance of each EEG channel was checked and kept below 10 kΩ.
The resting-state EEG was recorded in all participants, which included two parts lasting 2.5 min each. As young preschool children likely cannot stay in a resting state with their eyes open without any focus, we used a silent cartoon movie to help children relax and stay in their seat. In the eyes open (EO) condition, participants were asked to watch a silent cartoon movie for 2.5 min. In the eyes closed (EC) condition, participants were asked to close their eyes for 2.5 min. We observed a greater variation of EEG spectrum in the EO condition, therefore we focused on the EEG results from the EC condition.
Children's movement were monitored during the experiment and manually marked in the EEG recording. The whole EEG session was recorded using Natus NeuroWorks hardware and software (Natus Medical Inc, Oakville, Canada).
EEG Data Processing
All offline EEG data processing was performed in MATLAB EEGLAB 33 using custom scripts. The data were first filtered offline through a 1-40 Hz band pass filter. The Cz channel readings were referenced to the average A1 and A2 readings. Both A1 and A2 were also cross-referenced. Any EEG segments containing artifacts were rejected based on any movement events during the experiment and by visually inspecting the data. The power spectrum density was estimated using Welch's method 34 on artifact-free continuous EEG data from both EO and EC conditions. The power spectrum was generated in the 1-30 Hz frequency range, using Fast Fourier transform (FFT) for each 500-ms segment with 50% overlap between adjacent segments.
Conventional Canonical Frequency Band Analysis
The absolute band power (μV2/Hz) was calculated by averaging the power spectrum in the following frequency bands: delta (1-3 Hz), theta (4-7 Hz), alpha (8 −12 Hz), beta1 (13-18 Hz), beta2 (19-21 Hz), and beta3 (22-30 Hz). The relative band power was calculated using the total band power in each frequency band divided by the total band power in the 1-30 Hz range.
Aperiodic Component Modeling
We used Fitting oscillations and one-over-f (FOOOF), an open-source python-based spectrum fitting algorithm, to parameterize the brain power spectrum to separate narrowband oscillation peaks and the 1/f-like aperiodic component. FOOOF was used to fit the parametric curve to the EEG spectrum, modeled as the summation of the Gaussian functions (for the narrowband peaks) and linear line(s) in the log-log space. This generated offset (intercept) and exponent (slope) parameters of the 1/f component, which can automatically be detected as oscillations peaks based on the model fitting. To avoid overfitting, we restricted the maximum number of peaks to three, in which the peak with maximum power was selected as the dominant peak. During preschool years, children go through an age-related shift in their dominant oscillations, 24 transitioning from the theta to the alpha frequency band. To account for this change, the analysis considered dominant oscillations within the frequency range of 4 to 12 Hz. We applied the fitting to each individual power spectrum estimated in both the EC and EO condition, separately. The FOOOF toolbox is available on https://github.com/fooof-tools/fooof.
Statistical Analysis
Independent T-test was used to compare the developmental sub-quotient scores, parental-reported scores (SDQ, PedsQL, SWAN), and qEEG profiles (absolute and relative band power, aperiodic parameters—exponent and offset) between preterm and term children. To control for potential confounding variables, a linear model was used for between group comparisons, with the group (preterm vs term) inputted as the fixed factor, and children's age, sex and parents’ SES inputted as the covariates. Multiple comparisons in the exploratory analyses were adjusted for using the false discovery rate (FDR) procedure (Benjamini–Hochberg), with FDR-adjusted P values (q values) reported
Correlational analysis was performed between 1) children's sub-quotient scores for performance and practical reasoning and aperiodic EEG parameters (exponent and offset); and 2) children's sub-quotient scores for performance and practical reasoning and absolute/relative EEG band power. The correlations between the focal variables and other measurements were also explored, and partial correlation was used to adjust for age, sex, and SES.
Statistical analysis was conducted using SPSS 28.0 (IBM, New York, USA) and R 4.1. 35 Some illustrations were plotted using MATLAB (MathWorks, MA, USA). For all statistical comparisons, a P-value < .05 was considered statistically significant. The statistical code, EEG processing code, and anonymous data are available upon request from the corresponding author.
Results
Participant Characteristics
A total of 40 preterm children aged 4-6 years at the time of the recruitment were invited to join the study, of which four declined to join or could not be reached. The remaining 36 eligible children completed the assessments. After the assessments, two children had autistic features, one had ADHD features, one had abnormal brain MRI, and one exhibited intellectual disability, and three children had excessive noise on the EEG data, and were excluded from the analysis. A total of 20 term children participated in the study and completed the assessments. Two had autistic features/ADHD features and one had excessive noise on the EEG data, and were excluded from the analysis. Overall, 28 preterm children and 17 term children were included in the final analyses. The mean age of preterm children at the time of the study was 62.14 (SD = 7.31) months and the mean age of term children was 59.8 (SD = 8.49) months. The demographic variables of the included participants are shown in Table 1. Preterm children and term children showed no significant differences in gender, age, family SES index, parent-rated SDQ, PedsQL, and SWAN scores. Preterm children had lower GSD-C E sub-quotient score (mean = 97.93, SD =26.02) and GSD-C F sub-quotient score (mean =102.28, SD =11.68) compared to term children (GSD-C E mean =114.64, SD =33.01; GSD-C F, mean =110.29, SD =16.29). However, the differences in the GSD-C sub-scores between preterm and full-term children did not reach statistical significance.
Comparison of Demographics and Developmental Variables Between Preterm and Full-Term Children.
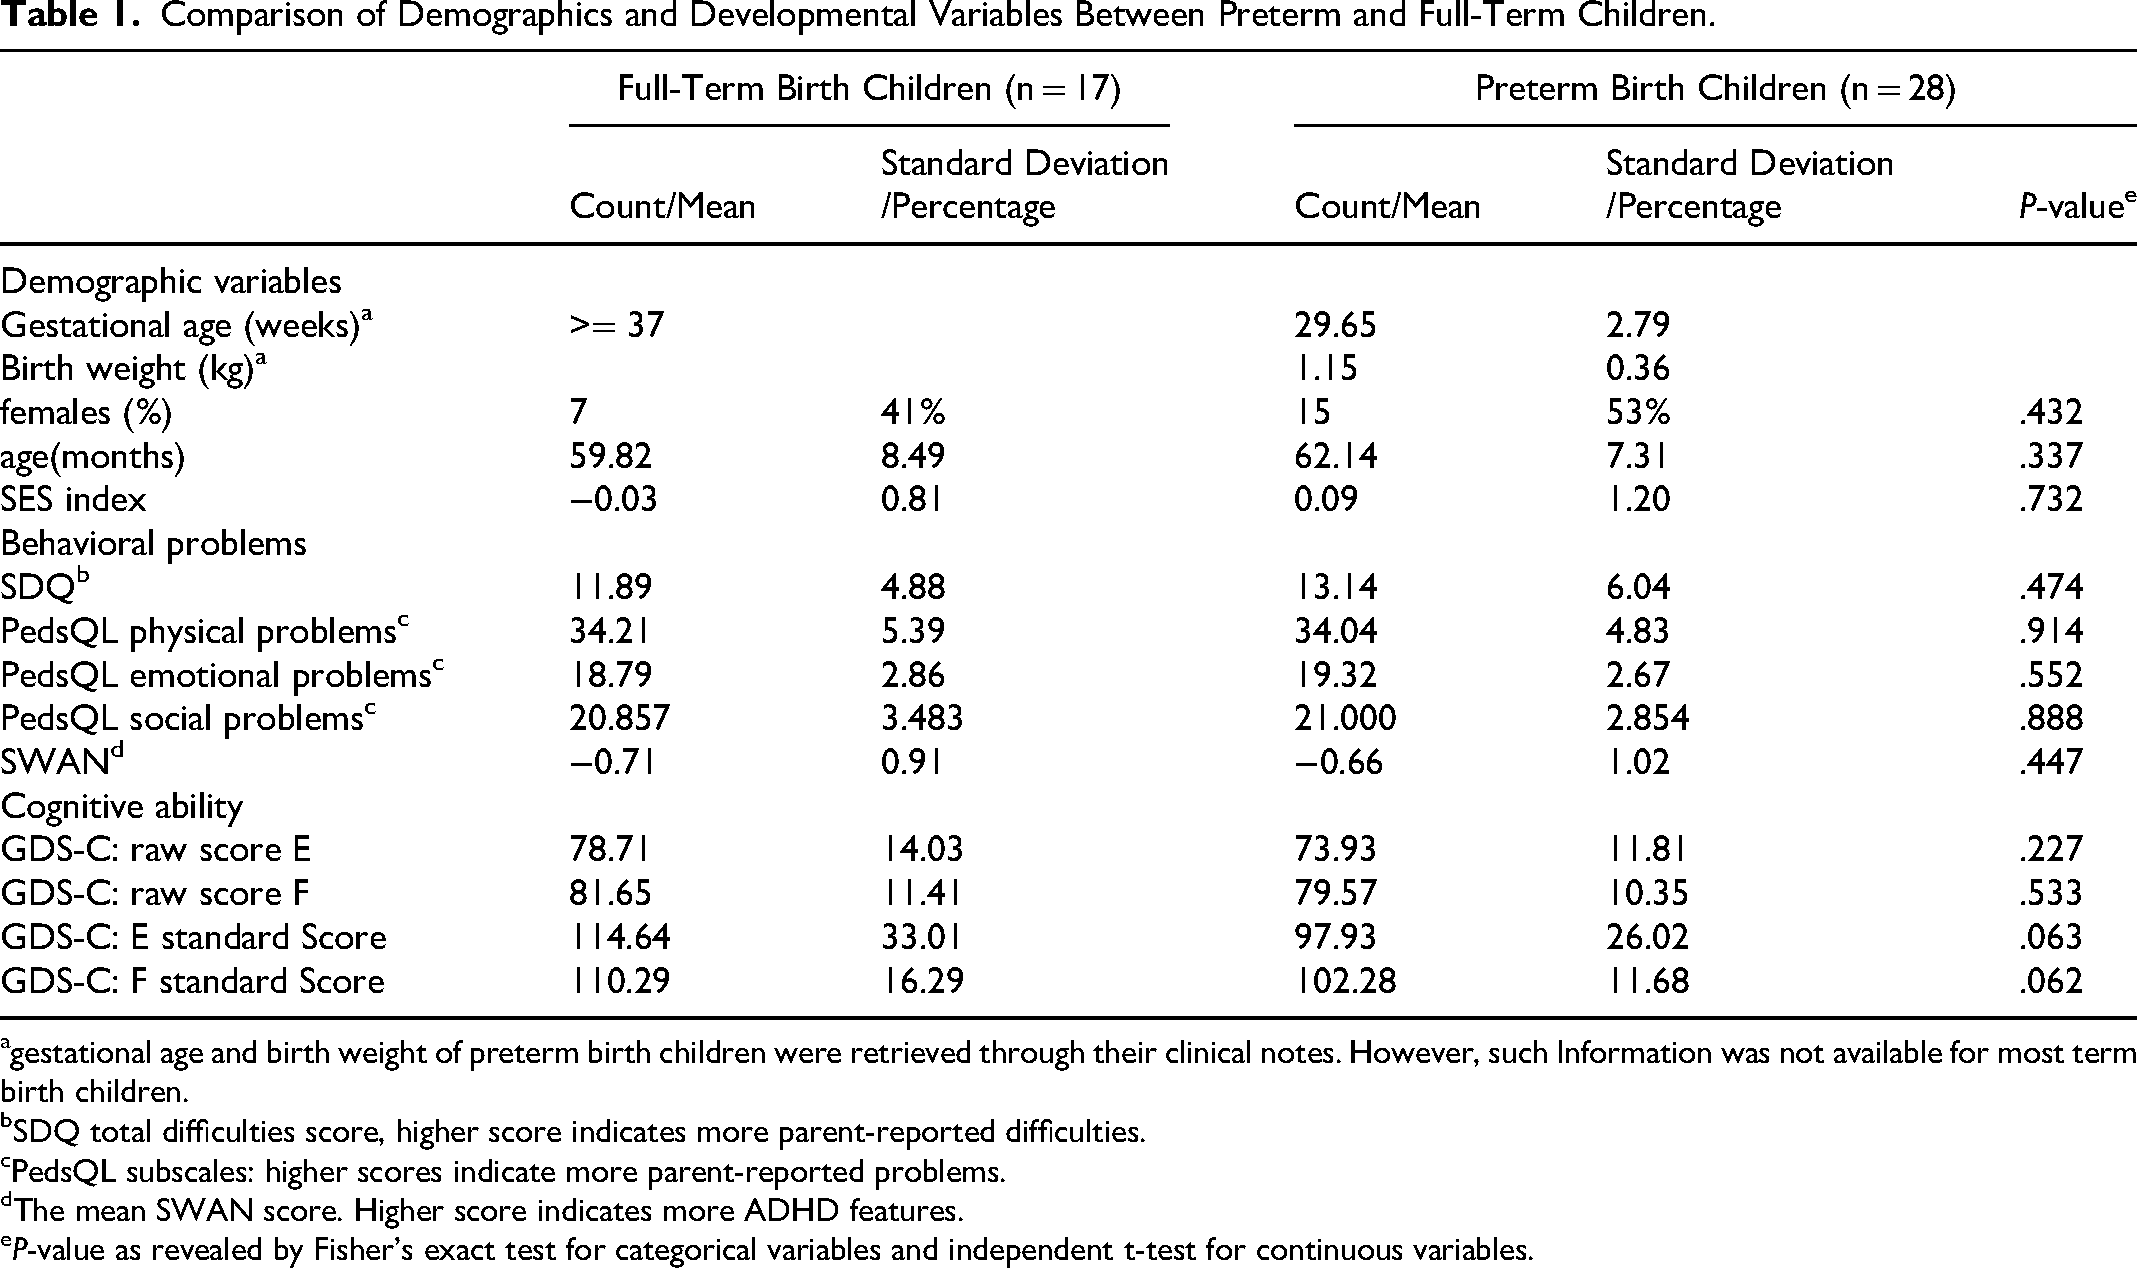
gestational age and birth weight of preterm birth children were retrieved through their clinical notes. However, such Information was not available for most term birth children.
SDQ total difficulties score, higher score indicates more parent-reported difficulties.
PedsQL subscales: higher scores indicate more parent-reported problems.
The mean SWAN score. Higher score indicates more ADHD features.
P-value as revealed by Fisher's exact test for categorical variables and independent t-test for continuous variables.
qEEG Profile
Periodic Parameters
We calculated each participant's periodic center frequency of the dominant oscillatory peak using the 1/f model, as seen in Figure 1a-c. The dominant oscillation range was defined as 4-12 Hz in the resting-state for pre-school children,24,36 and the peak selected for the maximum power and band width was within 3 Hz of the peaks modeled by the FOOOF algorithm. The result indicated that preterm children had significantly slower resting-state center frequency of the dominant oscillatory peak compared to term children (Cohen's d = -0.80 (−1.43–-0.18), P = .005, q = .009; Figure 1d, Table 2). Notably, the center frequency in the theta range (4-7 Hz) was observed in 2 out of 17 full-term children (11.7%), in contrast to 9 out of 28 preterm-born children (32.1%). The center frequency of the dominant oscillatory peak in each participant significantly correlated with their developmental assessment results in both performance score (GDS-C E: r = 0.32, P = 0.030, q = 0.045) and practical reasoning ability (GDS-C F: r = 0.42, P = 0.005, q = 0.007), see Figure 1e-f. These correlations did not differ in each subgroup (preterm children vs term children). For correlations in each subgroup, see Table S1 and S2.
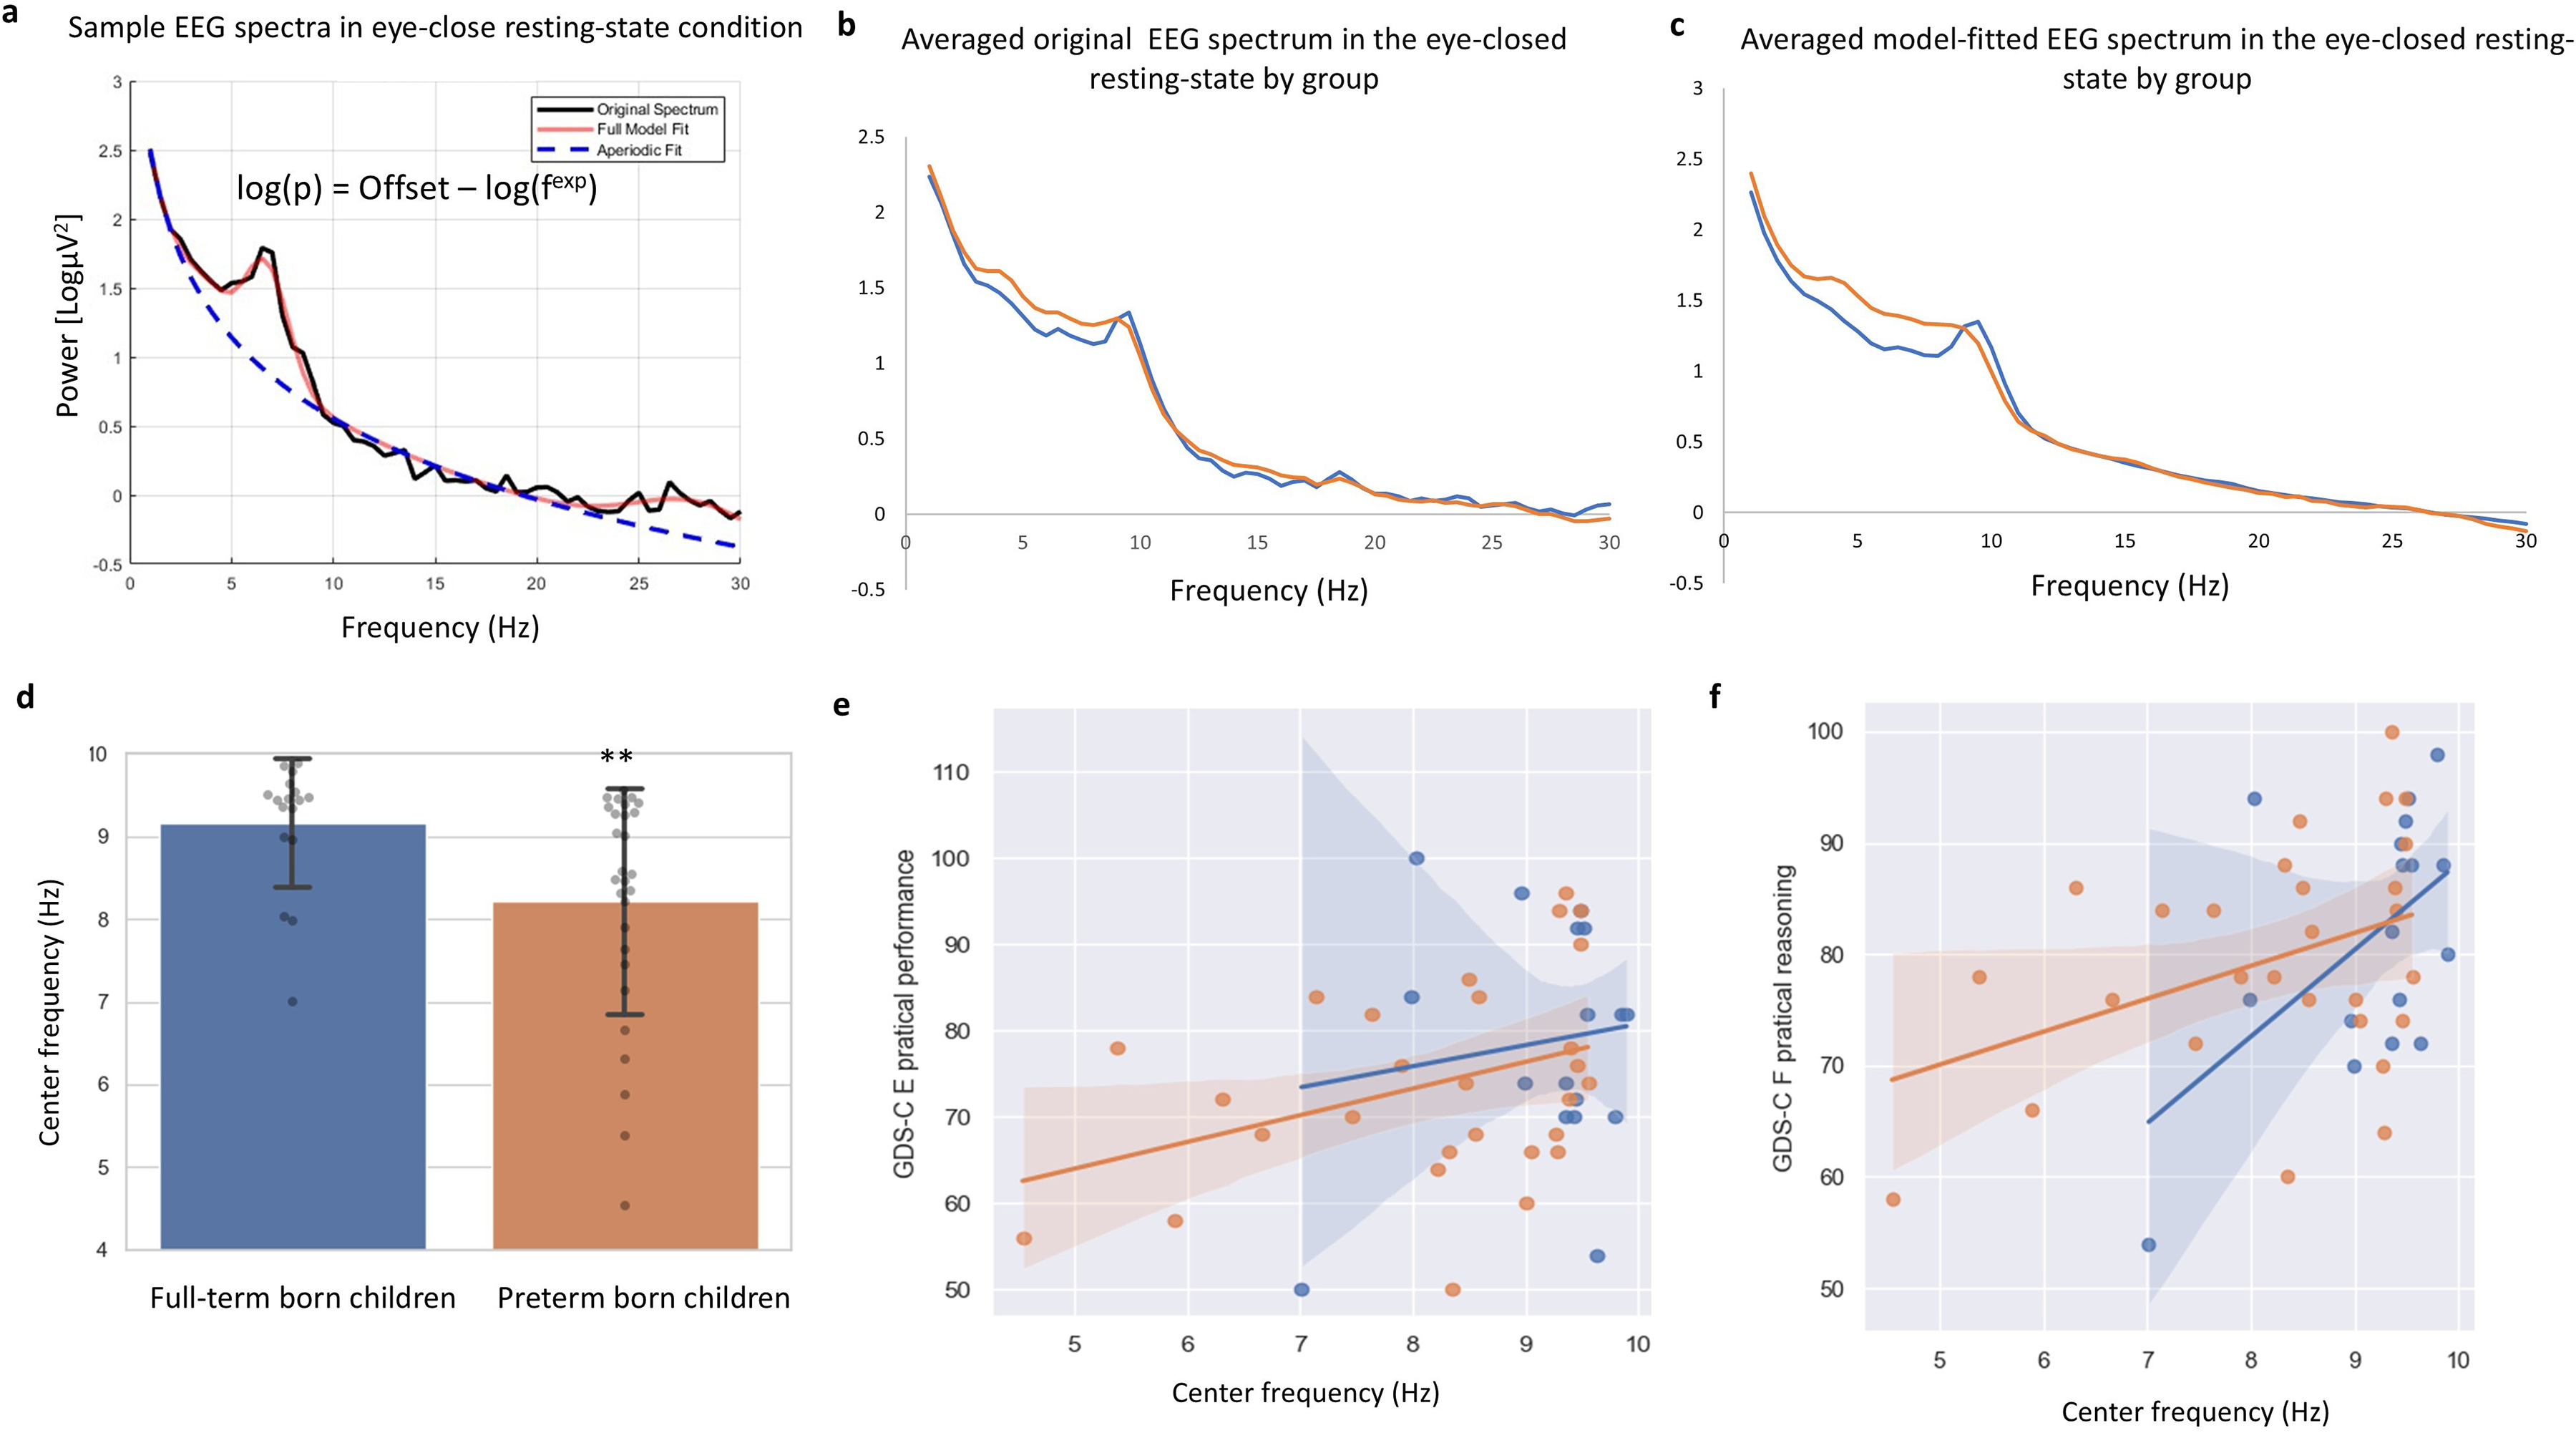
1/f (aperiodic) modelling of EEG spectra in preschool children and group differences in the center frequency of the dominant oscillatory peak between preterm and full-term children. (a) Example 1/f (aperiodic) modelling of the resting-state EEG spectrum from one participant in the eyes-closed (EC) condition. Black line: original EEG power spectrum; orange line: full model fit; blue dashed line: aperiodic fit. The aperiodic component is defined as log(P) = Offset - log(f^exp), where P denotes power, f frequency, and exp exponent. (b) Group-averaged original EEG power spectra in the EC condition for children born preterm (orange) and full term (blue). (c) Group-averaged model-fitted EEG power spectra in the EC condition for children born preterm (orange) and full term (blue). (d) Group comparison of the center frequency (CF) of the dominant oscillatory peak between full-term and preterm children; error bars indicate standard deviations; P < .01. (e–f) GDS-C E and F raw scores as a function of the center frequency (CF) of the dominant oscillatory peak in preterm (orange points/line) and full-term (blue points/line) children; shaded bands indicate 95% confidence intervals.
Comparison of EEG Aperiodic Parameters and Frequency Band Power in Preterm and Full-Term Children in the Eyes Closed Condition.
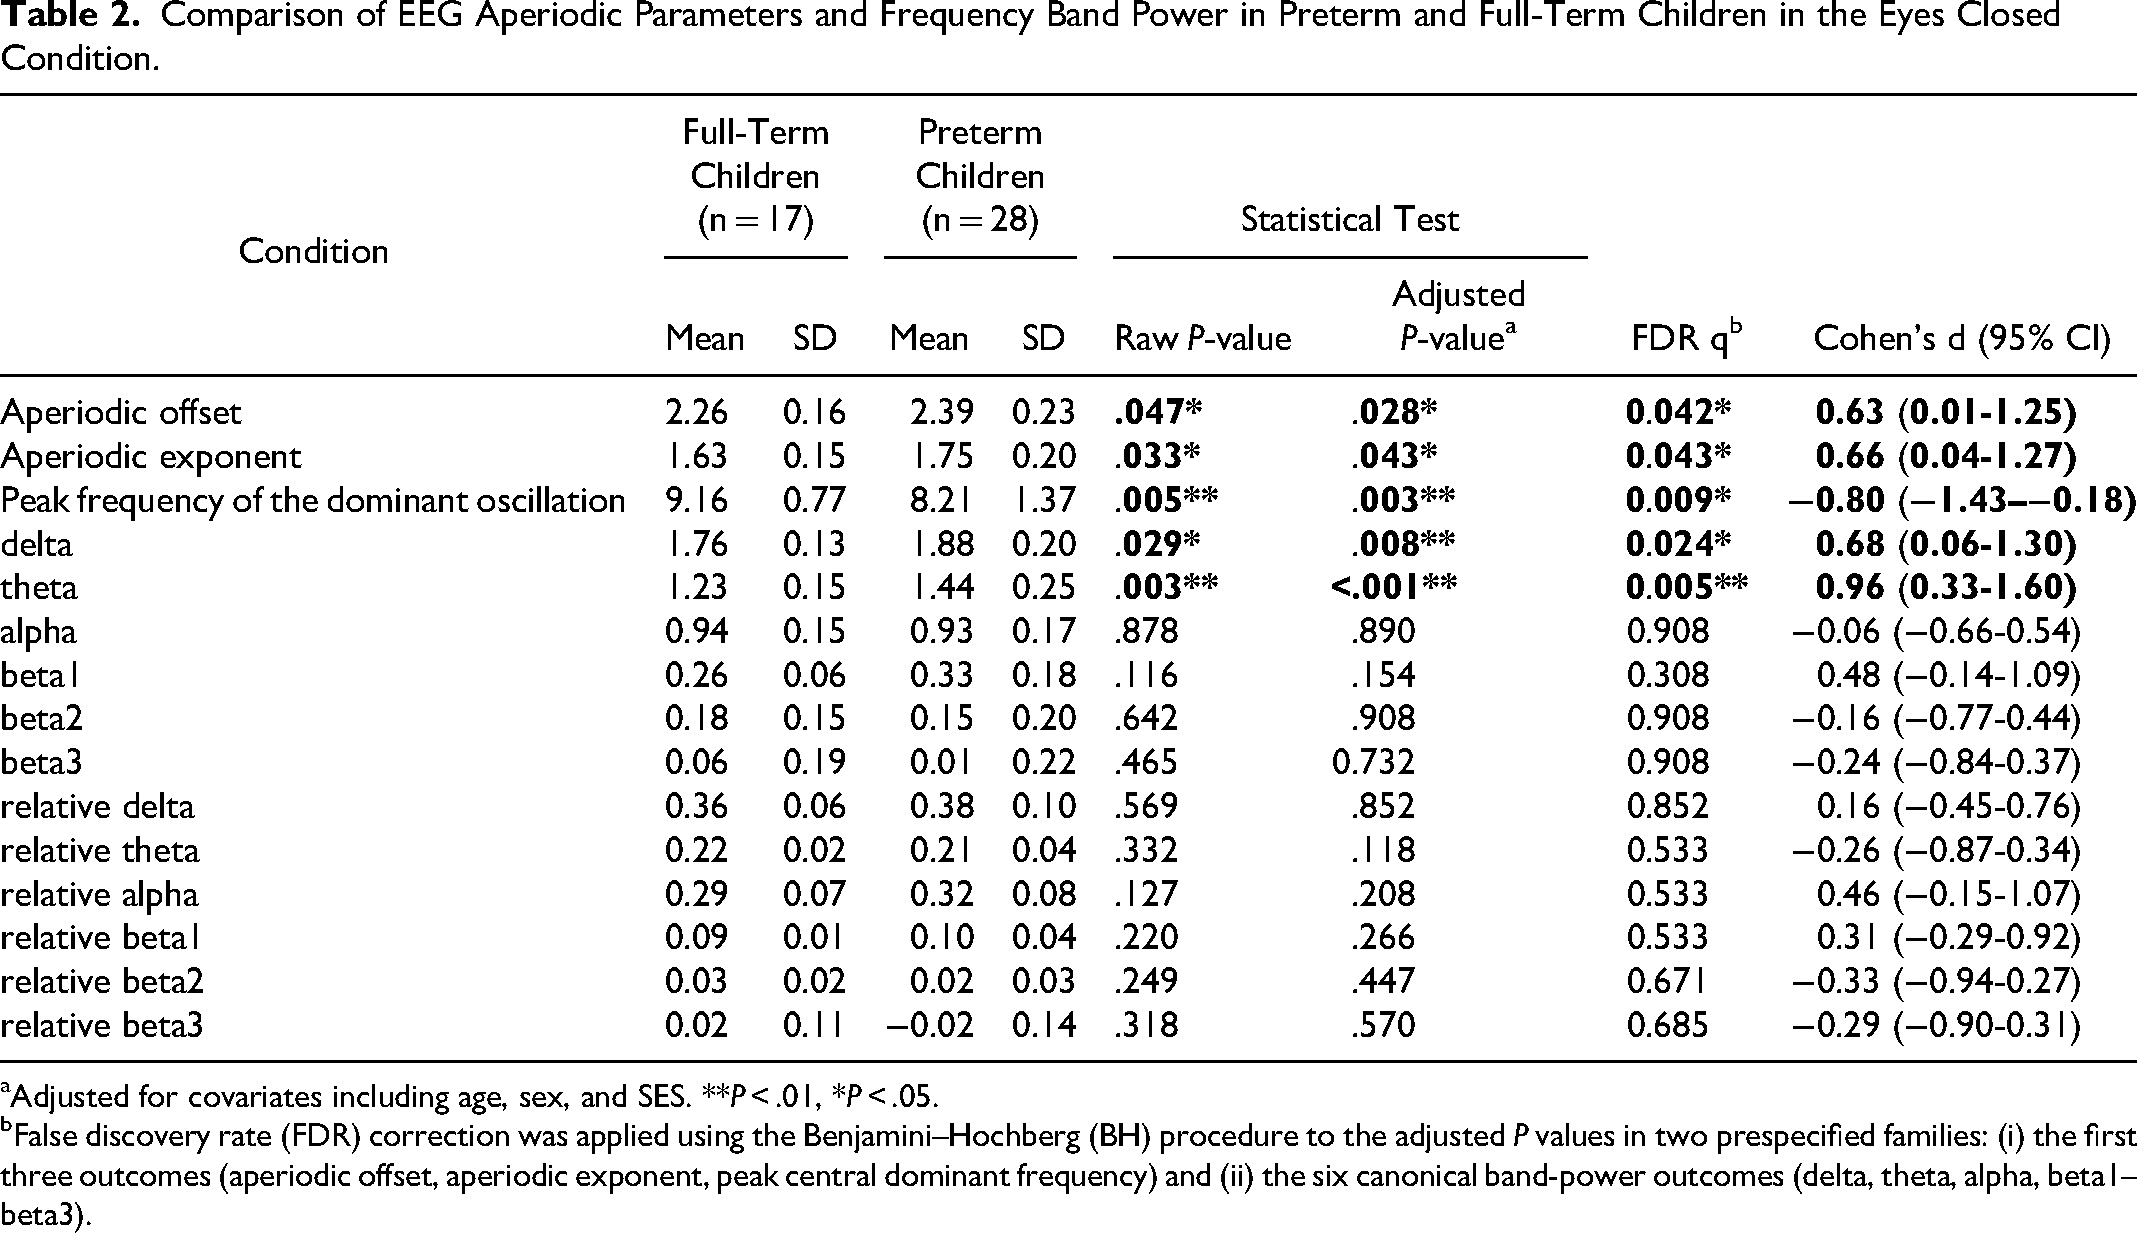
Adjusted for covariates including age, sex, and SES. **P < .01, *P < .05.
False discovery rate (FDR) correction was applied using the Benjamini–Hochberg (BH) procedure to the adjusted P values in two prespecified families: (i) the first three outcomes (aperiodic offset, aperiodic exponent, peak central dominant frequency) and (ii) the six canonical band-power outcomes (delta, theta, alpha, beta1–beta3).
Aperiodic Parameters
Compared with full-term children, preterm children showed significantly higher aperiodic offset (raw P = .047; covariate-adjusted P = .028; FDR q = 0.042; Cohen's d = 0.63, 95% CI 0.01-1.25) and aperiodic exponent (raw P = .033; covariate-adjusted P = .043; FDR q = 0.043; Cohen's d = 0.66, 95% CI 0.04-1.27) (Table 2; Figure 2a–b). After adjusting for age, sex, and SES, group differences remained significant for both aperiodic parameters (offset adjusted P = .028; exponent adjusted P = .043) (Table 2).
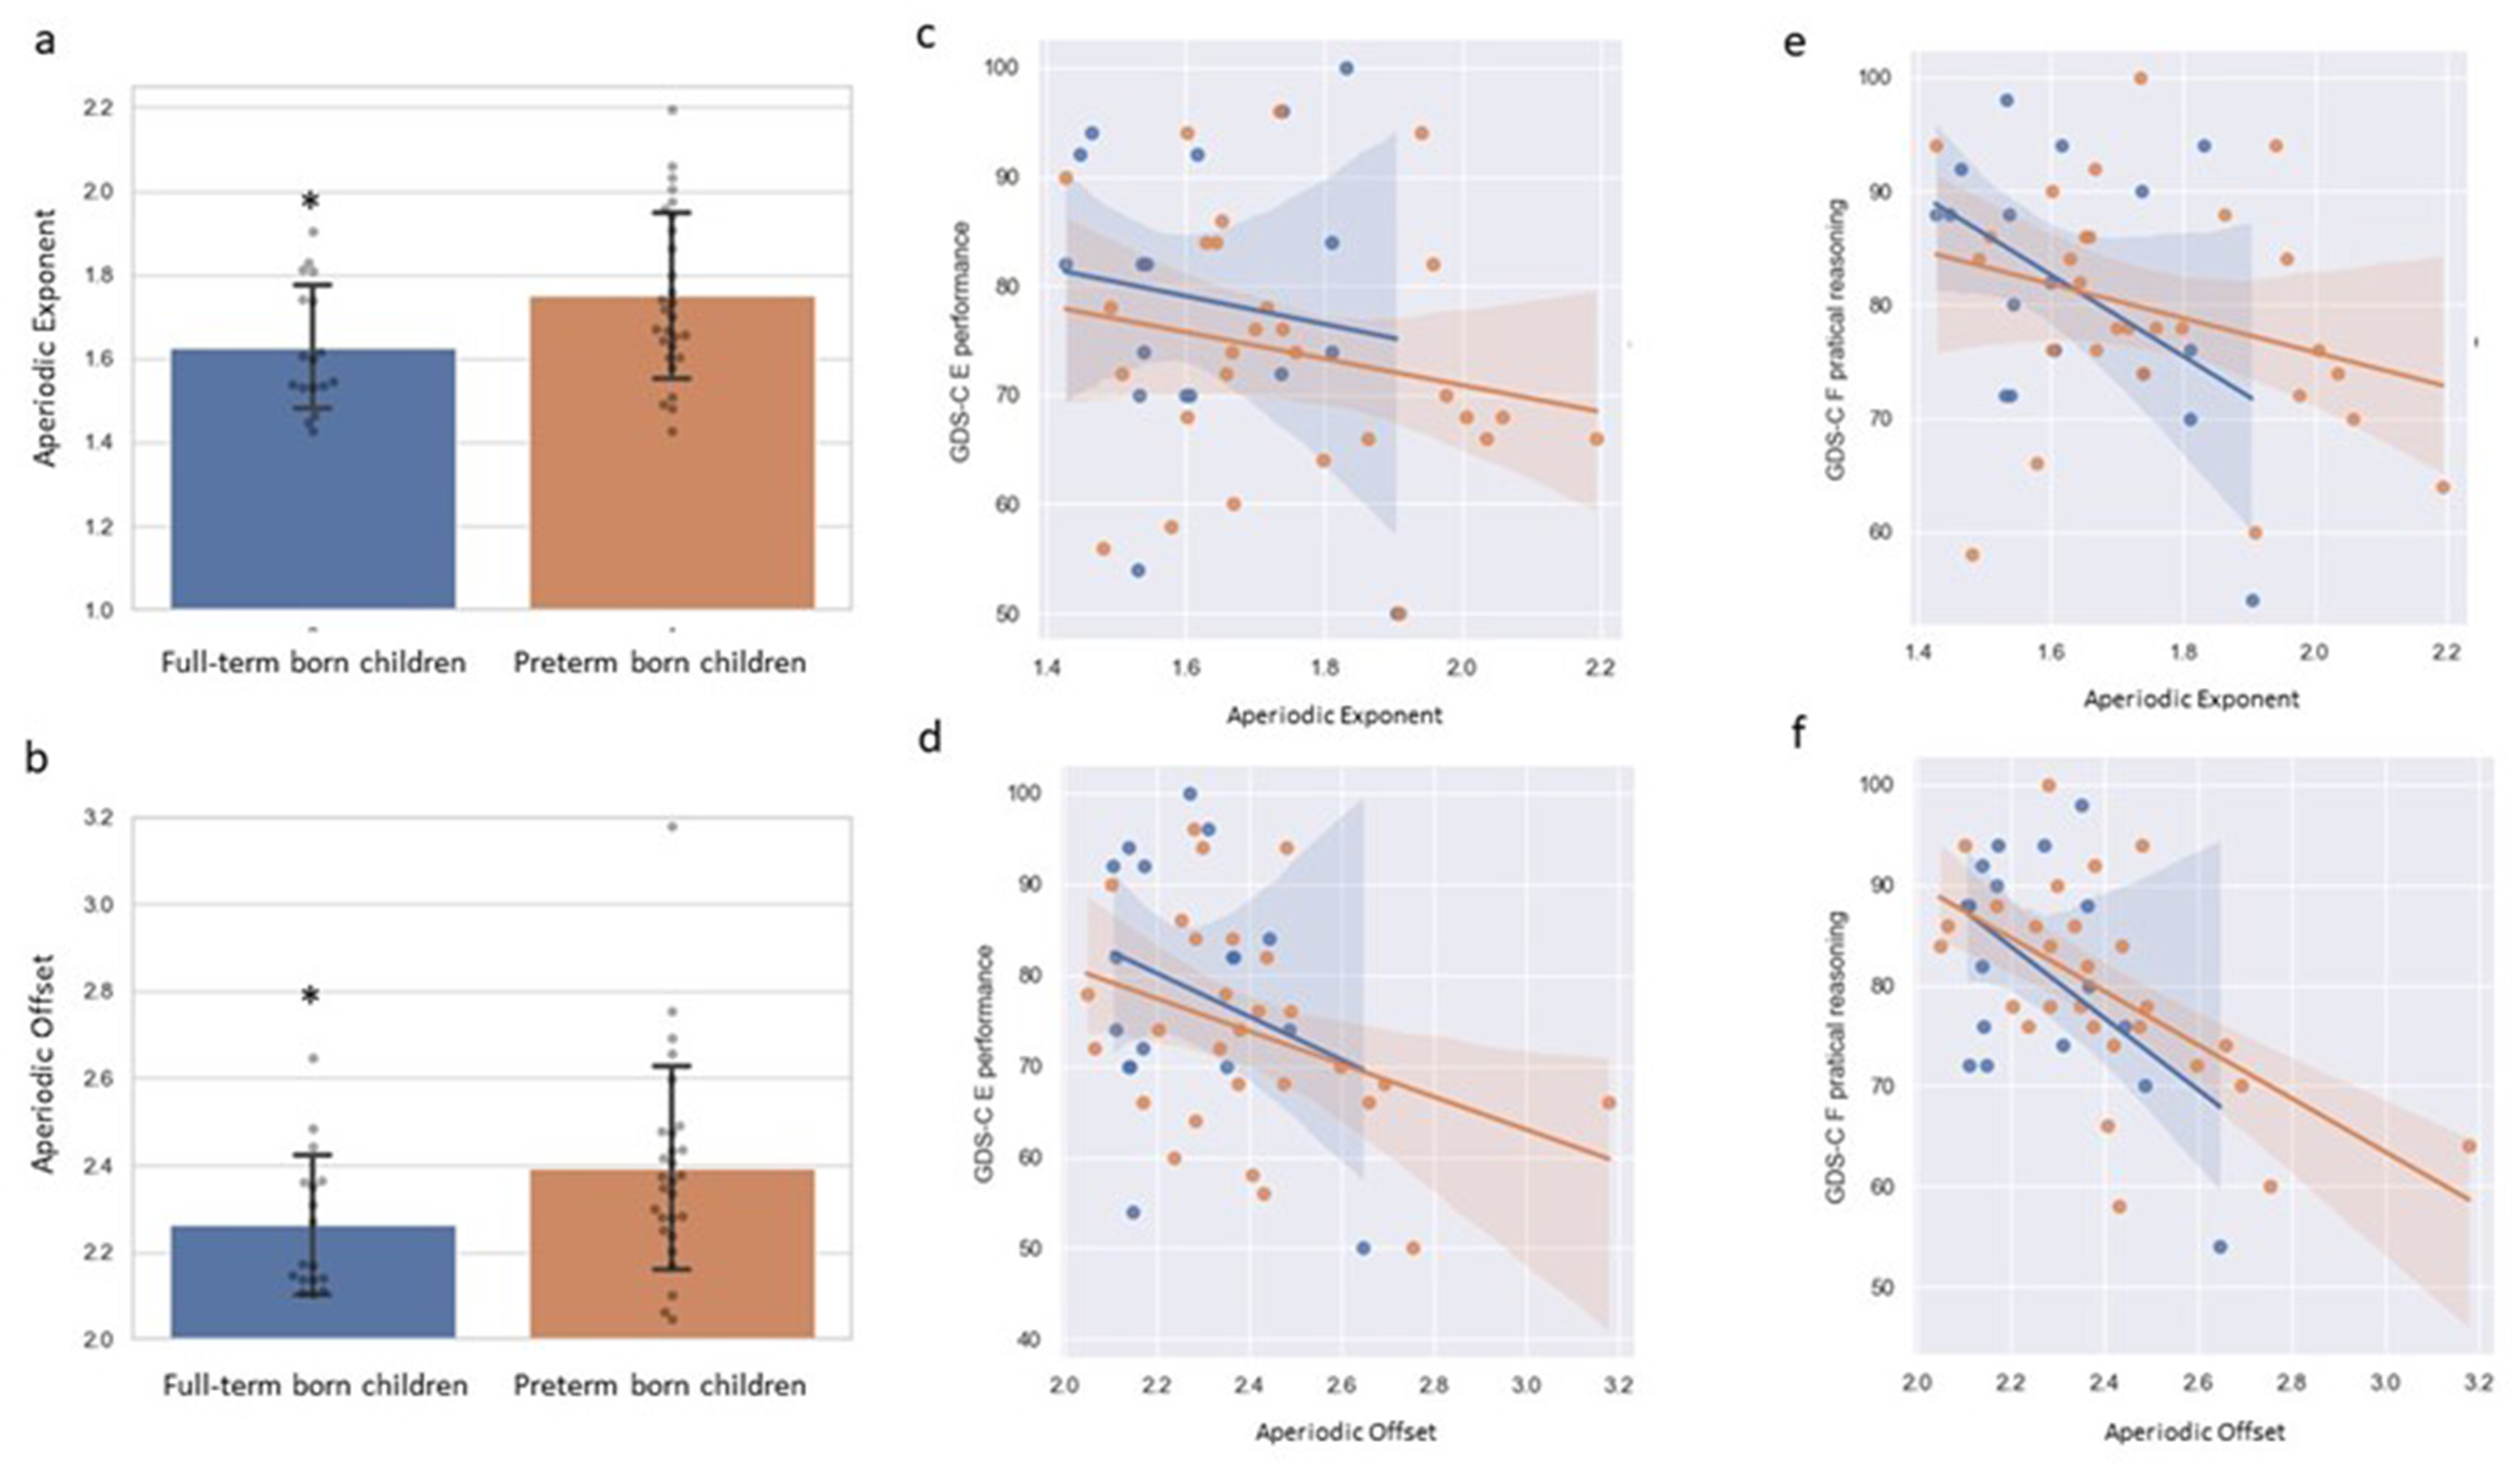
Aperiodic exponent and offset of EEG spectra in preterm-born and term-born children. (a–b) Group comparison of the aperiodic exponent and offset between preterm-born and term-born children; error bars indicate standard deviations; P < .05. (c–f) GDS-C E and F raw scores as a function of aperiodic exponent and offset in preterm-born (orange points/line) and full-term (blue points/line) children; shaded bands indicate 95% confidence intervals.
Preschool children's practical reasoning ability (GDS-C F) was significantly correlated with both aperiodic offset (r = −0.557, P < .001, q < 0.001) and aperiodic exponent (r = −0.351, P = .018, q = 0.018) in the combined cohort (Table S2). After adjusting for age, sex, and SES, these associations remained significant (offset r = −0.534, P = .000, q = 0.001; exponent r = −0.403, P = .008, q = 0.012) (Table S2). Preschool children's performance score (GDS-C E) was significantly correlated with aperiodic offset in the combined cohort (r = −0.352, P = .018, q = 0.045), whereas the association with aperiodic exponent was not significant (r = −0.222, P = .143, q = 0.143) (Table S1). Figure 2c–f illustrates these relationships between developmental test scores and the EEG aperiodic profile. There were no significant interactions by group (preterm vs full-term) for the associations between GDS-C E/F and aperiodic parameters. In subgroup analyses, most correlations did not survive FDR correction, consistent with limited power due to the smaller sample sizes (Tables S1–S2).
Canonical Frequency Band Power
When comparing the conventional band power, preterm children had significantly higher absolute delta and theta band power. None of the other absolute band powers and relative band power ratios showed significant differences between groups. See Table 2 for a comparison of the EEG profiles between preterm and term children. See Table S3 for the correlations between canonical frequency band power and aperiodic EEG parameters in the whole sample.
Discussion
This is the first study to demonstrate significant differences in aperiodic neural activity between preschool children born preterm and full term. Preterm children had elevated aperiodic offset and exponent (1/f slope) compared to term children. Since the introduction of algorithms to parameterize the periodic and aperiodic components in the EEG spectrum and approaches for fitting to a 1/f-like model,16,17 there has been a growing body of research on the functional relevance of the aperiodic slope (exponent) and offset (intercept).22,23,37–39 Several studies have shown the association of aperiodic components with cognitive abilities,22,38 aging, 23 and ADHD status. 39 Cellier et al 24 found the aperiodic offset and exponent were inversely correlated to the age of the children from 3 to 24 years, 24 which suggest that the 1/f offset and exponent could reflect the developmental trajectory of brain maturation. The 1/f offset is highly correlated to low frequency EEG power in canonical frequency bands. Our band power analysis results showed excessive low frequency (delta and theta) resting-state EEG activities in preterm children, which is consistent with previous studies.12–14 The neural mechanisms underlying the reduction in aperiodic offset throughout children's development might be related to the elimination of the over-production of synapses during early brain development. 40 This process was found to be associated with the age-related reduction of overall EEG spectral power. 41 As children's brains mature, redundant inter-neuron connections are removed, resulting in more efficient and functionally related neural connections. Therefore, the reduction in aperiodic offset might represent more efficient inter-neuron connections in the maturing brain. On the contrary, the excessive aperiodic offset shown in preterm children could suggest immature brain connectivity.
We also found preterm children had elevated 1/f exponent compared to term children. The 1/f exponent is suggested to be negatively associated with cognitive abilities in adults,22,38 and with chronological age in the childhood.24,37 The elevated 1/f exponent may therefore indicate an abnormal state of excitation-inhibition balance,42,43 a mechanism that has important functional relevance. 44 An abnormal excitation-inhibition balance could be linked to disrupted or immature neural circuits. 45 Recently, a magnetoencephalography (MEG) study demonstrated that the 1/f exponent could allow children with autism with below average IQ to be differentiated from those with average intellectual functioning. 38 This is consistent with our results that showed a significant difference in the 1/f exponent between preterm and term children, which was also associated with the children's development.
As illustrated in our results and in previous research, 16 conventional canonical frequency band power is partially modulated by the 1/f function. Through separating the aperiodic components from the power spectrum, we have achieved a better estimation of periodic oscillation peak during the resting-state spontaneous neural activity. In our results, preterm children demonstrated resting-state dominant oscillation with a slower peak frequency. Such peak frequency was correlated to the cognitive abilities in our study, and was shown to be associated with the chronical age of children in previous studies.24,46 In adults, the dominant neural oscillation is in the alpha range, which is argued to have functional importance in cognitive processing, working memory,47,48 processing speed, 22 and inhibition 49 and selective attention.50,51 In children, we demonstrated that the dominant oscillation could be extended to the theta range, as reported in previous studies.24,52,53 More importantly, preterm children showed a slower transition from the theta range to the alpha range, indicating slower brain maturation.
Our results did not show significant differences in beta band power between preterm and term children. Such null findings have also been reported in previous studies.12–14 Although slower beta waves (13-21 Hz) are suggested to be associated with cognitive processing ability (eg, reaction time), and fast beta waves (22-30 Hz) are correlated with stress, anxiety, and overstimulation, 54 we did not find significant differences even in the sub-beta bands of beta1 (13-18 Hz), beta2 (19-21 Hz), and beta3 (22-30 Hz) between the preterm and term children. Nevertheless, it is important to note that our study may not be able to reveal differences in beta oscillations, as the dominant oscillations in the children were in the theta and alpha bands.
We have also provided preliminary evidence for associations among aperiodic parameters (1/f offset and exponent), periodic parameters (peak frequency in dominant oscillation), canonical frequency band power (delta wave), and the cognitive ability of preschool children. Future studies with a larger sample size will be needed to confirm such findings. Although developmental assessments and cognitive testing are the gold standards for diagnosing children with developmental disorders or cognitive deficits, qEEG could potentially be used as a screening tool to identify children at risk of cognitive deficits. As previous studies showed close associations between aperiodic parameters and cognitive ability in young children, and our findings showed significant differences in aperiodic parameters between preterm and full-term children, the aperiodic components detected in qEEG might be better electrophysiological markers of developmental delay in preterm preschool children than band power ratios such as theta/beta ratio 55 or delta/alpha ratio. 56
Our study findings have important clinical relevance. When conducting developmental assessment for children born preterm, it is standard practice to correct for gestational age up to the age of 2, 9 assuming preterm children have caught up with their term counterparts by 2 years of age. Nevertheless, our study showed that at the age of 4-6 years, preterm children still have significant brain activity differences compared to term children according to the EEG parameters. It is plausible that the differences in the EEG parameters are related to brain immaturity and delayed formation of neuronal connections and networks in preterm children, considering the third trimester serves as a critical period for the early development of such networks. 57 Moreover, the delays in the neuronal network formation would then persist beyond preschool in preterm children. Based on our findings showing the close associations between brain activity and cognitive ability of preschool children born preterm, we recommend that follow-up for cognitive developmental assessments should continue beyond the preschool years.
The study had several limitations that could be addressed in future studies. First, one channel EEG was used due to experimental constraints in the study. Although the single channel EEG can produce meaningful research data,58,59 multiple-channel EEG data would allow the correction and removal of artifacts using algorithms such as Independent Component Analysis (ICA). 60 Thus, single channel EEG would make the processed EEG data more likely to be affected by motor artifacts. Moreover, the use of single-channel electrodes results in poor spatial resolution, therefore information on specific cortical sources generating the electrical signal on the scalp is very limited. Second, due to the relatively small sample size, the current study may be underpowered to detect correlation between EEG parameters and developmental sub-quotients for examining differences in cognitive ability between preterm and term children. Several large-scale cohort studies6,61 have reported differences in cognition, attention, and behavior between preterm children and full-term children. Longitudinal studies using resting-state qEEG with a larger sample size are needed to replicate the current findings and further explore the developmental trajectory as well as the neurological basis of the cognitive performance differences between preterm and full-term children. Third, our study focused on eyes-closed resting EEG rather than the eyes-open condition. It was difficult for preschool children to sit still for 3 min without a clear focus; therefore, we introduced a silent cartoon video. However, previous studies using similar procedures 24 showed that age-related EEG aperiodic signal differences were exhibited in posterior areas, whereas our study measured the central area, which may not reveal such spontaneous neural activities during the eyes open condition in a resting state. Fourth, a potential sampling bias may exist in this study. Parents of both preterm and full-term children might be more willing to join the study if they think their children have neurodevelopmental issues. However, as the response rate of parents of preterm children was high in this study, the effects of such sampling bias could be minimal.
In conclusion, our study found significant differences in the aperiodic parameters and slower wave band power within the EEG spectrum between preterm and full-term children. The EEG aperiodic offset and center frequency of the dominant oscillatory peak were associated with children's practical reasoning ability, indicating there are functional implications between preterm and full-term children in preschool. Future studies should consider the impact of the 1/f-like aperiodic component of the EEG spectrum, particularly on aperiodic neuronal activities in children. Moreover, monitoring for cognitive and higher executive function should continue beyond preschool for children born preterm.
Supplemental Material
sj-docx-1-eeg-10.1177_15500594261454408 - Supplemental material for EEG Profile Associated with the Developmental Outcomes of Preschool Children Born Very Preterm
Supplemental material, sj-docx-1-eeg-10.1177_15500594261454408 for EEG Profile Associated with the Developmental Outcomes of Preschool Children Born Very Preterm by Yuliang Wang, Ouyang Guang, Tatia M.C. Lee, Cuixin Li, Lok Kan Leung, Shiting Liang and Winnie W.Y. Tso in Clinical EEG and Neuroscience
Footnotes
Ethical Considerations
This research was approved by the institutional review board of the University of Hong Kong/Hospital Authority Hong Kong West Cluster: UW 20-455. The signed inform consent sheet were obtained for all the participants recruited in this study.
Author Contributions
Conceptualization: YW, WWYT, TMCL;
Original Draft: YW, WWYT, OG;
Methodology: YW, OG, WWYT;
Data Acquisition: YW, CL,LKL, WWYT;
Formal Analysis: YW;
Supervision : WWYT, TMCL.
Funding: WWYT.
Interpretation of data: All authors
Critical revision of the manuscript: All authors.
Funding
The authors disclosed receipt of the following financial support for the research, authorship, and/or publication of this article: This study was funded by The Society for the Relief of Disabled Children (Hong Kong).
Declaration of Conflicting Interests
The authors declared the following potential conflicts of interest with respect to the research, authorship, and/or publication of this article: I declare that I participated in the design, execution, and analysis of the paper by Wang et al entitled “EEG profile associated with the developmental outcomes of preschool children born very preterm” that I have seen and approved the final version and that it has neither been published nor submitted elsewhere. I also declare that I have no conflict of interest.
Data Availability Statement
The data supporting the findings of this study are available from the corresponding author upon reasonable request.
Supplemental Material
Supplemental material for this article is available online.
References
Supplementary Material
Please find the following supplemental material available below.
For Open Access articles published under a Creative Commons License, all supplemental material carries the same license as the article it is associated with.
For non-Open Access articles published, all supplemental material carries a non-exclusive license, and permission requests for re-use of supplemental material or any part of supplemental material shall be sent directly to the copyright owner as specified in the copyright notice associated with the article.