
Abstract
Introduction
Posterior theta/alpha ratio (TAR) is among the best-validated qEEG biomarkers for dementia, yet remains largely unused in routine neurology practice — primarily because it is sensitive to the patient's arousal state, an uncontrolled variable in real-world clinical EEG. We evaluated whether aperiodic spectral correction can bridge this gap between research promise and clinical reality.
Methods
Routine EEGs from 73 participants (18 controls, 55 dementia patients) were analyzed across three arousal segments. Five correction strategies were evaluated for TAR, with the optimal method validated in an external dementia dataset (ds004504, n = 88) and a normative cohort (ds005385, n = 587, age 20-79).
Results
Raw TAR was diagnostically significant at Alert (AUC=0.772) and HVT (AUC=0.812) segments but failed in the Drowsy segment (AUC=0.631, p = 0.110) — the state most representative of uncontrolled clinical EEG. FOOOF-based aperiodic correction restored significance (AUC=0.701, p = 0.014), improved intraclass correlation to 0.945, and generalised to the external dataset (AUC=0.830). In the normative cohort, FOOOF-corrected TAR was completely age-independent (r = 0.000), supporting a universal threshold of ≥0.45 (specificity 92.3%).
Conclusions
A single step of aperiodic correction transforms TAR from an arousal-sensitive research metric into a robust, age-independent clinical tool. Combined with cognitive assessment, FOOOF-corrected TAR offers practical, objective dementia screening within routine EEG practice.
Keywords
Introduction
Among the many candidate quantitative EEG (qEEG) biomarkers for Alzheimer's disease and related dementias, the posterior theta/alpha ratio (TAR) stands out for its consistency across independent cohorts. The pathophysiological basis is well established: neurodegeneration in Alzheimer's disease leads to progressive loss of posterior alpha rhythm and concurrent increase in slow-wave (theta) activity, with the TAR reflecting the net balance of these changes.1–3 Across multiple studies, posterior TAR has demonstrated diagnostic AUC values consistently above 0.80, has been shown to correlate with MMSE scores and neuropsychological test performance, and can identify MCI patients who will progress to dementia before overt cognitive decline.4–7 Compared with CSF biomarkers and amyloid PET — the current reference standards — EEG carries no procedural risk, requires no radiotracer, is widely available across neurology departments, and can be repeated serially at low cost.
Despite this evidence base, TAR has not entered routine clinical use as a dementia screening tool. The central obstacle is its sensitivity to the patient's momentary arousal state. As alertness decreases, alpha power diminishes and theta power increases — producing a TAR elevation that is physiologically indistinguishable from the pathological signal of neurodegeneration. In the research settings where TAR has been validated, EEG is typically recorded under controlled conditions with strictly alert participants. In the neurology clinic, however, elderly patients with memory complaints frequently drift between wakefulness and drowsiness during a routine EEG, and this fluctuation is largely uncontrolled and unpredictable. The same patient may yield a TAR of 0.3 when alert and 0.6 when drowsy — not because their disease has progressed, but because they briefly dozed off. This arousal confound makes TAR unreliable for both single-session interpretation and inter-session monitoring in the clinical setting.8,9
The EEG power spectrum can be decomposed into two components: an aperiodic ‘1/f’ background signal, which reflects broadband non-oscillatory activity and steepens with decreasing arousal, and superimposed oscillatory peaks that reflect genuine rhythmic neural activity. Spectral parameterization approaches — in particular the FOOOF algorithm10,11 — separate these components computationally. By subtracting the fitted aperiodic background before computing TAR, it is possible in principle to isolate purely oscillatory theta-to-alpha power ratios, rendering the metric insensitive to the broadband confound introduced by drowsiness. Whether this approach can in practice preserve the diagnostic utility of TAR while eliminating its arousal dependency has not been prospectively evaluated.
The present study addressed this question in three stages: (1) we quantified the arousal-state dependency of posterior TAR in a routine clinical EEG cohort and evaluated five candidate correction strategies; (2) we validated the performance of the optimally corrected metric in an independent, publicly available dementia EEG dataset; and (3) we characterised the distribution of the corrected metric in a large normative cohort spanning the full adult age range, with the goal of establishing a single, age-independent reference threshold suitable for direct clinical application.
Methods
Participants
EEG Recording and Preprocessing
Primary dataset EEGs were recorded at 200 Hz (standard 10-20 montage, 19 channels), bandpass-filtered (0.5-40 Hz) with 60 Hz notch. Epochs of 4 s (2 s overlap) were extracted; those exceeding 150 µV or with EMG contamination ratio >0.6 were rejected. For the external diagnostic and normative datasets, preprocessed files were loaded using MNE-Python and the same filtering pipeline applied. Posterior TAR was computed from channels P3, P4, Pz, O1, and O2 using Welch's power spectral density (theta: 4-8 Hz; alpha: 8-13 Hz).
Arousal Segment Definition
Three segments were defined from EEG annotations in the primary dataset. Alert: multiple 8-s epochs beginning 1 s after each Eyes-Closed command, prior to hyperventilation. HVT: beginning 30 s after HVT onset. Drowsy: a fixed 15-min window starting 60 s after HVT termination. For time-course analysis, a sliding-window approach (60-s windows, 30-s steps) was applied across the Drowsy segment to characterise temporal drift of TAR values.
Candidate Spectral Correction Strategies
Five candidate strategies were evaluated to correct posterior TAR for arousal-state dependency: alpha-power normalization, fractional ratio θ/(θ+α), log-transformation, sliding-window z-score normalization, and FOOOF-based spectral parameterization. The selection criterion was simultaneous maintenance of diagnostic AUC ≥0.70 across both Alert and Drowsy segments and intraclass correlation (ICC) ≥ 0.75. The FOOOF algorithm (specparam package 10 ) models the EEG power spectrum as the sum of an aperiodic 1/f component and superimposed oscillatory peaks; subtracting the aperiodic fit before computing TAR isolates purely oscillatory power, decoupling the ratio from state-dependent broadband shifts. FOOOF parameters: frequency range 2–40 Hz, peak width limits 1–8 Hz, maximum peaks 5, minimum peak height 0.05; fits with R2<0.85 were excluded.
Statistical Analysis
Arousal invariance was assessed by: (1) ICC using absolute agreement (two-way random effects model) across Alert, HVT, and Drowsy segments; and (2) absolute variation across segment means (<10% deemed stable). Diagnostic performance was assessed by AUC from the ROC curve using Mann-Whitney U statistics. Youden's J index identified optimal cut-offs across 11 candidate values (0.25-0.60). Age-independence in the normative dataset was assessed by Spearman correlation between age and TAR values; age-stratified distributions were computed in 10-year bins with the 95th percentile of the clean distribution (after 3×IQR outlier removal) as the upper reference limit.
Results
Arousal-State Dependency of Posterior TAR
Raw posterior TAR demonstrated strong diagnostic performance at Alert (AUC=0.772, p = 0.001) and HVT segments (AUC=0.812, p < 0.001), but failed in the Drowsy segment (AUC=0.631, p = 0.110), directly reflecting its arousal dependency. ICC across the three segments was 0.931 overall but declined to 0.900 in controls only, indicating partial inflation by between-group variance. Absolute variation across segment means was 28.2%, confirming marked state-dependence. Sliding-window analysis showed a progressive upward drift in controls (mean slope μ=+0.0251 unit/min) over the 15-min Drowsy resting period, further demonstrating that TAR increases as a function of deepening drowsiness independent of pathology (Figure 1).
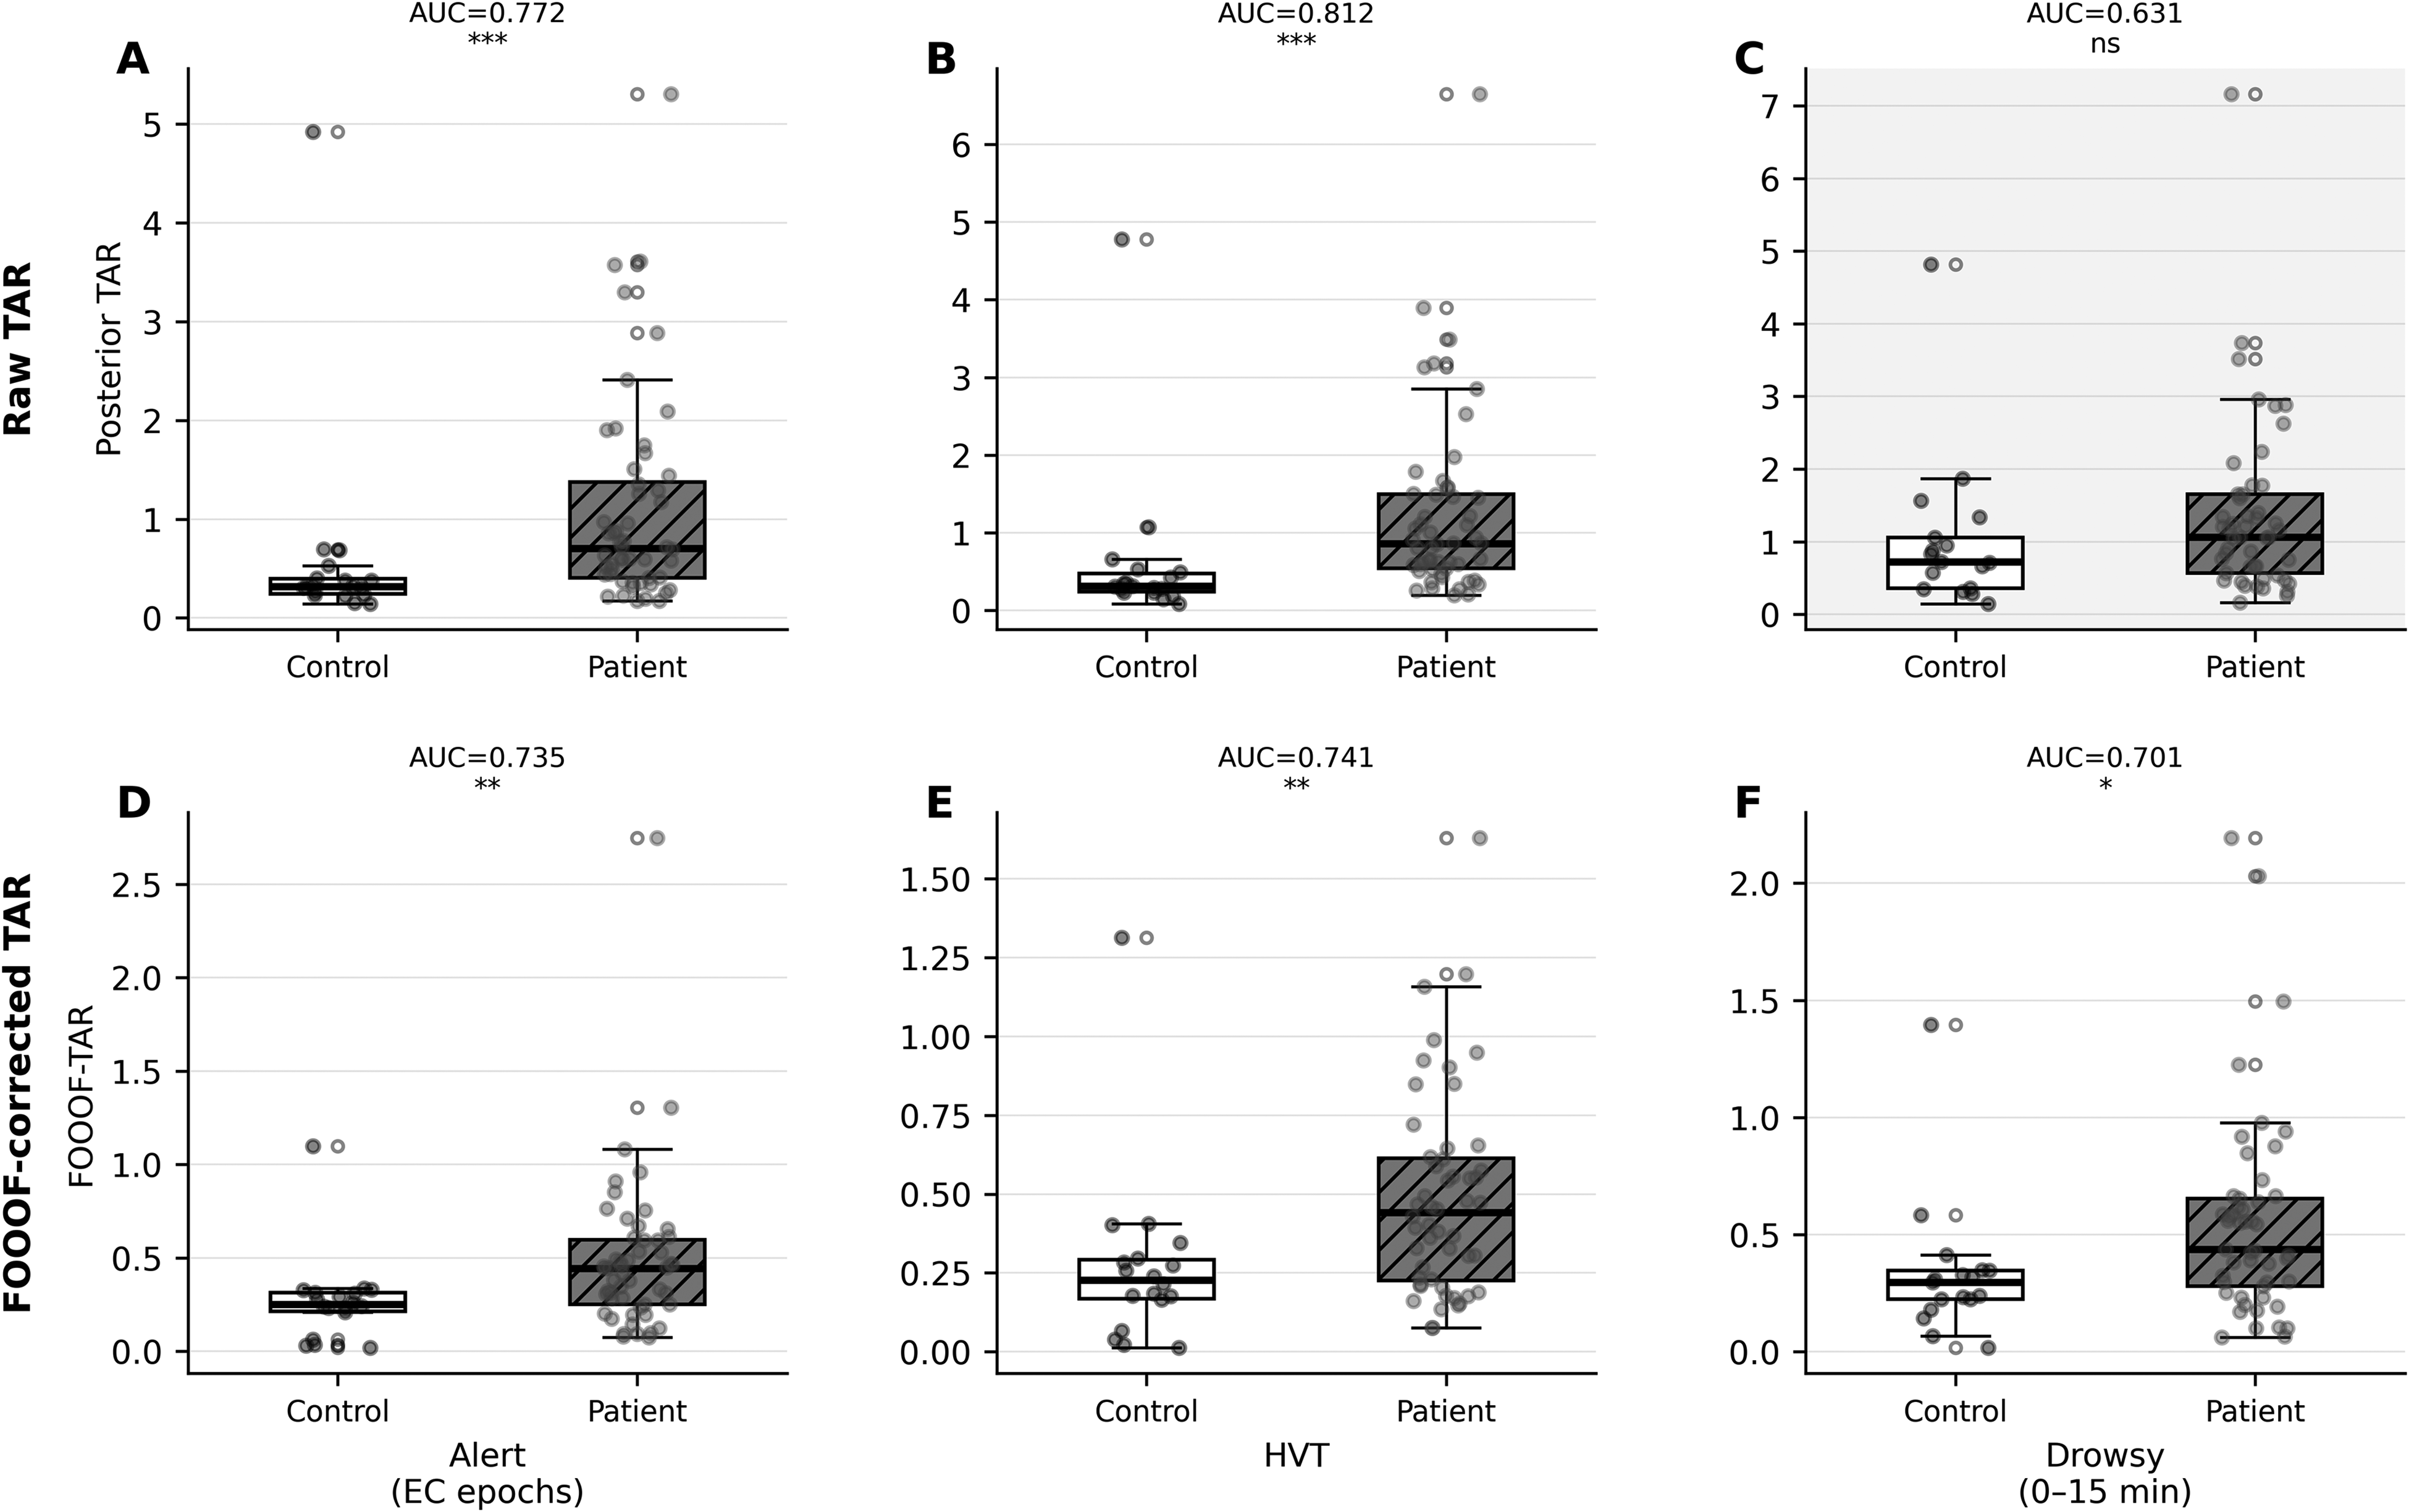
Three-segment comparison of raw and FOOOF-corrected posterior TAR in the primary dataset (n = 73). White boxes = controls; gray hatched boxes = patients. Upper row (A–C): raw posterior TAR across Alert, HVT, and Drowsy segments — Drowsy segment shows loss of significance (AUC=0.631, p = 0.110, shaded panel). Lower row (D–F): FOOOF-corrected TAR — group separation restored in all three segments including Drowsy (AUC=0.701, p = 0.014).
FOOOF-Based Aperiodic Correction
Of the five candidate correction strategies evaluated, only FOOOF-based aperiodic subtraction simultaneously satisfied both the diagnostic (AUC ≥0.70 in all segments) and stability (ICC ≥0.75) criteria; the four simpler strategies failed to restore Drowsy-segment significance, produced unstable within-subject estimates, or both. FOOOF-corrected TAR yielded AUC=0.735 (Alert, p = 0.003), 0.741 (HVT, p = 0.002), and 0.701 (Drowsy, p = 0.014), restoring statistical significance where uncorrected TAR had failed. Control-only ICC improved to 0.945, exceeding that of raw TAR (0.900). Supplementary Table 2 summarises TAR and FOOOF-TAR performance across segments.
Sliding-window analysis over the 15-min Drowsy resting period confirmed stabilisation after FOOOF correction: the control slope reduced from μ=+0.0251 to μ=+0.0003 unit/min (p = 0.939), and group separation between controls and patients was maintained throughout the full recording window (Figure 2).
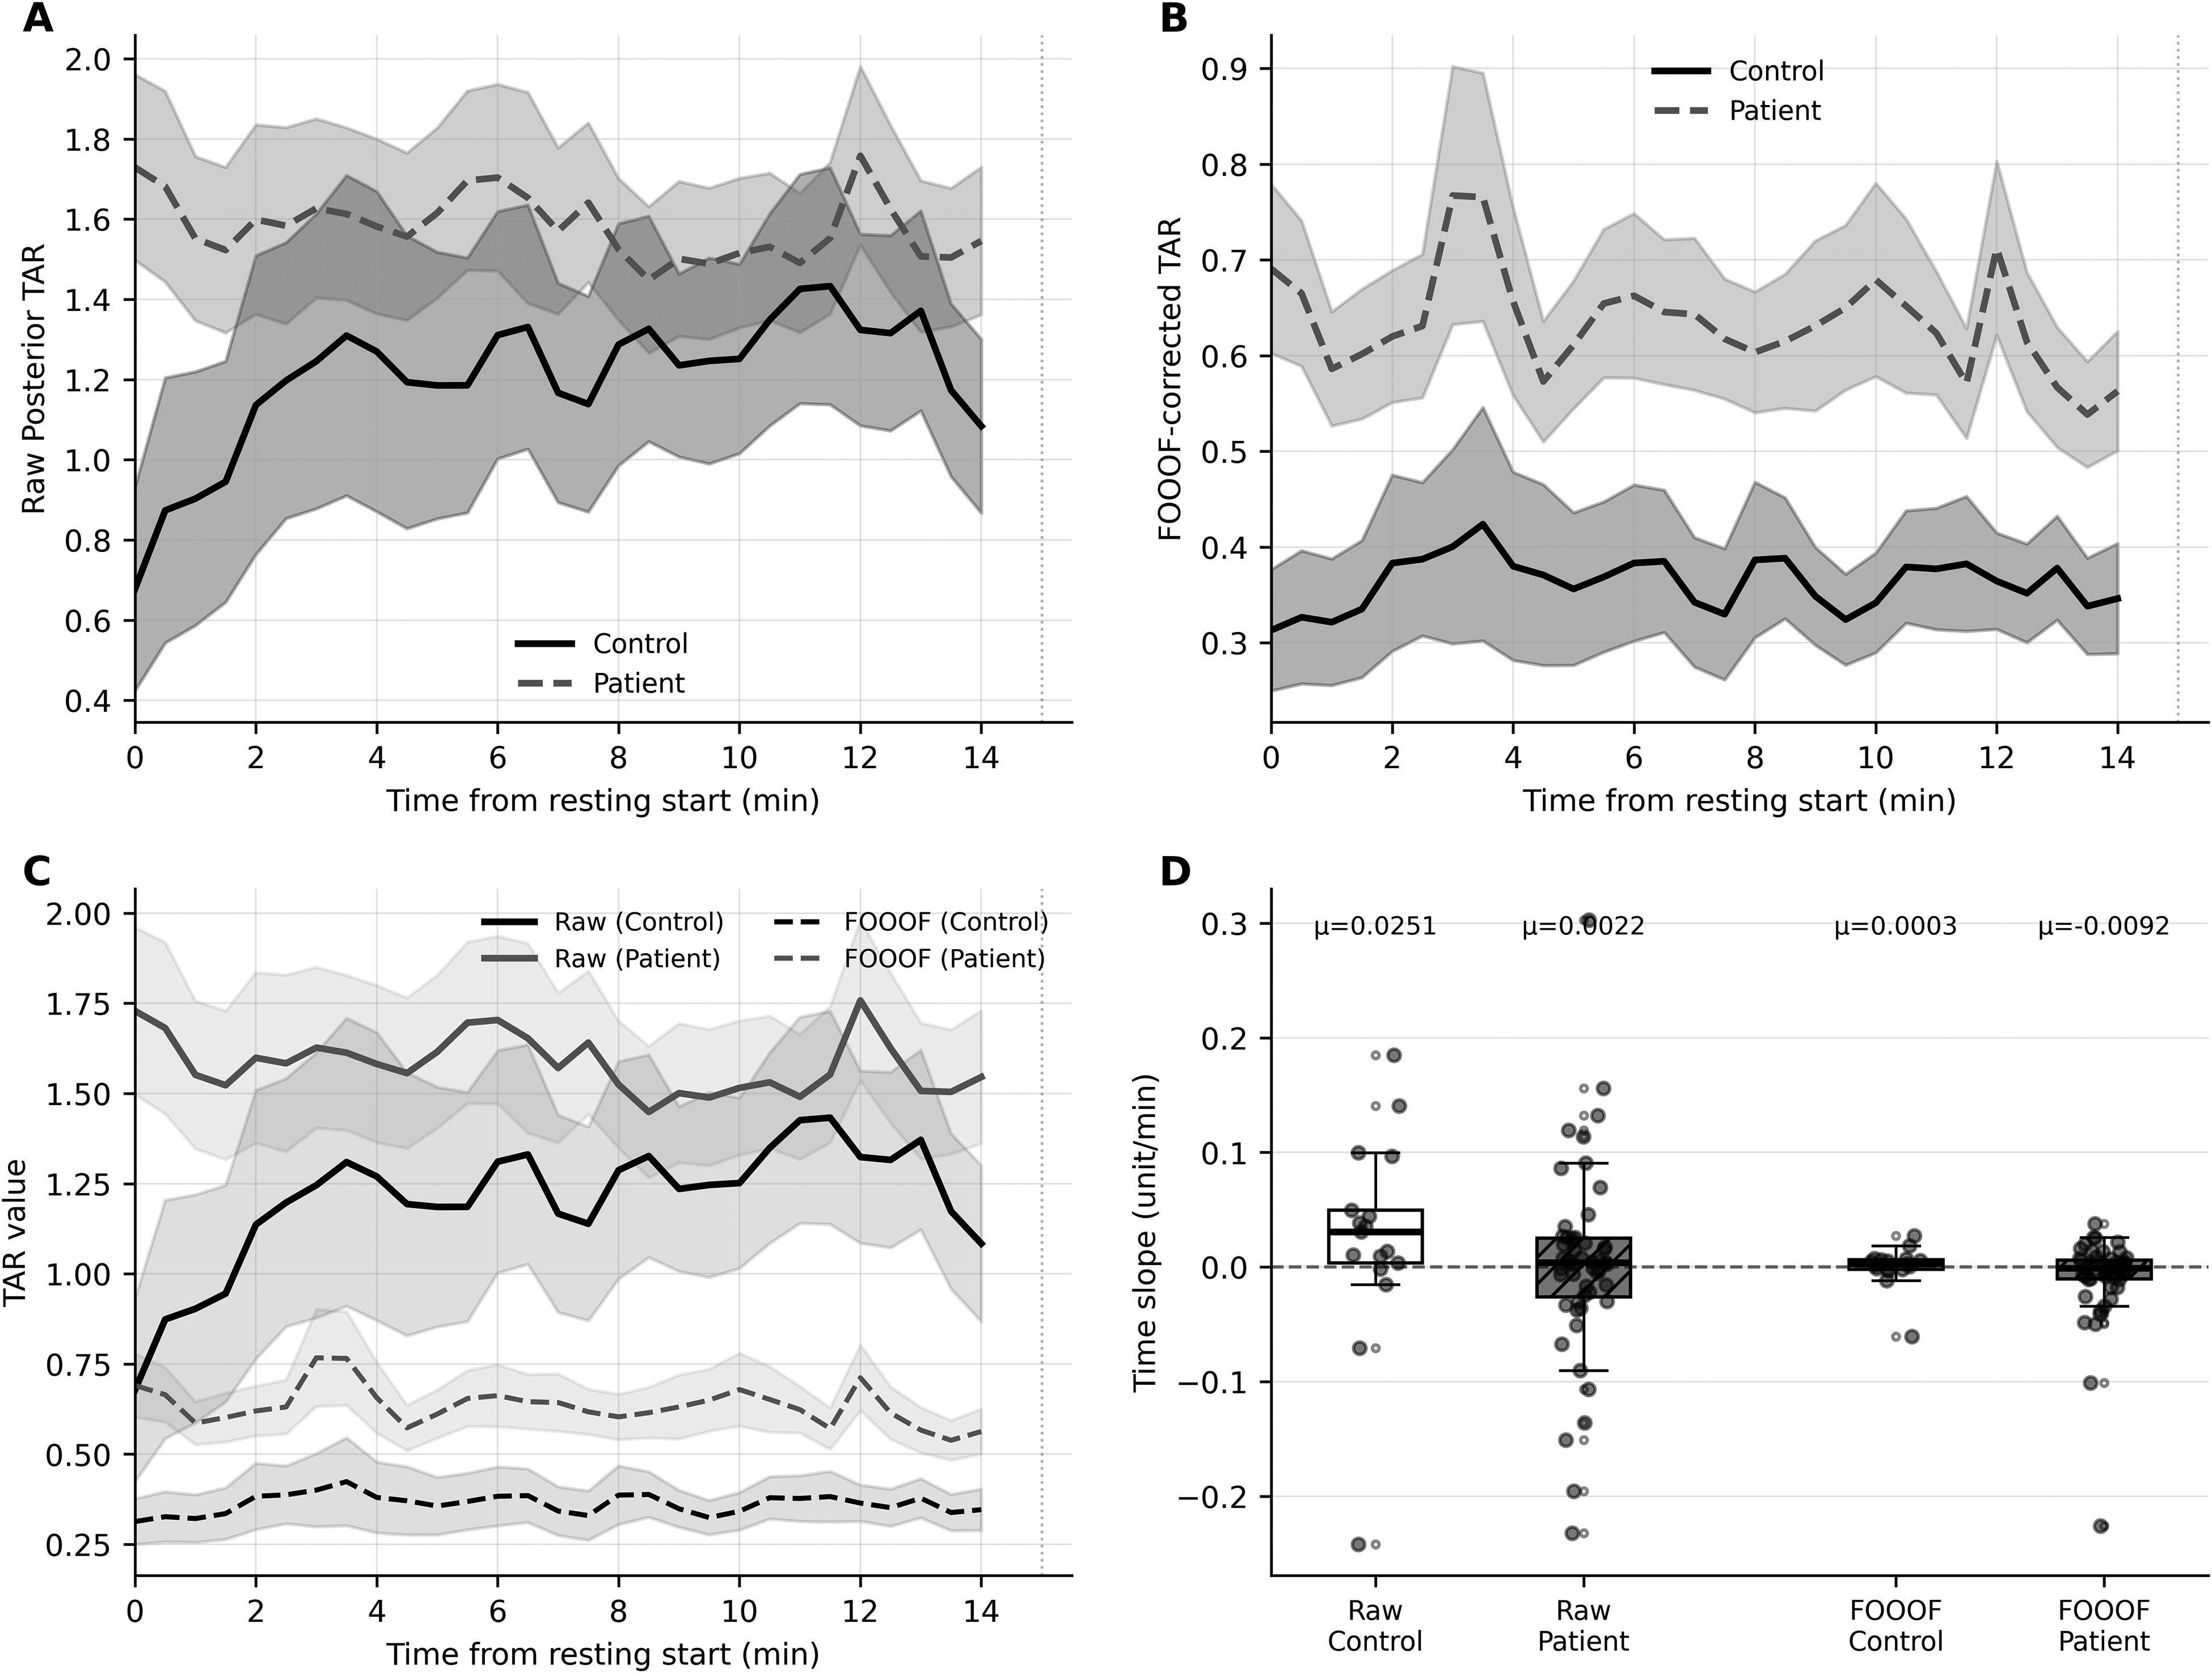
Sliding-window trajectory analysis of posterior TAR in the primary dataset (drowsy resting, 0-15 min). Solid lines = controls; dashed lines = patients; shaded bands = mean ± SEM. (A) Raw posterior TAR; controls show progressive upward drift (μ=+0.0251 unit/min). (B) FOOOF-corrected TAR; both groups stabilize (Control μ=+0.0003 unit/min). (C) Overlay of raw and FOOOF-corrected trajectories. (D) Individual time-slope distributions.
External Diagnostic Validation
In ds004504, FOOOF-corrected TAR successfully replicated the diagnostic signal: AUC=0.830 (CN vs AD, p < 0.001) and AUC=0.721 (CN vs FTD, p < 0.001). Group means were: CN 0.162 ± 0.119, AD 0.984 ± 1.096, FTD 0.685 ± 1.011. Cross-dataset threshold analysis (Figure 3) identified a Youden-optimal cut-off of 0.38 (primary dataset) and 0.42 (ds004504), a difference of 0.04. Mean balanced accuracy was maximised at ≥0.45 (BalAcc=0.754), with high specificity across both cohorts: primary 0.882, external 0.966. These data support a three-zone reference: normal (<0.30), indeterminate (0.30-0.45), and elevated (≥0.45), as illustrated by the kernel density distributions (Figure 3, Supplementary Table 3).
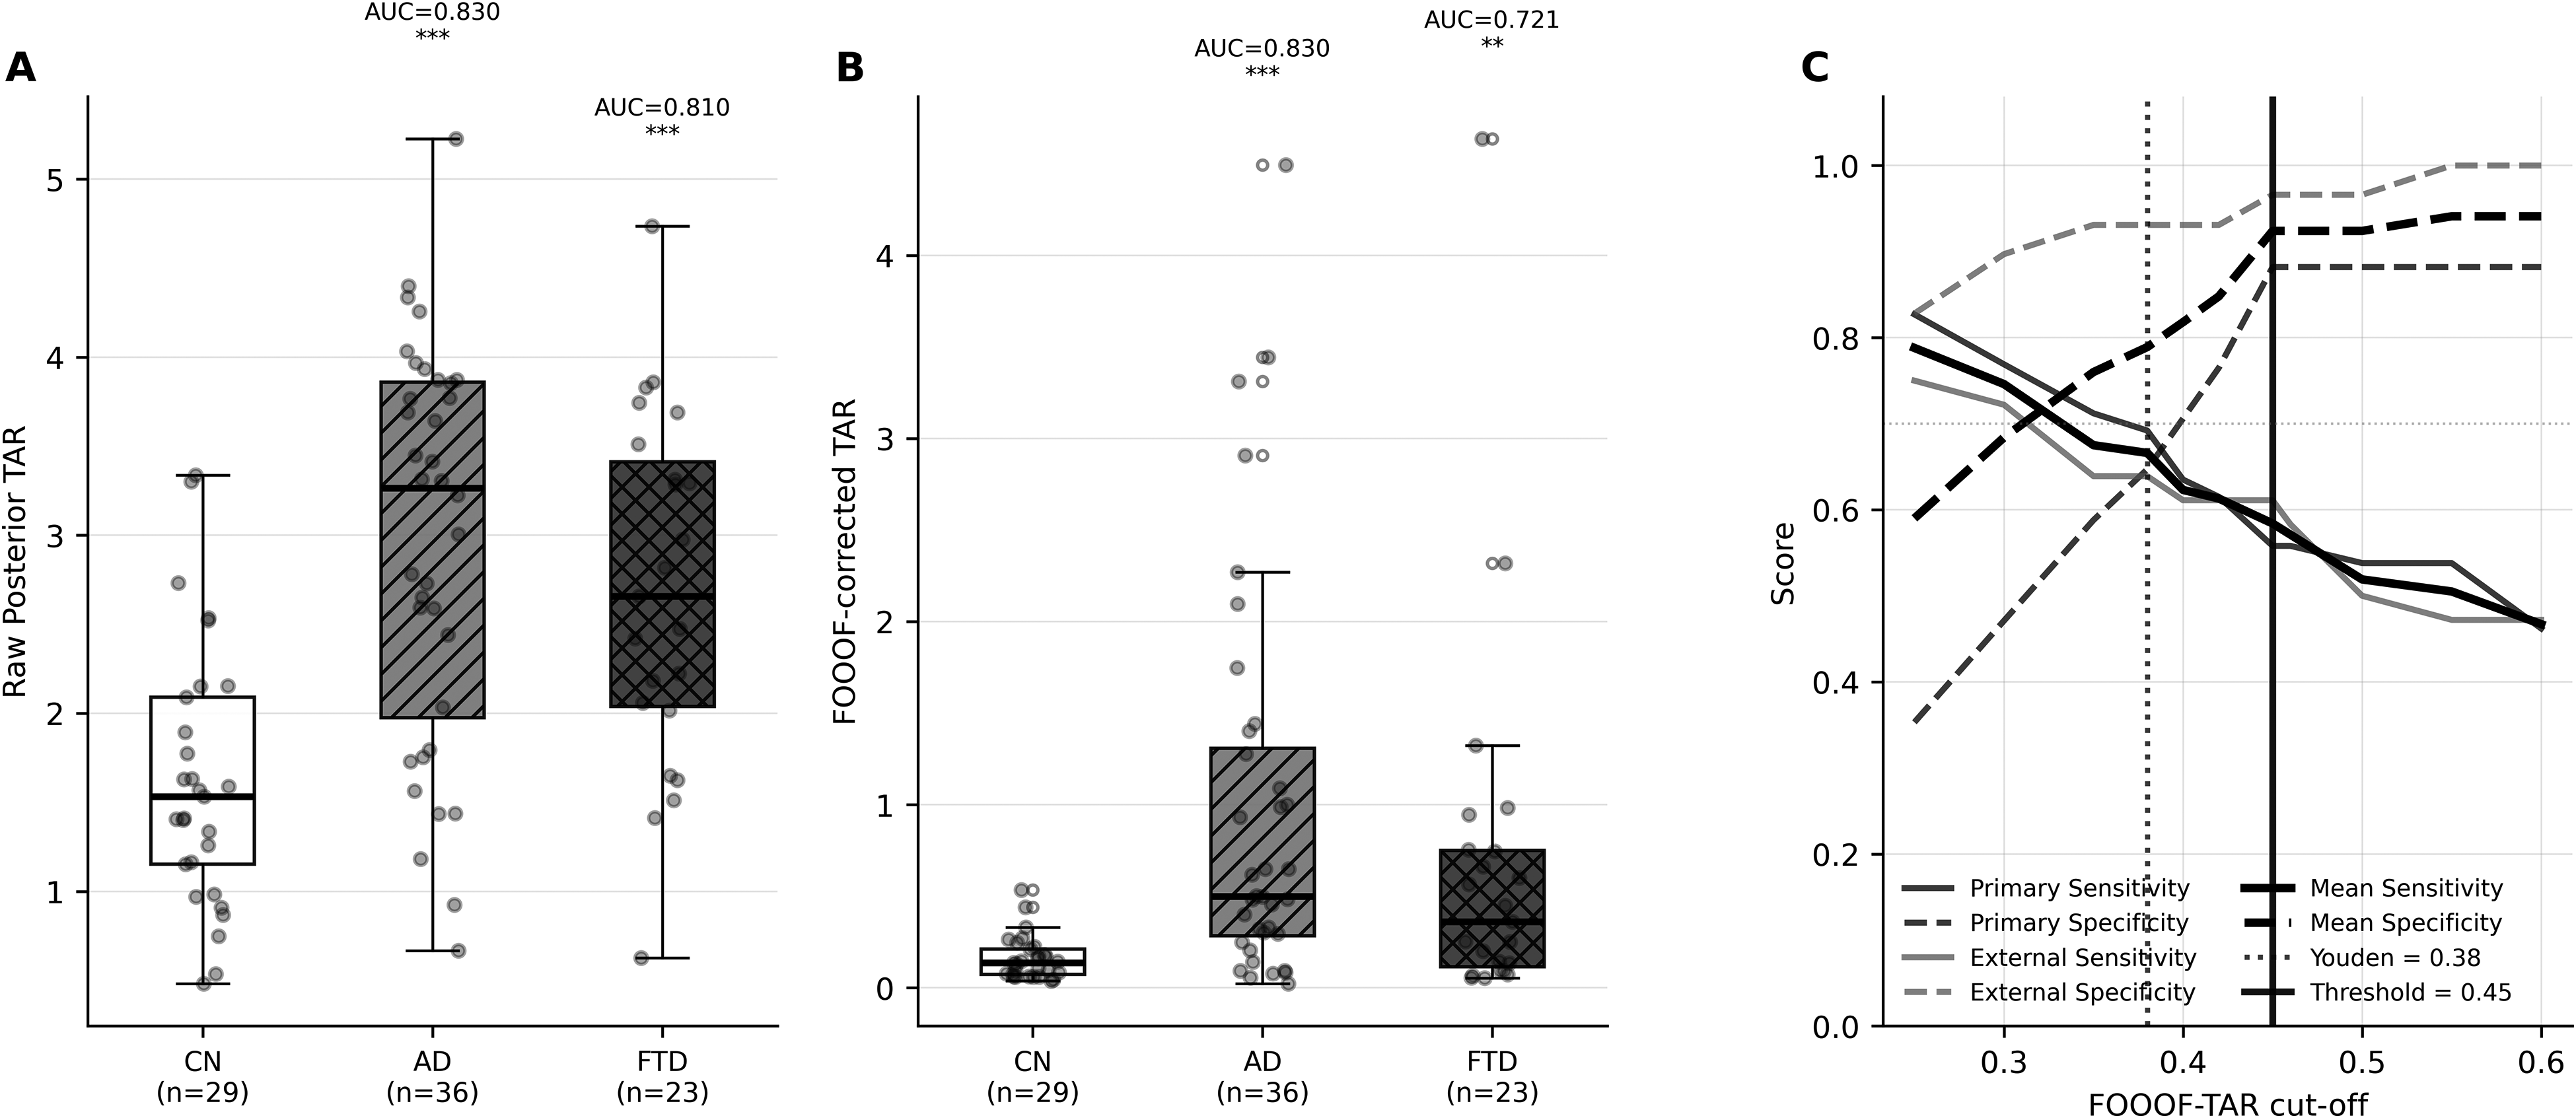
External validation and threshold analysis (ds004504). (A) Raw posterior TAR and (B) FOOOF-corrected TAR group comparisons (CN = 29, AD = 36, FTD=23); AUC(CN–AD) = 0.830 for FOOOF-TAR. (C) Cross-dataset threshold evaluation: sensitivity (solid) and specificity (dashed) curves for primary (black) and ds004504 (gray) datasets, with Youden-optimal (dotted vertical, 0.38/0.42) and high-specificity threshold (solid vertical, 0.45) indicated, and kernel density distributions with three-zone shading (Normal <0.30 / Indeterminate 0.30-0.45 / Elevated ≥0.45).
Normative Reference Distribution
Having identified FOOOF-corrected TAR as the optimal metric, its distribution was characterised in the ds005385 normative dataset. Extreme outliers were removed using a 3×IQR criterion (n = 21 removed, 3.5%), likely reflecting FOOOF fitting instability in individuals with absent or weak alpha peaks; the analytic sample comprised n = 587. FOOOF-corrected TAR demonstrated complete age-independence (Spearman r = 0.000, p = 0.606), with mean values stable across all age groups (range 0.20-0.24; Figure 4). In contrast, raw TAR showed a statistically significant but modest age effect (r = 0.134, p = 0.001), reflecting age-related alpha power decline. The 95th percentile of the normative FOOOF-TAR distribution was 0.498, indicating that the diagnostic threshold of ≥0.45 captures approximately the top 7%–8% of the normal distribution — corresponding to a specificity of 92.3% in this cohort (Figure 4E). Three-zone classification showed that 73%–92% of participants fell in the normal zone across all age groups, with 6%–12% in the elevated zone.
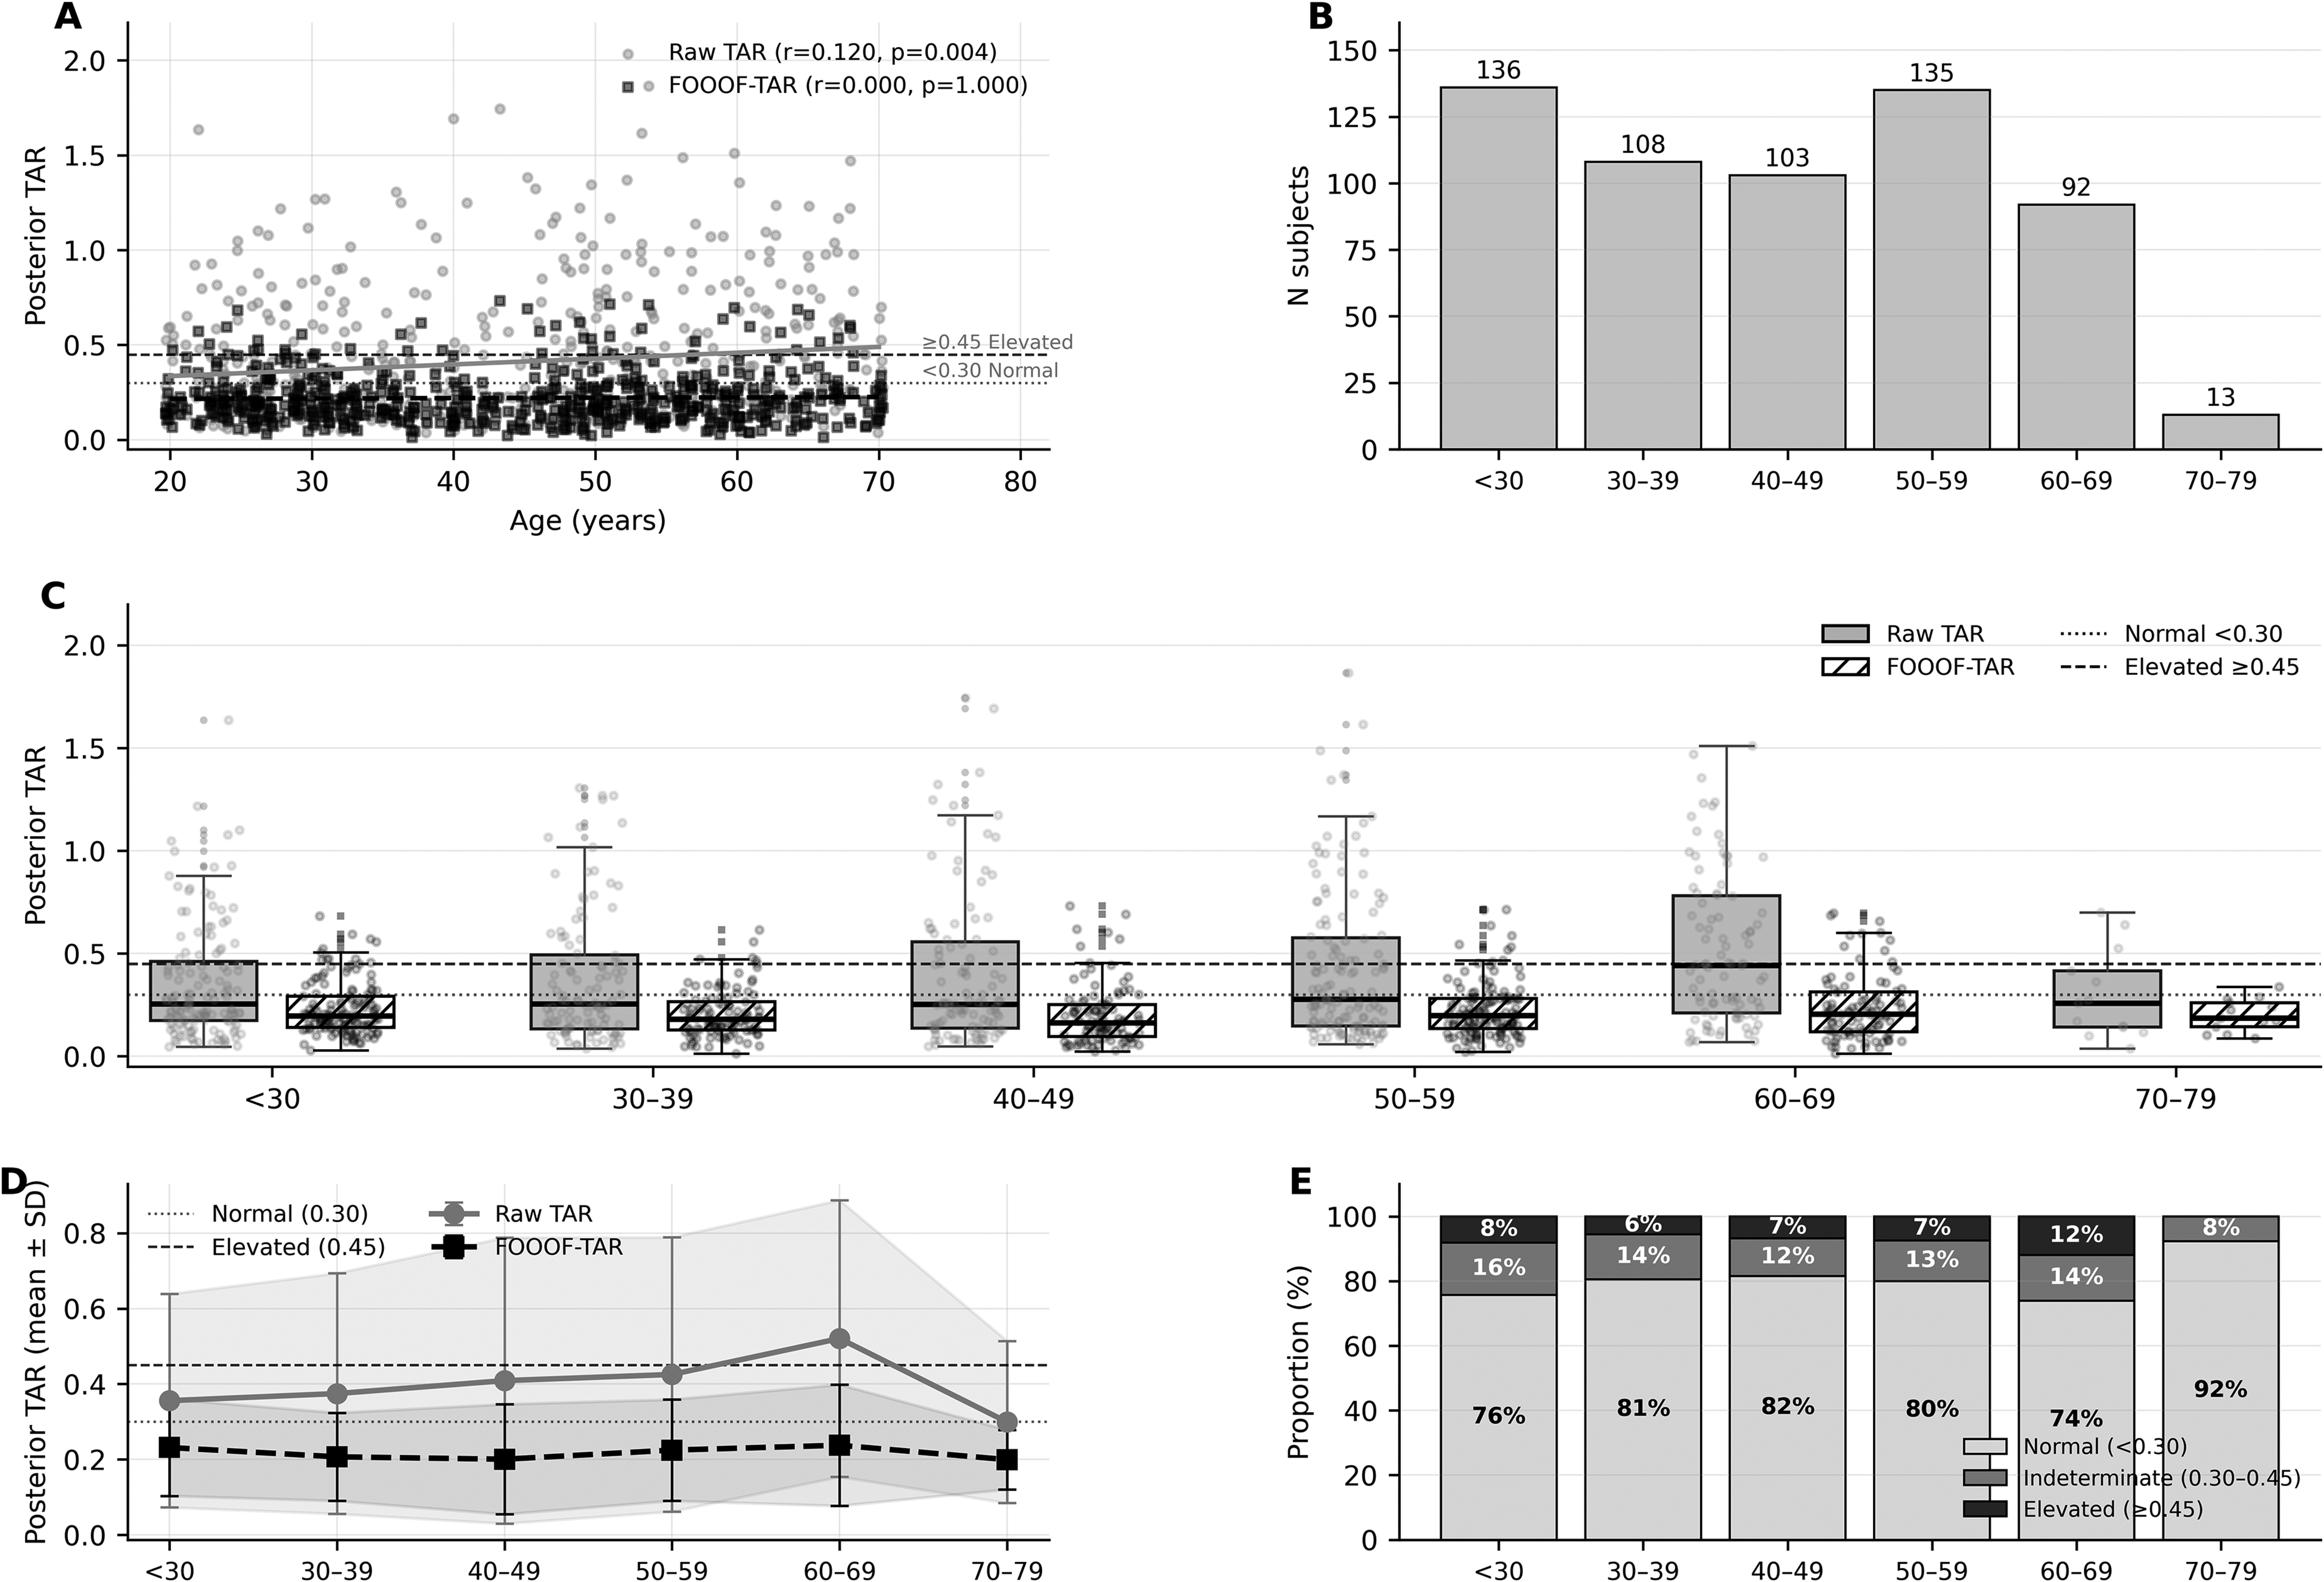
Normative FOOOF-TAR distribution in the ds005385 healthy-control dataset (n = 587 after 3×IQR outlier removal, age 20-79). (A) Age versus posterior TAR scatter: FOOOF-corrected TAR (black squares, Spearman r = 0.000) is age-independent whereas raw TAR (gray circles, r = 0.134) shows a modest age effect. Horizontal lines indicate Normal (0.30, dotted) and Elevated (0.45, dashed) thresholds. (B) Sample sizes per age group. (C) Box + jitter distributions by age group for both metrics. (D) Mean ± SD trajectories; FOOOF-TAR remains flat (0.20-0.24) across all age groups. (E) Three-zone classification (FOOOF-TAR): 73%–92% normal, 6%–12% elevated across age groups — consistent with 92.3% specificity at ≥0.45.
Discussion
This study demonstrated that FOOOF-based aperiodic correction of posterior TAR resolves the fundamental limitation of conventional TAR as a clinical qEEG biomarker: its dependence on the patient's arousal state. The corrected metric — FOOOF-TAR — maintained diagnostic significance across all three arousal segments encountered in routine EEG (AUC 0.701-0.741), improved within-subject stability (ICC=0.945), and generalised to an independent international dataset (AUC=0.830). The complete age-independence demonstrated in a normative cohort of 587 healthy adults further enables a single, universally applicable reference threshold — a critical prerequisite for bedside clinical use.
The mechanism underlying FOOOF-TAR's arousal robustness is conceptually straightforward. As arousal decreases, the aperiodic 1/f exponent steepens, causing a broadband power shift that simultaneously inflates apparent theta power and suppresses apparent alpha power, producing a spurious TAR increase without any change in oscillatory neural dynamics.10,14 By subtracting the fitted aperiodic component before computing the ratio, FOOOF-TAR isolates only the oscillatory contribution, rendering it insensitive to this broadband confound. Importantly, the same mechanism explains why FOOOF-TAR is also age-independent: the aperiodic exponent is known to vary with age, 14 and its removal simultaneously eliminates both arousal-driven and age-driven confounds from the ratio.
The observation that 6%–12% of neurologically normal adults exceeded the ≥0.45 threshold across all age groups is consistent with two well-characterised phenomena. First, low-voltage EEG — a heritable normal variant characterised by constitutively weak posterior alpha oscillations — has an estimated prevalence of 7%–11% in adults aged 20–69, 15 precisely matching the false-positive rate observed in the normative cohort. Posterior alpha rhythm is detectable in only approximately 95% of healthy adults even under optimal recording conditions, 16 and individuals lacking a prominent alpha peak will inherently yield elevated TAR values regardless of cognitive status. Second, when a detectable alpha peak is absent, FOOOF spectral parameterization is known to yield unstable band-power estimates. 17 Together, these factors mechanistically account for the observed false-positive rate without invoking neurodegeneration.
Critically, this false-positive rate must be interpreted in its clinical context. The ds005385 participants were cognitively intact adults with no indication for dementia evaluation. In the intended clinical application — patients presenting with cognitive complaints and objective MMSE decline — the pre-test probability of neurodegeneration is substantially higher, and an elevated FOOOF-TAR carries correspondingly greater diagnostic weight. Concordant elevation of FOOOF-TAR and objective cognitive decline provides a strong electrophysiological signal for further neurodegeneration workup, while a normal FOOOF-TAR in a cognitively symptomatic patient argues against significant neurophysiological deterioration and should prompt consideration of functional aetiologies — including depressive pseudodementia, in which the EEG is typically normal or shows only mild abnormalities. 18 This context-dependence is not a weakness but a fundamental property of probabilistic screening tools, and the MMSE and FOOOF-TAR measure independent dimensions of brain function, making their combination more powerful than either index alone.
FOOOF-TAR functions as a threshold marker of posterior alpha network integrity rather than a linear severity scale. This structure means its primary clinical value lies in its binary discriminative power — normal versus elevated — rather than in tracking continuous severity gradations. Combined with structured cognitive assessment such as the MMSE or MoCA, FOOOF-TAR provides a complementary, electrophysiology-based dimension that is objective, automated, and fully compatible with routine clinical EEG workflows requiring no additional equipment or patient cooperation beyond a standard eyes-closed resting recording.
Several limitations warrant consideration. The primary dataset is relatively small (n = 73) with an imbalanced control-to-patient ratio (1:3). This imbalance may affect the within-subject stability estimates: between-group variance inflates the overall ICC, and the control-only ICC of 0.945, while meeting conventional thresholds for excellent reliability, should be interpreted cautiously given the small control sample (n = 18). Replication in a balanced cohort is warranted. FOOOF fitting requires a detectable alpha peak; subjects without a clear alpha peak may be excluded, potentially biasing toward less severely affected patients. The 3.5% exclusion rate due to FOOOF fitting instability (R2<0.85) is consistent with the known prevalence of constitutional low-voltage EEG (∼7-11% of healthy adults). In an automated clinical pipeline, an unstable fit should flag the record as uninterpretable rather than returning a ratio value, to avoid false-positive elevations on flat posterior spectra. The neurologist should then rely on conventional EEG interpretation and cognitive assessment alone. No independent sleep staging was performed; arousal state was operationally defined by EEG segment position. The cross-sectional design precludes conclusions about longitudinal sensitivity to disease progression. The normative dataset (ds005385) is composed predominantly of younger healthy adults (mean age <50); although FOOOF-based aperiodic removal eliminates the linear age trend across the full normative range (Spearman r = 0.000), the 70–79 decade contains only 13 subjects, providing insufficient power to exclude non-linear age effects or characterise distributional tails in the population most relevant to clinical dementia screening. A dedicated normative reference for adults over 70 remains a necessary future step.
Conclusions
FOOOF-based aperiodic correction of posterior TAR resolves the fundamental arousal-performance trade-off that limits conventional TAR in clinical dementia screening. FOOOF-corrected TAR restored Drowsy-segment diagnostic significance (AUC=0.701, p = 0.014 vs AUC=0.631, p = 0.110 for raw TAR), improved within-subject stability (ICC=0.945), and generalised across an independent external dataset (AUC=0.830). In a large normative cohort (n = 587, age 20-79), FOOOF-TAR demonstrated age-independence across the full normative range (Spearman r = 0.000), with the 95th percentile at 0.498, independently supporting a reference threshold of ≥0.45 (specificity 92.3%).
FOOOF-TAR operates as a threshold marker of posterior alpha network integrity, and its diagnostic value is maximised in clinical context: concordant elevation with MMSE decline strongly supports neurodegeneration workup, while a normal FOOOF-TAR in a cognitively symptomatic patient directs attention toward functional etiologies. These properties, combined with compatibility with routine clinical EEG, position FOOOF-corrected TAR as a practical, arousal-invariant, age-independent tool for objective cognitive screening in neurology outpatient practice.
Supplemental Material
sj-docx-1-eeg-10.1177_15500594261460590 - Supplemental material for Aperiodic Correction of Posterior Theta/Alpha Ratio Reduces Arousal-State Dependency in Routine EEG-Based Dementia Screening
Supplemental material, sj-docx-1-eeg-10.1177_15500594261460590 for Aperiodic Correction of Posterior Theta/Alpha Ratio Reduces Arousal-State Dependency in Routine EEG-Based Dementia Screening by Dokyung Lee in Clinical EEG and Neuroscience
Footnotes
Acknowledgements
The author acknowledges the contributors of the ds004504 dataset: Miltiadous A et al A Dataset of Scalp EEG Recordings of Alzheimer's Disease, Frontotemporal Dementia and Healthy Subjects from Routine EEG. Data. 2023;8(6):95.
The author also acknowledges the contributors of the ds005385 normative EEG dataset: Wascher E, Schneider D, Gajewski PD, Getzmann S. Resting-state EEG data before and after cognitive activity across the adult lifespan and a 5-year follow-up. OpenNeuro. 2024. doi:10.18112/openneuro.ds005385.v1.0.3.
The author used Claude (Anthropic) as an AI assistant to support statistical analysis, code development and English language editing. All scientific content, analytical decisions, and interpretations were performed and verified by the author.
Ethical Approval
This study involved retrospective analysis of de-identified routine clinical EEG data. Ethical approval was obtained from the Institutional Review Board of Seongnam Chung Hospital (approval number: 2026-01). The external datasets (ds004504 and ds005385) are publicly available and de-identified; no additional ethics approval was required for their use.
Consent to Participate
For the primary dataset, written informed consent was obtained from all participants or their legal guardians prior to EEG recording as part of routine clinical care. For the publicly available external datasets, consent was managed by the original data contributors.
Consent for Publication
Not applicable. No individual-level identifiable data, images, or videos of participants are included in this manuscript.
Funding
The author received no financial support for the research, authorship, and/or publication of this article.
Declaration of Conflicting Interests
The author declared no potential conflicts of interest with respect to the research, authorship, and/or publication of this article.
Data Availability Statement
The primary clinical dataset (DS_Seongnam) is not publicly available due to patient confidentiality and institutional data governance restrictions, but requests for de-identified data may be directed to the corresponding author. The external datasets used in this study are publicly available on OpenNeuro: ds004504 (doi:10.18112/openneuro.ds004504.v1.0.5) and ds005385 (doi:10.18112/openneuro.ds005385.v1.0.3).
Supplemental Material
Supplemental material for this article is available online.
References
Supplementary Material
Please find the following supplemental material available below.
For Open Access articles published under a Creative Commons License, all supplemental material carries the same license as the article it is associated with.
For non-Open Access articles published, all supplemental material carries a non-exclusive license, and permission requests for re-use of supplemental material or any part of supplemental material shall be sent directly to the copyright owner as specified in the copyright notice associated with the article.