
Abstract
With the development of Web-based services and related technologies, today’s supervisory control and data acquisition is regarded as an Internet of things service system for industrial infrastructures and ensuring open supervisory control and data acquisition systems in a secure and safe state at runtime becomes a critical and mandatory requirement. Existing host-based monitoring automata are vulnerable because “inside” malware may compromise and subvert the monitoring mechanism itself, and the virtual machine–based monitoring cannot provide observable running traces of the protected services because of the isolation between these services and the runtime monitor. In this article, we propose a non-intrusive solution to guarantee runtime state of open supervisory control and data acquisition systems. In this solution, the running traces of protected services are obtained in an “out-of-box” framework, which is built on abstract execution of network events on Internet of things service models and virtual machine semantic reconstruction of the protected services. In addition, a property checking procedure is employed to check the states of physical devices in advance to guarantee the runtime behavior in compliance with the security policies of open supervisory control and data acquisition systems. In such a way, the solution provides a fine-grained protection for open supervisory control and data acquisition systems and physical devices running in safety.
Keywords
Introduction
Supervisory control and data acquisition (SCADA) systems are deployed worldwide in many critical infrastructures ranging from power generation, over public transport to industrial manufacturing system for monitoring and controlling physical processes through a network of meters and sensors. In such systems, a majority of digital control actions are executed by sensors and/or actuators after the digital commands are converted to sensor signals by programmable logic controllers (PLCs) or remote terminal units (RTUs), while the real-time sensing data are sent to the supervisory system of the SCADA after sensor signals are converted to digital data. With the development of Web-based services and sensor technology, today’s SCADA can be viewed as an evolutionary paradigm, which is being more efficient and wide area, and regarded as an Internet of things (IoT) service system for industrial infrastructures. As the growing of physical threats, cyber-based attacks, and sophistication in critical infrastructure systems, ensuring open SCADA systems in a secure and safe state at runtime becomes a critical and mandatory requirement.
For instance, in a smart grid, one transmission line fault may bring about a chain reaction as well as a final blackout. To prevent power disturbances from cascading into large blackouts requires a real-time and complete visibility of the power system. These informational disconnects must be quickly retrieved and analyzed in such a communication foundation armed with time-synchronized phasor measurement units, phasor data concentrators, and so on.
The GridStat (Washington State University) project 1 took a publish/subscribe paradigm to build the communication foundation for smart grids to deliver coherent and real-time data, where a data consumer is able to describe his or her interest by subscription without being aware of who produces the data, and a data producer publishes his or her data without being aware of who subscribes the data. The customer’s subscription is defined by an event name, called topic, and the communication foundation delivers data with the “event name” to the subscribers. Although GridStat researchers gave the communication architecture for smart grids, they did not discuss security issues of such foundations as well as corresponding impacts on services running over the foundations.
Before addressing these security issues, some system models should be established because the semantics of these command events are always bounded to a specific system. Figure 1 shows a publish/subscribe-based open SCADA system including six services, which are acquisition and estimation (AE), event analysis (EA), human machine interface (HMI), control agent (CA), resource model (RM), and warning service. And there are two security requirements in such a system:
The control actions may be sequentially executed through the communication foundation. But adversaries may interweave these command events (messages) to endanger the system.
Adversaries may launch an invalid action to endanger some devices. It is mandatory to make runtime verification (RV) to ensure that the system devices will be safe after executing the actuation command and the event is really published by a valid launcher.
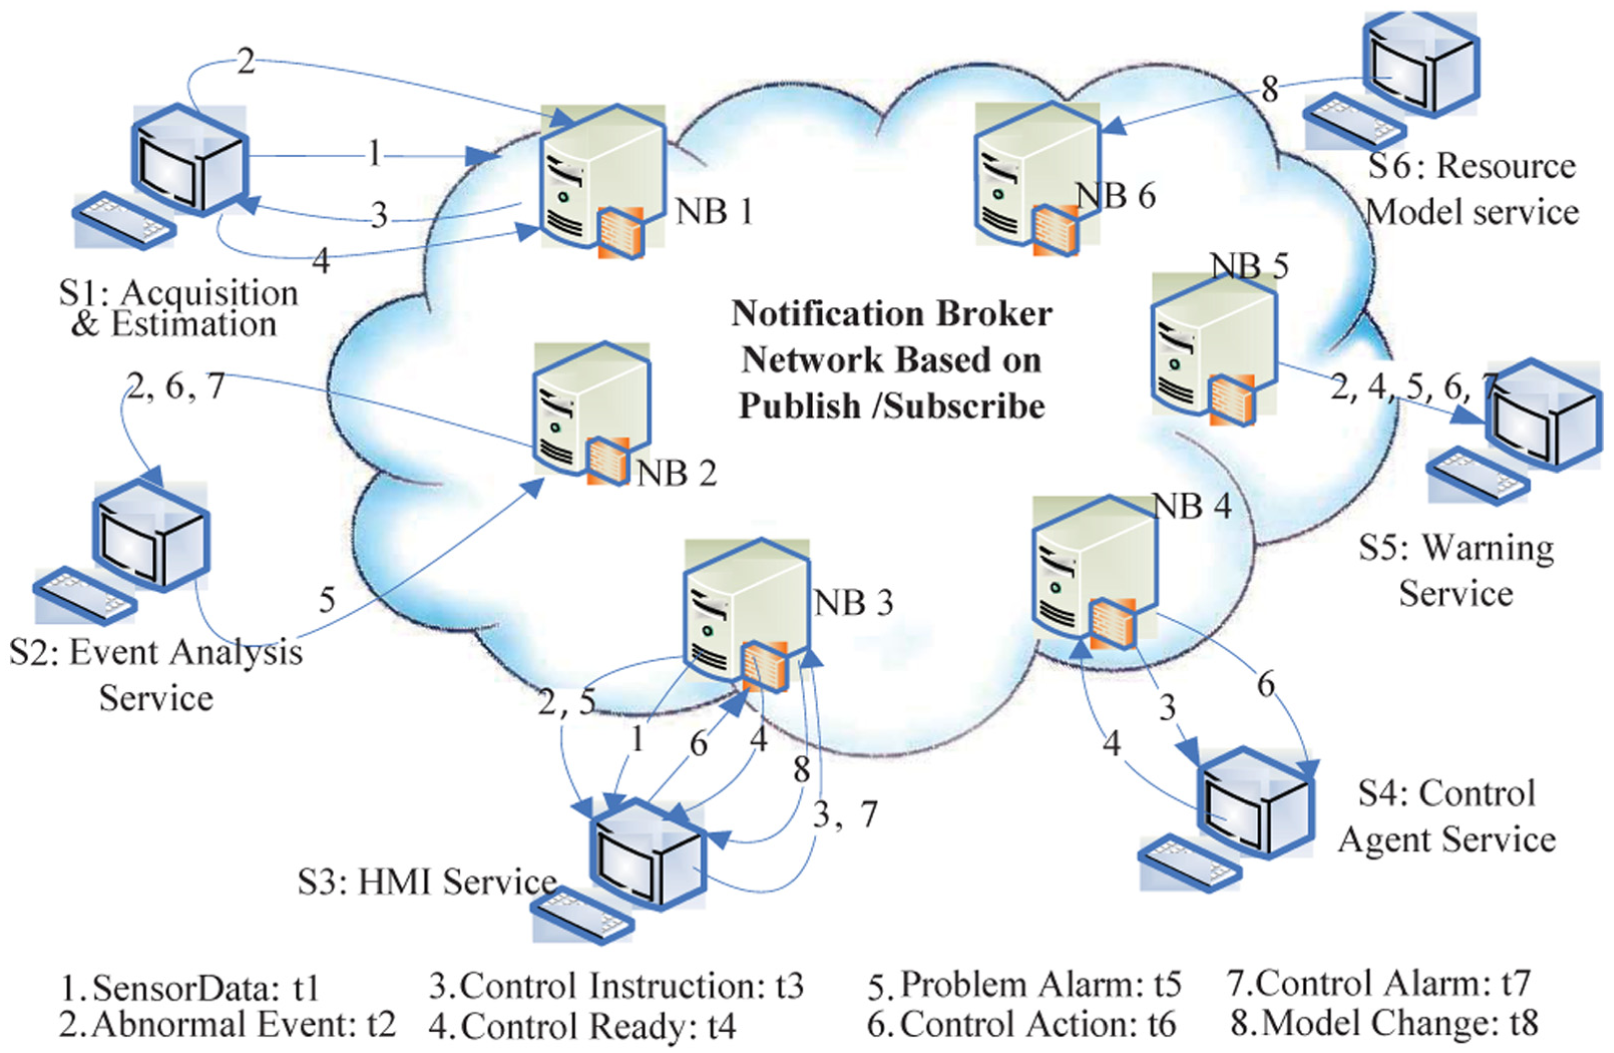
Control-related services in a SCADA system.
In traditional host-based studies on protecting running systems, runtime monitors were often embedded in the protected system as a function of it to check and modify its each action according to security policies, or were running according to the logs of the protected system, which may be subverted by malware inside the system (Figure 2(a)). To address this problem, recent solutions based on VM technologies advocate placing runtime monitors outside the VM (Figure 2(b)). But the existing virtual machine introspection (VMI) 2 and semantic reconstruction 3 methods could not directly provide a desirable security guaranteeing because of the complex protection goals.

Host-based VS VM-based runtime monitor approach: (a) host-based runtime monitor and (b) VM-based runtime monitor.
To implement non-intrusive runtime monitoring and enforcement, we propose a protection framework based on VM technologies consisting of four functionalities: Abstract Execution, Refine State, Behavior Checking, and Property Checking. With the framework, we can guarantee that the SCADA services run in accordance with system specification and the local physical devices work in safety. Our contributions are as follows:
A non-intrusive monitoring. A protection framework using VMI methodology and semantic reconstructions is proposed, which is non-intrusive by isolating the monitor from the protected system. In such a framework, the runtime performance of protected system is not affected no matter what the runtime monitor does such as making observation, checking, and recovery.
System traces extraction in an “out-of-box” framework. In our protection framework, because the target SCADA services are running in a VM and the monitor is running on the host, the existing enforcement monitors are unable to directly observe the actual executions of target system. In this article, we presented a method to extract the running traces of target system running in a VM out, which considers both actual partial traces in VM and real-time simulated traces on service models.
Security policy enforcement based on trustable actions. To implement the runtime enforcement monitoring, we obtain the refined simulated traces by Abstract Execution and Refine State. However, these traces may not be the same as actual ones of system, which means the traces may include some forged events or invalid events. If we directly enforce security policies on these events, the judgment may be unreliable. So, we construct a set of trustable actions according to some rules, and all events in the set are considered to have occurred actually. Then, we implement the runtime enforcement using mandatory results automata (MRAs)4,5 with constraint on the trustable actions.
This article is based on work first presented at the IEEE International Conference on Web Services in 2015. 6
Preliminaries
IoT services
In an open SCADA system, there are multiple resources involved and multiple IoT services coordinated to complete the overall functions. We use Communication Diagram of UML2.5 7 to depict the specification of interactions among the IoT resources and services.
A communication diagram consists of a set of Lifelines (or Objects) and a set of Messages associating with different lifelines. It mainly focuses on the interaction between Lifelines. A message is a communication between a sender and a receiver. This communication involves two events: the event of sending the message and the event of receiving the message. And every message is labeled with a sequence expression which denotes the possible occurrence order of each message.
For example, we give a communication diagram in Figure 3 to demonstrate a remote control procedure and data acquisition procedure in a simplified SCADA example. In Figure 3, there are four threads collaborating to complete services interactions which are, respectively, labeled with prefixes A, B, C, and D, and the interactions with a same prefix occurs in order. In addition, the event marked with prefix “/”, for example,

Communication diagram for a simplified SCADA example.
Definition 1
A communication diagram
O is a finite set of lifelines or objects;
M is a finite non-empty set of messages among objects, and each message corresponds to a sending and receiving events pair;
E is a finite non-empty set of events;
S is a set of sending events and R is a set of receiving events, where
→ is a total order on M, describing the occurrence order in which the interactions take place;
Semantic reconstruction
To realize non-intrusive protection mechanisms, some technologies based on VM technologies are used to place runtime monitors outside the protected VM. 3 Such monitors adopt the VMI methodology to acquire low-level VM states externally.
Garfinkel and Rosenblum 2 describe VMI as a non-intrusive approach to inspect a VM from the outside and analyze the software running inside it, which can inspect the low-level VM states from the hypervisor level without perturbing the VM’s execution. This mechanism is supported and facilitated by a hypervisor or a virtual machine monitor (VMM), which is a thin layer of software that allows an operating system (OS) to run as a guest in a VM while maintaining control of the physical resources. A VMM provides the abilities of virtualization, isolation, and inspection. With such a VMI-based architecture, the VMM is able to gain a complete and untainted view of all system states in a VM.
When the (binary) low-level VM states are externally obtained, semantic reconstruction should be carried out to get the (user-readable) semantic-level view of the VM to bridge the semantic gap between machines and end users. Some object templates of guest OS are used to interpret these low-level VM states. For example, using guest memory data structures such as process control blocks (PCB) and functions as a template to link to the physical memory pages allocated to a VM by the VMM, each individual running process in the VM can be externally reconstructed.
Because the semantic reconstruction operation is externally carried out outside the target VM, any software running inside the VM cannot affect the external reconstruction of VM semantic view, where the VMM itself is assumed to be secure or armed with some enhanced hardware. Malware is able to compromise arbitrary entities and facilities inside the VM and subvert anti-malware systems residing in the guest host. However, it is not able to break out of the VM and tamper with the reconstructed view.8,9
Basic framework
The non-intrusive solution based on an “out of the box” approach has a framework in Figure 4, where there are one or more multiple IoT services deployed on a VM, multiple VMs holding different IoT service instances are connected by the communication foundation and collaborate to manage the physical industrial infrastructures. These IoT services publish and subscribe real-time data events, alarm events, and control command events by
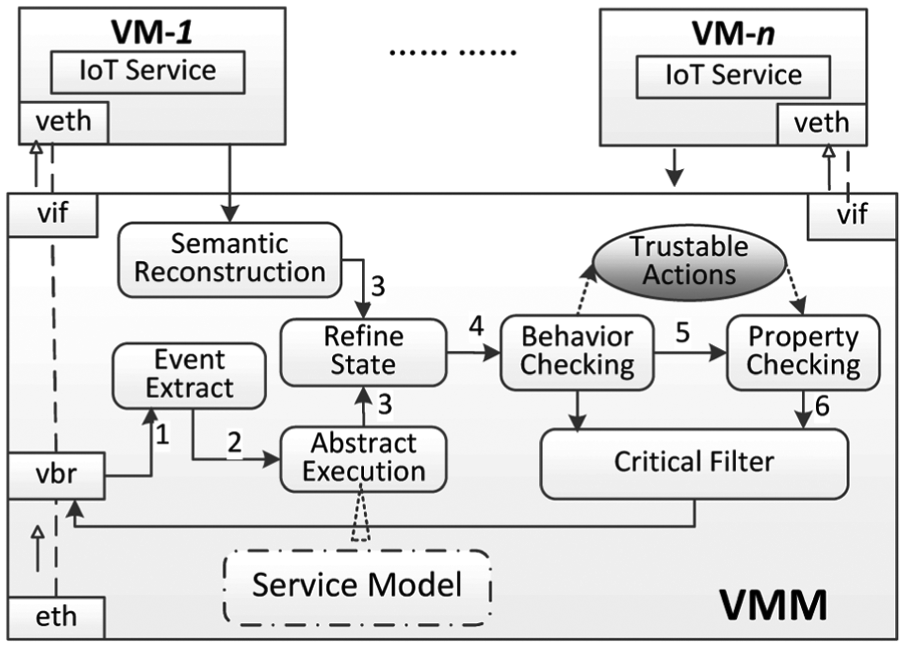
The protection framework for open SCADA systems.
The framework works on the hypothesis that
The data on local point-to-point communication channels from local devices (e.g. PLC) to VMM are trustable (impossible to forge by attackers) because local devices often communicate with local servers with cables connected to serial port and information transmitted on the cables are encapsulated with standard industry protocols, for example, ModBus, where the communications are often limited in a local area. So, we think the data transmitted on the cables are actually from the connected RTUs or PLCs.
The sensor networks are implemented with protection mechanisms such as redundancy to provide trustworthiness of the reported sensor data, which means that the security in sensor level of such SCADA systems is not our focus.
However, for other communications in an open environment, for example, a remote control command from Remote Control Service, malware may forge such commands and issue them to actuators or sensors and then control or even endanger the physical devices. Such actions must be verified to be compliant with desired system security specifications before they are issued to field devices. If the verification makes a policy violation verdict, the command/event is considered to be harmful to the whole system and should be filtered or discarded to avoid making damage to local physical devices. In such a way, the field devices in local area network are guaranteed to be in safety. In addition, because SCADA services are transplanted to run in VM and introspected by VMM, the software’s reliability is also achieved.
The basic working process of the monitor is as follows:
All VMs run by the VMM have their own virtual Ethernet cards whose communications are all through a virtual network bridge (vbr). Our monitor intercepts Internet packets on the vbr and then uses the Event Extract procedure to extract events from/to the protected IoT services.
According to the extracted events, the monitor symbolically executes IoT services based on the IoT service model. Then, an Abstract Execution procedure arranges these extracted events to get each service trace.
The service trace estimated by the Abstract Execution procedure is often coarse because one event may be subscribed by multiple services, and some human operations and inner states of services are not observable. By the semantic reconstruction of VM, we get the snapshot of the service instance.
According to the snapshot, we refine the service traces in the Refine State procedure. All events considered to have occurred are inserted into corresponding traces. The traces after multiple cyclic semantic reconstructions and Refine State procedures are actual or approximate to actual ones.
If a milestone event is extracted from vbr, it triggers the VM semantic reconstruction immediately and a Refine State is carried out with a following Behavior Checking procedure to estimate whether the causality and conflict relations about the event are satisfied by considering interactions among traces, for example, for a receiving event, there must have a corresponding sending event occurred.
If the Behavior Checking returns False, a Critical Filter procedure is carried out to discard the intercepted milestone event because it is not consistent with the behavior specification and then the monitor gives an alarm to operators.
If the Behavior Checking returns True, a Property Checking procedure is invoked to check whether the current executions (or traces) accord with security policies, for example, some operation must be authenticated. Only actions satisfying the policies are emitted, while actions violating the policies are prevented, such that all executions will be enforced as valid.
Traces simulation and refinement
RV10,11 (also called runtime monitoring, runtime checking, runtime analysis, dynamic analysis, etc.) is a lightweight and successful technique to monitor behaviors of a running system and possibly reacts to observed behaviors satisfying or violating certain properties. When the target program is executed, the monitoring system observes the execution traces of the program and checks specification fulfillment or violation.
In our protection framework, because the target SCADA services are running in VMs and the monitor is running on the host, the actual traces are difficult, or even impossible, to be observed directly by monitors. So, we obtain the simulated system execution traces by abstractly executing network events on IoT service models and then refine the traces according to partial traces from VM semantic reconstruction. After events on a service trace are identified, the events should be verified in compliance with the global system behavior specification. We accomplish this work by the following procedures.
Event extract
To share events among different IoT services, events are named, for example, assigning a topic name to each kind of event. For example, given an event
The Event Extract procedure is as follows:
With packet filtering tools, all IP packets through the VMM’s vbr can be intercepted and interpreted.
According to the name trees, only the root name in a tree is sought in the packets in order to keep high throughput. The soundness lies in that all event names include its root name. When no matching happens, the packets directly go through without further processing. Otherwise, go to step 3).
Identify events from the packets with the event schema binding to the event name.
Abstract execution
After one event is extracted in the Event Extract procedure, the event is recorded to abstractly execute and only milestone event triggers further actions in the monitor. For each extracted event, we symbolically link it to the defined IoT service model to get simulated traces. This procedure uses an event as an input to link it to the service models without executing its successors because we just want to know what had happened, for example, the dependent events of an action should have occurred, where the subsequent actions are not taken into account.
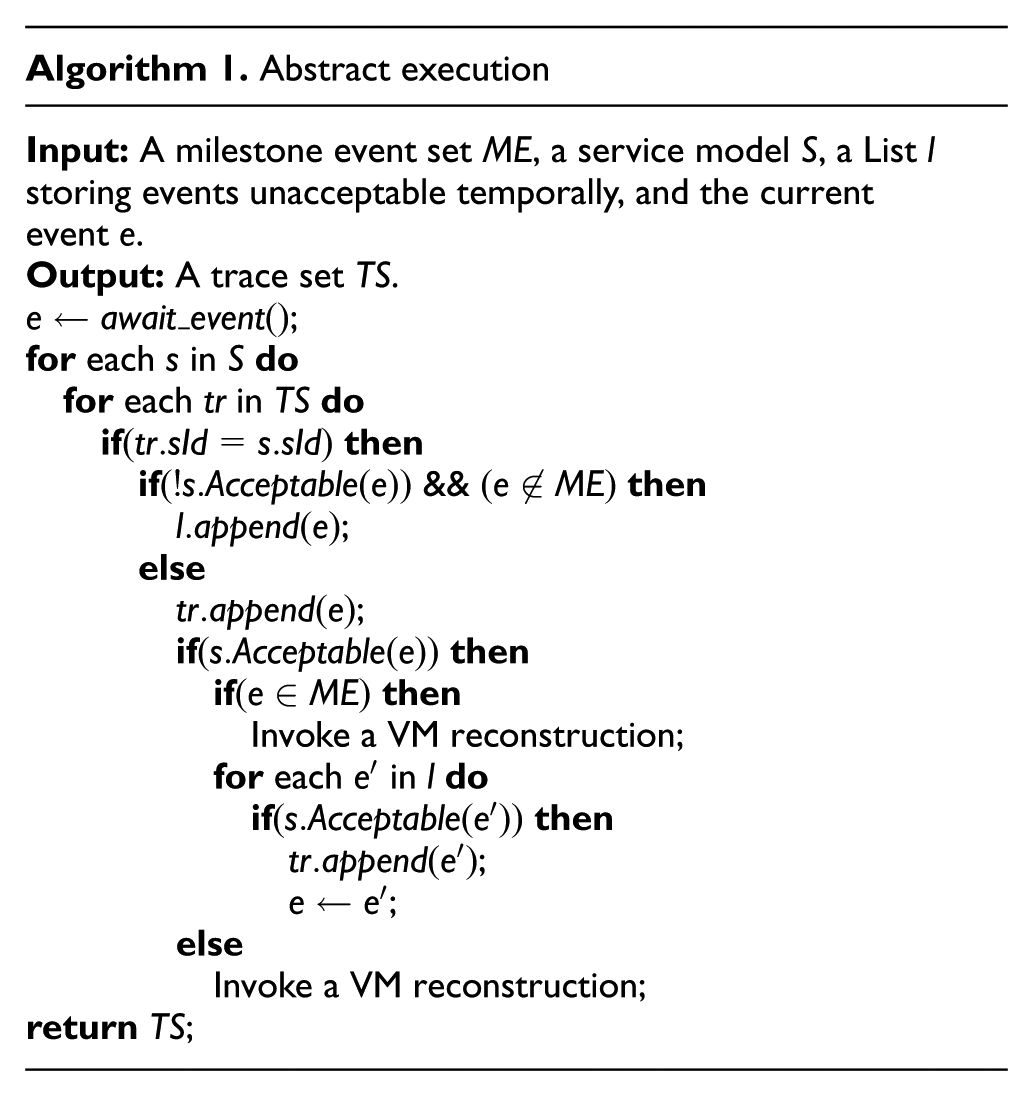
The basic procedure of Abstract Execution is as follows:
For one event e extracted from vbr, dependency relations of e in one service are checked whether its preceded events have occurred according to the total relation in the communication diagram. If this is the case, the event e is linked to the related service traces and go to step 4. Else, go to step 2.
If the event e is a milestone event, it is linked to the related trace and immediately triggers a VM semantic reconstruction to extract the current state of the running services out.
If e is a non-milestone event, we put the event into a fixed length list l temporally and process it later.
After one event is linked to the corresponding trace, previous unprocessed events stored in the list l are searched to find the direct successor
Repeat the above steps, the service traces will be simulated as more and more events are processed.
Algorithm 1 shows the procedure. In this algorithm, primitive
Refine state
The traces output by the Abstract State procedure may be not accurate because of the complexity of IoT models and non-credibility of events in open environments. The Refine State procedure is responsible for refining them with semantically reconstructed services’ runtime state which is retrieved from VM’s memory snapshot and is trustable. By semantic reconstruction of the running VM, runtime states of all running service instances are profiled, for example, which process is running in the VM memory and which subroutines of the process are in calling at the moment. When the onset of a semantic reconstruction is coming, the data in memory of the running VM are acquired and dumped through memory acquisition tools, for example, libVMI, 12 and the dumped memory is semantically reconstructed with digital forensics tools, for example, Volatility. 13
In our solution, a dynamic and volatile data acquisition and analysis is adopted to reduce the time consumed in semantic reconstruction. After the VM’s memory is acquired, current states of all running services are externally reconstructed from the memory snapshot of one or more VMs. The reconstructed runtime state of each process is stored in a stack structure and corresponds to a partial trace of the corresponding service model. Then, the current simulated traces are refined with the reconstructed traces according to the following rules for Refine State:
All subroutines or functions in calling in a given process stack space are reconstructed from a VM snapshot and stored in a stack structure stack as they are in the process stack space.
Getting the top element e from stack, all events preceded e in the corresponding trace tr are considered to have actually occurred, which are marked to be trusted.
Repeat the above two steps until all traces tr in the trace set TS are refined.
The process is described in Algorithm 2. In the algorithm, method

Behavior checking
The Behavior Checking procedure is responsible for further verifying whether the current service traces are in accordance with the system behavior specification, for example, relations among events in different services are in compliance with the system specification. In this procedure, we first further refine some discontinuous trace to be more complete and then check causality and conflict relations defined on milestone events among different traces.
In the Refine State procedure, each trace is checked and refined according to the corresponding reconstructed runtime state. Because memory is always changing dynamically, the memory semantic reconstruction may not return desired results needed by Refine State at some time. For example, the desired function/event has just finished its running, and the related information has been popped from the stack space, which cannot be semantically reconstructed by analyzing the current stack frame.
In many cases, different services often interact with each other to accomplish some functional operations. If the event is interactive between two processes, we may find it in the stack space of another process, and a trace includes the event can be constructed. In such a case, it is obvious that if there is a sending event send(m) in one trace, there should be a receiving event recv(m) in another trace. And if the event recv(m) is confirmed to have occurred, the event send(m) can also be confirmed.
From the procedure of Abstract Execution, we can see only milestone events are linked to related traces even though preceding events of them did not occur in the simulated traces. If the milestone event or these missing events are reconstructed from the VM memory snapshot, the trace is to be completed by the Refine State. Otherwise, the trace becomes discontinuous for the service model. So, we first further refine the traces to get them more complete following the steps below:
For an milestone event
If the event is found, the milestone event in tr is confirmed to be trusted and its preceding events are inserted into tr.
Repeat the above steps, until all traces are processed.
This process works on the basis of correctness and reliability of the running VMs, which can be ensured by monitoring and clearing exceptions on system call table, active process list, and network ports of running VMs using VMI methodology.
After the traces are processed, we verify whether they are in accordance with the global behavior specification (causality and conflict relations) of the system. Taking all events in the traces and specification into account may be time-consuming and unnecessary. Thus, we only consider behaviors of milestone events so as to reduce the time consumed.
To check causality and conflict relations among milestone events, current traces including milestone events are grouped first. Then, the traces in one group are connected by the order of event occurrence in one service and sending-receiving relation in different services, where each event is a vertex (multiple events with a same name are drawn as a vertex) in a directed trace graph and edges are their causality. When the graph is constructed, all non-milestone events are removed and edges are merged to get a pruned directed graph. After that, we check the edges in the graph in accordance with the defined causality relations, as well as the vertexes in accordance with the conflicts.
For an event satisfying system behavior specification, Behavior Checking procedure returns True and transfers the event to Property Checking procedure to further verify it. While for events not satisfying conditions, the monitor may simply discard the event and returns a False, or involve in an operator intervention to decide whether a Property Checking is needed. These options (Pass, Discard, Operator intervention) can be defined in detail in a configuration according to different events and security levels.
Property checking and enforcement
In the Traces Simulation and Refinement section, the system traces are simulated by abstractly executing network events, refined by services’ partial traces reconstructed from VM memory, and each milestone event in refined traces is checked to satisfy the system behavior specification of an SCADA system. This checking is coarse, and it cannot indicate whether the execution of the event will endanger the system or satisfy the system security specification because it does not take the contents of events and effects of them into account. When the behavior checking returns a True verdict, it may be one of the following cases:
The current event is an actual and valid event of the SCADA system, which satisfies the system specification and should be executed by IoT services or field devices normally;
Or, the event is an actual event from the SCADA system but may endanger the system, for example, the event violates the desired security policy, which must be prevented to continue;
Or, it may be a forged event from adversaries, which must be prevented when it is dangerous, for example, one malicious event issued to sensors to set water pressure with a value exceeding the limit.
So, the following work is how to ensure the execution in compliance with the system security specifications and avoid the dangerous operations on services and physical devices. This can be fulfilled by runtime enforcement monitoring.
As previously mentioned, in our protection framework, the actual traces are difficult to be observed directly by monitors such that we construct refined traces by abstract execution and VM semantic reconstruction. However, the refined traces are considered approximately, but not the same, as the actual ones. So, the existing verification mechanisms that consider only action sequences of current executions may not work well in such a situation.
In order to implement such verification on the basis of some proven work, we introduce the term trustable actions, which means the actions are trustable (or actual) to the system. The trustable actions may be different according to different policies. Note that the word “trustable” here just means the event has actually occurred, and it is an actual action in the trace of corresponding service.
Given a set C of trustable actions, the actions in C should be one of the following cases:
Event e exists in the process’ memory space and has been profiled by VM semantic reconstruction;
Event e is from the serial port which is connected to field devices, for example, PLCs, through a cable using one industrial protocol;
If there is a trustable alternative event
Figure 5(b) shows how we think of a monitor interposing on and enforcing the validity of actions executed to secure target systems. The idea is based on MRAs in Figure 5(a),4,5 which is proposed by Dolzhenko, Ligatti, and Reddy to model the RV of applications. MRAs take both input actions and output actions into account and enforce security policies by transforming actions and results of these actions with an Executing System. MRAs make no limitations and assumptions about how the Executing System produces and transforms results for input action. It is suitable for us to exploit appropriate transformations to ensure actions actually executed are valid.
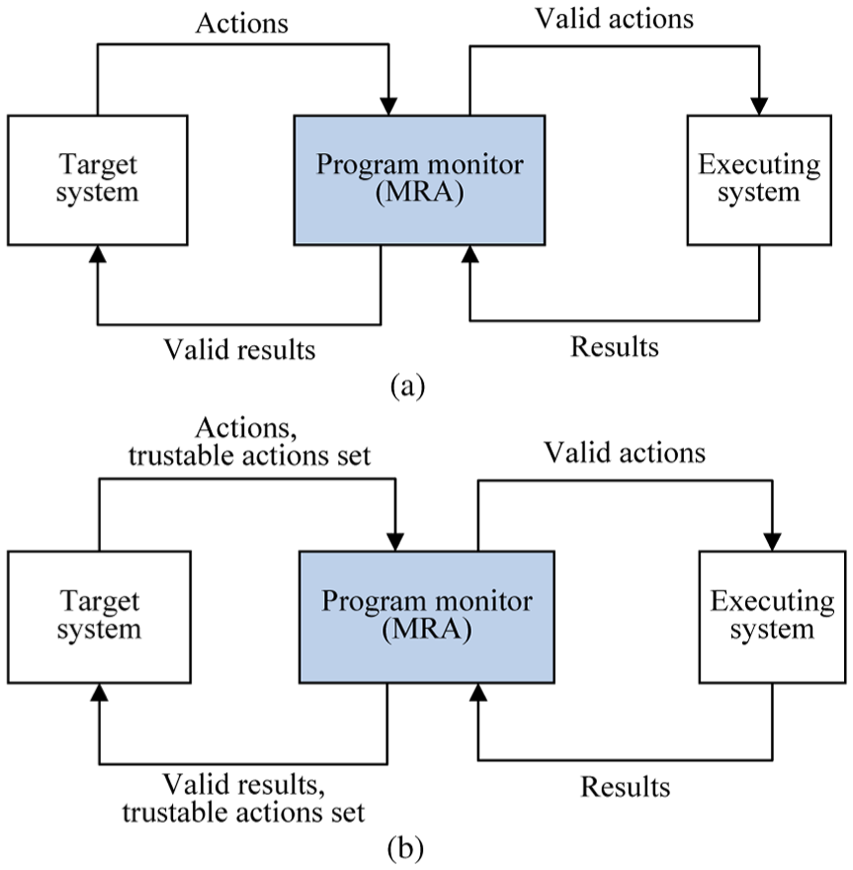
Monitoring mechanism based on MRAs: (a) monitoring mechanism of security monitor MRA and (b) security monitor MRA based on trustable actions.
Like other security automata and edit automata, MRAs take all observed actions from target applications as input to the program monitor, where it does not consider the possible forged events attempting to operate on systems. The difference between our mechanism and the original MRAs is at the point of input actions (to monitor) and results returned (from monitor). We take actions in refined traces and a trustable actions set as input to improve the reliability of monitoring. Similarly, MRAs take results of input actions as output, while we consider the updated set of trustable actions as well as the results.
Definition of MRAs with constraint
Here, we present the basic notations and definitions of MRAs defined on constraint of trustable actions and detail how the automata enforce security policies on open SCADA systems using two examples.
A system is abstractly defined in terms of the system actions A and the possible results R of those actions, where R disjoints from A. An event may be an action or a result. An exchange is a pair of event
Definition 2
Given a trustable action set C, an MRA M with constraint on C is defined as a tuple
E is the event/action set over which M operates, and an event
Q is a computable set of automaton states;
The operational semantics of the monitor is the same as that of MRAs whose definition of single-step semantics is as Figure 6.
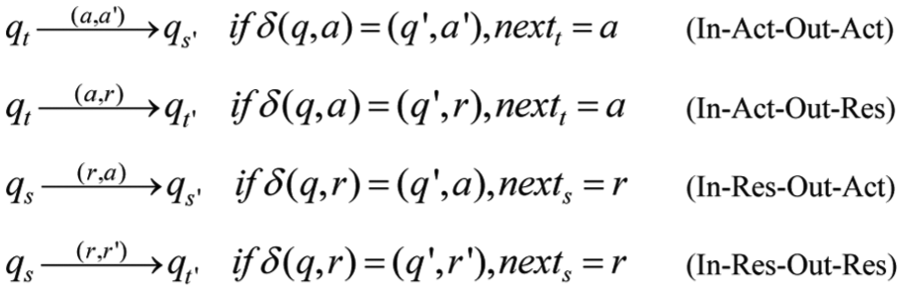
Single-step operational semantics of MRAs.
Enforcement examples
We give two examples about how the MRAs with constraint on trustable actions to work and enforce policies.
Example 1
Consider a simple remote control service in a simplified SCADA system for turning on/off breakers. Assuming the service contains the following three methods:
login(), it is for users to log onto system, which is an inner action in the service;
commandStart(object = BreakerId,control = ON), sends a remote control command out to field devices, which is the START of the remote control operation;
commandEnd(object = BreakerId,state = ON), receives execution result of commandStart from field devices, which represents the END of the control operation.
Suppose we wish to require that the on-off operation on one breaker should not be more than three times in 5 min. Intuitively, the desired policy is about two attributes time of events and execution rounds of the service.
In the remote control service of SCADA system, if a control action CommandStart is sent out, it must wait until the corresponding result CommandEnd returns from the controlled device or a timeout is coming. If the result returns from the controlled device, it would be uplinked to the serial port of computer through a cable, which we consider should be an actual event from physical devices and be trustable. So, we insert this result event into the set of trustable actions. Particularly, after the result CommandEnd is marked trustable, the corresponding CommandStart can be also marked which means it has been executed actually.
Associated with each event e, suppose there is an attribute time of e recording the occurrence time of e and attribute count recording the number of times that e has been executed. An event e may go through and be executed if one of the following holds:
The count of current event e.count is no more than 3;
The count is more than 3, but the duration between event e and the latest two events
The policy

where
An MRA monitor
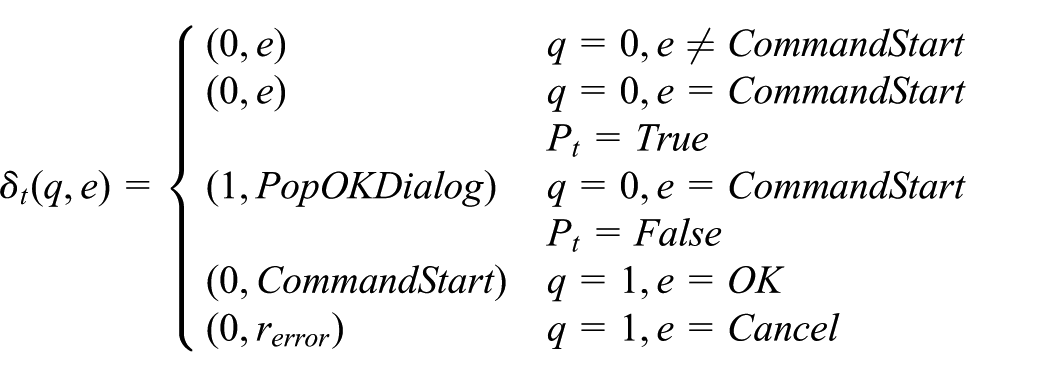
If
In this example, we can ensure the states of physical devices are enforced in safety by the automata
Here, we give another example.
Example 2
In a remote control service, any remote control action CommandStart should be authenticated. It is known that many actions are expected to operate with authentication or a login step because of the security requirements of such systems. If some adversary forged an action to control the physical devices, we should check whether the event is launched by a valid service before it is executed. If it satisfies the policy, the event will be output as original to be executed. Otherwise, we consider the event may have bypassed the SCADA system and should be prevented.
Obviously, a remote control action may be emitted and executed if there is a trustable login action before it. Because login is an inner action, we can get a trustable one from VM memory by semantic reconstruction and the policy can be established on the trustable actions set. Given a remote control action a, the policy
Given MRA

The function works as expected:
From Example 2 we can see, if there is no trustable login from memory, an input event sequence
Testing and evaluation
Figure 7 shows the overall process of the non-intrusive solution to open SCADA systems as well as the relations among different components of the protection framework.
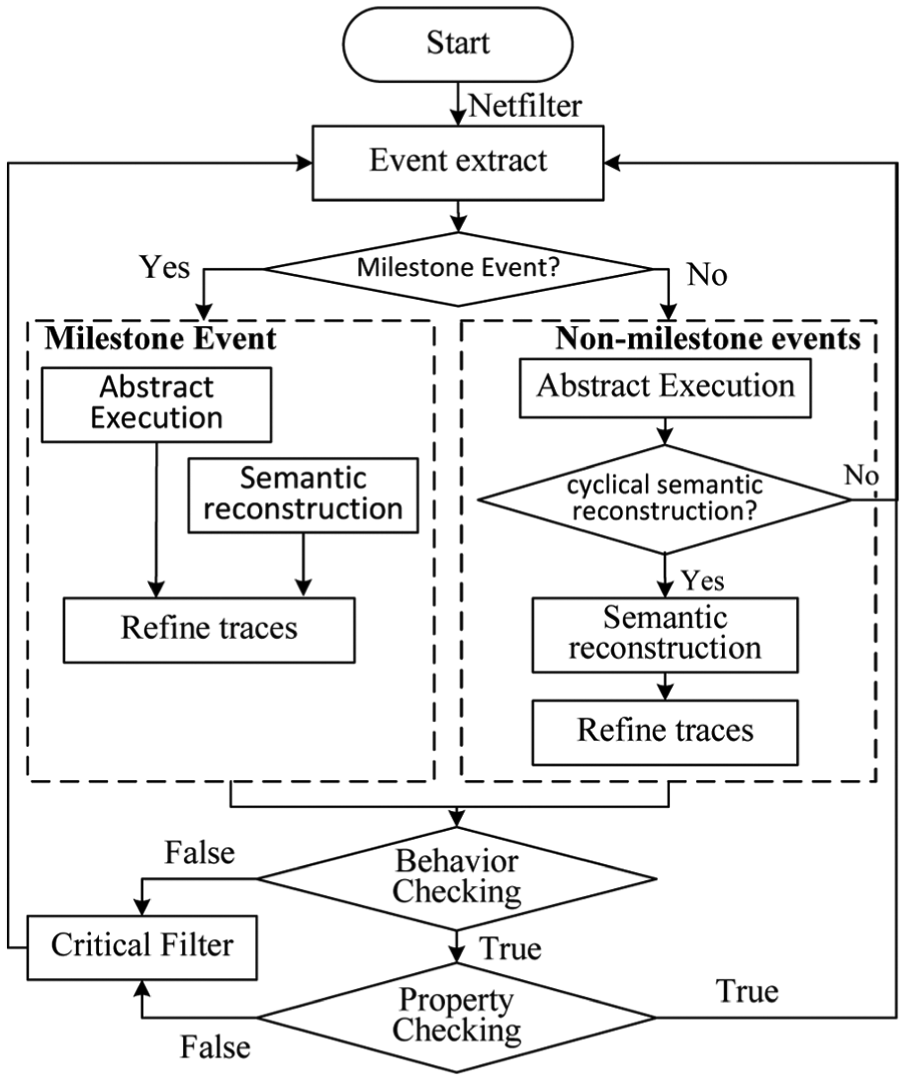
The overall process of the non-intrusive solution.
Experimental analysis
The experiment environment is established as follows. The server, responsible for receiving events, abstractly executing the events, and proceeding the checking procedure, is running in a VM on host
Sends sequential events according to their occurrence in traces;
Sends out-of-order events not according to their occurrence in traces;
Sends sequential events, as well as randomly sending some milestone events using another thread to simulate the malware’s vicious operation.
Our monitor works in host
Netfilter is a framework provided by the Linux kernel that allows various networking-related operations to be implemented in the form of customized handlers. Netfilter represents a set of hooks inside the Linux kernel, allowing specific kernel modules to register callback functions with the kernel’s networking stack. The basic procedure of matching event topics in the modified Netfilter is as follows:
When an IP packet is captured, the protocol type, for example, TCP or UDP, of the packet is obtained according to IP packet header.
After the type of the packet is determined, the data length in the packet is computed out and the data are extracted out.
According to the predefined XML rules, such as the minimum size of an XML messages, the format of XML labels, whether the data is a valid XML message from/to our system is parsed out.
If there is a valid XML data, the labels of <title> and </title> in XML are matched and then the topic title of the event is extracted out.
Figure 8 shows time spent on event extraction and checking procedure, which represents the packets processed per second with different packet lengths. We experiment with packets length about 100 bytes, 300 bytes, and 500 bytes and record the processing time for 19 times. From Figure 8 we can see that the number of packets process per second is to be less as the packet’s length goes up. In multiple experiments with sending events from the client continuously, there is no packet loss and all events not satisfying the behavior specification are prevented.
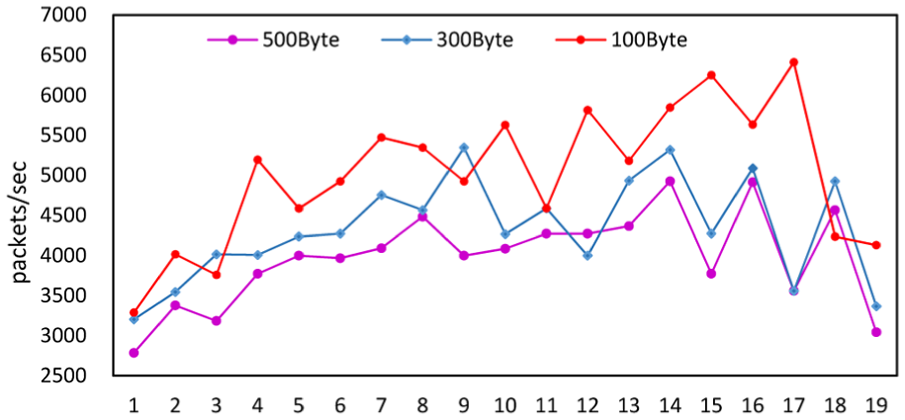
Time spent on event extraction and checking.
Semantic reconstruction
We use Volatility, 13 a memory forensics tool, and LibVMI, 12 a VMI library, to implement the VM semantic reconstruction. LibVMI provides primitives for accessing the memory of a running VM using physical or virtual addresses and kernel symbols, which also supports accessing memory from a physical memory snapshot. Volatility is an open-source forensic memory analysis framework for extraction of digital artifacts from volatile memory (RAM) samples, allowing us to add or modify plugins as we need to make an analysis on memory dump.
We can access the stack address space based on the kernel memory structure
By traversing the active process list
With the mm member of
Reading and decoding data in corresponding areas (with Distorm3), all contents are extracted and rendered to output.
Volatility provides a plugin
The experimental environment of semantic reconstruction is listed in Table 1. In this experiment, we cyclically analyzed a stack space of a fixed size 0 × 400 and 0 × 800 separately and matched reconstructed functions’ addresses to their names according to assembly code. Figure 9 shows time spent on VM semantic reconstructions about 1000 cycles. We did not set the reconstruction cycle in the experiment. The reconstruction was done continuously. From Figure 9 we can see that there is no distinct difference between the peak times consumed in two reconstructions, which depends on the number of functions in calling of the process.
Experimental environment for the semantic reconstruction.

VM: virtual machine; OS: operating system; VMM: virtual machine monitor.

Time consuming on semantic reconstructions from process’ stack address space.
After the functions are found, we align the functions’ names according to the order of their execution, as well as removing functions we never concern, to form the partial trace of the process. And all partial traces are used to refine simulated traces output by Abstract Execution according to the service identifiers.
Time complexity of algorithms
Because the efficiency of the algorithms depends on specific system and the size of inputs, we make an analysis on each algorithm to get its time complexity in the worst case.
Assuming that m represents the number of milestone events, where
For the Abstract Execution algorithm, all traces are searched according to the service model to whether the event e can be linked to it. In the worst case, the search time is
In Algorithm 2 Refine Traces, all traces in the simulated trace set are refined using the reconstructed runtime state. For each reconstructed partial trace, the top element
So, the time complexity for the whole trace simulation and refinement procedure is to be
Enforcement analysis
To process a sequence of
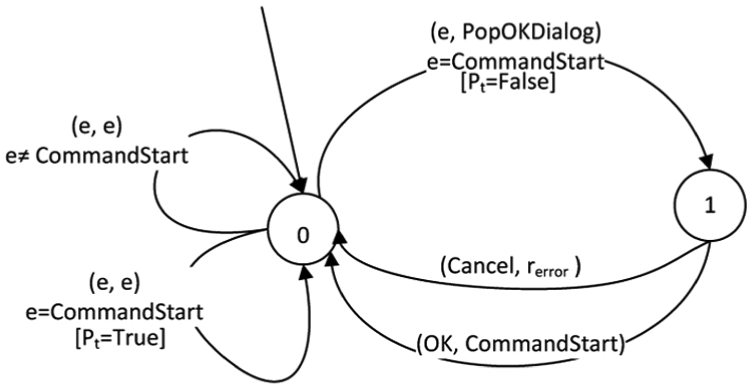
Automaton for policy
From Figure 10 we can see that as long as
From the process of automata
Figure 11 depicts an automaton for policy

Automaton for policy
Related works
VMI has been a critical part of many recent virtualization-based approaches to security. By running vulnerable systems as VMs and moving security software from inside the VMs to outside, the out-of-VM solutions securely isolate the security software from the vulnerable system. First introduced by Garfinkel and Rosenblum, 2 introspection allowed security software to gain an understanding of the current state of the guest VM. Pfoh et al. 14 defined a formal model for describing VMI techniques, which helped examining and reasoning about possible VMI approaches. Srinivasan et al. 9 presented a process out-grafting approach for process-level execution monitoring (EM) by running a production VM and a security VM. Hizver and Chiueh 8 developed a real-time kernel data structure monitoring (RTKDSM) system based on Volatility to simplify and automate analysis of VM execution states. The RTKDSM system is designed as an extensible software framework extended to perform application-specific VM state analysis. All these works only considered information in process level or thread level, without considering operations in function level.
Runtime monitor observes a system’s behavior and detects whether it is consistent with a specification to provide the ultra confidence at runtime that the system satisfies some security properties. Eagle 15 is an external DSL (domain-specific language), and a linear time mu-calculus for monitoring, with past time as well as future time operators. Because of the inefficiencies in implementing Eagle, RuleR 16 that supported a rule-based specification language and suited well for processing data rich events was proposed. The Monitoring and Checking (MaC) toolset was developed as a systematic monitoring framework, 17 which targeted at soft real-time applications written in Java. Havelund 18 implemented an internal rule DSL in Scala and optimized Rete algorithm for RV. However, these approaches that embed a monitor into the protected system not only change the system with possibly negative results but also let malware have a chance to subvert the monitor mechanism.
Schneider 19 proposed an automata-theoretic characterization of property enforcement mechanism based on EM by embedding the enforcement code into the target system. Specifically, an EM-enforceable policy prescribes access event sequences recognized by a Büchi automaton. Based on security automata proposed by Schneider, Fong 20 defined shallow history automata as a specific type of memory-bounded monitor based on finite-state truncation automata which can enforce history-based access-control properties. Ligatti et al.21,22 introduced edit automata, which were transducers with infinitely states. They were inspired by enforcement mechanisms that can insert and suppress system actions as well as terminating a system with a policy being violated. Falcone et al. 23 focused on the trace properties which were identified by different automaton models according to the safety-progress hierarchy. The monitor to a trace universe was introduced by Ligatti and further improved by Chabot et al. 24 More recently, Basin et al. 25 distinguished system actions that are controllable by an enforcement mechanism of Schneider’s security automata and those actions that are only observable but cannot prevent their execution, which made the monitor is able to reason about timing constraints, such as “clock ticks.” Ligatti and Reddy 4 and Dolzhenko et al. 5 proposed a theory of runtime enforcement based on MRAs, which took output results (together with input actions) into account. This improvement overcomes the limitation in existing general models that cannot specify the policies defined or limited on output executions. All these works did not consider the computation model of the protected system.
Conclusion
We have presented a non-intrusive solution to enforce security policies on open SCADA systems based on VM technologies. In this solution, SCADA is broken into services which are exposed through VMs, and VMs are monitored by an “out-of-box” method. The solution is able to ensure the safety of services and local physical devices and builds a security gate at the bottom layer for the whole SCADA system. Experiments and analysis show that such a solution is feasible to provide a non-intrusive runtime guarantee to open SCADA systems.
In our approach, the monitor and the protected system are isolated. We propose an approach to extract out the system execution, which we called refined traces, by combining network events and runtime states based on the service model. Note that the abstract refined trace in our proposed approach is made of untrusted events from network (which may be spurious) and actual events reconstructed from VM memory (which are actually executed by the process), which may lead to a less accurate than that monitoring with actual executions. This is caused by the main difference between our approach and the traditional host-based approaches. This will introduce some advantages and disadvantages. The main advantages are as follows:
The monitor is non-intrusive;
No code changes need be done to the protected system;
Some intrusion detection system based on VMI technology can be implemented more effective and make a less impact on the protected services;
And a more flexible recovery mechanism based on VM technologies can be exploited when the protected system is compromised.
The main disadvantage of the solution may be that the refined trace may be less accurate than that of the actual one. This may lead the monitor to make a too strict runtime monitoring and enforcement. For example, an event A arrives but its preceding event B in the model is not received and processed. At the same time, the monitor cannot make a conclusive decision on whether the event B is actual (trusted) from VM semantic reconstruction. If B is a non-milestone event, there may be no impact on the checking procedure of the monitor. However, if B is a milestone event, a
Another limitation of our solution may be that if some concrete policy is defined on some events that we cannot decide whether they had actually occurred, for example, the related events for a desired policy are not included in the trustable events set, this policy may not be enforced with our protection mechanism. In such cases, a less-than-ideal alternative is to define the policy on refined traces, which also can make a runtime enforcement very well, although the result may be not as reliable as that of ours.
The future work of us is a detailed recovery scheme for recovering running services and related information in VMs when anomaly is detected.
Footnotes
Academic Editor: José Molina
Declaration of conflicting interests
The author(s) declared no potential conflicts of interest with respect to the research, authorship, and/or publication of this article.
Funding
The author(s) disclosed receipt of the following financial support for the research, authorship, and/or publication of this article: This research was supported by National Natural Science Foundation of China (Nos 61372115 and 61132001), National 973 Program (No. 2012BAH94F02), National High-tech R&D Program of China (No. 2013AA102301), and China Postdoctoral Science Foundation funded project (No. 2016T90067).