
Abstract
The biopharmaceutical industry is experiencing rapid growth, necessitating scalable optimization and control strategies to meet strict process objectives. Model predictive control (MPC) offers a robust framework for regulating complex bioprocesses; however, its performance critically depends on the availability of reliable process models. While mechanistic models are often preferred, practical limitations have accelerated the adoption of data-driven approaches. In this study, we evaluate the applicability of artificial neural networks (ANNs) and Gaussian process (GP) models in MPC for fed-batch cultivation of glycoengineered Pichia pastoris to produce human interferon α2b (huIFNα2b). Experiments were performed in a fermentation calorimeter with real-time monitoring of P. pastoris metabolism through metabolic heat rate, capacitance, and exhaust gas analysis. Comparative results demonstrate that GP-based MPC achieved superior process control, efficient substrate utilization, and a 1.1-fold increase in huIFNα2b productivity relative to ANN-based MPC. Furthermore, GP-based adaptation of feeding strategies reduced methanol consumption by 14% compared with ANN-based control. These findings highlight the potential of GP-driven MPC as a promising tool for enhancing productivity and sustainability in industrial bioprocesses.
Introduction
With the advancements emerging in gene manipulation techniques, various microbial systems are emerging as efficient chassis for the production of a multitude of biopharmaceutical products through microbial fermentation route. Initiatives such as process analytical technology (PAT) and quality by design (QbD) by US FDA and European Medicines Agencies not only ensure safer production but also promote enhancing process knowledge by imparting real-time process monitoring and control. 1 Biopharmaceutical industries generally operate in fed-batch mode as it is bestowed with a plethora of advantages. However, in industrial practice, the control objectives of fermentation process/bioreactors are limited to simple regulation loops, including pH, temperature, and dissolved oxygen (DO). Indeed, there is unequivocal evidence that the implementation of advanced control strategies in managing the biochemical state variables holds the potential to substantially enhance process performance. 2 The formidable challenge in regulating biochemical state variables stems from the inadequate availability of suitable process analyzers and robust process models. The intricacies of biological systems, characterized by dynamic and nonlinear behavior, pose hurdles in developing accurate models. 3
Numerous research endeavors have actively pursued the development of automatic regulation of biochemical state variables in fed-batch fermentation. Presently, two fundamental approaches for biological process control are prevalent: open-loop and closed-loop control. In the open-loop control, the feeding paradigm adheres to a predefined feeding rate that is independent of the output parameters from the process.4,5 Even when deviations from the targeted state variable trajectory are identified, no corrective control actions, such as adjustments to the feeding profile, are implemented. Conversely, closed-loop control systems integrate real-time feedback, enabling dynamic adjustments to the feeding rate based on observed deviations from the desired process outcomes. The implementation of closed-loop control in bioprocess is facilitated by widely applied techniques, including proportional integral derivative (PID) control, fuzzy control, artificial neural networks (ANNs)-based control, and statistical process control. Currently, in fed-batch process, the PID controller stands out as the most common closed-loop control method and is often implemented through indirect feedback control schemes. These schemes link the nutrient feeding rate with the measurements of process parameters such as pH and DO and operate as pH-stat and DO-stat fed-batch strategies. 5 PID control demonstrates favorable results with enhanced process performance as compared with open-loop control. Despite the advantages posed by PID controller, the usage of standalone PID controller to regulate biochemical state variables is limited due to the nonavailability of sensors to accurately measure the parameters such as biomass or substrate concentration. Optical or capacitive biomass sensors, while providing insights, are susceptible to influences from factors such as mixing, aeration, foam, and culture’s state. Sensors commonly used for substrate concentration measurements may lack the required accuracy and reliability.6,7 Control strategies based on empirical models, such as ANN, fuzzy logic, and statistical process control, demonstrate favorable results if the system parameters do not deviate significantly from the kinetic parameter values that were used during the model creation. The principal limitation inherent in these methodologies resides in the imperative to construct a model bespoke to each novel process, mandating the acquisition of substantial quantities of statistical data. 4
Model predictive control (MPC) stands as a widely accepted and popular control technique in industrial applications.8,9 It is an advanced model-based process control strategy characterized by the solution of an optimization problem, either online or offline, within a set of predefined constraints. The core capability of MPC lies in its ability to predict, utilizing an assumed dynamic process model, over a finite horizon. This predictive capability allows MPC to proactively optimize control actions based on future predictions, enabling the system to anticipate and respond to changes in the process dynamics. The versatility of MPC has contributed to its broad acceptance, making it a valuable tool for enhancing the efficiency and performance of various industrial processes. 8 The reference trajectory is obtained from an existing process or from a mathematical model. Classical mechanistic models or data-driven models are employed for developing the prediction model. Applications of MPC to bioprocess for various microorganisms have been reported in literature.10–12 Most of the experimental investigations were based on simulation studies, and only a smaller number of studies were reported toward real-time implementation. 13
In this present investigation, MPC was developed with the aid of data-driven modeling. Two data-driven models (ANNs and Gaussian process [GP]) were employed for the prediction of difficult-to-measure biochemical state variable (i.e., specific growth rate
Material and Methods
STRAIN AND MEDIA
A glycoengineered strain of P. pastoris with a Mut+ phenotype, containing the plasmid SuperMan5 pep4Δ prb 1Δ procured from Biogrammatics Inc., USA, was employed for the expression of huIFNα2b. 14 Glycerol stocks were maintained at −80°C in yeast extract, peptone, and dextrose (YPD) media containing 20% v/v glycerol.
The composition of various media used for the cultivation of glycoengineered P. pastoris was as follows:
Starter culture medium (YPD) in g/L: yeast extract 10, peptone 20, and dextrose 20. Preculture medium (yeast extract, peptone, glycerol: YPG) in g/L: yeast extract 10, peptone 20, and glycerol 20. Optimized fermentation medium (Basal Salt Medium, BSM)
17
: glycerol 48.84 g/L, K2SO4 18.2 g/L, MgSO4 7.28 g/L, KOH 4.13 g/L, CaSO4. 2H2O 0.93 g/L, (NH4)2SO4 8.42 g/L, 85% H3PO4 26.7 mL/L, PTM4 salts 4.4 mL/L.
INOCULUM PREPARATION
Glycerol stocks of the strain, stored at −80°C, were utilized to streak a YPD agar plate, initiating the growth of colonies. From the YPD plate, a single colony was carefully selected and introduced into a 5 mL test tube containing YPD media, establishing a starter culture. This starter culture was subsequently employed to inoculate a baffled flask containing 300 mL of YPG media, thereby creating a preculture.
The preculture underwent cultivation at 30°C with agitation at 220 RPM for a period of 24 hours. Over this duration, the preculture achieved a final optical density at 600 nm (OD600) of 4 absorbance units, indicative of the growth and biomass accumulation during the cultivation process.
FERMENTATION CALORIMETER WORKING PRINCIPLE AND OPERATION
Fed-batch fermentations were conducted in a 5L calorimetric bioreactor designed to monitor metabolic heat release via heat compensation calorimetry. The system dynamically adjusts the compensation heater power to match microbial heat generation. The bioreactor features a dual-layer jacket with four sensitive temperature probes (Isothermal Technology Ltd., UK): two inside the vessel and two at the jacket inlet and outlet. Silicon oil circulates in the inner jacket to maintain isothermal conditions, while the outer jacket is vacuum-sealed to minimize heat loss. Precise temperature control uses two PID controllers: one modulates the heater power based on microbial heat, and the other regulates the cryostat (Julabo GmbH, Germany) responding to inlet jacket temperature. Metabolic heat rate is obtained by separating total heat into biological and nonbiological components, with the latter estimated from mechanical operation contributions as detailed elsewhere.
18
A dynamic energy balance was applied over fermentation calorimeter to calculate the biological heat rate. Eq. (1) describes the unsteady state heat rate balance contributed by different operating parameters.


DATA ACQUISITION FOR MONITORING AND CONTROL
For the seamless integration of all process inputs and outputs, a cRIO 9075 data acquisition (DAQ) hardware, sourced from National Instruments in Austin, Texas, USA, was employed. DAQ hardware featured dedicated slots accommodating both analog and digital input/output modules. A supervisory control and data acquisition system, developed using LabVIEW 13.0 from National Instruments, was utilized to acquire and process all signals.
The real-time signals obtained were subjected to meticulous data pretreatment through LabVIEW programming. To enhance signal quality, a moving simple average filter with a window size of 100 data points was implemented on the raw data. This filtering mechanism aimed to reduce noise originating from input signals, ensuring a smoother and more accurate representation of the acquired data. 18 Furthermore, for all acquired analog input and output signals, including temperature, pH, DO, off-gas analyzer data, and metabolic heat rate, scaling factors were selectively applied. This step was taken to align the acquired data with previously calibrated values, enhancing the accuracy and reliability of the measurements. The pretreated real-time signals were then visualized through graphical plots, facilitating a comprehensive understanding of the data.
CARBON DIOXIDE EMISSION RATE MEASUREMENT
Real-time monitoring of off-gas activity during P. pastoris cultivation: The concentration of evolved CO2 was measured using an exhaust gas analyzer (Siemens AG, Ultramat 23, Berlin, Germany). CO2 detection by the analyzer is facilitated by infrared (IR) absorption, and the resulting signal is transmitted as a mole fraction denoted as

DIELECTRIC SPECTROSCOPY
Dielectric spectroscopy (capacitance probe/impedance spectroscopy) serves as a method to measure the viable cell concentration of the cell culture suspended in a conductive medium. The capacitance probe (Aber Instruments, Aberystwyth, UK) is configured with a ceramic covering at the probe tip, which is encircled by two annular rings. An electric field is generated at the applied frequency, and the interaction of the electric field with the cells induces ion movements across the cell membrane, causing polarization as intracellular and extracellular ions migrate toward the nonconductive plasma membrane. This results in the establishment of a charge gradient across the membrane, giving rise to capacitance. Living cells, with intact membranes, exhibit this capacitance, distinguishing them from the dead cells that may have lysed, damaged, or fragmented membranes. Unlike biomass, other suspended particles in the cultivation broth, lacking a plasma membrane, do not contribute to capacitance.
19
In this study, capacitance was recorded at dual frequencies (580 kHz and 15.560 MHz) through Futura software (Aber Instruments, Aberystwyth, UK). The difference in the capacitance values between these frequencies (
DATA CURATION FOR ANN AND GP MODEL TRAINING
Machine learning algorithms require large datasets to accurately predict process parameters, capturing key changes during product formation. This study employs two algorithms to model nonlinear dynamics: ANNs and GP. A two-layer feedforward ANN with tanh activation was developed. GP, a robust nonlinear regression technique, is defined by a mean function representing average values and a covariance (kernel) function capturing dependencies between inputs. Here, the GP model uses a radial basis function kernel, critically shaping the GP’s behavior. 20 Five fed-batch fermentation experiments, each with 28,000 data points, were used for data-driven model development. The dataset included online measurements of DO concentration, metabolic heat rate, capacitance, and CER. Historical data enabled the model to identify patterns across runs. Each attribute was normalized to zero mean and unit variance to address scale differences, enhancing pattern recognition and generalization. Data from all experiments were combined and randomly split into training, validation, and test sets (75%, 15%, 10%) using MATLAB’s “dividerand” function. Root mean square error (RMSE) was used to select the best network for MPC implementation (Fig. 1).
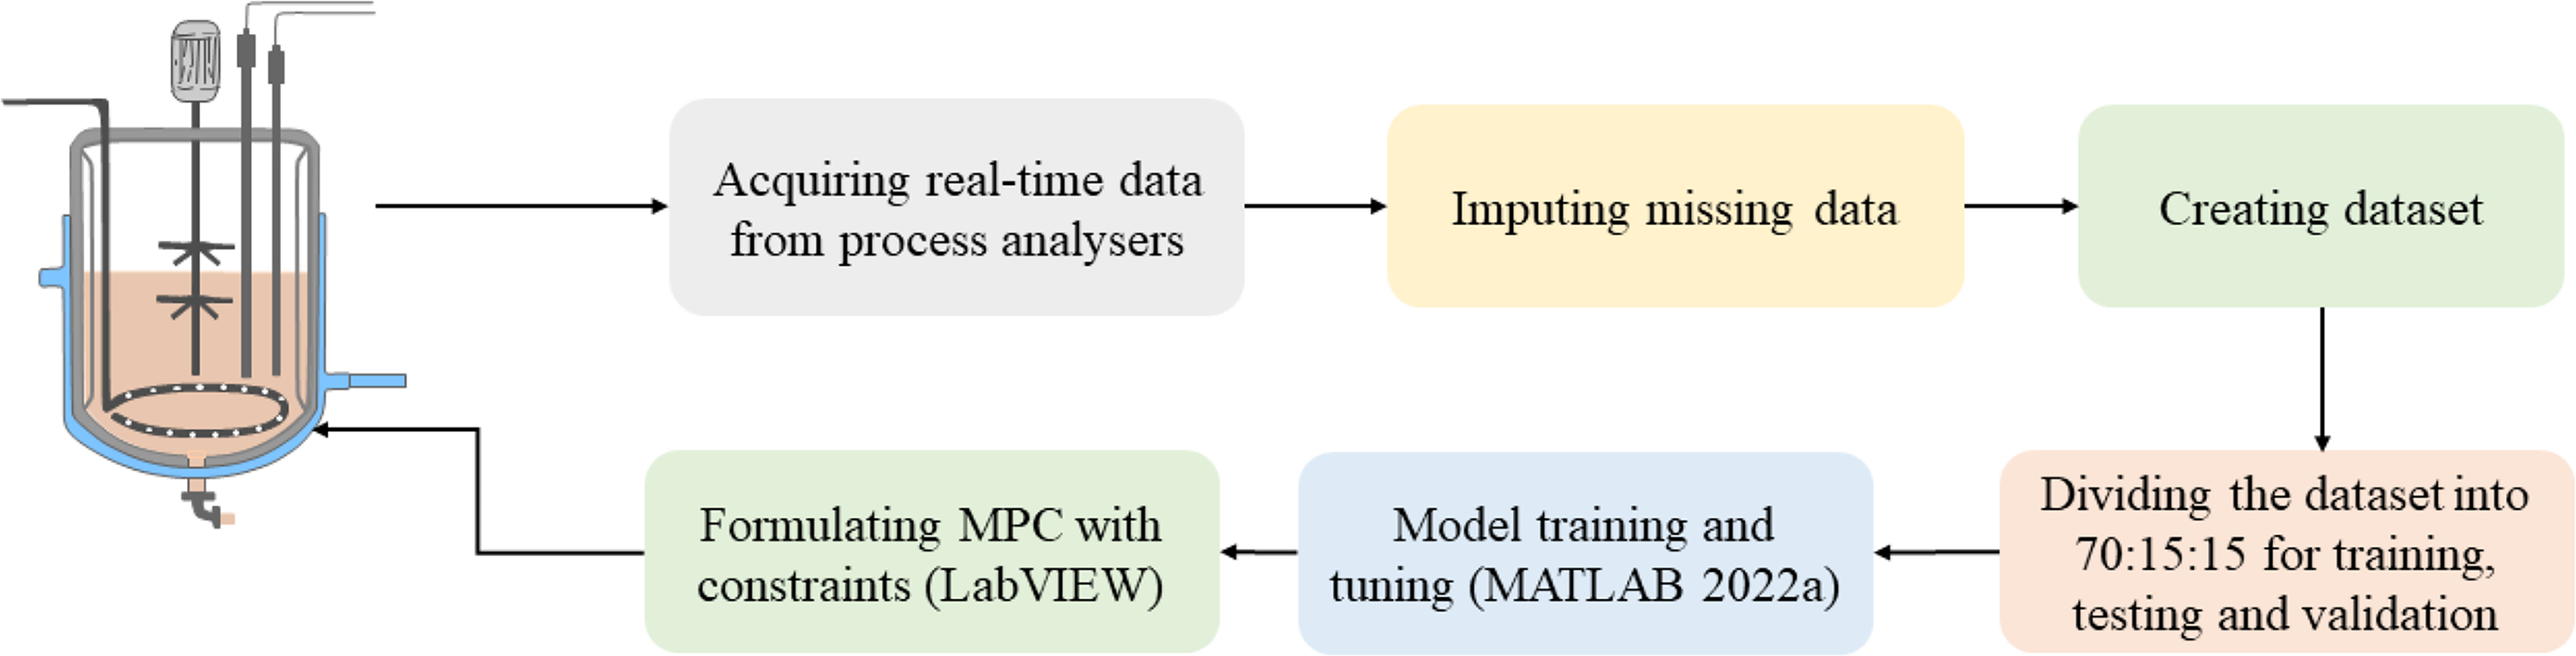
Schematic representation of data-driven MPC workflow. MPC, model predictive control.
CONTROL METHODOLOGY
The objective of this work is to maximize the huIFNα2b productivity from the high cell density cultivation of glycoengineered P. pastoris. This is accomplished by maintaining the organism at an optimal growth rate and ensuring that the majority of the carbon substrate is channelled toward biomass and product formation. To achieve the stated objective, MPC was formulated using a cost function as stated in Eq. (4).

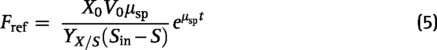
The reference feeding trajectory is precalculated analytically based on the substrate balance equation, and it is mathematically represented as shown in Eq. (5).
A prediction horizon of 1 hour and a control horizon of 0.5 hours were chosen to minimize the quadratic cost function based on tracking error over a finite moving horizon of length


MPC follows receding horizon principle, where the optimization problem subjected to the constraints is solved online at instant
HU IFN α2B PRODUCTION
Sterilization of fermentation calorimeter was performed in situ using prefilled distilled water at 121°C and 1 bar pressure for 15 minutes. Following sterilization, BSM was aseptically transferred into the calorimeter. Subsequently, a 10% v/v preculture inoculum was aseptically introduced into the calorimeter, resulting in a final working volume of 2.5 L. The high cell density cultivation was performed at 30°C, with pH maintained at 5.4 through the controlled addition of 25% v/v ammonia and 85% v/v orthophosphoric acid. DO levels were sustained above 10% by supplying air at 1 vvm, coupled with agitation rate regulation between 400 and 800 rpm. To mitigate excessive foaming, manual feeding of 10% v/v antifoam solution (silicon oil) was added when necessary.
The high cell density cultivation of P. pastoris is characterized by three distinct phases: the glycerol growth phase (∼20 to 24 hours), methanol adaptation phase (∼6 to 8 hours), and the recombinant protein production phase (∼40 to 50 hours). The glycerol growth phase resulted in significant biomass generation, utilizing glycerol as a primary carbon source. Real-time signals from process analyzers indicated the depletion of glycerol, manifested through a decline in heat rate signal and off-gas activity and an increase in DO concentration. During the methanol adaptation phase, gradual methanol (concentration not exceeding 20 g/L) dosing facilitated effective adaptation to the new carbon source. Activation of alcohol oxidase (AOX) transcription elements indicative of the adaptation phase was reflected in changes in real-time signals of metabolic heat rate and off-gas activity. Production phase involved continuous supply of methanol (concentration not exceeding 20 g/L), regulated by employed process control strategies as detailed in the " Control methodology" section. Throughout the cultivation, regular sample collection facilitated offline analysis, enabling the estimation and monitoring of key process parameters such as biomass growth, substrate consumption, and product formation.
OFFLINE ANALYSIS
Samples collected at regular intervals were preserved at 4°C for offline analysis. Cells were subjected to centrifugation at 10,000 RPM for 10 minutes at 4°C for extracting cellular components. The resulting supernatant was carefully collected and stored at –20°C for subsequent analysis of carbon substrate and huIFNα2b. The separated cells were subjected to a double wash with deionized water to eliminate any residual salts and subsequently dried at 80°C to determine the dry cell weight (DCW). Cell growth was quantified through OD600 using a UV–visible spectrophotometer (GE Healthcare, UK). Obtained absorbance readings were converted into DCW values (g/L) based on the following correlation developed (
PERFORMANCE INDEX
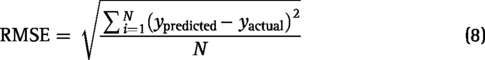
The prediction performance of the data-driven models was assessed through the RMSE metric, which is defined as shown in Eq. (8).
Results and Discussion
REAL-TIME MONITORING OF HIGH CELL DENSITY CULTIVATION OF GLYCOENGINEERED P. PASTORIS
The deployment of real-time process analyzers such as fermentation calorimeter, off-gas analyzer, and dielectric spectroscopy exacerbated the monitoring and control action by accurately depicting the dynamics of high cell density cultivation of P. pastoris. The consistent elevation in metabolic heat rate, CER, and capacitance signal corresponded to a concurrent increase in biomass concentration during high cell density cultivation. Clear demarcation of real-time signals was observed (Fig. 2) as the cultivation progressed through different stages. Particularly, a decline in the real-time signals was noticeable at the end of glycerol batch phase (20–23 hours). Subsequent to this, a gradual adaptation to methanol utilization was evidenced by a slower increase in these signals, followed by the depiction of dynamics during the induction phase.
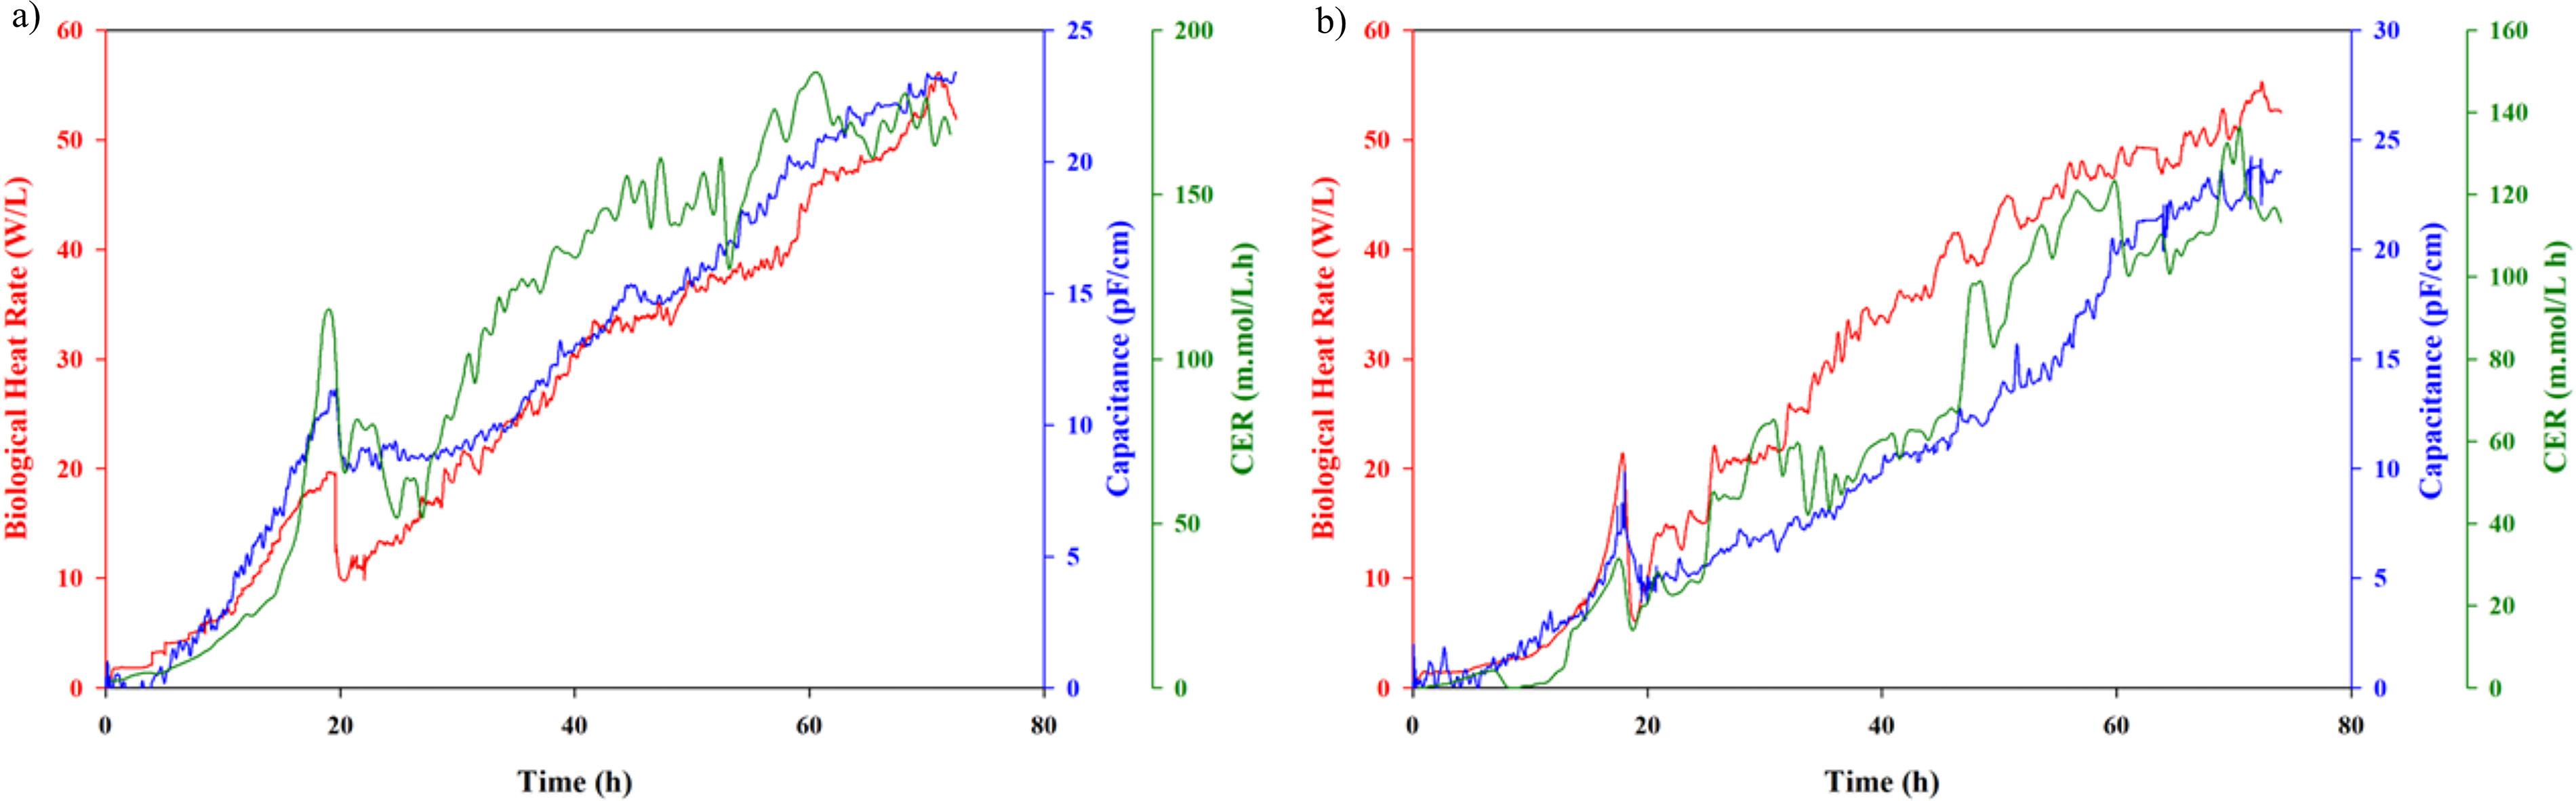
Real-time dynamic profiles from three process analyzers, that is, fermentation calorimeter, capacitance probe, and exhaust gas analyzer. Metabolic heat rate (red continuous), capacitance (blue continuous), and CER (green continuous):
As Gibb’s free energy dissipation is inherent to all living systems, the enthalpic changes associated with diverse metabolic processes can be effectively elucidated through the application of fermentation calorimeter. The customized fermentation calorimeter utilized in our study demonstrates a sensitivity of 6.73 mW/L. The maximum microbial heat generated during the cultivation of glycoengineered P. pastoris for the production of recombinant huIFN α2b ranged from 40 to 52 W/L, aligning with previously reported literature.
21
The integration of calorimeter signal with CO2 signal facilitates the interpretation of the interrelation between heat fluxes in bioprocesses and corresponding alterations in the metabolic flux. In the context of P. pastoris cultivation, methanol consumption during the induction phase undergoes oxidation within the peroxisome, yielding formaldehyde, which is subsequently further oxidized to generate essential energy intermediates for cellular functions. This oxidation results in the evolution of CO2 gas, and as a result, the induction phase is characterized by higher CER values (80–170 m.mol/L.h) compared with the glycerol phase, where the maximum CER generated ranges from 50 to 80 m.mol/L.h. An increase in cumulative CER production during the induction phase signifies ongoing activity in the expression of AOX. The heightened CER production in the induction phase suggests that a substantial portion of assimilated methanol is primarily directed toward energy metabolism, with less allocation to biomass production compared with glycerol batch phase. An excessive or abrupt increase in CER values serves as an indicator of extensive CO2 oxidation, leading to the accumulation of formaldehyde in the culture broth and resulting in cytotoxic conditions.
22
Application of process analyzers in conjunction with offline measurements facilitated the calculation of thermochemical energetic yields. The metabolic heat generation arising from the balance between substrate uptake rate and its allocation to diverse metabolic reactions is an inherent characteristic of the organism, signifying the coupling between catabolic and anabolic processes. In the context of black box microbial stoichiometries, real-time heat rate measurements coupled with auxiliary process analyzers provide a distinct advantage of predicting various yield coefficients. The heat yield coefficient attributed to the biomass generation
EXPERIMENTAL VERIFICATION OF ANN MPC
The architecture of the ANN investigated in this study was denoted as 4–N–1, where “4” signifies the number of input nodes in the input layer, N represents the variable number of hidden nodes in the hidden layer, and “1” designates the single output node in the final layer. Each node corresponds to a neuron that computes a weighted sum of the outputs from the preceding layer. The identification of the optimal-performing network entailed the careful selection of an appropriate training algorithm and determining the number of neurons in the hidden layer. In accordance with established practices, the number of neurons was systematically chosen through an iterative process of trial and error, with the overarching objective of minimizing the prediction error between the actual target values and the corresponding values predicted by the network.
23
The optimal number of neurons was 12, with a lower RMSE being registered while training the network. The network’s efficacy experienced a decline when the variable N was constrained to values exceeding 12 (Table 1). A higher N value tends to induce overfitting during the training phase, amplifying network complexity and computational burden. This, in turn, leads to a suboptimal generalization when applied to test data. Conversely, a lower count of neurons in the hidden layer contributes to underfitting, where the network inadequately captures the underlying patterns in the data, further compromising its predictive performance. To assess and compare the performance of the developed MPC, real-time datasets that were not utilized during the training phase were employed. The ANN MPC consistently demonstrated the capability to maintain the specific growth rate within a range of 0.02–0.05 h−1 during both testing and validation datasets. Noteworthy deviations, ranging within ±0.015 h−1 from the optimal specific growth rate of 0.035 h−1, were observed at various intervals throughout the induction phase (Fig. 3). The manifestation of oscillatory behavior as depicted in Figure 4 is attributed to the intricate tuning of a higher number of hyperparameters involved in the development of ANN. The optimal feeding rate of methanol was determined as per Eq. (5) to maintain the desired setpoint values, and
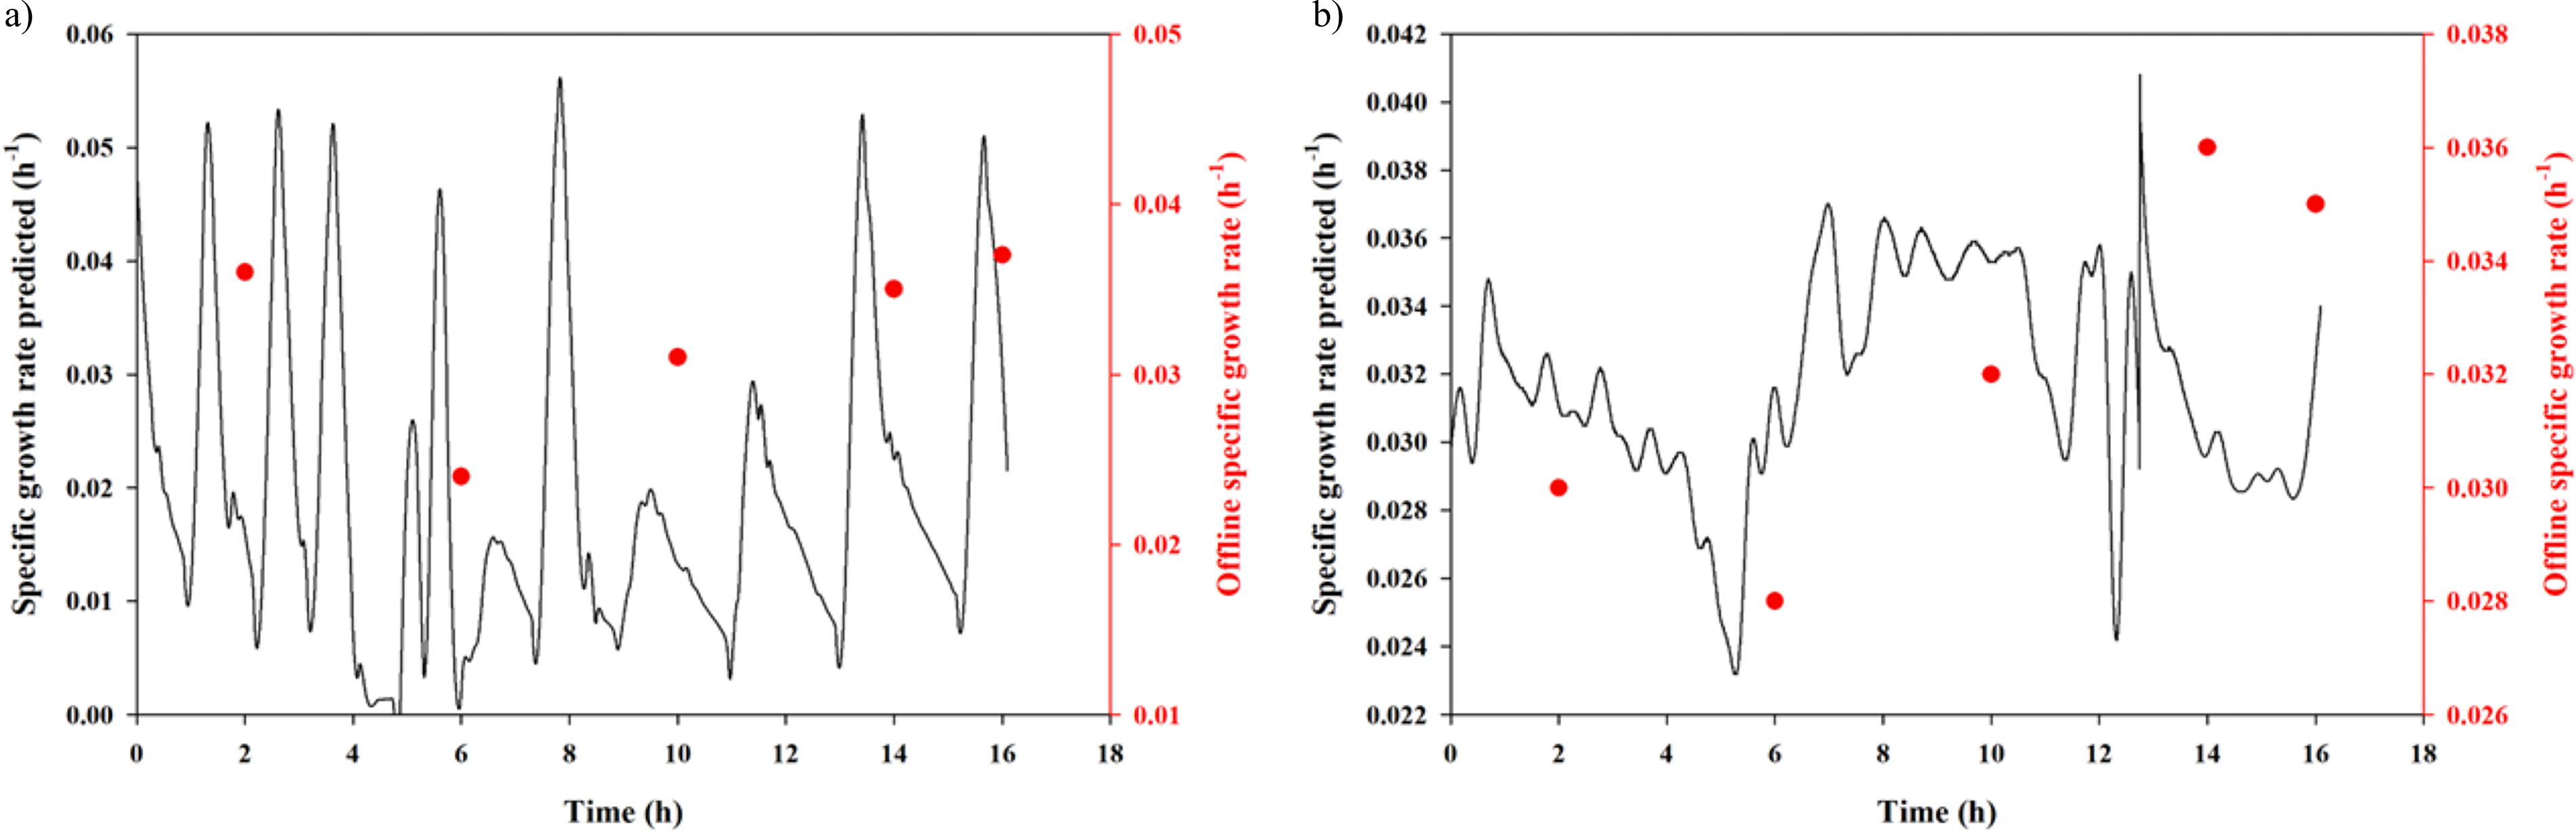
Comparison of data-driven predicted specific growth rate (black continuous) with the experimentally obtained data (red circles):
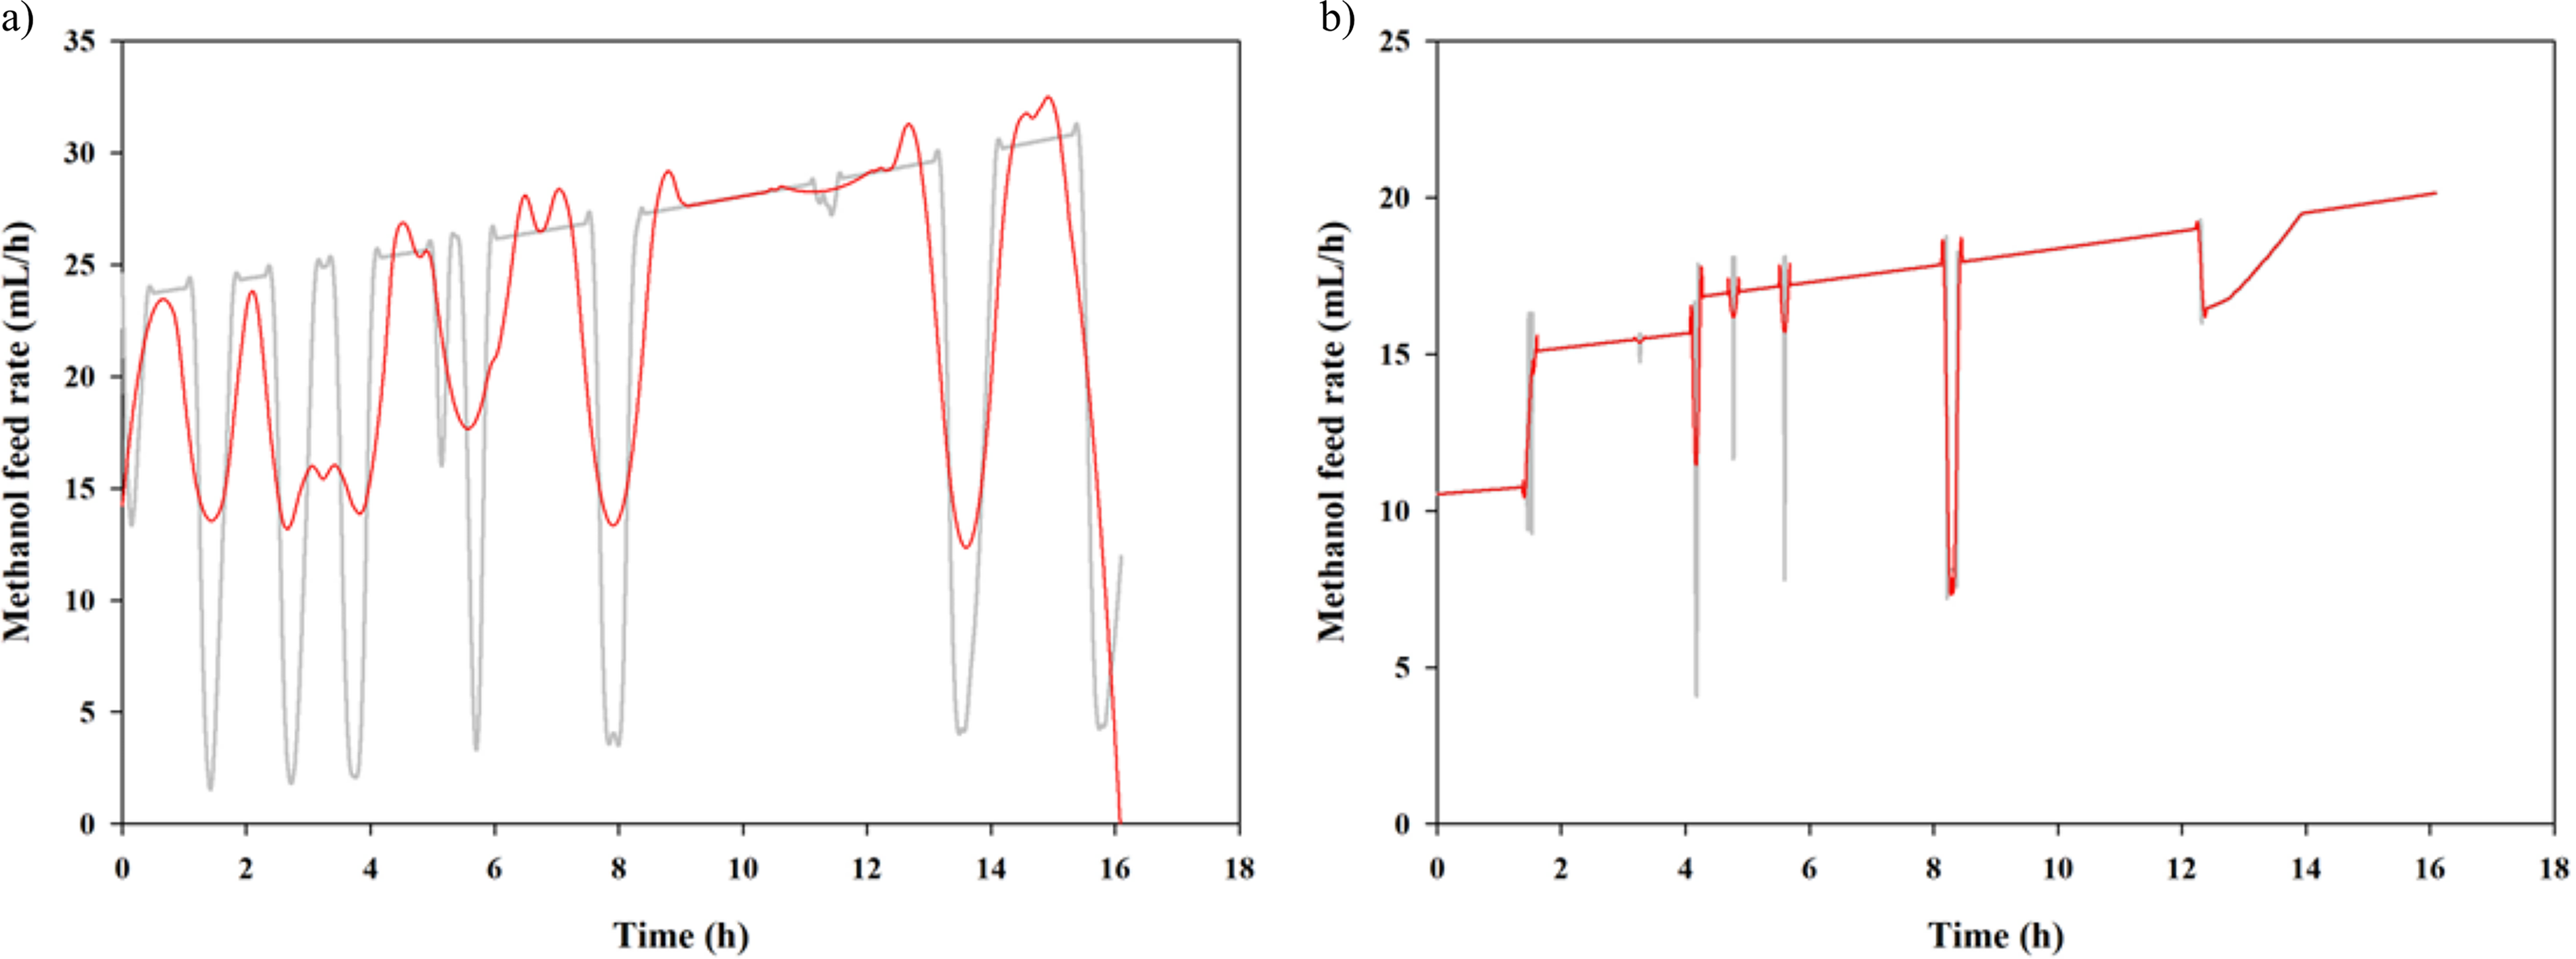
Influence of controller performance on methanol feeding rates. Precalculated reference feeding rate (gray continuous) compared with experimental feeding rate (red continuous):
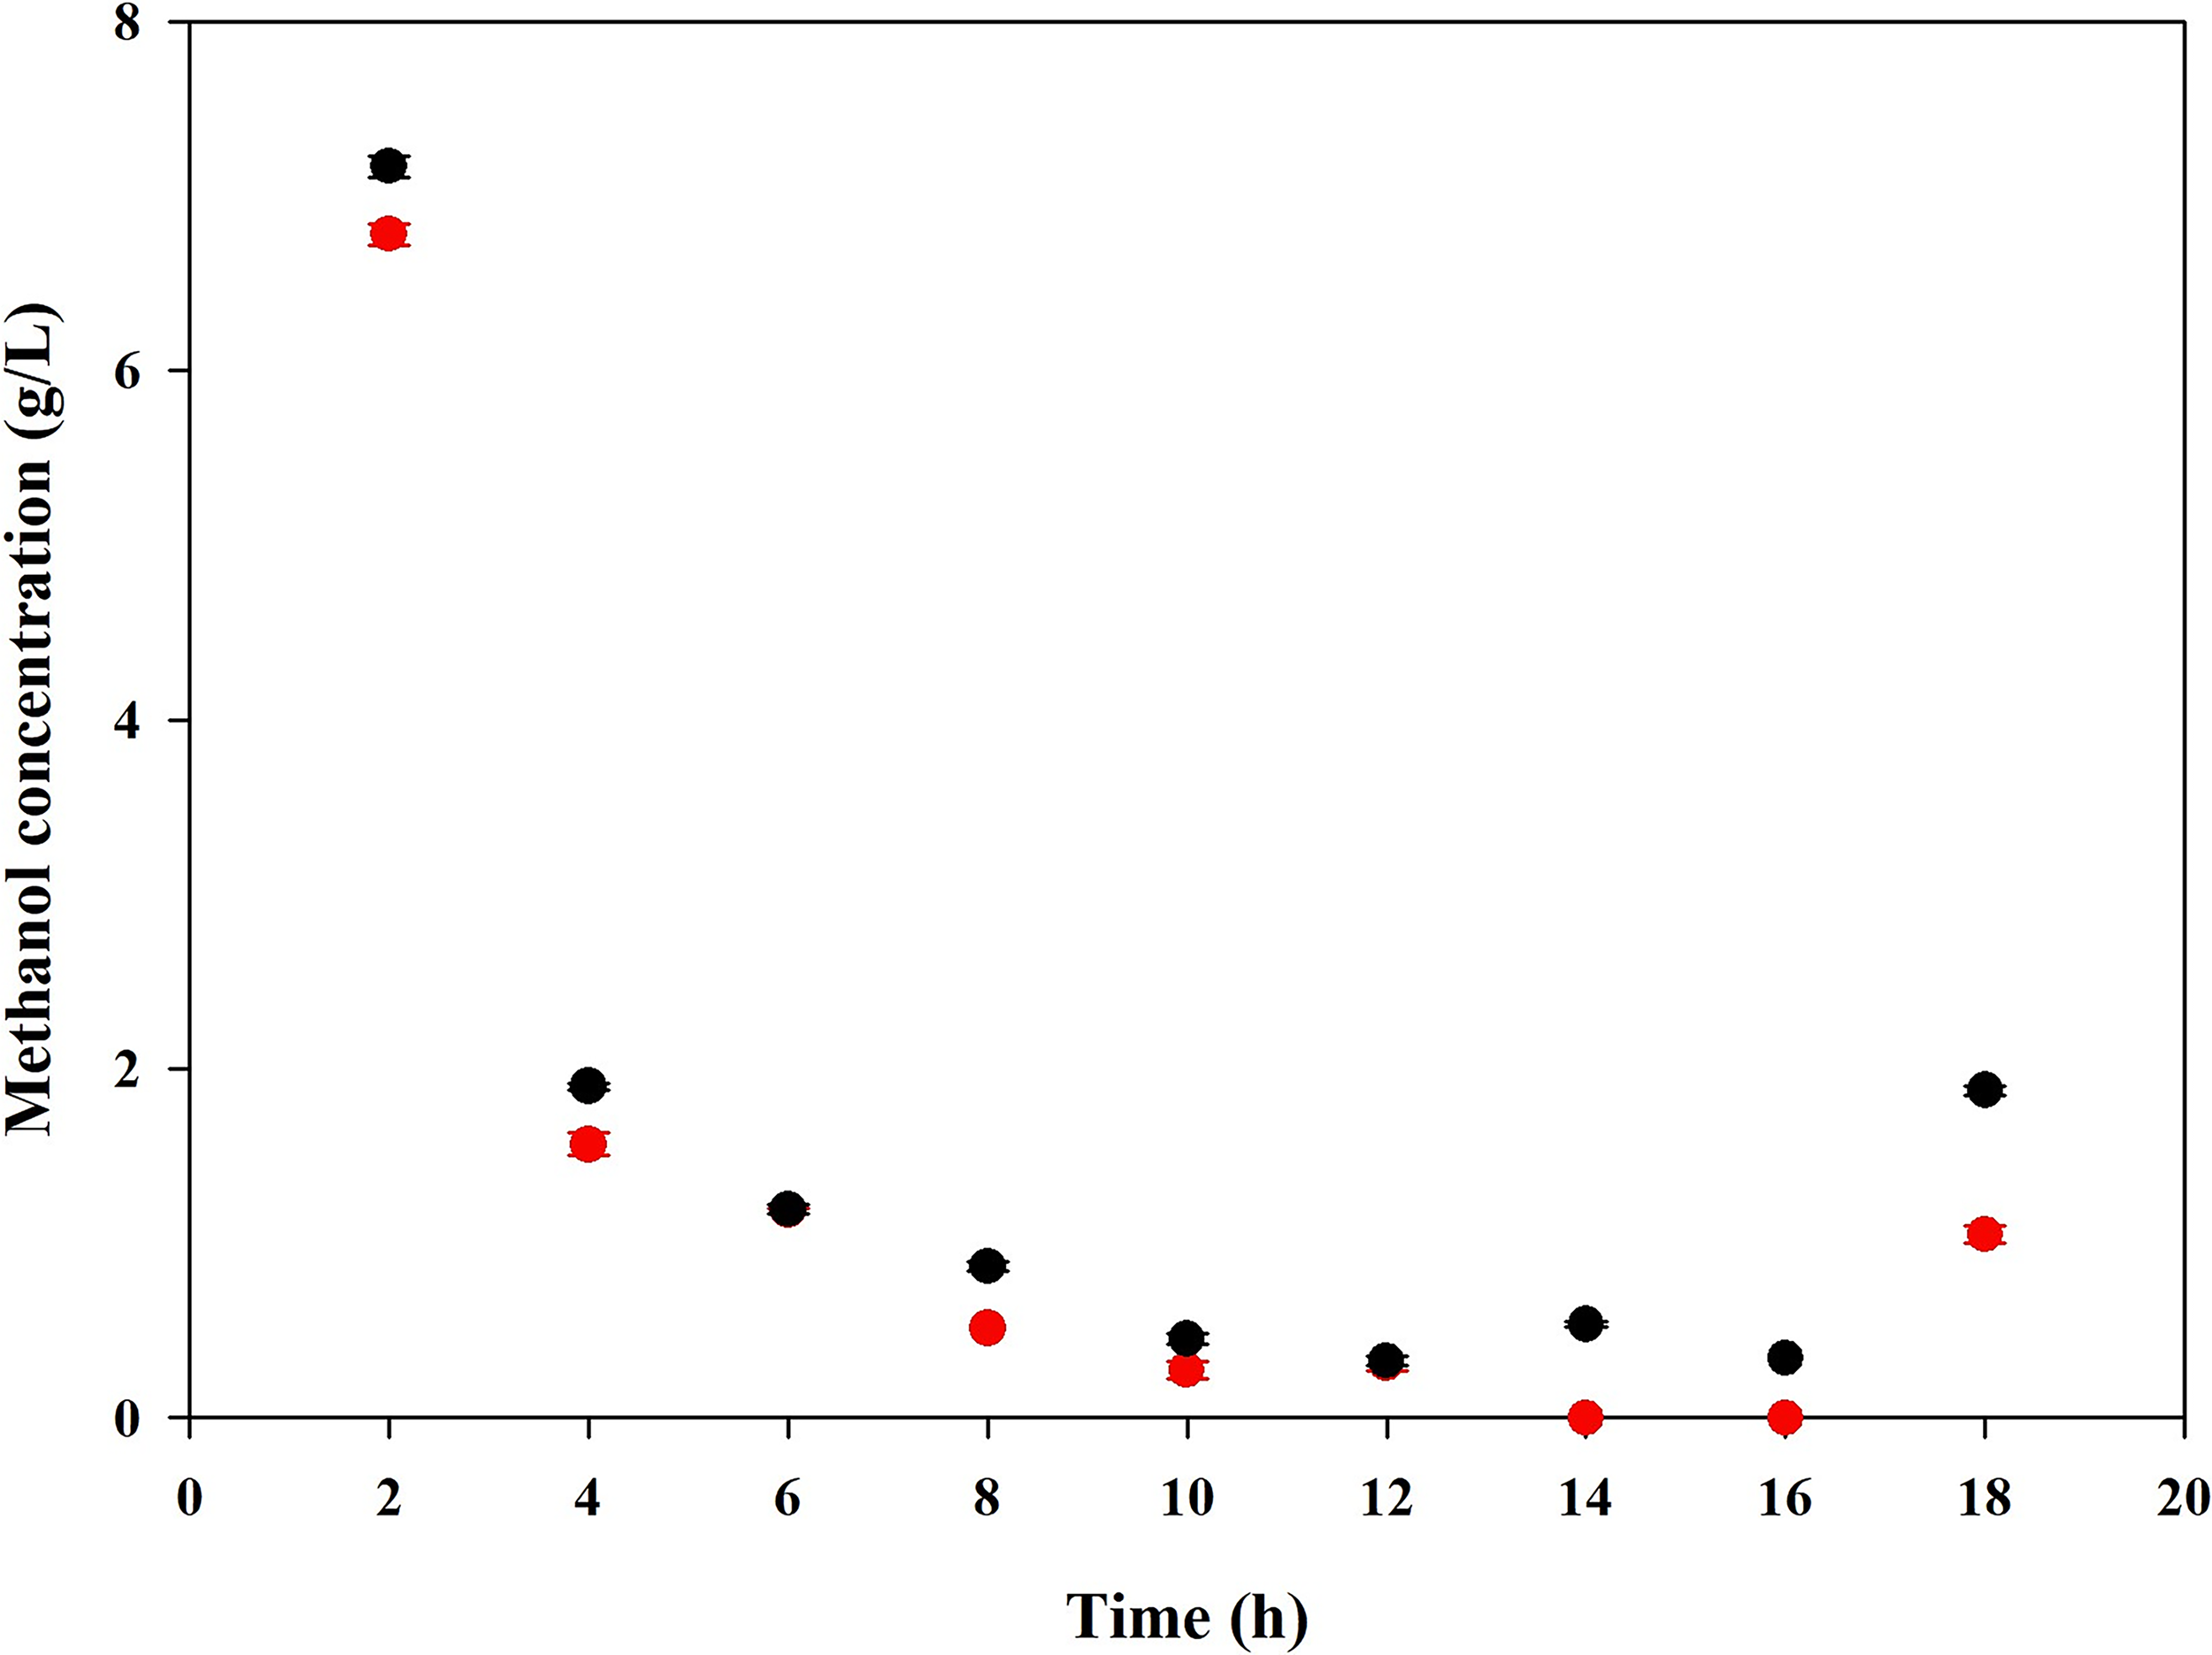
Impact of optimal methanol feeding strategy on residual methanol concentration. NN-based MPC (black circles), GP-based MPC (red circles).
Root Mean Square Error Over Training Data of Artificial Neural Network for the Prediction of Specific Growth Rate
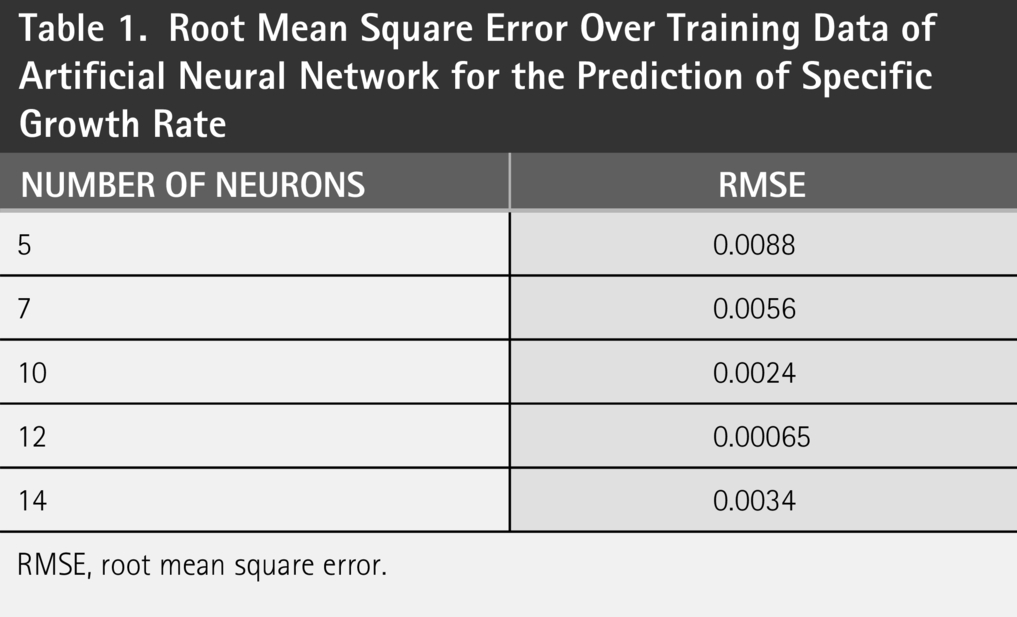
RMSE, root mean square error.
EXPERIMENTAL VERIFICATION OF GP MPC
GP prediction model assumes the form of black box system, and the characterization arises from its capacity to furnish predictions of the output variable based on the input variables without manifesting the explicit functional relationship between them. The probabilistic approach for the regression was based on the prior distribution of the output variable
GP MPC consistently exhibited the ability to sustain the specific growth rate within a range of 0.025–0.045 h−1 during both testing and validation datasets. Noteworthy deviations, falling within the range of ±0.01 h−1 from the optimal specific growth rate of 0.035 h−1, were discerned at diverse intervals throughout the induction phase (Fig. 3). The objective of attaining a stable output, reflected through optimal feeding of methanol, was successfully realized through the implementation of GP MPC exhibiting a 1.03- and 1.9-fold enhancement of huIFNα2b productivity compared with our previously reported studies, that is, µ controlled by gain-scheduling PID and residual methanol concentration controlled by model-based adaptive PI (Table 2). As illustrated in Figure 4, the feed rate was subjected to lesser oscillatory behavior in GP MPC as compared with ANN MPC. The straightforward approach of GP, which requires lesser hyperparameter tuning than ANN, also contributed to the efficiency of GP MPC. The residual methanol concentration was maintained under methanol-limiting conditions for longer durations, and this tightly regulated methanol feeding reinstated the housekeeping activities more effectively, which resulted in enhanced production of huIFNα2b. A 1.1-fold increment in huIFNα2b productivity was observed through GP MPC approach, and also a 14% decrease in methanol utilization was observed due to the optimization of feeding rate.
Comparative Assessment of Process Strategies on Human Interferon α2b Production
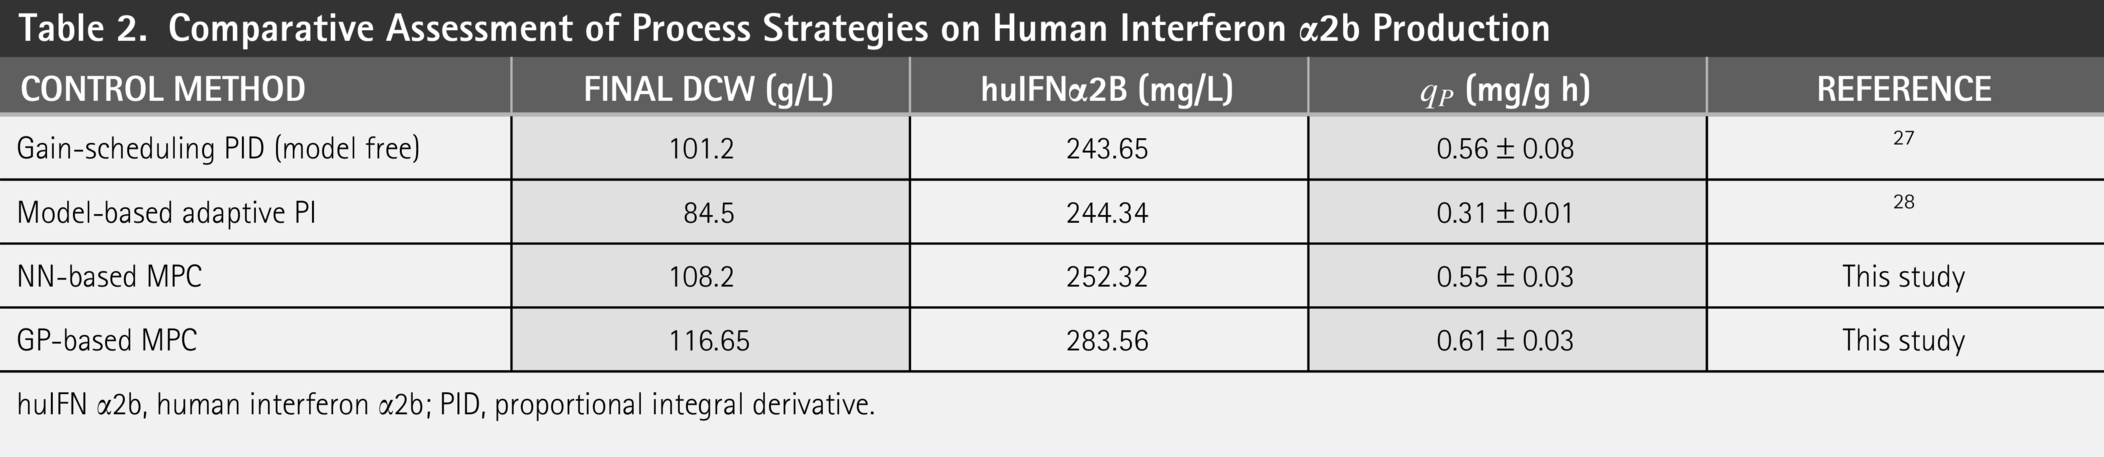
huIFN α2b, human interferon α2b; PID, proportional integral derivative.
Conclusions
In this study, we explored the potential of controlling critical process parameters in huIFNα2b production. The utilization of data-driven models proves advantageous by providing reliable estimates of specific growth rate and thereby providing accurate input to the MPC. To effectively manage the inherent nonlinearities and discontinuities in the process, MPC was leveraged to fulfill the multiple objectives and predict the process events. This proactive approach facilitated continuous product formation with enhanced productivity. Furthermore, the optimal use of raw material (carbon substrate—methanol) with the aid of the proposed MPC is of high relevance for industry as it provides the possibility of significantly enhancing the product concentration without any additional burden of substrate consumption. The obtained results underscore the potential for leveraging nonlinear approaches to achieve more robust and efficient control strategies in bioprocess applications.
Ethical Statements
The authors declare that they have no known financial interests or personal relationships that could have appeared to influence the work reported in the paper.
Neither ethical approval nor informed consent was required for this study.
Data Availability
Data will be made available on request.
Authors’ Contributions
S.S.P.A.: Investigation, formal analysis, data curation, visualization, writing—original draft, and writing—review and editing. Shikha S.: Investigation. Senthilkumar S.: Project administration, resources, and writing—review and editing.
Footnotes
Acknowledgement
The authors would like to acknowledge Ms. Sandhya Sekhar, a research scholar, for her help during fermentation runs. The authors kindly acknowledge the Department of Biosciences and Bioengineering, IIT Guwahati, for providing the state-of-the-art infrastructure facility.
Author Disclosure Statement
No competing financial interests exist.
Funding Information
The authors gratefully acknowledge the financial support from the Department of Science and Technology—Science and Engineering Research Board, Government of India, for the successful accomplishment of this work (CRG/2019/002882).