
Abstract
Design cognition research aims to investigate the cognitive mechanisms and thought processes of human designers. In previous research, the cognitive activity of experienced and inexperienced designers has been compared in order to identify design strategies leading to design creativity. However, it is still unknown whether the design strategies applied are effective and whether the design processes are efficiently improved. In this paper, cognitive efficiency, describing how designers optimize mental resources to achieve creativity in conceptual design processes, was directly measured by the mental effort of designers and the creativity level of design outcomes. The results showed that the experienced designers generated more design concepts with higher quality and variety than did the inexperienced designers. The cognitive efficiency measures indicated that design expertise contributed to improving cognitive efficiency scores of quality. In addition, the systematic design method used by some designers was found to be related to high cognitive efficiency. It can be seen that the evaluation of cognitive efficiency has practical applications for designer training, design methodology evaluation, and design process improvement.
Introduction
The engineering-design process is a knowledge-based problem-solving process, which has been described by researchers based on their unique understanding of the design process (Kurakawa, 2004; Pahl, Beitz, Feldhusen, & Grote, 2007; Roosenburg & Eekels, 1995). Studying designers’ cognitive processes can help researchers understand the generation of design creativity (Benami & Jin, 2002; Cross, 1997; Madanshetty, 1995). A creative design process has been proposed by linking the usual representations of the design process (i.e., task analysis, conceptual design, and embodiment design) with the nature of the activities in creative process terms (i.e., analysis, generation, and evaluation; Howard, Culley, & Dekoninck, 2008). These empirical studies involve analyzing cognitive activity of designers and are expected to improve design creativity. However, these models are either too general for guiding designers in the conceptual design process or too specific because they focus only on one attribute of cognitive process (Yilmaz, Seifert, & Gonzalez, 2010). There seems to be no official method to quantify that the design processes are efficiently improved.
Studying designers’ cognitive processes can also help researchers find effective strategies to improve the conceptual design process. Effective design strategies applied by experienced designers can be used for training inexperienced designers (Kim, Kim, Lee, & Park, 2007). The comparisons between experienced and inexperienced designers can reveal their different ways and behavior of solving design problems. It has been found that experienced designers often put more effort into understanding design problems and design constraints, use more reasoning strategies, structure cognitive actions more efficiently, and demonstrate more efficient design behavior than inexperienced designers, as summarized in Table 1. In most empirical studies, improving design processes is related only to improving design outcomes, and designers’ performance is evaluated only by design outcomes. Inexperienced designers are taught to use strategies that experienced designers have applied, but it is still unknown whether the design strategies applied are effective and whether the design processes are efficiently improved. Designers’ cognitive demands, that is, their desired level of mental effort as they work on a design task, are not considered.
The Differences Between Experienced and Inexperienced Designers
Some studies have shown that processing too many cognitive tasks at one time may cause cognitive overload, which has a negative impact on forming linkages between ideas and slows down the rate of idea generation (Bilda & Gero, 2007). Cognitive overload degrades human performance because human cognitive capacity is limited with respect to the amount of information it can hold and the number of operations it can perform on that information (Van Gerven, Paas, van Merriënboer, Hendriks, & Schmidt, 2003). Cognitive underload can also be detrimental to performance in learning (Paas, Renkl, & Sweller, 2004) and operating tasks (Young & Stanton, 2002), just as cognitive overload can. Both cognitive overload and underload can cause psychological and physiological stress due to a mismatch between cognitive demands and human capabilities (Byrne & Parasuraman, 1996; Hancock, 1989). Hancock and Caird (1993) proposed that successful performance depends on satisfying demands. Therefore, it is necessary to consider designers’ cognitive demands as part of the evaluation of designers’ performance. As far as is known, there is no existing method that is able to simultaneously evaluate design outcomes and designers’ cognitive demands.
The relation between design outcomes and the expenditure of mental effort can be studied from an efficiency perspective. Cognitive efficiency, also known as mental efficiency, describes how individuals optimize mental resources to achieve improvements in learning, problem solving, or academic performance (Hoffman, 2012). Mental resources include characteristics such as working memory capacity and existing knowledge stored in long-term memory. Studies have shown that people differ in the efficiency with which they use their available cognitive capacity (Ahern & Beatty, 1979). The presupposition is that designers have limitations on their mental resources that can impede the generation of design concepts. Therefore, in the present study, cognitive efficiency was assessed to indicate how efficiently designers generate design concepts given a limited amount of mental resources.
Cognitive efficiency can be measured at two levels: neurological efficiency and performance efficiency. Neurological efficiency is substantiated by the location and the degree of brain activity, such as changes in regional cerebral blood flow and neural activation detected by brain-imaging technology (Neubauer & Fink, 2009). Individuals are considered cognitively efficient when they solve tasks correctly using less brain energy resources as evidenced by a lower cerebral glucose metabolic rate (Haier, Siegel, Tang, Abel, & Buchsbaum, 1992) or higher alpha power of electroencephalography (EEG) signals (Jausovec, 2000). Studies in neuroscience also suggest that the efficiency of interactions between brain regions is a critical determinant of differences in individual performance (Rypma et al., 2006).
However, due to technological bottlenecks, the understanding and interpretation of physiological signals are still a long way from explaining the complex design cognition during design processes. For example, EEG technology can record only the electrical voltage on the cortical surface rather than within the brain. Also, EEG signals are very sensitive to fluctuating mental and emotional states, so they should be recalibrated as frequently as every few minutes. Hence, experimental tasks are always designed to be very specific, for example, well- and ill-defined problems (Jausovec, 1997), convergent and divergent thinking questions (Mölle, Marshall, Wolf, Fehm, & Born, 1999), and free-associative and intelligence-related tasks (Fink et al., 2009), so that the tasks can be completed in a short period of time. In addition, designers’ sketching activities, which are critical for visual thinking and concept development (Menezes & Lawson, 2006; Suwa, Gero, & Purcell, 1998; Tovey, Porter, & Newman, 2003), are constrained. All these limitations constrain the measurement of neurological efficiency during conceptual design processes.
Cognitive efficiency can also be measured at the performance level. Performance efficiency can be determined by individual performance and mental effort, for example, the difference between standardized performance scores and mental effort scores (Paas & van Merriënboer, 1993) or the ratio of performance to mental effort (Kalyuga & Sweller, 2005). Mental effort can be assessed by physiological methods, dual-task methods, and subjective methods (Cennamo, 1993). There are some limitations on applying the first two methods in a design process. Physiological methods will constrain designers’ sketching activities and body movements. Dual-task methods require that a second task is implemented at the same break point of a primary task (i.e., a design task). A design process is a series of design activities, including framing the design problem, specifying physical parameters, concept generation and evaluation, decision making, sketching, and so on. Participants usually perform the task at their own pace, and the order of the design activities is quite different from person to person. Therefore, it is difficult to have all the participants engage in two tasks simultaneously. Subjective ratings of effort can be used as validation criteria to which the physiological measures are compared (Vicente, Thornton, & Moray, 1987). Johanssen et al. (1979) stated that “rating scales must be regarded as central to any investigation. If the person feels loaded and effortful, he is loaded and effortful, whatever the behavioral and performance measures may show” (p. 105).
In the present study, cognitive efficiency was measured at the level of performance efficiency. Designers were asked to complete an open-ended design task without any constraints on time and body movements. Mental effort was self-reported by designers. Cognitive efficiency was used to represent the creativity level of design outcomes in relation to the mental effort invested during a conceptual design process. The more creative the design solutions and the lower the mental effort spent to generate the design concepts, the greater the degree of cognitive efficiency attributed to a given designer during a conceptual design process.
The objective of this paper is to propose a method by which to assess designers’ mental effort and design outcome performance in terms of cognitive efficiency. The practical applications of cognitive efficiency evaluation include designer training, design methodology evaluation, and design process improvement. Research on expert performance and expertise has shown that important characteristics of experts’ superior performance are acquired through experience and that the effect of practice on performance is larger than that of talent (Ericsson, Krampe, & Teschromer, 1993). Learners and operators are encouraged to practice. It has been well accepted that practice improves performance while reducing the effort necessary to complete the task. Therefore, the problem-solving skill can be assessed by outcome performance or mental effort. However, a pilot study indicated that, in an open-ended design task, expertise in design may not necessarily reduce mental effort but does improve design outcomes and cognitive efficiency (Sun & Yao, 2012). Thus, in the conceptual design stage, the evaluation of design outcomes alone or designers’ mental effort alone may not be sufficient to have an accurate assessment of designers’ performance.
The remainder of the present paper is organized as follows. First, the experimental methods, including the evaluations of expertise level, mental effort, design outcomes, and cognitive efficiency, are introduced. The expertise level of designers was quantified according to the engineering work experience requirements for licensure. Designers’ self-reported mental effort right after completing a design task is presented. Design outcomes were evaluated according to the four dimensions of creativity: novelty, variety, quality, and quantity (Shah, Smith, & Vargas-Hernandez, 2003). Cognitive efficiency represents the difference between benefit (design outcomes) and cost (mental effort). The results of the measures and relations between them are presented. Creativity levels and cognitive efficiency scores are compared between the experienced and inexperienced designers. The cognitive efficiency scores of individuals who applied different design methods are compared to identify effective design strategies. Afterward, factors that influence mental effort and cognitive efficiency are discussed. Finally, the generalization and limitations of the experimental methods, as well as the implications for future research, are discussed.
Method
Participants
Twenty participants, 15 males and 5 females, 20 to 50 years of age, were recruited from the Faculty of Engineering at the University of New Brunswick. The participant group included 11 mechanical, 2 civil, 2 chemical, 2 computer, 1 geometric, and 2 electrical engineering students and staff members. Five of them were undergraduate students, 6 were master’s students, another 7 were PhD students, and 2 were staff members. They all volunteered to participate in this research and each of them signed a consent form before the experiment began.
Design Task
The task was to design a teaching podium. The following standard description of the design task was provided to the participants with a picture of the classroom layout:
A teaching podium, also called a lectern, is a stand for instructors to set up a laptop and present their lecture notes and other teaching materials. Some of the classrooms at our university do not have a good teaching podium. The space between students’ desks and the chalkboard is limited. Sometimes, the teaching podium needs to be moved or adjusted so that it doesn’t block students’ view of the chalkboard. You are asked to design a teaching podium used in general-purpose classrooms, which can accommodate at least 100 students. It can be moved and installed easily. It is a useful multimedia teaching tool for the instructors. You need to show all the steps toward the final solution and draw sketches to represent your design concepts.
It is important to consider the length, the context specificity, and the complexity of the task because these characteristics can affect design behavior and performance (Atman et al., 2005). To accommodate all participants, the design task selected for the present study was an open-ended and ill-structured problem, which had three characteristics (Simon, 1978). First, the goals of the problem were not well defined, and designers had to identify the functional requirements before starting design processes. Second, the information needed to solve the problem cannot be sufficiently obtained from the problem description; designers needed to generate concepts to satisfy those functional requirements. Third, there was no simple way of finding all of the alternative possibilities; design solutions were not unique and designers could generate as many concepts as they wished. Meanwhile, the design task was related to the engineering knowledge and design methodology required to complete the design.
Experimental Procedure
The experiment was conducted in a quiet research lab. Before the experiment, all the participants completed a survey form to allow the researchers to obtain information about the participants’ educational background and experience in design. In the survey form, participants were asked questions about age range (<25, 26–30, 31–35, 36–40, 41–45, 46–50, >50), study program, and the year of program. They were also asked four questions about design interest, educational background, and design experience: (a) “Do you like design? If yes, which kind of design do you like best, e.g. architecture, mechanical, structural, furniture, costume, fashion, etc.?” (b) “Have you designed something or tried to design something before? If yes, what did you design?” (c) “Have you studied any courses about design theory or methodology? If so, what did you learn from them?” and (d) “Do you have any work experience in the design of mechanical, electrical, or structural, architecture, etc.? If so, how many years?”
Each experiment was divided into a design session and an interview session. Both sessions were conducted according to the desired pace of each participant. There was no time limit for the participants to perform the task. Before the design session, each participant spent several minutes practicing sketching on the graphics tablet (Cintiq 21UX pen display, Wacom, Japan) and using the sketch software (Painter Sketch Pad, Corel, USA). The standard user guide of tablet and sketch software was orally introduced to the participant. Figure 1 shows the experiment setup. During the design session, the participants were asked to write down any ideas about the design problem, including sketches, textural descriptions, plans, notes, tables, signs, and so on. Figure 2 shows two examples of design outcomes. The design sketches were drawn on the graphics tablet screen and recorded by screen recorder software throughout the entire design session. The hand gestures were also recorded by video cameras. Each participant worked individually and independently. In the whole process of the experiment, the participants could ask any questions about the design problem, the usage of tablet and software, and the experiment procedure. The experimenter would not provide any information about design solutions.
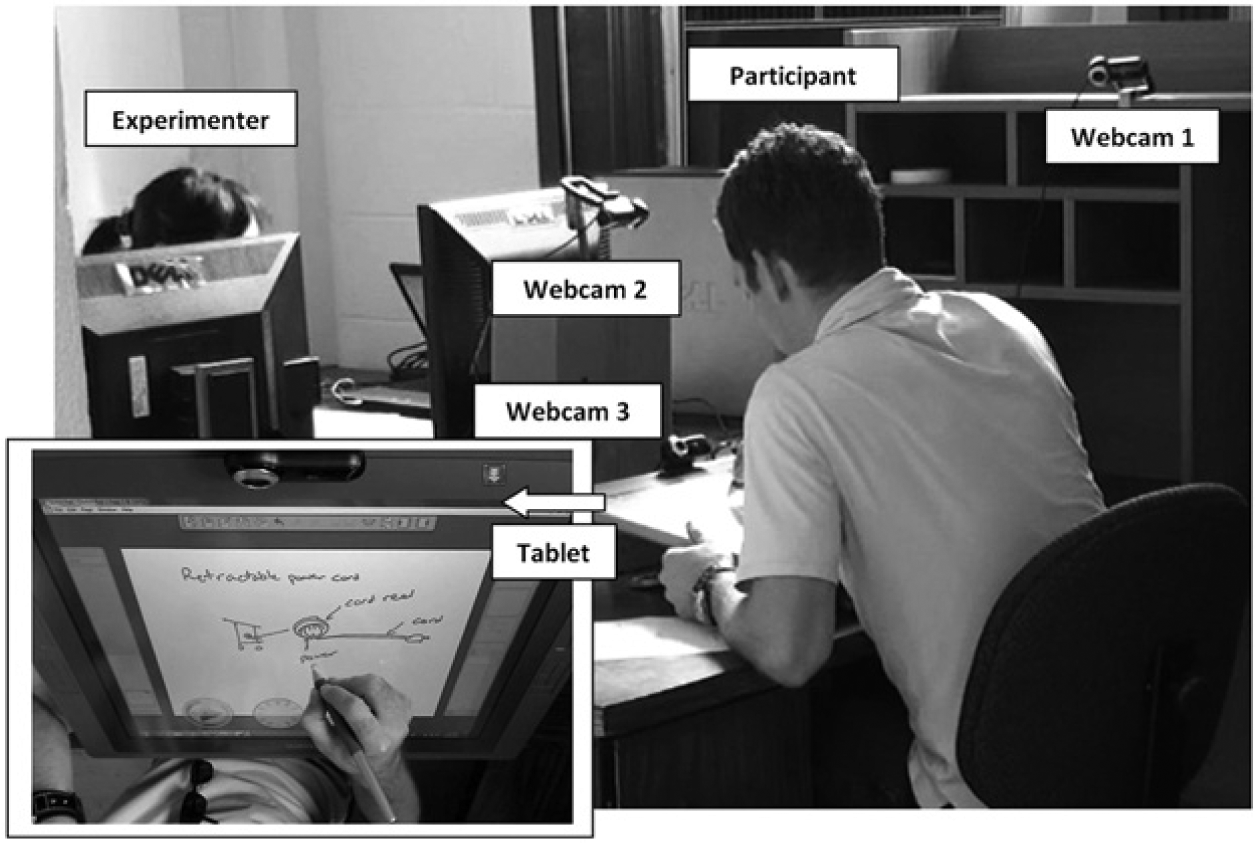
Experiment setup. In the design session, three webcams separately recorded the side, top, and front views of the sketches and gestures. The experimenter watched real-time videos from three monitors. The sketches were also recorded by screen recorder software. In the interview session, the video, which recorded the top view of sketches and gestures (the illustration on the bottom left corner), was played on the tablet to help the participant recall thoughts and design actions in the design session. The interview session was recorded only by Webcam 2 (top view).
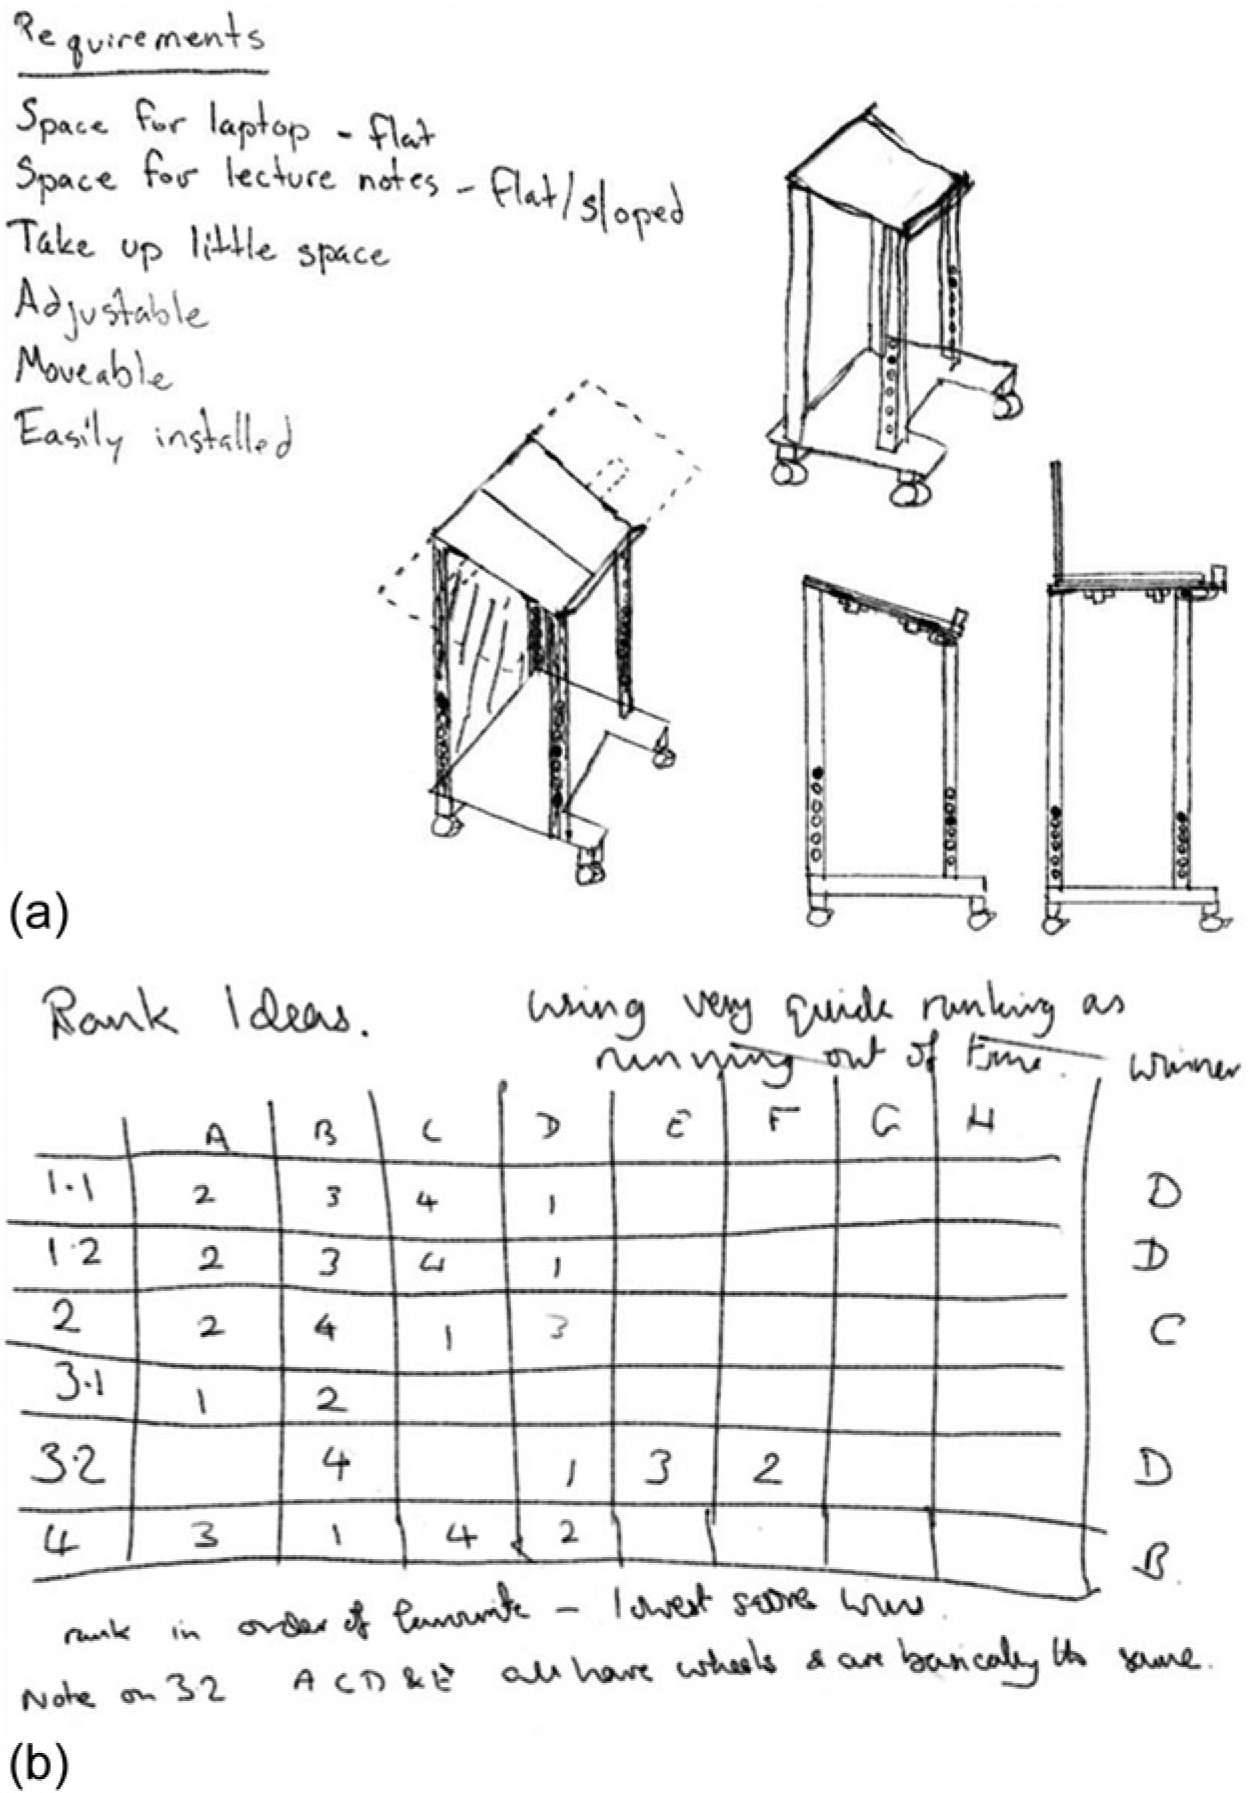
Two examples of design outcomes generated by two participants. (a) Sketches of a teaching podium and requirements of the design problem written by one participant. (b) A decision matrix was used by another participant to rank the design concepts he had generated.
Immediately after completing the design task, each participant was asked to report the level of mental effort using the Rating Scale Mental Effort (RSME; De Waard, 1996; Zijlstra & van Doorn, 1985). The written instruction was, “Please indicate, by marking the vertical axis below, how much effort it took for you to complete the task you’ve just finished.” The official RSME is 150 mm long, representing 150 scores from 0 at the bottom to 150 at the top. The score is indicated by 16 increments on the left side of the scale from 0 to 150 with a step of 10, and on the right is the description of nine levels of effort ranging from absolutely no effort to extreme effort. The scale translates the perceived amount of mental effort into a numerical value between 0 and 150.
During the interview session, the participants were encouraged to verbally report the content and sequence of their thoughts while finalizing their design solutions at the same time. Retrospective protocols instead of concurrent protocols were used because retrospective protocols are appropriate when studying the ways in which designers cognitively interact with their own sketches (Suwa, Purcell, & Gero, 1998; Suwa & Tversky, 1997). Concurrent protocols rely on working memory, which may interfere with cognitive efficiency especially when the task is complex and the designers are not trained to “think aloud” (van Gog, Kester, Nievelstein, Giesbers, & Paas, 2009). To limit the disadvantages of retrospective protocols, such as omissions and constructions of actions (Kuusela & Paul, 2000; van Gog, Paas, & van Merriënboer, 2005), videos of sketching processes and hand gestures were used as cues for recalling cognitive activity. In the experiments, all participants agreed that the cues were very helpful for recalling their thoughts. The interview session was also video- and audio-recorded for subsequent verbal protocol analysis.
After reporting their thought processes, participants were asked to answer three specific questions by the experimenter: (a) How would you rate the difficulty of the design task on a scale of 1 (not difficult at all) to 5 (very difficult)? (b) How would you rate your level of interest in the design problem on a scale of 1 (not interesting at all) to 5 (very interesting)? and (c) How would you rate your degree of satisfaction with your own design solution on a scale of 1 (not satisfied at all) to 5 (very satisfied)?
Evaluation of Expertise Level
Information about the participants’ educational background and experience in design were collected from the survey form. A numeric method was used to quantify participants’ expertise level in the area of mechanical engineering design according to the engineering work experience requirements for licensure (“Become a P.Eng./Requirements for Licensure,” 2013). The detailed calculation is listed in Table 2. Work experience per year in the area of mechanical engineering can be counted as 1 point. One academic degree or diploma can be converted into 1 year of work experience, which counts as 1 point. For students who have no real work experience, the experience of participating in engineering projects in summer or senior design courses can be converted into 0.5 points.
Expertise Level Calculation
The 20 participants were then evenly divided into two groups: the inexperienced group and the experienced group. The expertise levels of participants in the inexperienced group were less than 1 point (<1), and the average score was about 0. The expertise levels of participants in the experienced group were more than 1 point (≥1), and the average score was about 3. Three people in the experienced group had worked as professional designers in industry before they returned to graduate school, and their expertise level scores were over 2 (>2). Seven other people in the experienced group had scores between 1 and 2 (≥1 and ≤2).
Creativity Evaluation
Design outcomes are evaluated according to the creativity of design solutions because creativity is normally regarded as a significant characteristic of an overall “good” design (Dorst & Cross, 2001). Creativity is domain specific (Baer, 2011). It has been argued that the ultimate goal of creativity lies in the production of novel, socially valued products (Mumford & Gustafson, 1988). Mayer (1999) summarized various definitions of creativity as the “creation of new and useful products including ideas as well as concrete objects” (p. 450). In engineering design, creativity involves producing something that is not only new but also unexpected and valuable (Gero, 1996).
There are no standard criteria for identifying highly creative designs. Different attributes of creative products have been summarized, such as flexibility and originality (Jansson & Smith, 1991), novelty and appropriateness (Sternberg, 1999), and practicality and originality (Goldschmidt & Smolkov, 2006). In the present paper, four measures proposed by Shah et al. (2003), that is, novelty, variety, quality, and quantity, were used to evaluate the creativity level of design outcomes. These measures have previously been applied in engineering design for evaluating the creativity of concept generation (Chusilp & Jin, 2006). Since the concept of creativity is multidimensional (Zeng, 2010), it would be difficult to understand the significance of an overall measure consolidating all four measures (Shah et al., 2003).
Novelty, variety, and quantity were evaluated by an evaluator who had studied design theory and methodology and had design project experience. Quality was evaluated by the evaluator aforementioned and another evaluator who had equivalent design knowledge and experience. The evaluation process was inspected by a design expert who had years of design experience. One of the two evaluators transcribed the verbal reports generated by the participants before the evaluation process. Neither the evaluators nor the inspector knew the participants’ backgrounds before the evaluation process. The evaluation of creativity was based on the design outcomes, including sketches and the transcribed verbal protocols. The procedures for calculating the four measures, along with examples, are introduced next.
Novelty
Novelty is a measure of how unusual or unexpected an idea is compared to other ideas in the same group. To measure novelty, the design problem is first decomposed into its key functions. Every idea generated is analyzed by identifying which function it satisfies and describing how it satisfies the function. Each description is then graded for novelty according to the design outcomes generated by all 20 participants. The novelty score can be computed using Equation 1.
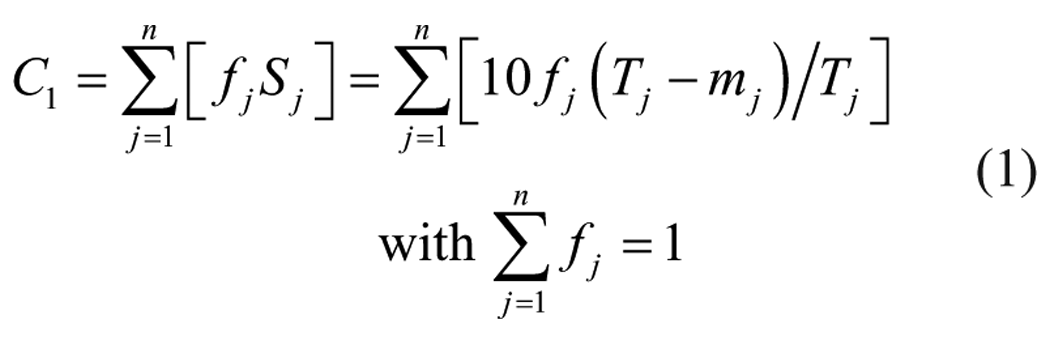
C1 is the overall novelty score for the design outcomes with n functions. Weights fj are assigned according to the importance of each function. Sj is the novelty subscore for the function fj. Tj is the total number of concepts generated by all participants for the function fj, and mj is the number of the current concept for the current function fj. The lower the mj (which means fewer other participants generated the same concept), the higher the novelty. Multiplying by 10 normalizes the expression on an equivalent scale to the variety and quality scores.
In the original work of Shah et al. (2003), the overall novelty score was based on the final design solutions. In the present paper, the overall novelty score represents the novelty of all concepts generated during the design process even though some of the novel concepts were later dismissed in the final design solutions by the participants. This measure represents the average novelty level of all the concepts generated by each participant.
An example shows the calculation of novelty score C1. For the design problem, a teaching podium, three main functions (n = 3) were defined by an evaluator: accommodate teaching materials (f1), be movable (f2), and be adjustable (f3). Since the space for locating a teaching podium was limited and the podium should not block students’ view, the third function was more important than the other two. The weights were assigned as follows: f1 = 0.3, f2 = 0.3, f3 = 0.4. In the current experiment, Sj depended on all concepts generated by all participants. The total number of concepts for each function was T1 = 116, T2 = 41, and T3 = 23. Participants could generate more than one concept for one function. To evaluate the novelty of all the concepts generated by one participant, the average novelty score of each function was calculated for each participant. For example, Participant 1 generated five, one, and three concepts for the three functions, respectively. The novelty subscore for the concept “slope surface” was (116 − 9) / 116 × 10 = 9.22 (9 out of 20 participants generated the same concepts), and the novelty subscore for the concept “power plug-in” was (116 − 5) / 116 × 10 = 9.57 (5 out of 20 participants generated the same concepts). The novelty subscores for these three functions were (9.22 + 9.57 + 8.97 + 9.91 + 9.83) / 5 = 9.5, 9.27 / 1 = 9.27, and (9.57 + 9.57 + 9.57) / 3 = 9.57, respectively. The overall novelty score for the design solutions generated by Participant 1 was the sum product of the weights fj and the novelty subscores Sj, that is, 0.3 × 9.5 + 0.3 × 9.27 + 0.4 × 9.57 = 9.46.
Variety
Variety describes the degree of difference between generated ideas. The measurement is analyzed using a genealogical tree method (Shah et al., 2003). At the highest level, design concepts are differentiated by the different physical principles used by each to satisfy the same function. At the second level, concepts that share the same physical principle are differentiated based on different working principles. At the third level, concepts are differentiated according to embodiments and details. This method of differentiation means that the use of a different physical principle to satisfy the same function makes two design concepts very different (Nelson, Yen, Wilson, & Rosen, 2009). The overall variety score can be computed from the following equation:

C2 is the overall variety score for the design outcomes with n functions. Weights fj are assigned according to the importance of each function. Variables sk and bk are variety subscores and the number of branches at level k (= 1, 2, or 3 in the present study), respectively. The suggested values sk for the three levels are s1 =10, s2 =6, and s3 =3, which ensure that differences at higher levels will always result in a greater score (Shah et al., 2003). The expression (bk − 1) represents the number of differentiations at level k. The nodes in the tree carry the count of ideas in each category at each level. Therefore, the number of differentiations in each level gives an indication of the variety of ideas. The higher the value of bk, the higher the variety score. If there is only one branch at a given level, it shows a lack of variety and the score is zero.
An example shows the calculation of variety score for C2. Participant 1 generated three concepts in total for the function f3: a hinge to adjust the angle of the top surface, a spring to adjust the interaction between the podium and the desk, and a hook to adjust the position of the podium on the desk. These three concepts belong to two different physical principles (b1 = 2). The hinge and the spring adjust the position by changing the gravitational and elastic potential energy, and the hook works because of geometric matching. The three concepts also belong to three different working principles (b2 = 3) and three different embodiments (b3 = 3). So the variety score for f3 was 10 × (2 − 1) + 6 × (3 − 1) + 3 × (3 − 1) = 28. If the variety scores for f1 and f2 were 28 and 0, respectively, the overall variety score for all concepts generated by Participant 1 would be 0.3 × 28 + 0.3 × 0 + 0.4 × 28 = 19.6.
Quality
Quality is a measure of how successfully an idea satisfies the product requirements. In the present paper, the quality of design solutions is the sum product of the score of each product requirement and the corresponding weighting factor, as shown in Equation 3.

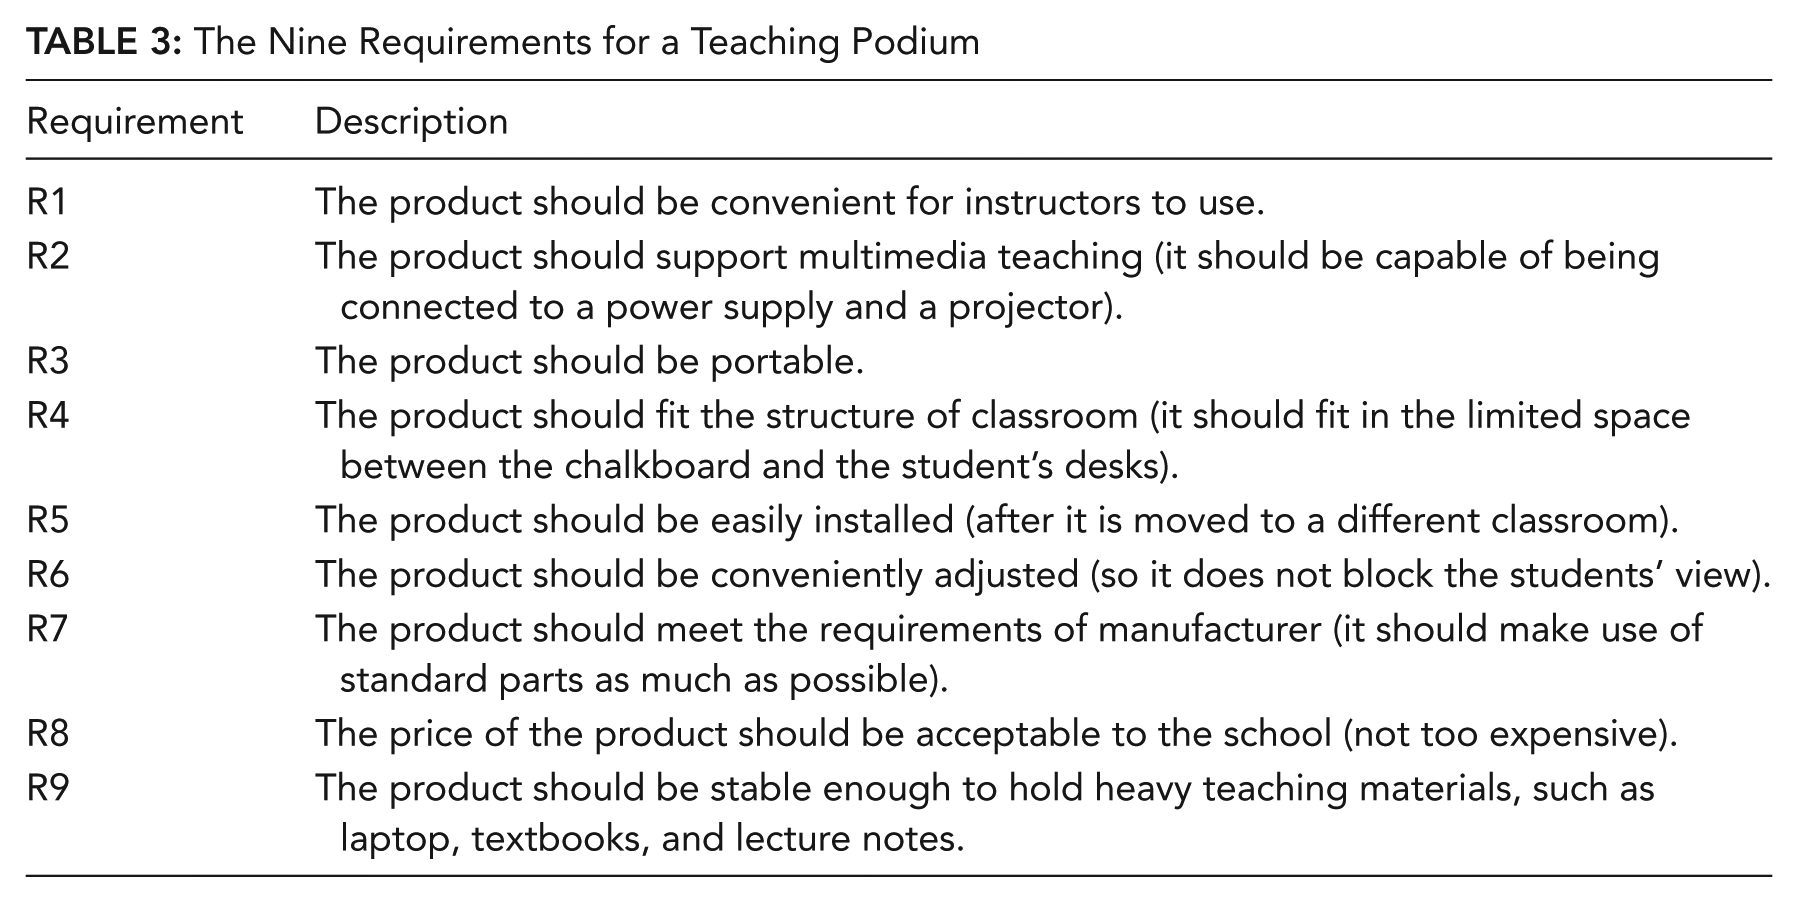
C3 is the overall quality score for the design solutions, and m represents the number of product requirements. The weighting factors fr are calculated by pairwise comparison of the product requirements, and the sum of the normalized weighting factors is equal to 1. The score of each product requirement Sr is given according to the degree of satisfaction; that is, the highest score (10) is assigned if the product requirement is well satisfied and the lowest score (0) if it is not satisfied at all. The product requirements were obtained from all the potential users of this product, such as instructors and students, plus the manufacturer, the seller, and the buyer. The nine requirements for a teaching podium are summarized in Table 3.
The Nine Requirements for a Teaching Podium
Since the assessments of the quality scores for each product requirement Sr rely on human judgment, it is useful to limit subjectivity within these assessments (Christiaans, 2002). In order to identify the rationale behind the judged levels of quality and to test the evaluation consistency, two evaluators independently rated the quality against the product requirements twice within 1 month. One evaluator was among the authors, and the other was external. Both evaluators had studied design theory and methodology and had design project experience. They did not know the designers’ backgrounds before the evaluation process. The evaluators determined the weighting factors fr in Equation 3, rated the score Sr for each requirement satisfaction, but did not calculate the quality scores C3 during the evaluation process. After the evaluation process, one of the two evaluators counted the quality scores for the four ratings and calculated the final quality scores by averaging the second ratings. For the first rating, the Pearson product-moment correlation between the scores for quality from the two evaluators is .970 (p < .05); for the second rating, the Pearson product-moment correlation is .982 (p < .05). The inter-rater reliability, represented by the mean Pearson product-moment correlation, is .976, indicating that the evaluations are reliable.
Quantity
Quantity is represented by the total number of concepts generated during design processes even though some of the concepts are not integrated in the final solutions. The rationale for this measure is that increasing the quantity of ideas would increase the chance of better ideas (Cross & Cross, 1996; Sweller, 2009). Each design concept should meet at least one function and can be identified as an entity in the sketches. Concepts that were not represented in sketches, for example, concepts generated in the interview session, were not included in the measures of quantity. For mechanical engineering design, the function can be specifically referred to as “a physical interaction between two objects of interest, each of which may be a component of a design or the design itself and its environment” (Deng, 2002, p. 344). All the functions are defined on a functional basis whereby each function is characterized in a verb-object format (Stone & Wood, 1999). For example, the function support is defined as “to firmly fix a material into a defined location, or secure energy into a specific course.” Different design concepts, such as a blocker or a Velcro, can be identified to achieve this function: fix and secure a laptop on the top of the teaching podium.
In summary, the four measures can help reduce inconsistency and bias by comparing a design concept to others within the same group. The scores are based on the relative performance in the group. The scores for participants may be relatively high or low, but the overall trend would not change. Therefore, the evaluation of creativity is relatively deterministic in the group.
Cognitive Efficiency
Cognitive efficiency is calculated based on the difference between standardized performance scores and mental effort scores (Paas & van Merriënboer, 1993). To map the units of measurement of mental effort onto those of performance, scores of both mental effort and creativity are normalized by subtracting the grand mean from each score and dividing the result by the grand standard deviation: P = (PO – GP) / SDP, where P is the standardized score for performance, PO is the original score for performance, GP is the grand mean of scores for performance, and SDP is the grand standard deviation of scores for performance; similarly, M = (MO – GM) / SDM, where M is the standardized score for mental effort, MO is the original score for mental effort, GM is the grand mean of scores for mental effort, and SDM is the grand standard deviation of scores for mental effort. The grand mean and the grand standard deviation are based on the data from all the 20 participants. The cognitive efficiency is denoted as E = (P – M) /
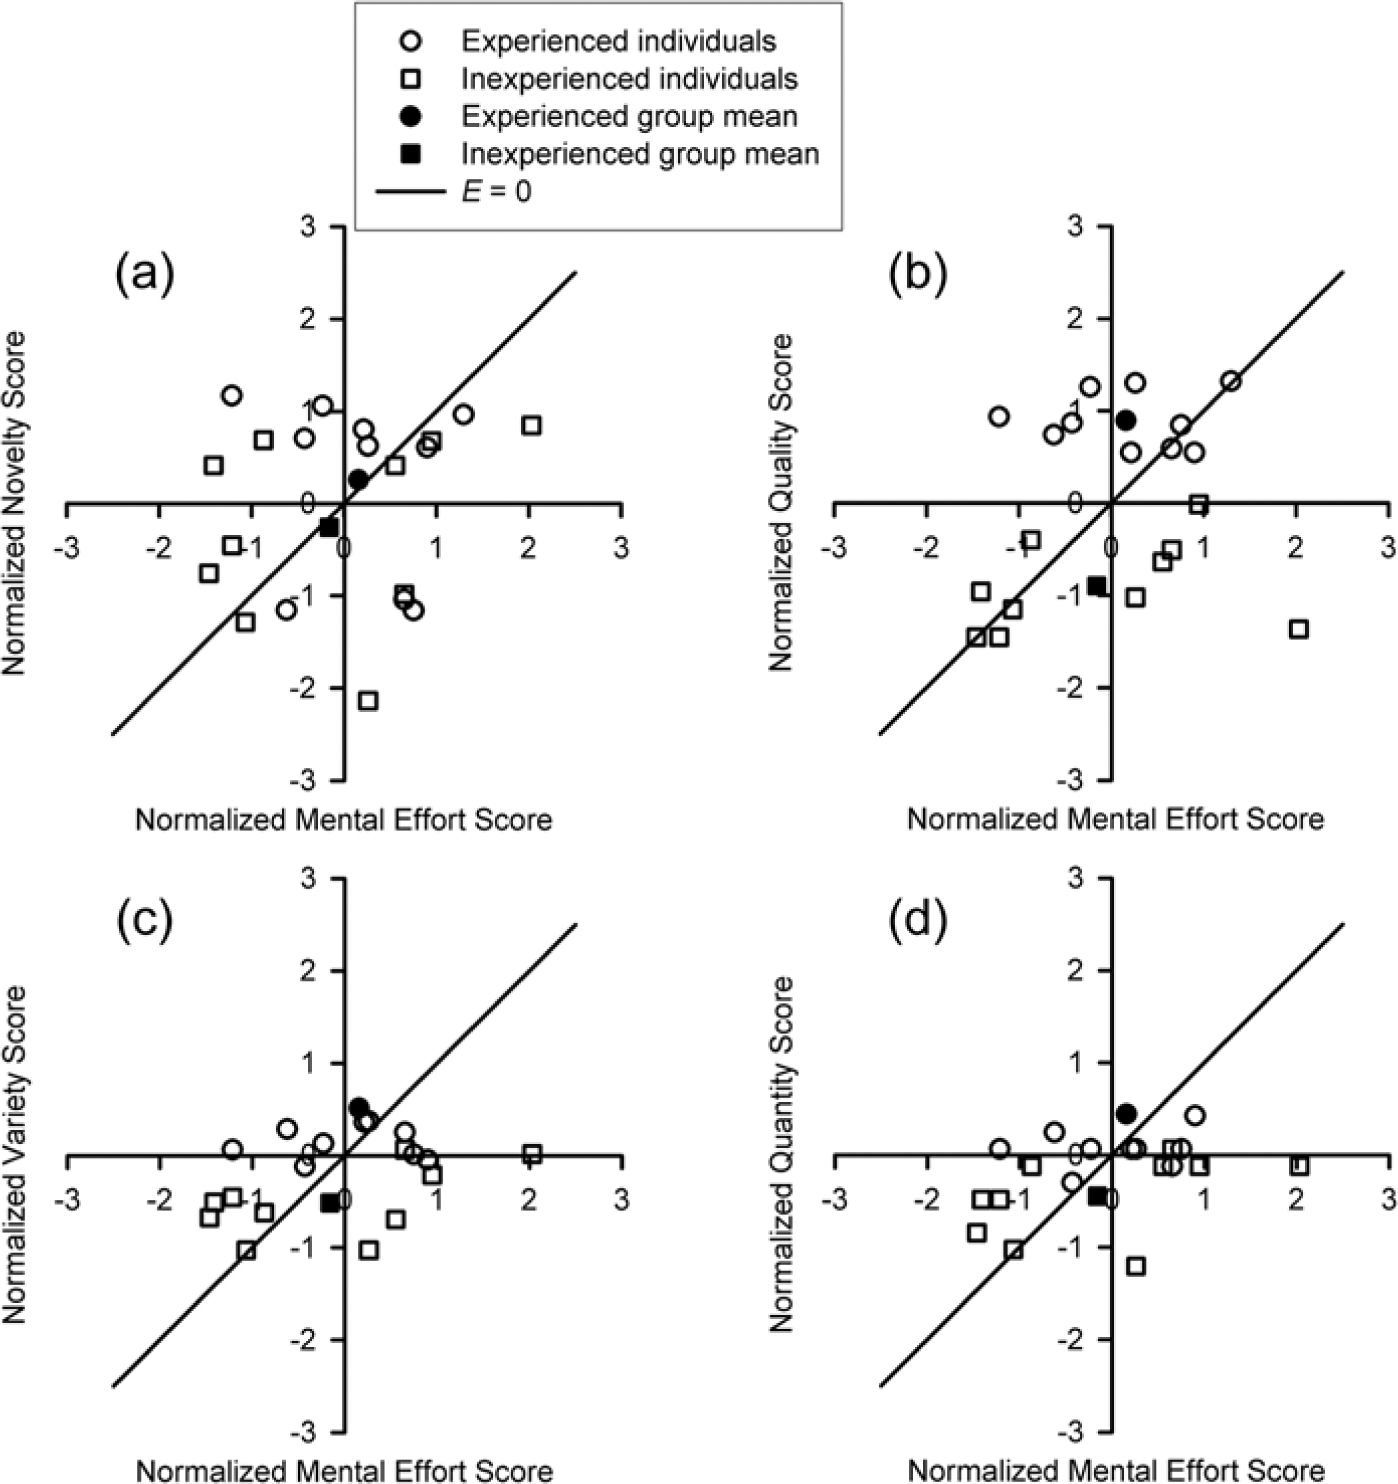
Comparison of cognitive efficiency between the experienced and inexperienced groups. The standardized scores of mental effort and creativity (including novelty, quality, variety, and quantity) are both calculated by subtracting the grand mean from each score and dividing the result by the grand standard deviation. The unfilled circle and square data points represent the experienced and inexperienced groups, respectively. The filled circle and filled square data points are the means of each group. Cognitive efficiency is represented by the perpendicular distance from a certain point to the line E = P −M = 0.
Results
Comparison of Mental Effort and Creativity
The averaged RSME score for the experienced group (57.9 ± 15.8) was marginally higher than for the inexperienced group (51.5 ± 24.5). The differences between the two groups failed to reach statistical significance, t(18) = 0.694, p = .497. The results indicate that the design task did not seem easier for the experienced designers even though they had more experience in design than the inexperienced designers.
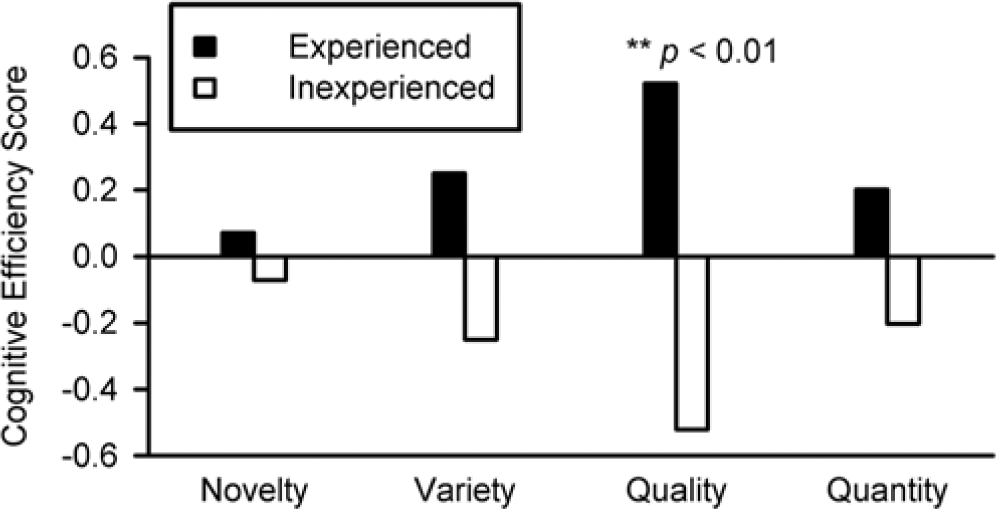
The four measures of creativity for the two groups are presented in Figure 4. It shows that the experienced group had higher averaged scores in all the four measures than the inexperienced group. The variety, t(18) = 2.623, p = .017; quality, t(18) = 9.788, p < .001; and quantity, t(18) = 2.100, p = .049, measures show significant differences between the two groups. The results indicate that the experienced designers generated more concepts with higher degrees of difference and higher quality than did the inexperienced designers. However, the novelty measures do not show significant differences, t(18) =1.161, p = .261.
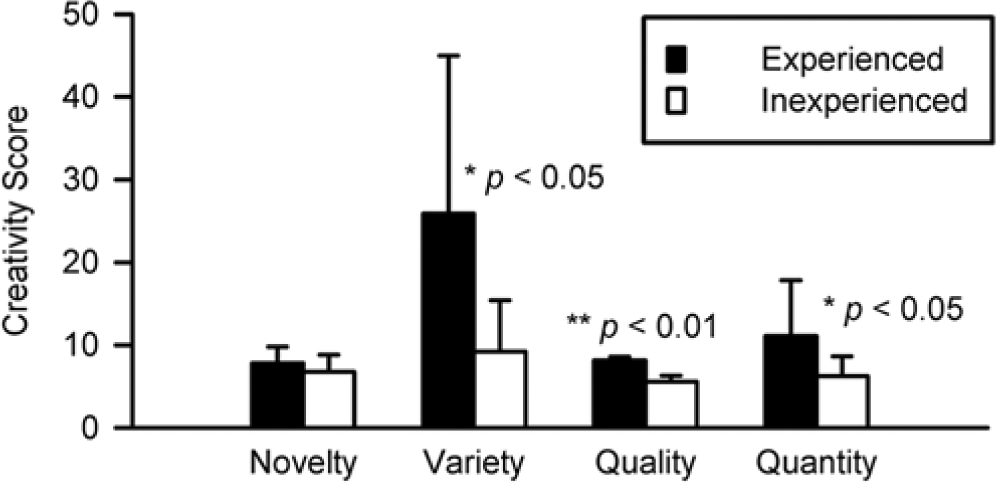
Average scores of four measures of creativity for the experienced and inexperienced groups. Error bars indicate standard deviations of each group.
Comparison of Cognitive Efficiency
Since creativity was evaluated using four dimensions, cognitive efficiency was correspondingly represented by the same four measures in relation to mental effort. The four measures of cognitive efficiency are shown in Figures 3a, 3b, 3c, and 3d. The filled circles are always above the line E = 0, and the filled squares are always below the line, indicating that the experienced group showed higher levels of cognitive efficiency related to the four measures than did the inexperienced group.
As shown in Figure 3a, the efficiency scores of novelty do not support significant differences between the two groups, which means the experienced designers did not demonstrate higher cognitive efficiency in generating novel concepts than did the inexperienced designers. Some inexperienced designers (two unfilled square data points at the northwest quadrant in Figure 3a) even demonstrated higher efficiency scores of novelty than those of most of the experienced designers. The unfilled circle and square points are almost evenly distributed above and below the line E = 0.
In Figure 3b, the cognitive efficiency scores of quality for the two groups are compared. Most of the experienced designers demonstrated higher cognitive efficiency scores of quality than most of the inexperienced designers. The averaged individual cognitive efficiency scores of novelty, variety, quality, and quantity are compared between the two groups in Figure 5. There was a significant difference in the efficiency scores of quality between the two groups (p < .01). The comparison indicates that design expertise significantly improves cognitive efficiency scores of quality. The efficiency scores of variety and quantity did not support significant differences between the two groups (Figures 3c and 3d).
Comparison of cognitive efficiency between the experienced and inexperienced groups. The cognitive efficiency scores of novelty, variety, quality, and quantity were calculated separately for the two groups.
In order to further analyze the contribution of different design methods to cognitive efficiency, the researchers divided the 20 participants into three categories according to the design methods they applied. In the first category, which included seven experienced designers, the participants applied a systematic design method: analyzing customers’ requirements, specifying the requirements by function decomposition, generating alternative design concepts for each function, and evaluating those concepts to propose the final design solutions. In the second category, which included two experienced designers and five inexperienced designers, the participants analyzed customers’ requirements and immediately focused on one design feature of the product. They thought about this feature and focused on the first design concept they generated without considering alternative design concepts. They then invested a great deal of effort in creating detailed drawings of their original concepts rather than improving them or generating alternatives. In the third category, which included one experienced designer and five inexperienced designers, the participants did not explicitly analyze customers’ requirements in detail before generating their initial concepts. They first considered the general concept of a teaching podium according to their own experience, then referred to the description of the design task and modified the original design concepts iteratively until they were satisfied with their design.
The cognitive efficiency scores for the three design methods were also compared. In Figure 6, the cognitive efficiency scores of quality for the three strategies are 0.66, −0.05, and −0.70, respectively. Similarly, the cognitive efficiency scores of novelty for the three methods are 0.32, −0.27, and −0.17, respectively; the cognitive efficiency scores of variety for the three methods are 0.49, −0.11, and −0.54, respectively; and the cognitive efficiency scores of quantity for the three methods are 0.47, −0.16, and −0.47, respectively. These results imply that the systematic design method may be the most efficient one for generating creative design concepts compared with the other two methods. The results also show that cognitive efficiency evaluation is reflective of comparing the efficiency of design processes when different design methods are applied.
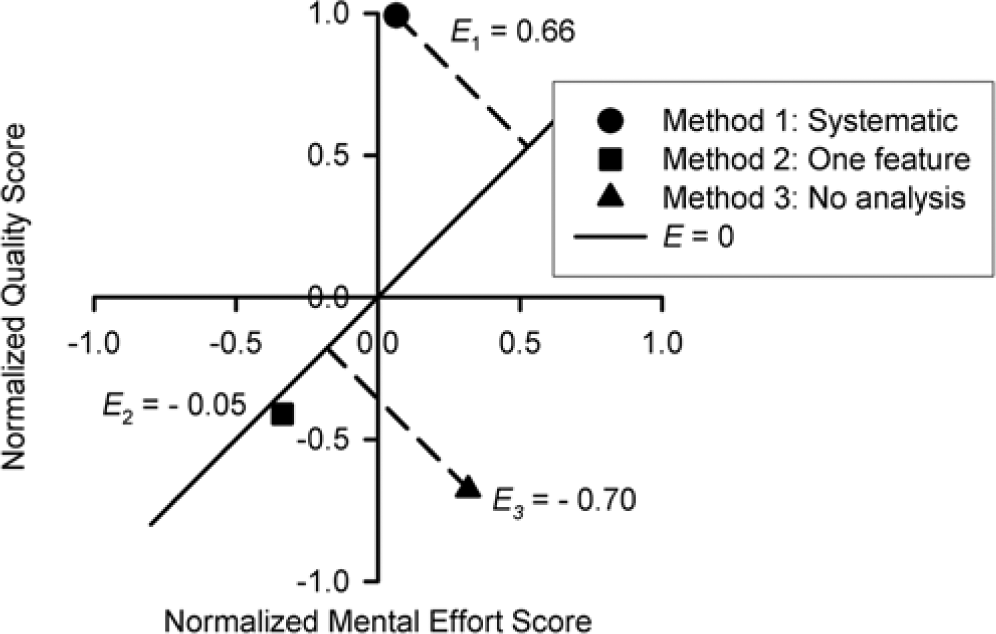
Comparison of cognitive efficiency scores of quality for different design methods applied by designers. The dashed lines represent the perpendicular distances from data points to the line E = 0. The length and direction of the dashed lines determine the cognitive efficiency values. Seven experienced designers applied Method 1. These participants analyzed customers’ requirements for the product, generated alternative design concepts, and evaluated the concepts to arrive at final solutions. Two experienced designers and five inexperienced designers applied Method 2. These participants focused on the first design concept they generated and immediately fixed onto one feature of the product. One experienced designer and five inexperienced designers applied Method 3. These participants did not explicitly analyze customers’ requirements before generating initial concepts.
The Correlation Between Different Measures
The Pearson product-moment correlation between the four measures of creativity, RSME, and expertise level is presented in Table 4. The four measures of creativity were related as follows: variety was significantly related to quality and quantity (p < .01), and quality was significantly related to quantity (p < .05). The relation between quantity and quality indicates that if the number of concepts is increased, the quality of the best concepts would also increase (Sweller, 2009). Novelty and variety seem to be relatively independent of each other. The results did not show that RSME was related to creativity measures. RSME was not related to expertise level either. There was a significant positive correlation between expertise level and quality (p < .05).
Correlation Matrix Between Measures of Creativity, RSME, and Expertise Level
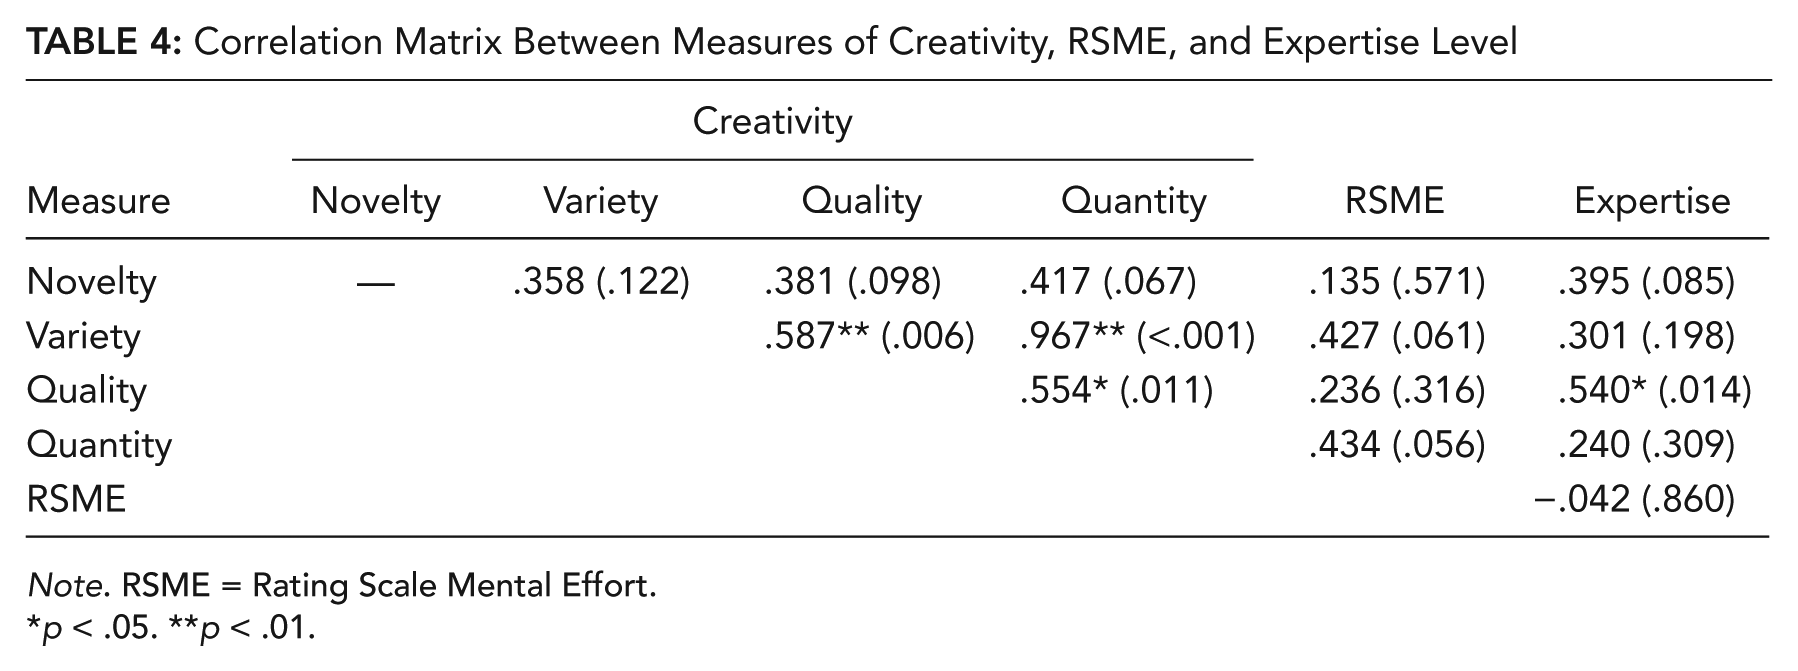
Note. RSME = Rating Scale Mental Effort.
p < .05. **p < .01.
The Pearson product-moment correlation between the four measures of cognitive efficiency and expertise level is presented in Table 5. Only cognitive efficiency scores of quality showed a significant relation with expertise level. Since cognitive efficiency was measured based on RSME, the four measures of cognitive efficiency were definitely related to each other and RSME (all the p values < .01, data not shown in Table 5).
Correlation Matrix Between Measures of Cognitive Efficiency and Expertise Level
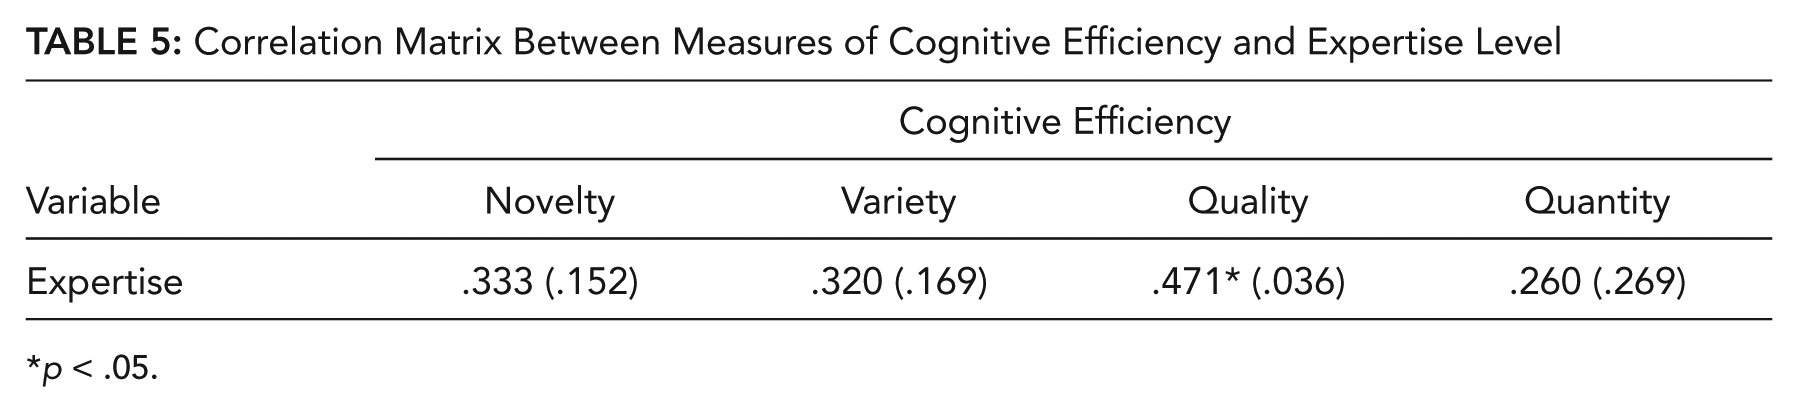
p < .05.
Comparison of Other Self-Report Measures
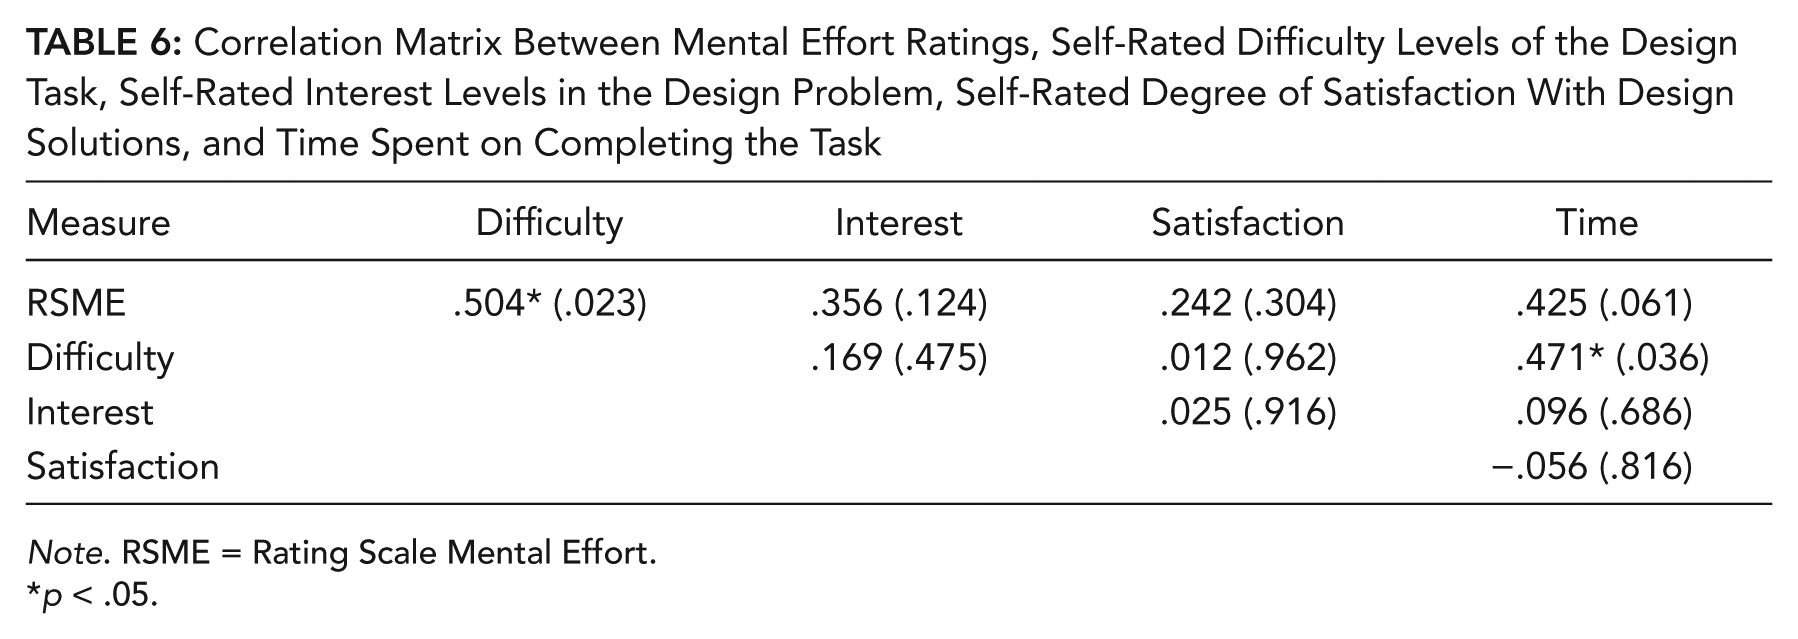
Participants’ ratings for the difficulty level of the design task, interest level in the design problem, and the degree of satisfaction with their own design solutions were compared between the two groups. The data did not support a significant difference for difficulty levels of the design task, t(18) = 1.985, p = .063, between the two groups. The data also failed to support that there were significant differences for the degree of satisfaction, t(18) = 1.406, p = .177, and interest levels, t(18) = −0.204, p = .841, between the two groups.
In this study, each participant worked on the design task at his or her own pace. Time spent on completing the design task varied greatly from person to person (48 ± 37 min for the experienced group and 39 ± 25 min for the inexperienced group). The differences for time spent on the task between the two groups failed to reach statistical significance, t(18) = 0.665, p = .514. However, the time allocation was radically different between the two groups. The experienced group spent 25% of the total time either analyzing the product requirements prior to concept generation or evaluating the design concepts prior to making decisions; however, the inexperienced group spent only 7% of the time on these tasks. The results are consistent with that of a study that showed that senior students spent more time considering more alternatives than did junior students (Atman et al., 2005).
Table 6 lists the Pearson product-moment correlation between RSME, self-rated difficulty levels of the design task, self-rated interest levels in the design problem, self-rated degree of satisfaction with design solutions, and time spent on completing the task. The self-rated difficulty levels of the design task were positively related to the mental effort ratings (r = .504, p = .023). In addition, the frequency distributions of difficulty-level scores showed that the most frequent scores were 3 and 2, respectively, for the experienced and inexperienced designers. The results may indicate that design experience reported by the experienced designers did not relieve their mental effort because they perceived higher difficulty levels for the same design task than the inexperienced designers.
Correlation Matrix Between Mental Effort Ratings, Self-Rated Difficulty Levels of the Design Task, Self-Rated Interest Levels in the Design Problem, Self-Rated Degree of Satisfaction With Design Solutions, and Time Spent on Completing the Task
Note. RSME = Rating Scale Mental Effort.
p < .05.
Discussion
In this study, cognitive efficiency was represented by the mental effort of designers and the creativity level of design outcomes. Since mental effort and cognitive efficiency during a conceptual design process have not been well studied, in this section, factors that influence mental effort and cognitive efficiency will be discussed along with the implications for future research.
Mental Effort
It is not surprising that the experienced group outperformed the inexperienced group in the creativity of design solutions (see Figure 4) because experienced designers have prior domain-specific knowledge, experiences, strategies, and methods to improve design processes. It seems intuitive to expect that the design task should be easier for the experienced designers than for the inexperienced designers. However, that the experienced designers invested less mental effort than the inexperienced designers was not expected.
Mental effort can be divided into two types: task-related effort and state-related effort (Mulder, 1986). Task-related effort is mainly determined by the intrinsic demands, that is, the difficulty of the task, whereas state-related effort is required to protect performance from the detrimental influence of the designers’ physiological state, for example, fatigue and stress. In this study, the difficulty levels most frequently reported by the experienced and inexperienced designers were 3 and 2, respectively. The self-reported difficulty levels of the design task were positively related to the self-reported mental effort ratings (see Table 6). Therefore, the experienced designers invested higher task-related effort than did the inexperienced designers presumably because the experienced designers better understood the challenge of the design task. Previous studies have also shown that experts dedicate a substantially greater effort than novices while elaborating on their understanding of a problem (Casakin, 2004). Other previous studies have shown that invested mental effort, defined as the number of non-automatic mental elaborations necessary to solve a problem, is significantly influenced by the perceived complex/ambiguous features of material encountered (Salomon, 1983).
Regarding state-related effort in this study, mental effort may have accumulated with time spent achieving the task. State-related effort may also be affected by interest levels in the design problem and the degree of satisfaction with design solutions, both of which are critical parts of motivation. In this study, the experienced group did not spend significantly more time achieving the task than the inexperienced group, even though the former allocated much more time to analysis and evaluation during the design process. The factors time, interest level, and degree of satisfaction were not significantly related to mental effort ratings (see Table 6). Therefore, the data do not support that the experienced designers invested higher state-related mental effort than did the inexperienced designers.
Cognitive Efficiency
Cognitive efficiency can be influenced by factors such as prior knowledge, working memory capacity, motivation, and use of strategy (Hoffman, 2012). The experienced designers had more domain-specific knowledge about the mechanical components of a podium than the inexperienced designers. Furthermore, the experienced designers had more prior knowledge and experience about design methodology. They had taken design courses and learned to specify design requirements, generate and evaluate design concepts, and make decisions to arrive at final design solutions. It has been proposed elsewhere that a designer’s cognitive capacity can be extended by prior knowledge and experience in solving design problems according to the theory of chunks of information (Ullman, 2009). Studies have shown that experts’ cognitive processing is structured such that it stays within the limits of human short-term memory (Kavakli & Gero, 2003). Another study showed that experts’ cognitive activity and productivity in design processes can be almost 3 times higher than novices’ (Kavakli, Suwa, Gero, & Purcell, 1999). Therefore, designers’ cognitive capacity and their organization of cognitive activity can affect cognitive efficiency.
High motivation is related to having high interest in the design task presented in this experiment and having the confidence to successfully solve the design problem (Glynn, Brickman, Armstrong, & Taasoobshirazi, 2011). However, the differences for self-reported interest in the design task and the degree of satisfaction between the two groups failed to reach statistical significance. Therefore, in the present study, motivation may not be a critical factor affecting cognitive efficiency.
The data in Figure 6 show that design methods influenced cognitive efficiency. The participants who applied the systematic design method received the highest scores on average for cognitive efficiency of quality. By contrast, the participants who did not apply any design methods received the lowest scores on average. Research on design theory and methodology focuses on how humans design rather than what they design. Design theory and methodology have been applied to generating creative design solutions, enriching functional and attributive information of design solutions, managing design processes, and representing design knowledge (Tomiyama et al., 2009). However, the effect of design methodology on the improvement of cognitive efficiency has not been well studied. It is not clear how design methodology can improve the usage of limited cognitive resources. One possible reason is that design methodology can help to structure the abstraction hierarchies of problem solving (Kavakli et al., 1999). Other possible reasons may include improving decision making (by math-based methods, such as decision matrix), achieving concrete design goals (especially for open-ended and ill-structured design problems), and allocating time for design processes (spending more time on framing and evaluating).
Not all the experienced group members applied the systematic design method. The experienced designers who did not apply systematic design methods did not perform better than the inexperienced designers who applied effective methods. This result implies that the usage of effective methods could help make up for a lack of experience and knowledge, even though 3 out of 10 experienced designers performed at high levels without using the systematic design method. The measure of cognitive efficiency proposed in this study is anticipated to assess design methodology applied in design processes.
In the current study, cognitive efficiency is found to be related to expertise in design. Expertise levels were related to cognitive efficiency scores of quality (as shown in Table 5). Experienced designers demonstrated significantly higher cognitive efficiency scores of quality than did inexperienced designers (as shown in Figure 5). In this study, experienced designers were not experts (i.e., those with at least 10 years design experience; Ericsson et al., 1993), and the expertise levels of the two groups were very close: 3 versus 0. It is still unknown whether cognitive efficiency would continuously increase with the amount of design experience. The assumption is that the amount of experience may increase the differences in cognitive efficiency on some scales, but design experience and cognitive efficiency would probably not be linearly related.
Creativity levels of design outcomes are rated based on designers’ relative performance in the group. If the differences in expertise levels between the two groups increase, the differences between ratings of design outcomes are anticipated to increase. If experienced designers report less mental effort to complete the task than inexperienced designers (because of more design knowledge and experience), the differences in cognitive efficiency would be increased. So the amount of experience may increase the differences in cognitive efficiency. However, if experienced designers report more mental effort than inexperienced designers (because of more perceived challenge and higher motivation), it is uncertain whether the differences in cognitive efficiency would increase with experience. The contribution of design expertise to increasing cognitive efficiency may be negated by the increased mental effort. The measure of cognitive efficiency should be examined in the future by considering different populations of designers.
In summary, the experienced group had higher scores in cognitive efficiency because of greater prior knowledge about design processes, better use of design strategy on average, and more domain-specific knowledge and work experience. It takes time and deliberate practice to become an expert (Ericsson et al., 1993). However, given the observations and analysis of this study, applying a systematic design method may improve cognitive efficiency (as shown in Figure 6). In future work, it would be valuable to further investigate the effects of different expertise levels and different design methods on cognitive efficiency.
Applications
The cognitive efficiency measures can be applied to evaluating designers’ performance because they were found to be related to designers’ expertise levels. In this study, the efficiency scores of quality were significantly different between the experienced and inexperienced groups. The four measures of cognitive efficiency can be used in different situations. For engineering professional certification, efficiency in quality may be the most important; for innovation competitions and artwork development, efficiency in novelty and variety may be more useful than in quality. The four measures should not be substituted for each other, and it is difficult to describe the significance of an overall measure consolidating all four measures.
The measure of cognitive efficiency proposed in this paper can also be applied to evaluating design methodologies and strategies (as shown in Figure 6). Cognitive efficiency is a supplement to the evaluation of designers’ performance, such as results-oriented measures (creativity level of design outcomes) and designer-oriented measures (designers’ mental effort). Results-oriented measures do not reflect designers’ cognitive demands. The assessment of mental effort is a valuable addition to the available methods of performance measurement because particular training or task environments may sometimes have no significant impact on measures of performance (Paas & van Merriënboer, 1993). Designer-oriented measures are also not sensitive enough because tasks that require very high or very low levels of mental effort discourage human performance (Paas et al., 2004; Svensson, Angelborg-Thanderz, Sjoberg, & Olsson, 1997), and it is very difficult to find an optimal level of mental effort for each individual. Cognitive efficiency involves consideration of both designers’ demands and design outcomes. The three measures should not be substituted for each other because they focus on different aspects: the designer, the design outcomes, and the relationship between the designer and the design outcomes. In Figure 3, the three evaluations are demonstrated simultaneously by the x-coordinates, the y-coordinates, and the distances to the reference line E = 0. The measure proposed in the current study not only focuses on the relationship between the designer and the design outcomes but also presents the other two evaluations.
The method proposed in the current paper helps to identify the strategies that can also be used for problem solving in other fields. The design strategies, for example, generating as many ideas as possible or focusing on the initial idea, are used to structure the design process. In engineering design, designers use three types of knowledge: knowledge to generate ideas, knowledge to evaluate ideas, and knowledge to structure the design process (Ullman, 2009). The first two types of knowledge are domain specific. Idea generation comes from natural ability and experience; idea evaluation comes from experience and formal training. However, knowledge about the design process is largely independent of domain-specific knowledge (Ullman, 2009). In the current study, the three design methods (as shown in Figure 6) leading to different levels of cognitive efficiency belong to the third type of knowledge. The current paper is a first step in exploring the possibility that strategies can influence cognitive efficiency. Additional studies using domain-specific design problems across different fields, such as electrical and software engineering, will definitely increase generalization and will be considered in our future work.
Summary and Conclusions
In this paper, we propose a method that can quantitatively describe cognitive efficiency. Cognitive efficiency was measured by the difference between the creativity of design outcomes (the benefit) and mental effort (the cost). Cognitive efficiency has four corresponding measures based on the four measures of creativity. The four measures of cognitive efficiency can be used in different situations. The 20 participants were evenly divided into an experienced group and an inexperienced group according to their educational background and work experience in the area of mechanical engineering. The experienced designers demonstrated significantly higher cognitive efficiency scores of quality than did the inexperienced designers. The creativity measure of quality and corresponding cognitive efficiency scores of quality are related to designers’ expertise levels.
Cognitive efficiency was affected by not only design experience but also design methods applied by designers. Designers who applied the systematic design method received the highest cognitive efficiency scores compared with those who applied the other two design methods. The usage of effective design methods could help designers improve cognitive efficiency even if they lack experience and domain-specific knowledge. Cognitive efficiency evaluation is anticipated to aid in identifying design strategies and comparing the effectiveness of design methods applied in design processes.
Cognitive efficiency evaluation involves consideration of both designers’ cognitive demands and design outcomes. The three measures should not be substituted for each other because they focus on different aspects: the designer, the design outcomes, and the relationship between the designer and the design outcomes. The method proposed in this study can simultaneously demonstrate the three measures graphically: how creative the design outcomes are, how much effort designers have experienced to generate the outcomes, and how efficiently the design outcomes are generated given different expertise levels and strategies.
In future work, the verbal protocols collected from the participants will be analyzed to further investigate why experienced designers demonstrate higher cognitive efficiency than inexperienced designers. Analyzing information contained in cognitive processes will help explain why the structure of cognitive actions would affect cognitive efficiency (Sun, Yao, & Carretero, 2013). It is also necessary to compare cognitive efficiency among designers who are at different expertise levels and apply different design methods and among different design fields such as electrical and software engineering.
Footnotes
Acknowledgements
This work is partially supported by Discovery Grant RGPIN 374330 of the Natural Sciences and Engineering Research Council of Canada.
Ganyun Sun received a BEng degree from Dalian Jiaotong Universiy (China), an MSc degree from Dalian University of Technology (China), and a DSc degree from the Institute of Mechanics, Chinese Academy of Sciences (China). She is studying for her PhD degree in mechanical engineering at the University of New Brunswick (Canada). She is interested in human behavior in design (focusing on design cognition and visual behavior), design methodology, and biomechanics. She is a member of the Human Factors and Ergonomics Society, American Society of Mechanical Engineers, and Canadian Society for Mechanical Engineering.
Shengji Yao received a BEng degree from Jiangxi University of Science and Technology (China), an MSc degree from Dalian University of Technology (China), and a PhD degree in mechanical engineering from Concordia University (Canada). She is currently a human factors specialist at the Canadian Nuclear Safety Commission and an adjunct professor at McMaster University. She also worked at the University of New Brunswick as an assistant professor from 2009 to 2012. Her research interests include human-centered design, human performance analysis, design creativity and innovation, design education, and computer-aided product design.
Juan A. Carretero received a BEng degree from the Universidad Nacional Autónoma de México (UNAM). He received MASc and PhD degrees in mechanical engineering from the University of Victoria (Canada). He is currently a full professor at the University of New Brunswick in Fredericton, Canada, where he concentrates mostly on robot kinematics and design optimization. He has nearly 100 refereed publications. He is a member of the Canadian Society for Mechanical Engineering as well as an executive member of the Canadian Committee for the Theory of Machines and Mechanisms and the International Federation for the Promotion of Mechanism and Machine Sciences.