
Abstract
The cognitive systems engineering (CSE)/ecological interface design (EID) approach was applied in developing decision support for the flexible manufacturing system (FMS) work domain. Four interfaces were designed via the factorial application/non-application of direct perception (DP) and direct manipulation (DM). The capability of these interfaces to support performance in a simulated FMS was evaluated using a variety of traditional and novel dependent variables. The ecological interface (with DP, DM and an intact perception-action loop) provided clearly superior decision support (32 favorable significant results) relative to the other three interfaces (a combined total of 28 favorable significant results). The novel dependent variables were very sensitive. The results are interpreted from three different perspectives: traditional EID, the quality of constraint matching between triadic system components and closed-loop, dynamical control systems. The rationale for an expanded theoretical framework which complements, but does not replace, the original principles of CSE/EID is discussed. The potential for both specific interface features and novel dependent variables to generalize to real-world FMS applications is addressed. The expanded theoretical framework is universally relevant for the development of decision making and problem solving support in all computer-mediated work domains.
Keywords
Introduction
A flexible manufacturing system (FMS) is a production facility which integrates computerized control (e.g., automation) and traditional manufacturing resources with the goal of increasing adaptability and responsiveness (e.g., Mitchell et al., 1986). An early goal for FMS was the so-called “lights-out” factory (i.e., complete automation with minimal human involvement). However, “… a funny thing happened on the way to the lights-out factory: No one could do it.” (Stamm, 2004, p. 26). History has shown that humans are needed in the loop to augment automation in an FMS by assuming the role of a supervisory controller (SC).
An alternative to the goal of complete automation that underpins most analytic and qualitative FMS scheduling and control procedures is the design of a scheduling and control system that integrates the human responsible for the system into the overall architecture of the control system. This perspective is called a supervisory control paradigm for FMS scheduling. (Mitchell et al., 1986, p. 1444)
Human factors practitioners (e.g., Dessouky et al., 1995; Jackson et al., 2004; Sanderson, 1989) have identified scheduling as a key activity in manufacturing. This term refers to the real-time, moment to moment decisions which occur during the production process, as opposed to planning or strategic decisions which occur over a longer time frame (e.g., Sanderson, 1989). This very important FMS activity will need to be performed cooperatively by both human and machine agents in the face of substantial challenges: “Many decisions must be made in the course of system operation: which routing through the AMS [FMS] a pallet should take, in which order a machine should process jobs, how priorities should be assigned, and so on. These decisions amount to choosing which of several possible topologies will apply.” (Kinsley et al., 1994, p. 299).
A variety of research has been conducted to investigate interface and display design as a means of supporting humans acting in the role of supervisory controller (e.g., Arica et al., 2012; Baek et al., 1999; Benson et al., 1989; Higgins, 1994; Jackson & Browne, 1989; Jones & Maxwell, 1986; Ketteringham & O'Brien, 1974; Nakamura & Salvendy, 1988; Ojstersek et al., 2019; Sharit, 1985; Stern & Becker, 2019; Yahouni et al., 2018). In general, these studies show that graphical interfaces tend to produce more effective supervisory control, although there are exceptions (e.g., Sharit, 1985).
Cognitive Systems Engineering (CSE)/Ecological Interface Design (EID)
Cognitive systems engineering (Rasmussen et al., 1994; Vicente, 1999) and ecological interface design (e.g., Bennett & Flach, 2011; Burns & Hajdukiewicz, 2004; Rasmussen & Vicente, 1989; 1990; Vicente & Rasmussen, 1990; 1992) provide a unified framework to develop effective decision making and problem solving support for complex, dynamic systems. Here we are referring to the specific brand of CSE which conducts work domain analyses using the abstraction hierarchy. A number of researchers have attempted to apply this approach to FMS (Furukawa, 2009; 2010; Higgins, 1998; Higgins et al.,1999; Horiguchi et al., 2007, 2010; Kinsley et al., 1994; Krosner et al., 1989; Upton & Doherty, 2005, 2006, 2007, 2008). However, several of them (Higgins, 1998; Higgins et al.,1999; Krosner et al., 1989; Upton & Doherty, 2006) ultimately raised serious concerns about the suitability of CSE/EID for FMS.
Several years ago we began a research program with the goal of applying the CSE/EID approach to design and evaluate an
A preliminary evaluation of the ecological interface was conducted (it is described in the supplemental materials). Performance with the ecological interface was compared to performance with a non-ecological, baseline interface using primarily alpha-numeric representations. The results provided some evidence that participants were able to control the FMS more effectively with the EcoFlex interface than with the Alpha-Numeric interface (e.g., 10 of 11 significant effects favored the EcoFlex interface; as described in the supplemental materials). However, the performance advantages were less well-defined than we had expected: significant differences between interfaces were not obtained for the majority of dependent variables and one significant performance advantage was obtained for the Alpha-Numeric interface. We introduced two major modifications in the main evaluation which is reported here.
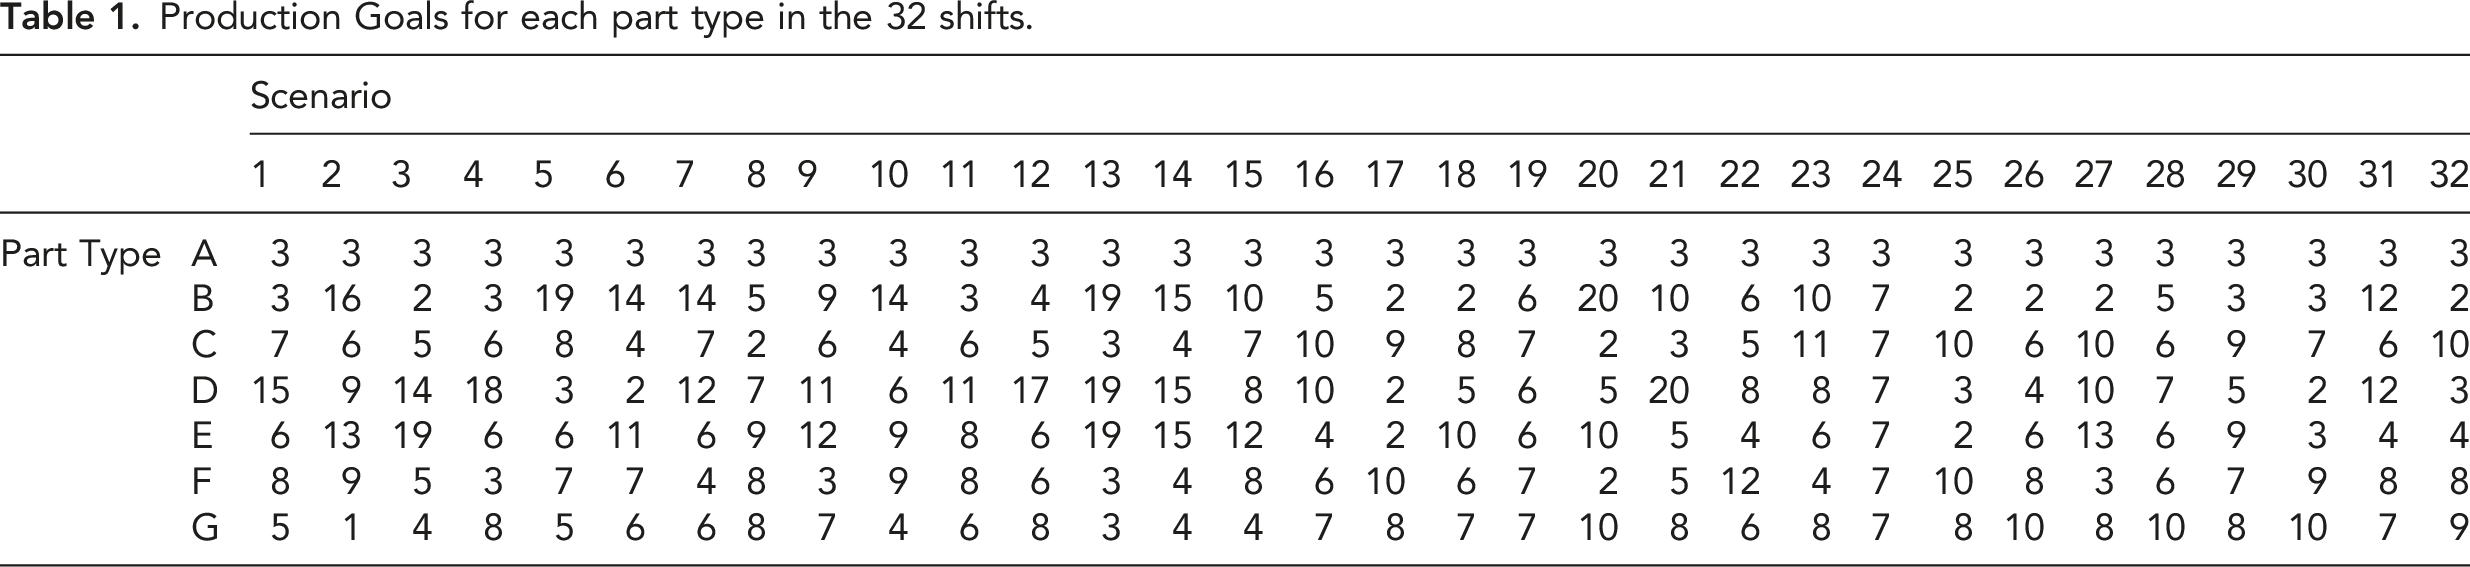
The first modification lies in the task characteristics of the simulated FMS. We believe that the FMS in our preliminary investigation might have been overly predictable and not sufficiently challenging (e.g., the same production goals for each part type were used in all 20 simulation runs). In the main evaluation the production goals were changed to be different for each part type in each simulation run. In addition, these alterations gradually increased time pressure by ensuring that the total amount of excess processing time (i.e., over and above what is required to meet goals—slack time) was decreased across simulation runs. The net effect of these changes was to introduce more demanding challenges and to increase the ecological validity of the simulation.
The Systematic Variation of Alternative Principles of Interface Design
Our second modification was made so that the evaluation could simultaneously explore the relative merits of, and relationships between, principles of interface design. Previous investigations involving simultaneous variations in direct perception and direct manipulation (e.g., Ballas et al., 1992; Benbasat & Todd, 1993; Benson et al., 1989; Frohlich, 1997) have probably raised more questions than answers. Most of these experiments have investigated intent-driven work domains using metaphorical (i.e., not analogical) visual displays; most of the experimental tasks have been fairly simple. The results have been decidedly mixed. See the supplemental materials for an expanded review of this literature.
Four FMS interfaces were designed to incorporate alternative design principles (direct perception, direct manipulation and visual momentum) of EID (Bennett & Flach, 2011) in a systematic fashion. Direct perception (DP, present or absent) and direct manipulation (DM, present or absent) were applied in a factorial manner to form these four interfaces. Note that only the term direct perception (DP) is used to simplify terminology, even though the principles of both direct perception and visual momentum were applied in the interfaces with DP. Each interface will be described briefly.
The EcoFlex (DP DM) Interface
The EcoFlex interface (with both direct perception and direct manipulation applied) is illustrated in Figure 1. Please see the companion manuscript in this volume (Bennett et al., In Press) for a detailed description of the design rationale for this ecological interface. The EcoFlex (DP DM) interface (direct perception present; direct manipulation present).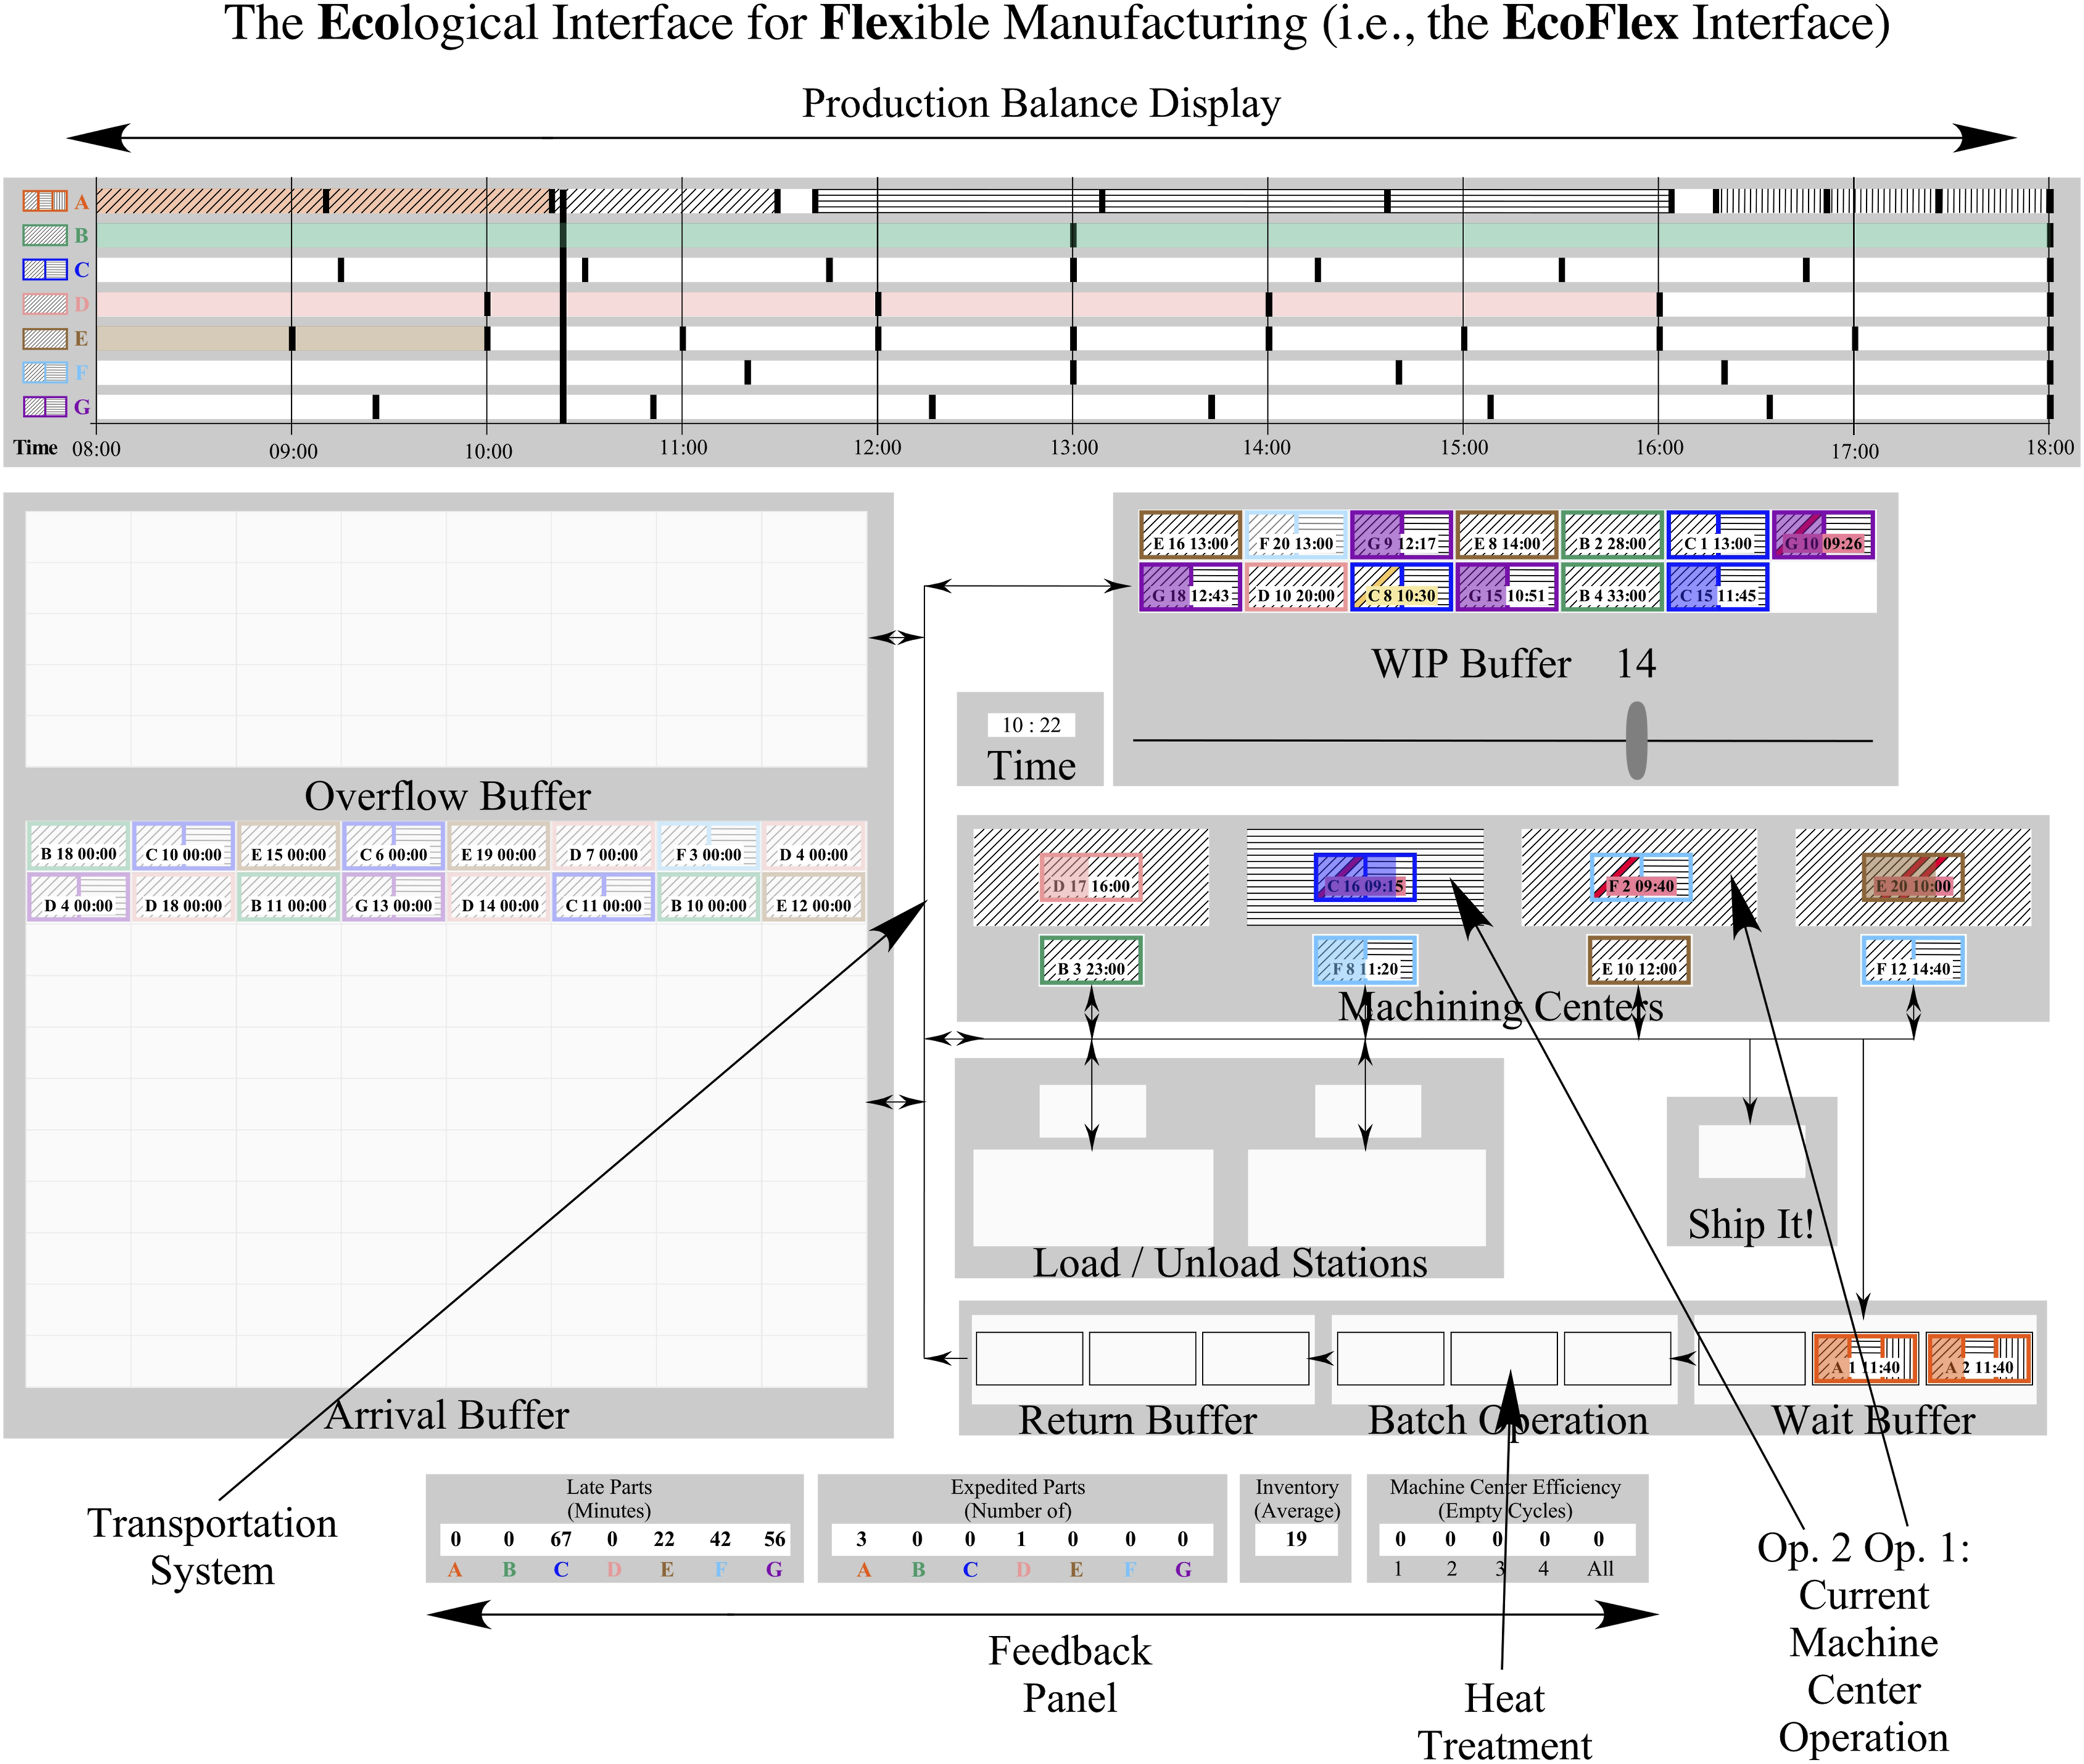
The No Direct Perception/No Direct Manipulation (NoDP NoDM) Interface
The second interface (see Figure 2) was designed to incorporate few of these CSE/EID design principles. Principles of direct perception are missing (i.e., NoDP): the interface contains only alpha-numeric representations, no higher-level functional information is incorporated and all visual displays could no longer be viewed in parallel (i.e., navigation was required to see alternative displays). Nor were direct manipulation principles applied (i.e., NoDM): control input were executed through key or button presses on a keyboard. The NoDP NoDM (direct perception absent; direct manipulation absent) interface.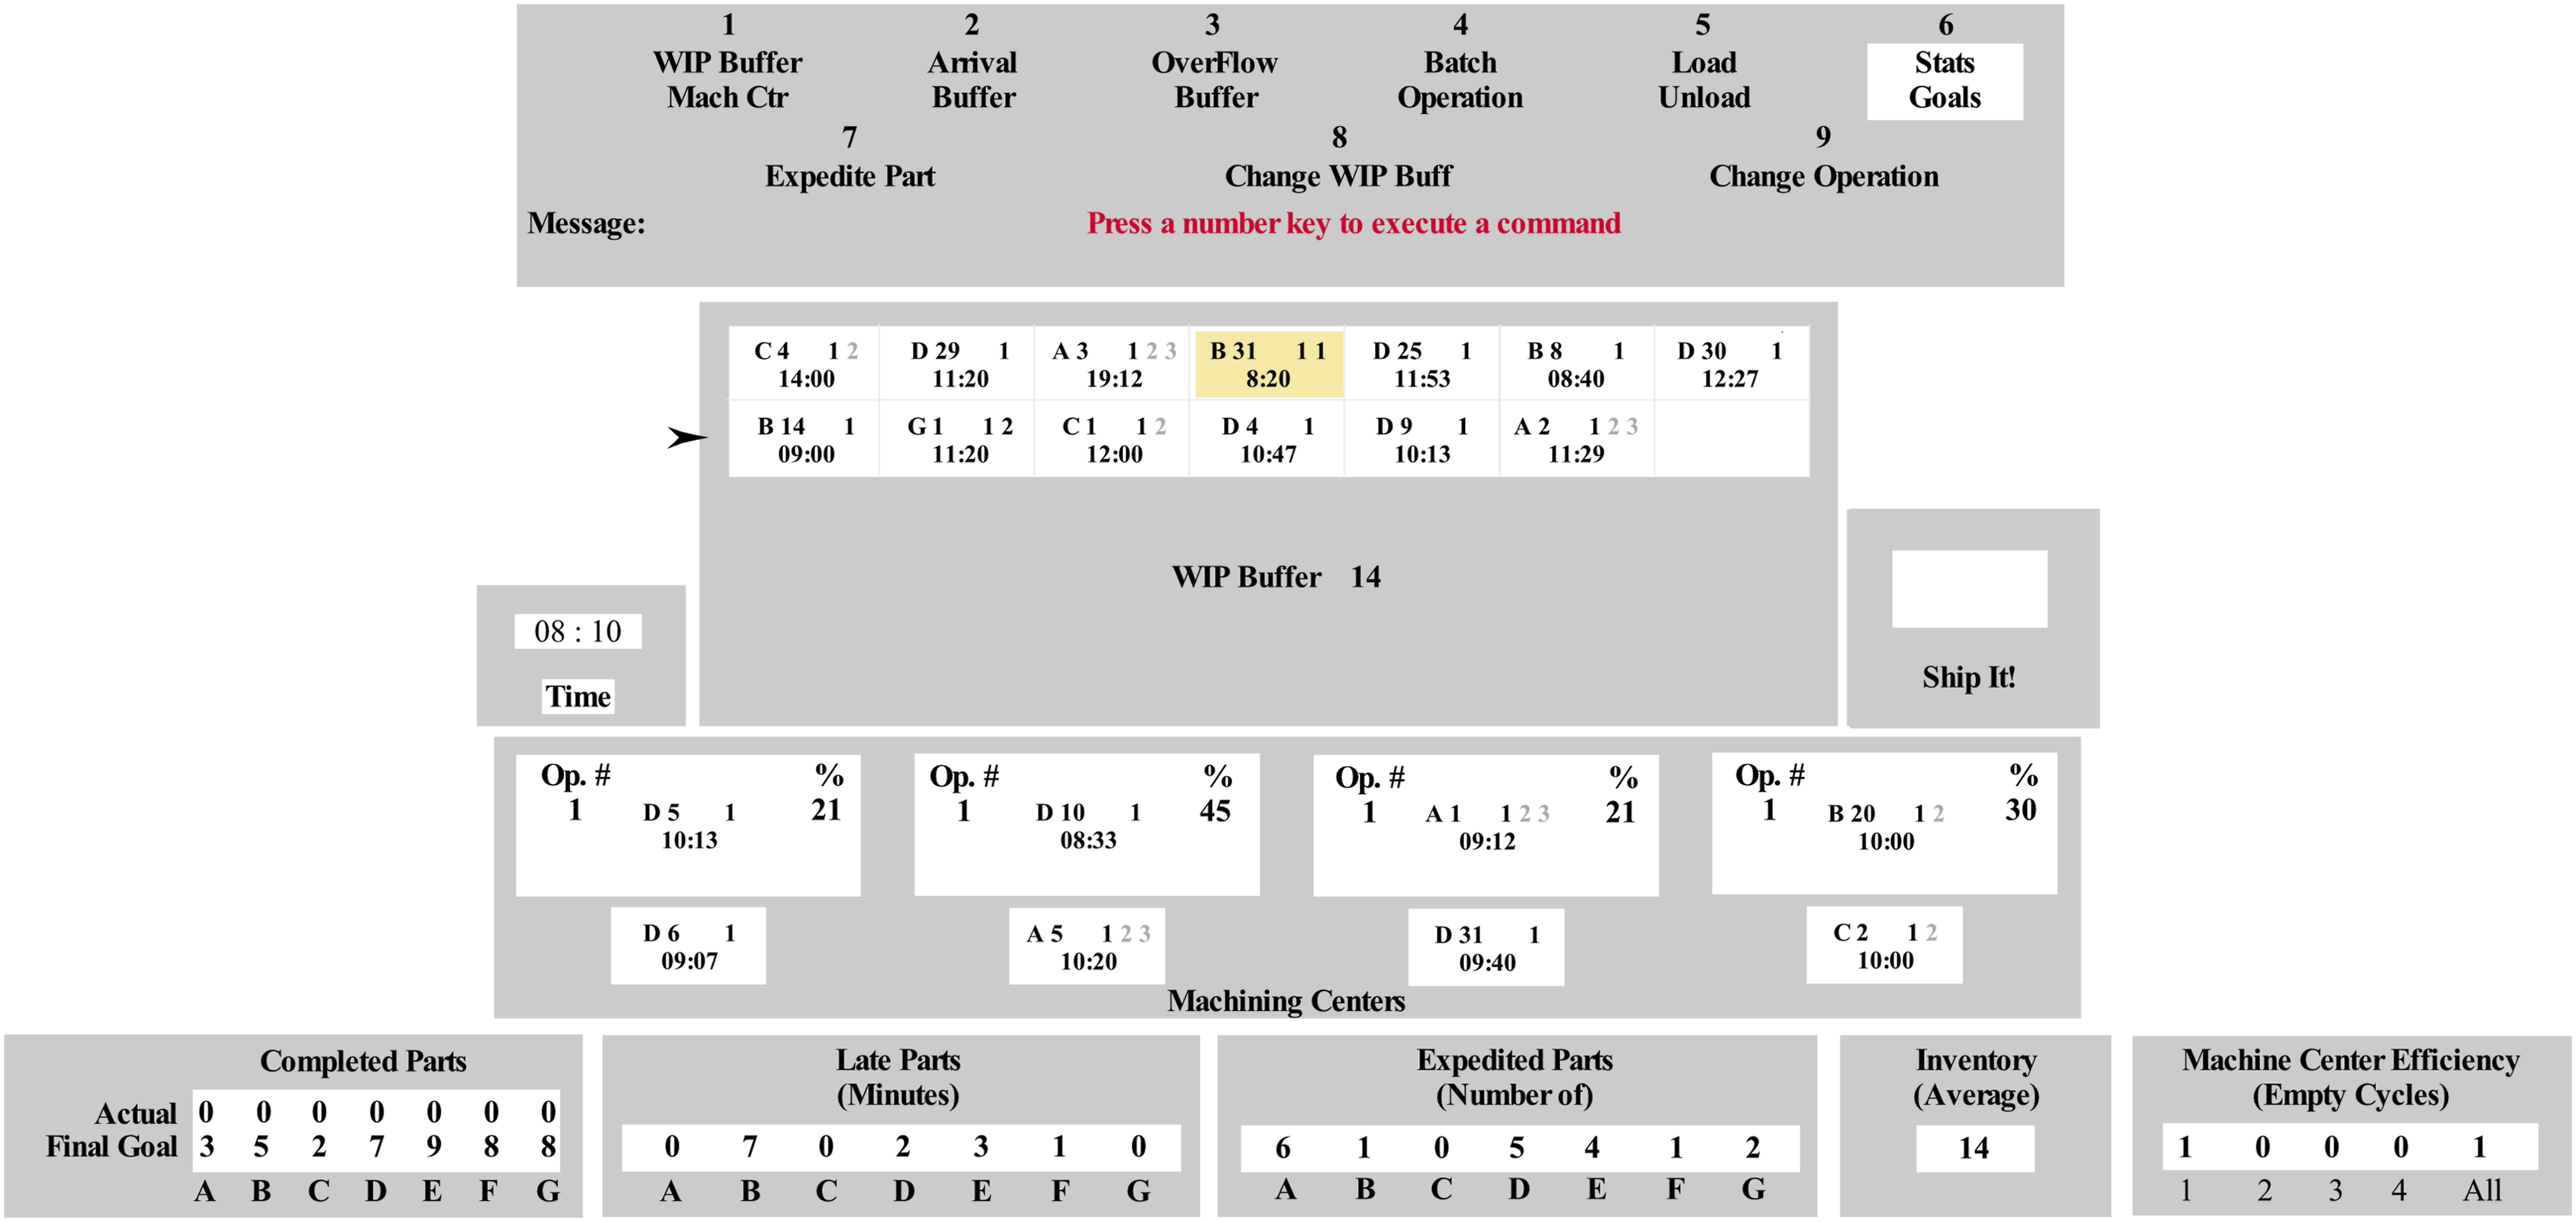
The Direct Perception/No Direct Manipulation (DP NoDM) Interface
The DP NoDM interface (see Figure 3) is essentially the EcoFlex interface with direct manipulation resources removed (i.e., it had the controls of the NoDP NoDM interface). The DP NoDM (direct perception present; direct manipulation absent) interface.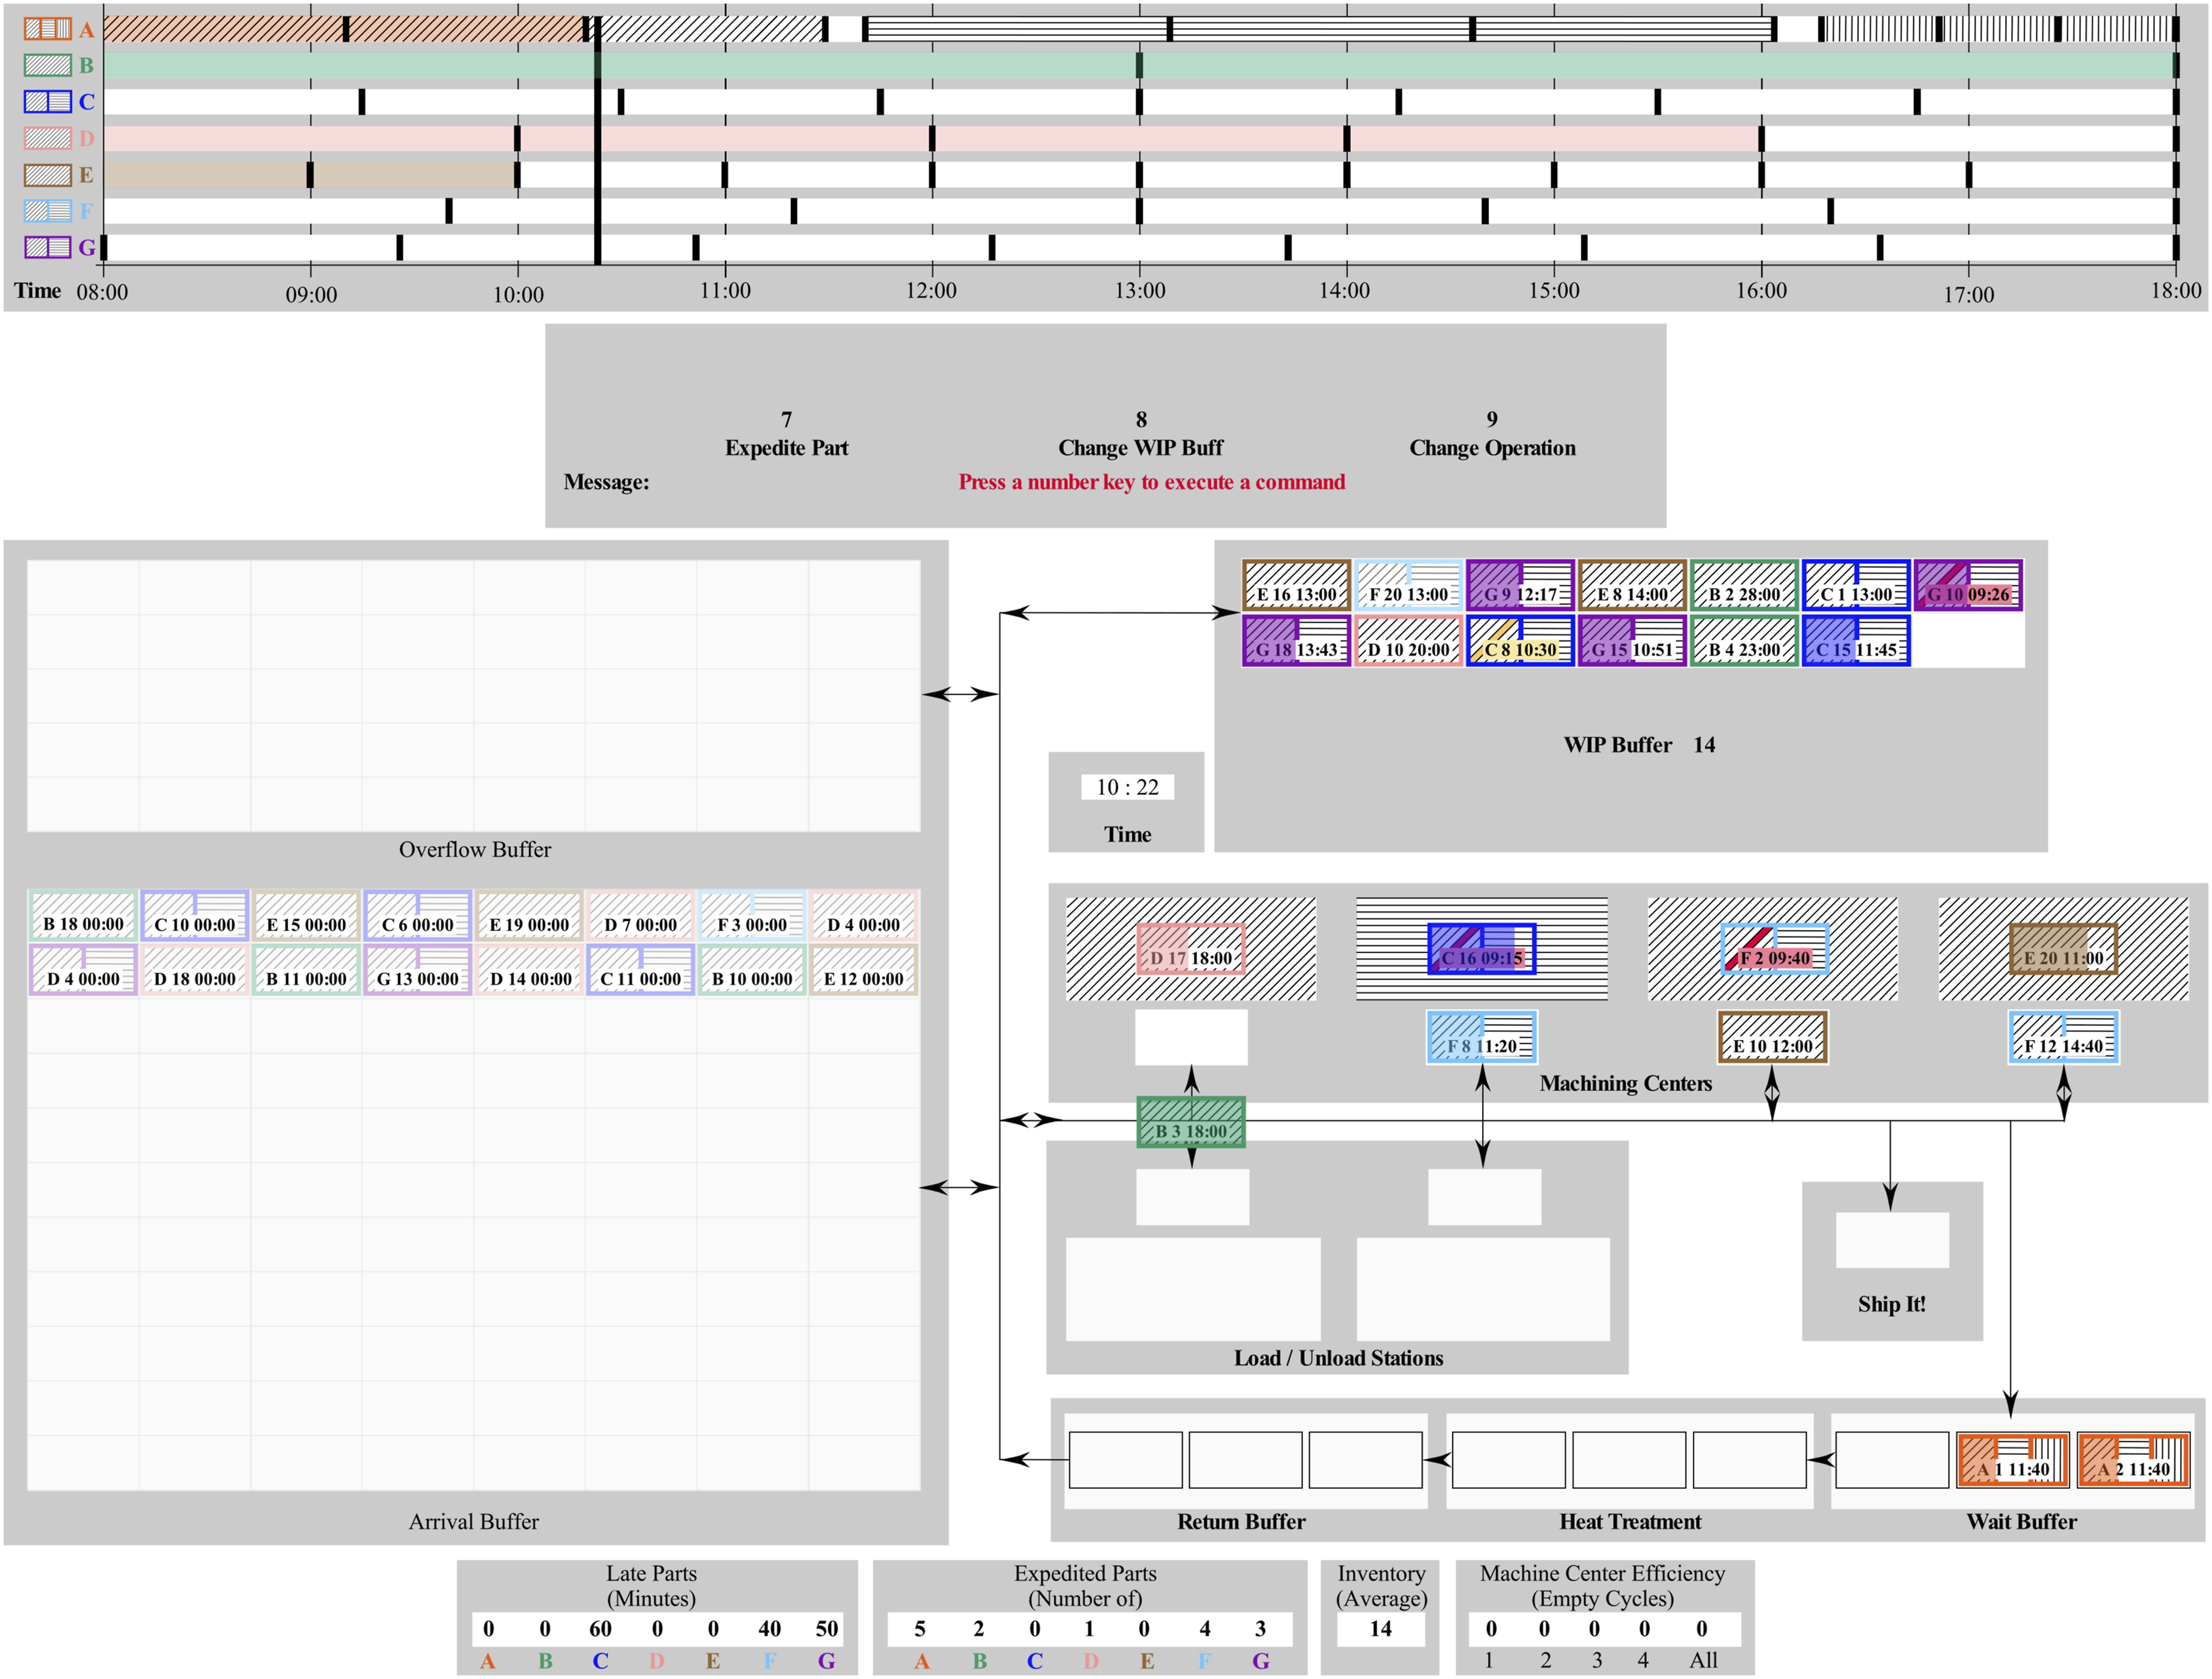
The No Direct Perception/Direct Manipulation (NoDP DM) Interface
The fourth interface (NoDP DM) is essentially the NoDP NoDM interface with direct manipulation resources substituted for keyboard input (see Figure 4). The NoDP DM (direct perception absent; direct manipulation present) interface.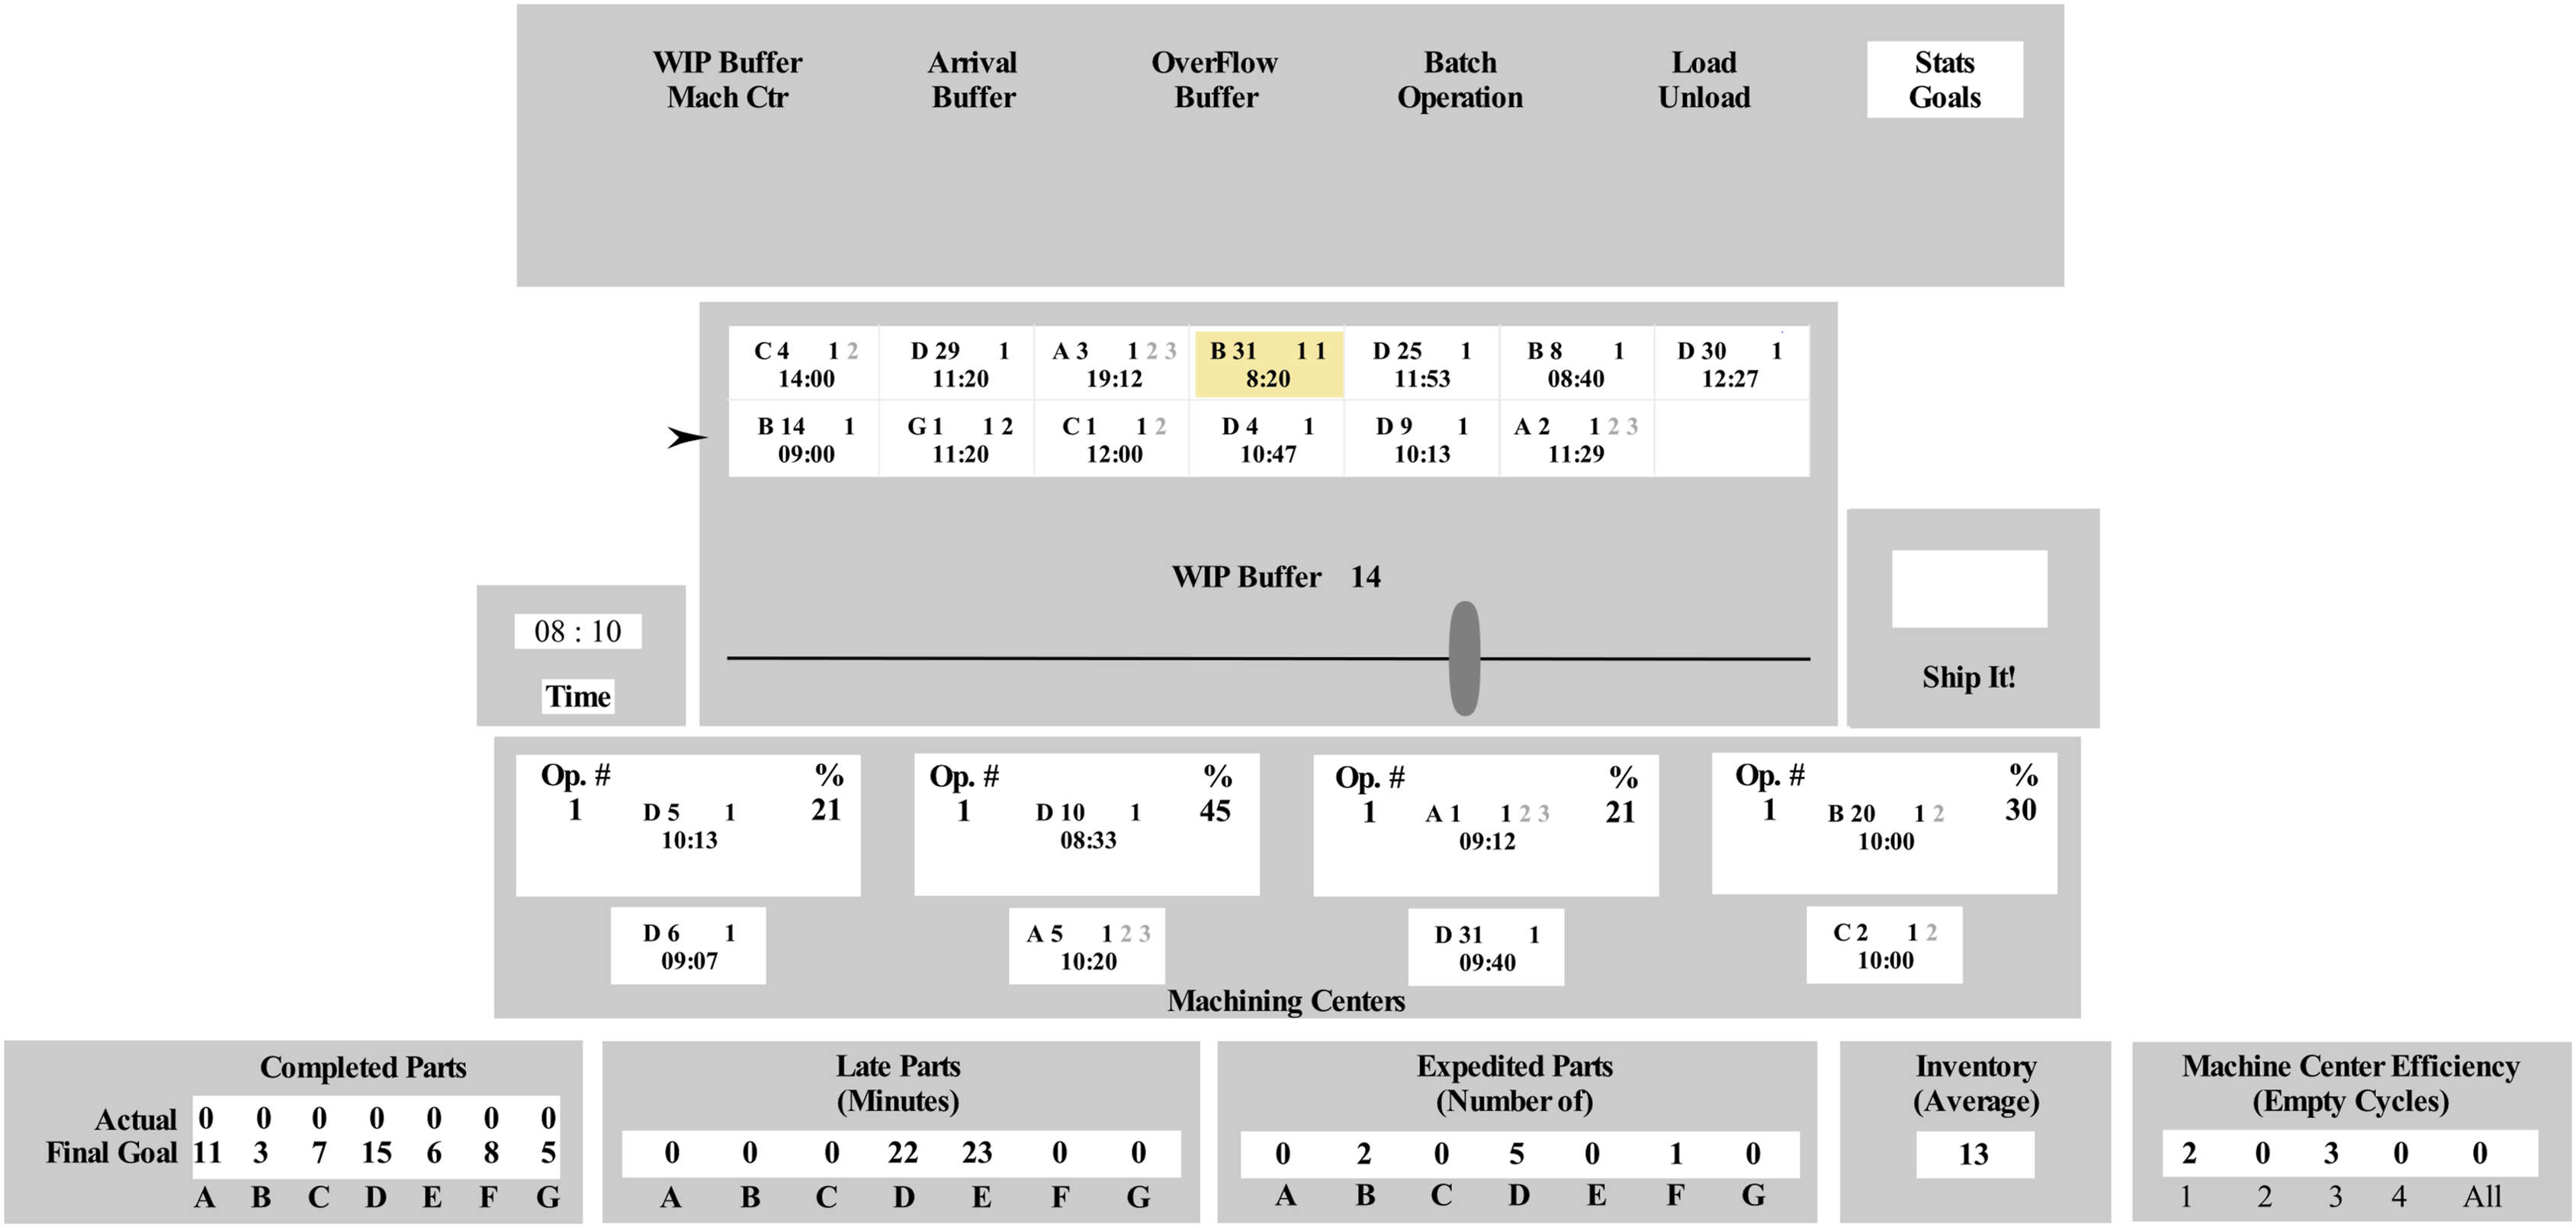
Evaluation
An evaluation of the ability of these four interfaces to support supervisory control of a simulated flexible manufacturing environment is reported here. There were two different categories of dependent variables in the present study which correspond to different levels of evaluation in Rasmussen’s CSE evaluative framework (Bennett & Flach, 2011; Rasmussen et al., 1994; Sanderson & Burns, 2017).
Constraint Boundaries
Boundary Level 1
In this framework there are 5 levels of constraint boundaries represented as a set of hierarchically nested circles. One evaluation reported here corresponds to the inner-most boundary (Boundary 1) where constraints that are most closely related to basic human capabilities and limitations are evaluated (e.g., highly controlled laboratory experiments). Our Boundary 1 evaluation measures the quality of performance in terms of the number of control input which were executed and the amount of time required to do so.
Boundary Level 3
Working outwards, each successive boundary incorporates additional sets of constraints which exist in the underlying work domain (with the outer-most boundary representing field studies). We conducted a second evaluation at Boundary level 3 where the dependent variables are defined by the semantics of the FMS work domain. This Boundary 3 evaluation includes traditional dependent variables found in the manufacturing literature (e.g., goal versus actual production levels for each part). It also includes novel dependent variables based on (1) the theoretical insights of Kinsley et al. (1994) and (2) previous work on the manual control of continuous variable systems (e.g., process control).
Decision Support
One research goal was to reexamine capability of the EcoFlex interface to provide effective decision making and problem solving support for this work domain. We expected that the redesigned interfaces would provide a wider range of quality in the decision making and problem solving support that is available to perform FMS tasks. We also expected that the more realistic and challenging manufacturing task constraints would make differences in the quality of support between interfaces more readily apparent.
Principles of Interface Design
A second research goal was to systematically examine the influence of theoretical principles of interface design on performance. We predicted that the application of both direct perception and direct manipulation would improve performance significantly. We were interested in determining how these principles of interface design work together.
Method
Participants
Six graduate students from Wright State University (4 male, 2 female) received $200 for their participation (all participants also participated in the preliminary evaluation). All participants had normal or corrected-normal visual acuity and color perception.
Apparatus
The experiment was conducted using an Apple Mac Pro (Model A1186, 2.8 GHz quad-core Intel Xeon, 8 GB memory, NVIDIA GeForce 8800 graphics card), Apple Cinema HD Display (Model A1083, 30 inches, 2560 by 1600 resolution, 60 Hz refresh rate) and standard keyboard and mouse. The experimental sessions were conducted in a darkened and enclosed room. The Director 11.5 (Adobe Systems, Inc.) software package was used to develop the simulation, the interfaces and to control the experiment.
Synthetic Task Environment (STE)
We used the scaled-down version of the FMS simulation described by Dunkler et al. (1988, see Table III in Dunkler et al. and their associated text). Some general characteristics of the STE common to both the preliminary and main experiments are described in the text of the “Synthetic Task Environment” subheading of the supplemental materials.
Interfaces
Direct Perception/Direct Manipulation (DP DM, EcoFlex) Interface
See Bennett et al. (In Press) for details of the CSE/EID analysis and design process applied to the EcoFlex (DP DM) interface (Figure 1). A part could be expedited (i.e., to change its scheduled order of processing) via point, click, drag, and drop manipulations using the mouse. The size of the work in progress (WIP) buffer could be changed from 0 to 21 by dragging a slider. The machining operation being performed could be changed by pointing at and clicking on a machining center’s icon.
No Direct Perception/No Direct Manipulation (NoDP NoDM) Interface
Alpha-numeric representations were substituted for graphic ones in this interface (Figure 2). Control input were executed using the keyboard. The participant changed which of five possible displays occupied the single-display slot by pressing a number on the keyboard (see the display labels and numbers in the top panel of Figure 2). The participant pressed the number 9 to initiate a change in the WIP size. The up- and down-arrow keys were used to increase or decrease the desired size, followed by a press of the return key to execute the command.
The participant initiated a change in machining operation by pressing the number 8. A transparent, light grey rectangle then appeared over the left-most machining center. The left and right arrow keys were used to position this rectangle over the desired machining center. The 0 key was then pressed to cycle through the three possible machining operations. Finally, the return key was pressed to execute the command.
A part was expedited by performing the following actions: pressing the number 7, pressing a number to indicate which buffer held the part to be moved, pressing the arrow keys to position a small grey rectangle over the desired part, pressing the number 0 to select a part, pressing a number to specify the desired location, pressing the arrow keys to move the rectangle to the desired slot, and pressing the return key to execute the command.
Context-sensitive instructions (i.e., a verbal description of the required input at the current point in the interaction sequence) were provided in the message area located in the top panel of Figure 2 for all three commands.
Direct Perception/No Direct Manipulation (DP NoDM) Interface
The DP NoDM interface (Figure 3) retained all visual aspects of the EcoFlex interface, but control input were executed using the keyboard conventions described in the previous section (i.e., direct manipulation capabilities were removed).
No Direct Perception/Direct Manipulation (NoDP DM) Interface
The NoDP DM interface (see Figure 4) retained the visual appearance of the NoDP NoDM interface (see Figure 2), but control input were executed through direct manipulation. The change WIP size and the change machining operation commands were executed in exactly the same manner as the DP DM interface. A change in the display configuration was executed by rolling the mouse over a display label at the top of the interface (e.g., positioning the mouse over the OverFlow Buffer label made it appear permanently at the bottom of the screen). If the desired destination buffer was not visible in the interface, then the participant could point, click, and drag the part to be expedited over the desired destination buffer label at the top of the screen (causing the destination display to become visible at the bottom), and then execute the command by continuing to drag and drop the part into the desired location in the buffer.
Procedure
Informed consent was obtained. Participants were asked to prioritize their performance in the following manner: (1) complete the exact number of parts for each part type to meet daily production goals, (2) limit the number of parts that were late, (3) minimize the inventory levels used in a ten hour shift, (4) maximize the machining center efficiency, and (5) minimize the total number of operations that were performed during the shift.
Sessions
Participants completed 8 experimental sessions (approximately 1 and 1/2 hr each, one per day). In the first two sessions an experimenter sat in the room and was available to answer questions regarding the interfaces (but not regarding any strategies). Participants completed one simulated shift with each of the 4 interfaces in a session. The order of interface appearance across sessions was controlled for each participant via a Latin squares counterbalancing technique. A participant experienced each interface exactly once as the first, the second, the third, and the fourth interface in the first set of four experimental sessions and then once again in the second set of four experimental sessions (the specific orders were different). The specific orders were also varied between participants.
Shifts
Production Goals for each part type in the 32 shifts.
Part Appearance
The order of appearance for the 126 parts was initially determined randomly without replacement. The first 22 parts were used to initialize the simulation: they were assigned to the 14 slots in the WIP and to the 8 slots in the machining centers. The remaining 104 parts were then randomly assigned to appear in the Arrival Buffer at one of the ensuing 600 simulation updates. A due date of “00:00” was assigned to a part when it became visible in the arrival buffer. When a part was pulled into the manufacturing cell from the arrival buffer it was assigned the next available due date for that particular part type.
Abnormalities
The appearance of a sufficient number of multiple-operation parts required to meet production goals was systematically delayed across scenarios. The earliest average time for the required number of multi-operation parts to appear in the arrival buffer ranged from 130 min (shift 1) to 340 min (shift 32) in approximately 6 to 9 min increments. This modification was achieved by swapping a multiple operation part that was scheduled to appear too early with a single operation part that was scheduled to appear later (i.e., in the desired time frame for the multiple operation parts of that shift).
The experimenter entered the correct settings for interface and shift; the participant started the simulation by clicking on a button. The participant controlled the simulation via the controls present in each interface. Response times for the three control inputs were measured (1/20th sec accuracy) from the time that the participant initiated the command until it was completed. The simulation was paused at the initiation of a control input and resumed when the command was completed and the changes to system state and displayed information were updated. Participants were allowed to take a short break between the scenarios of a session when needed.
Results
The following procedure was followed for the analysis of each dependent variable. Outliers were identified using the test described in Lovie (1986, pp. 55–56):
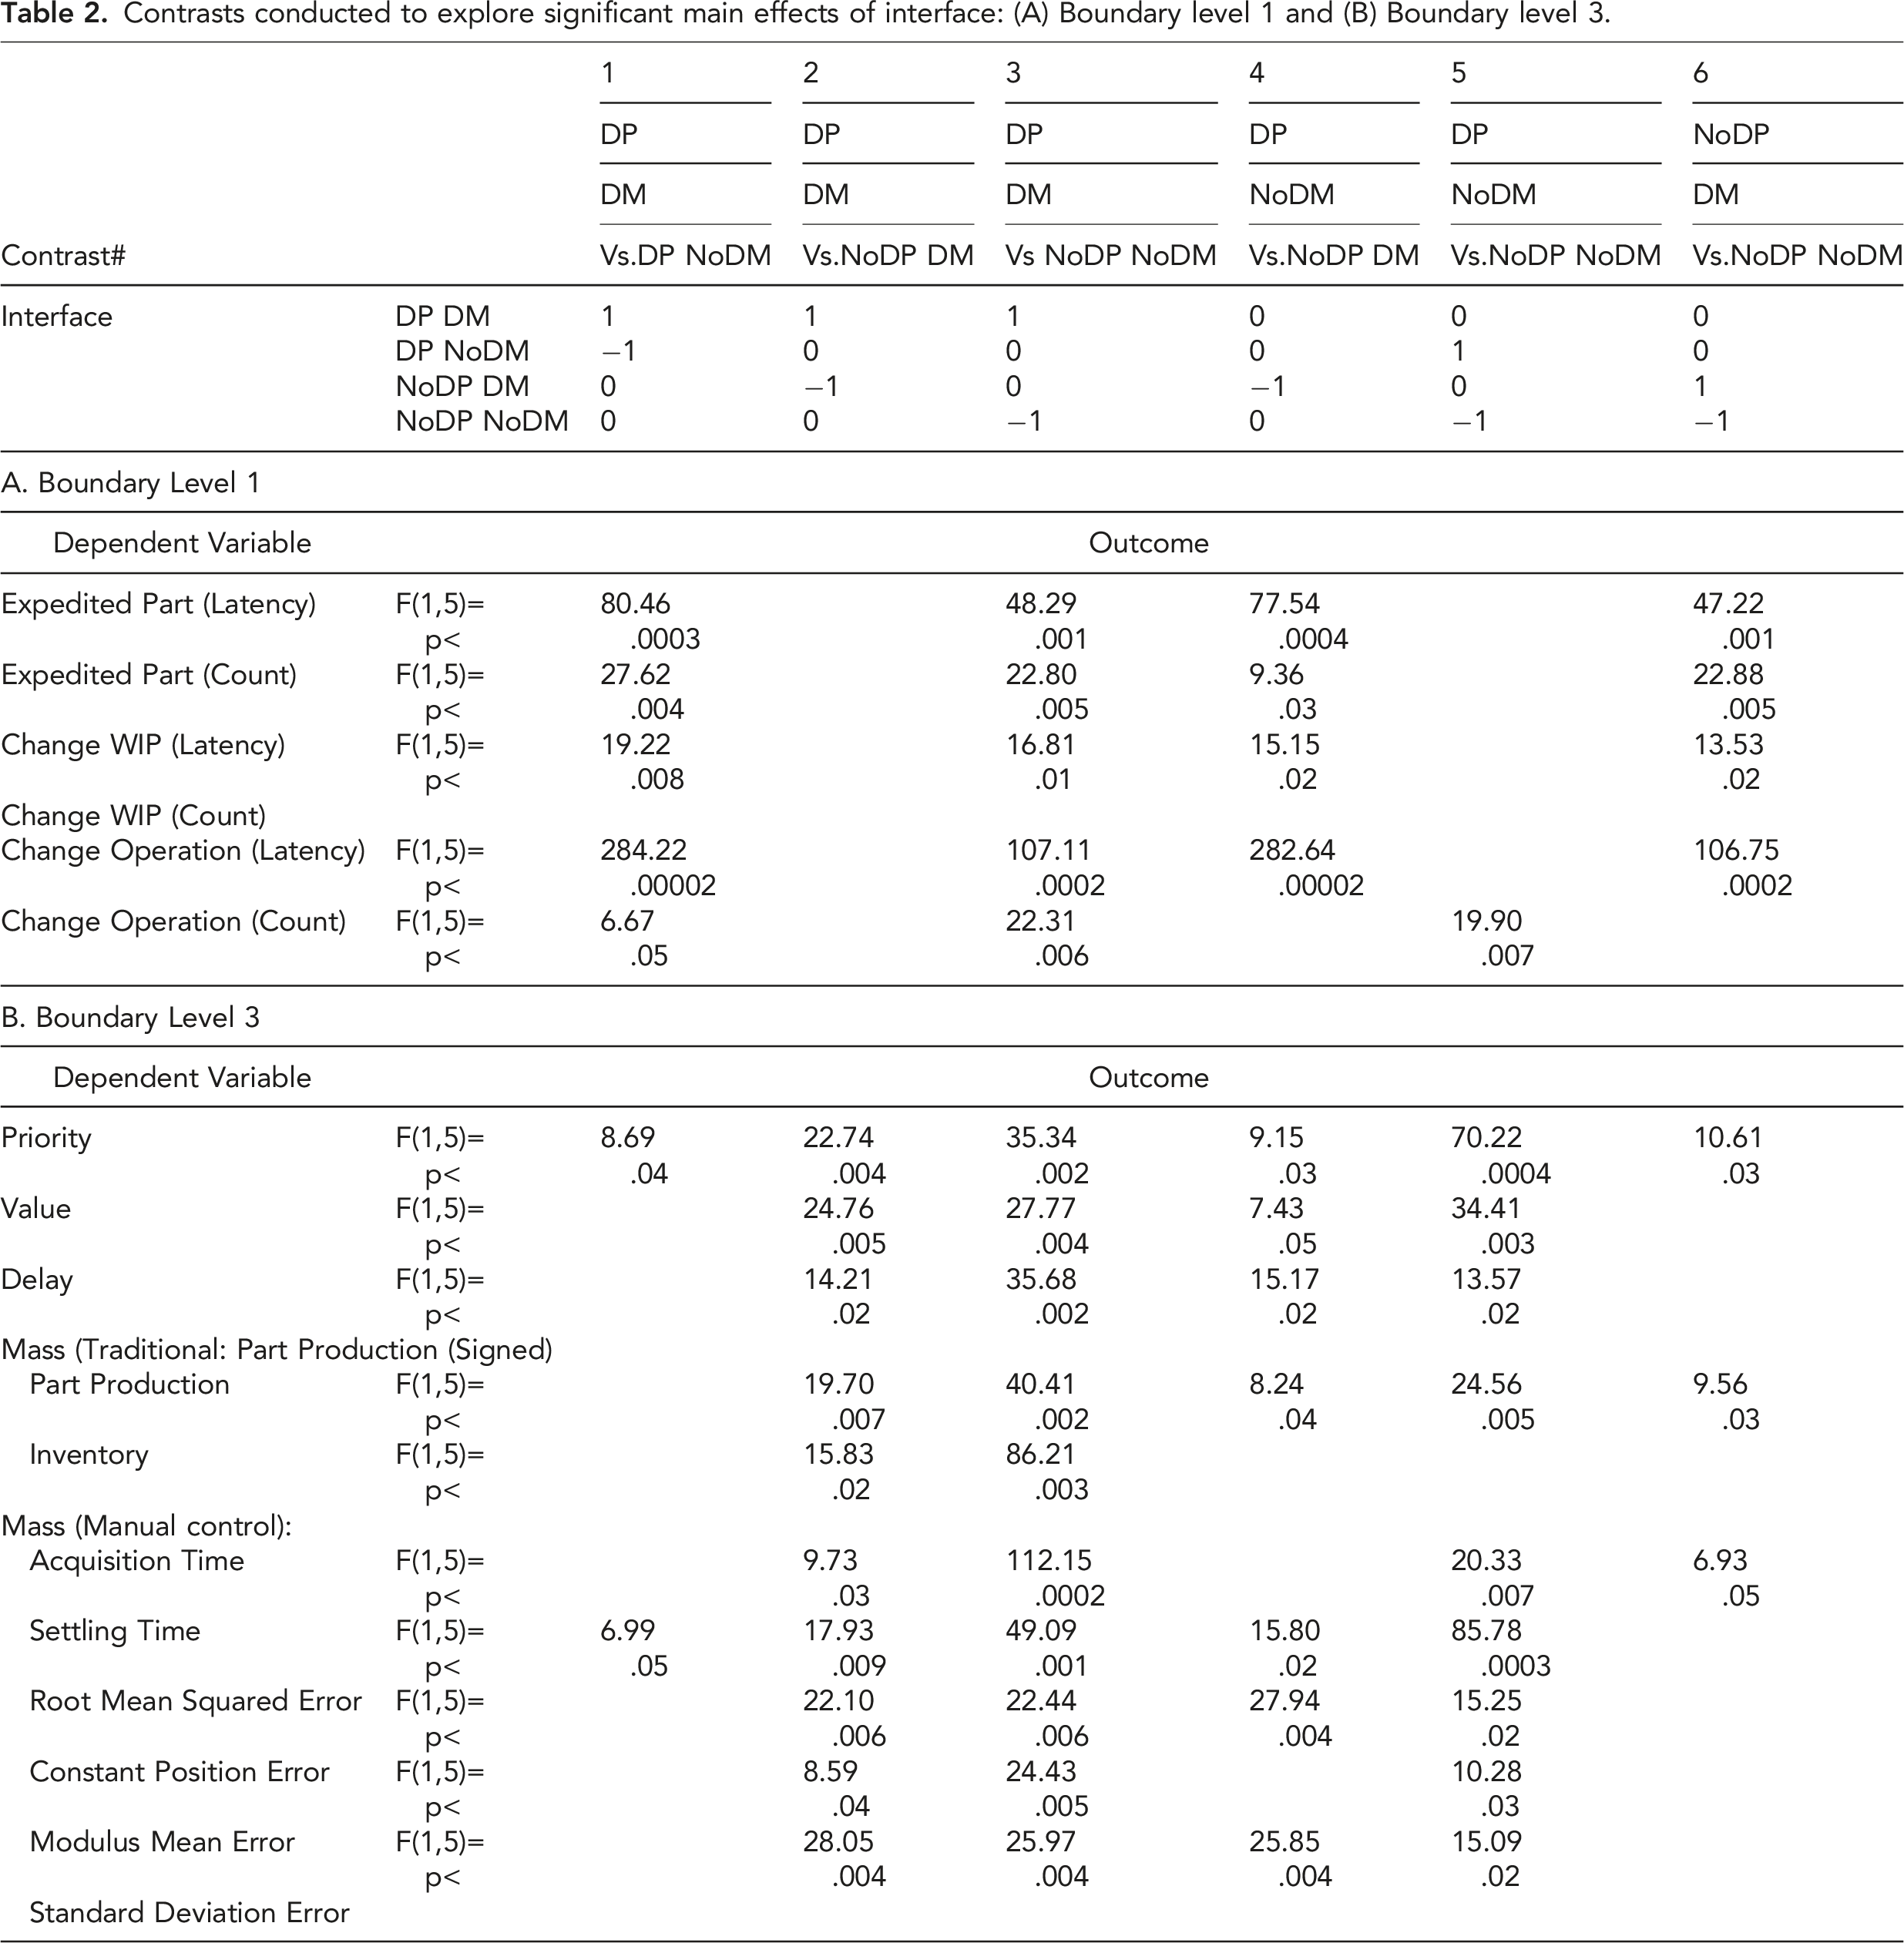
Contrasts conducted to explore significant main effects of interface: (A) Boundary level 1 and (B) Boundary level 3.
Overview of Results
Average Scores
The average score for each interface in the Boundary 1 (Figure 5a) and the Boundary 3 (Figure 5b) evaluations are illustrated in Figure 5. Standardized scores are presented; better performance is mapped into higher, positive standard scores. Mean values for the main effect of interface: (A) Boundary level 1 (i.e., dependent variables defined by basic control inputs) and (B) Boundary level 3 (i.e., dependent variables defined by work domain metrics).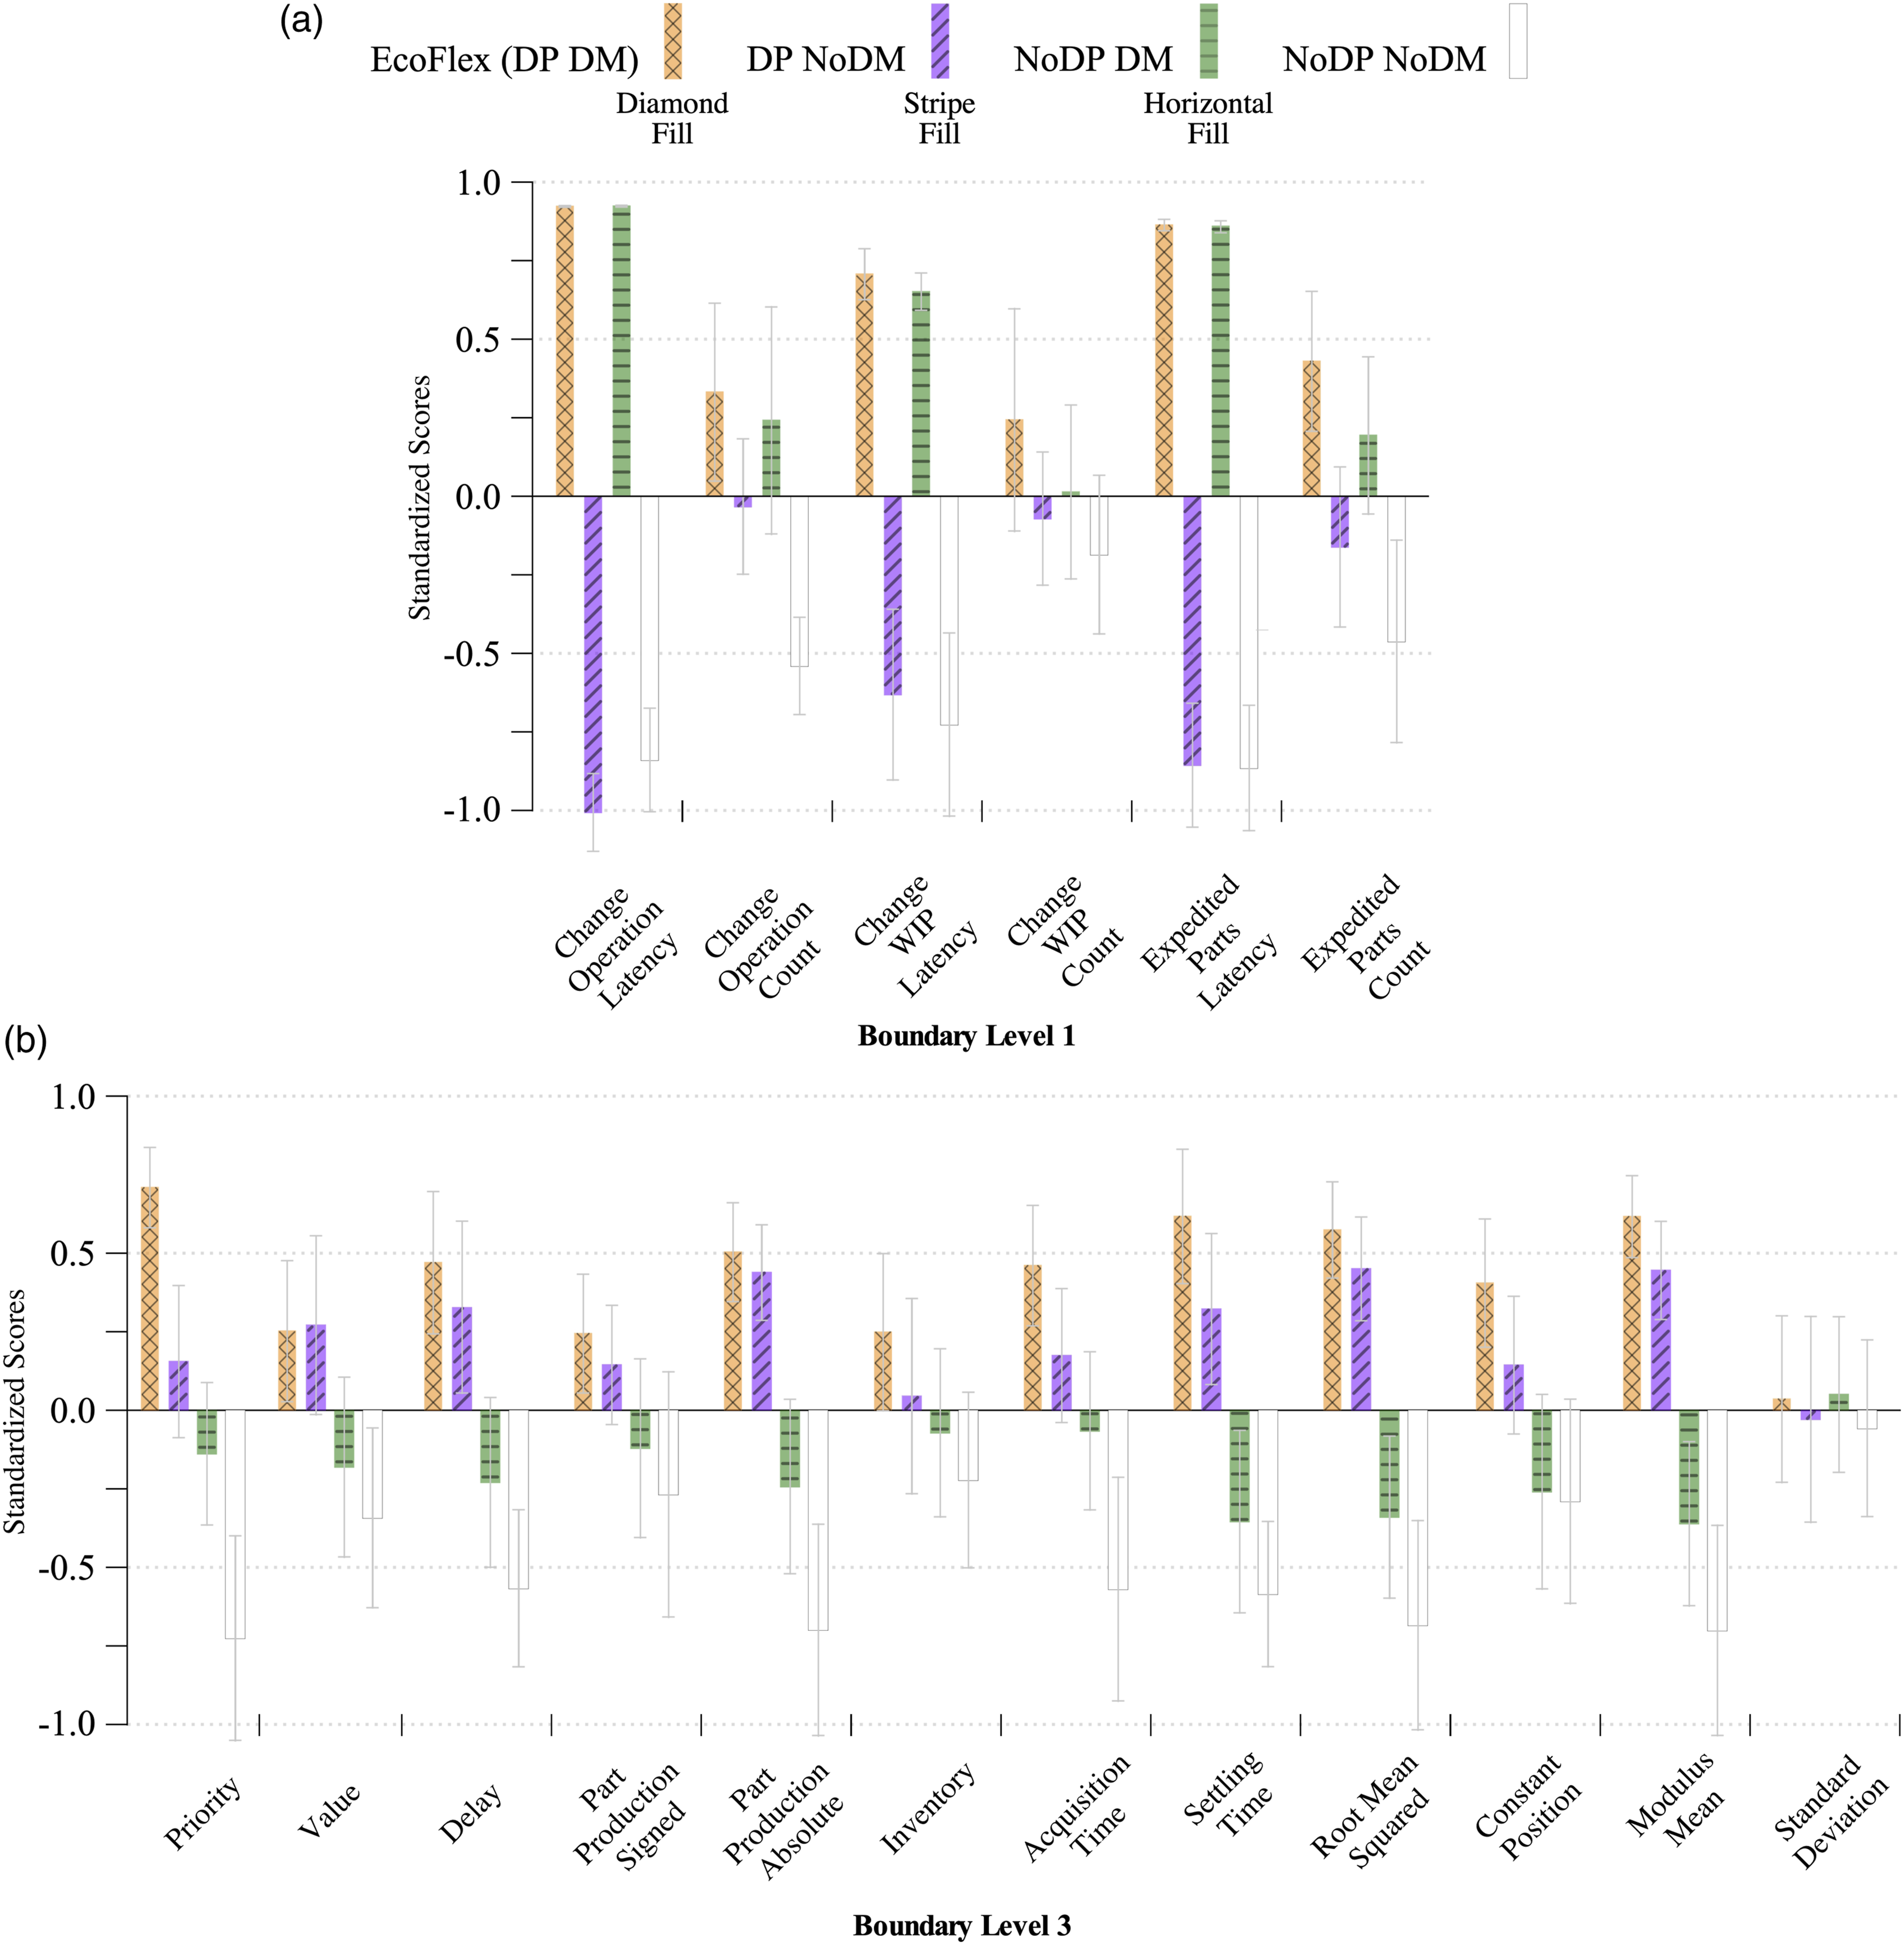
Contrasts Between Interfaces
The results of the contrasts conducted to explore differences between means for significant main effects of interface are listed in Table 2. A blank row represents a non-significant main effect; a blank cell represents a non-significant comparison between interfaces.
Advantages in Performance
Figure 6 complements Table 2 by presenting these results graphically to illustrate the direction of statistically superior performance. The presence of a rectangle in a cell represents a statistically significant difference between two interfaces; the color fill of this rectangle signifies which of the two interfaces was associated with superior performance. A graphical representation of statistically significant differences in performance between interfaces: (A) Boundary level 1 and (B) Boundary level 3.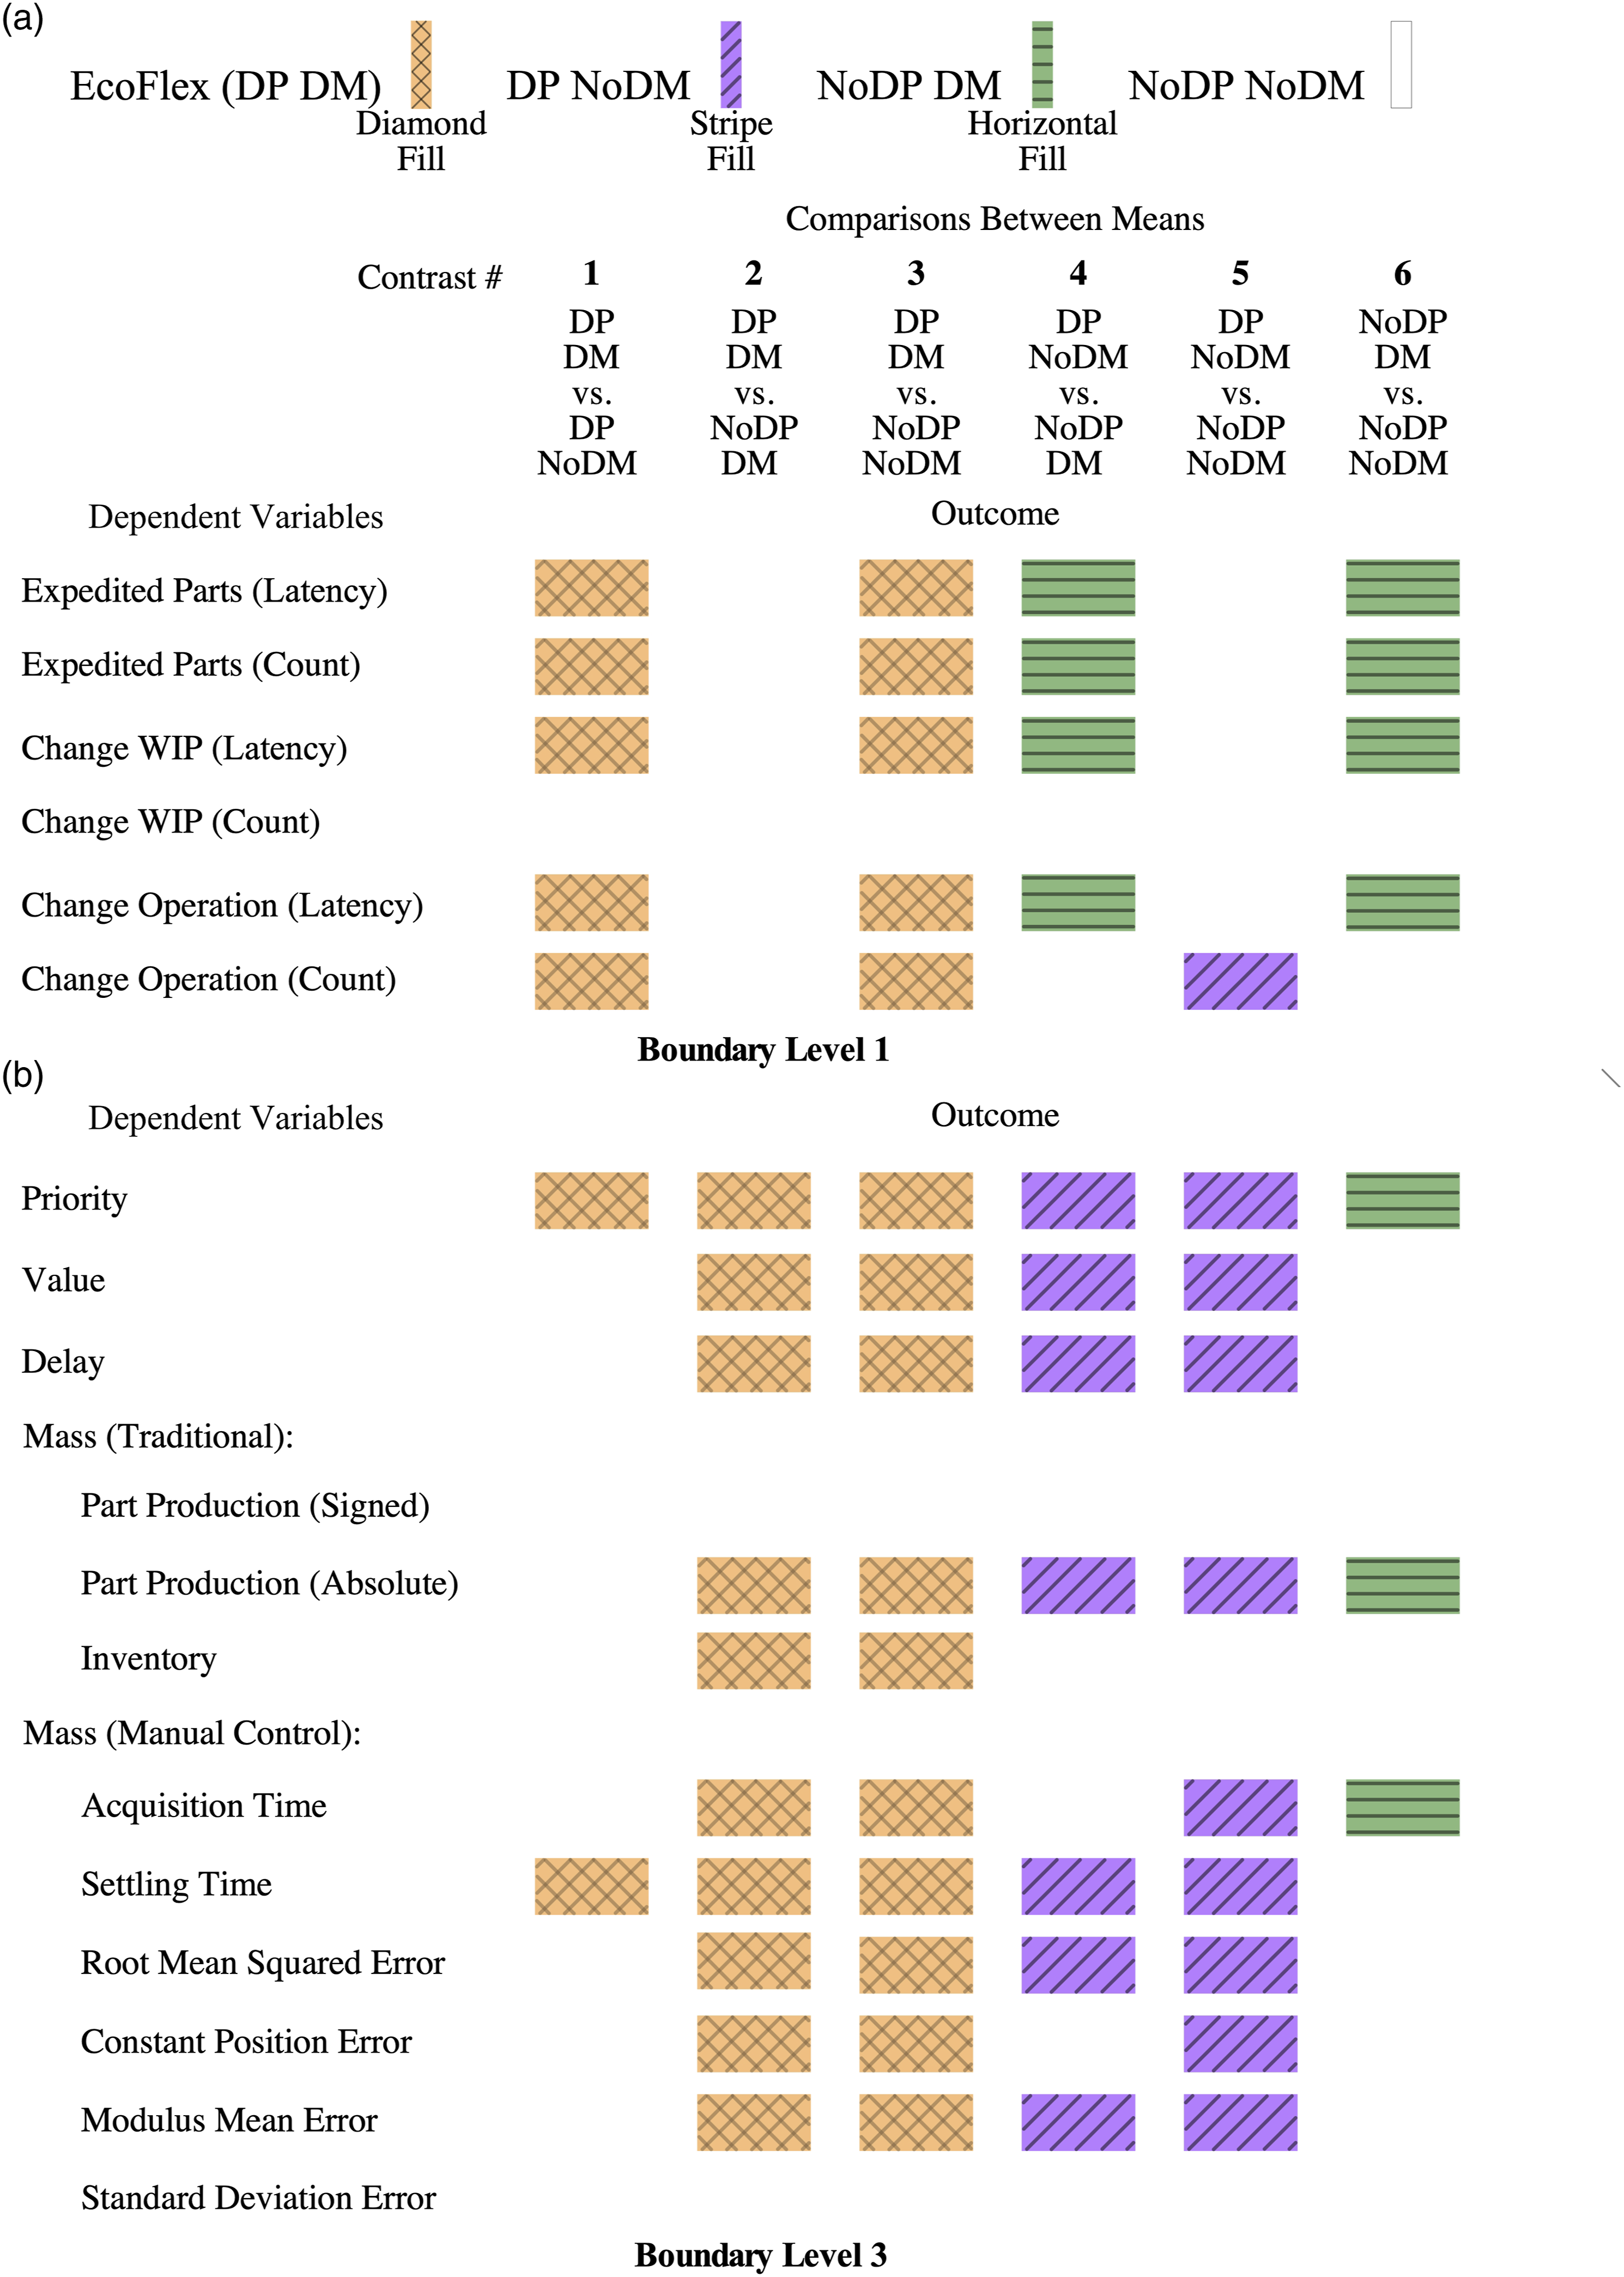
Boundary Level 1 (Basic Control Input)
Expedited Parts
The number of expedited parts and their latency were recorded; there were 0.04% (8/18,262) and 1.57% (286/18,262) scores identified as outliers, respectively. The main effects of interface for the number of expedited parts,
The interaction effect between interface and day was also significant for latency,
Changes in the Work In Progress (WIP) Buffer Size
The number of times that the size of the WIP buffer was changed, and the latency of these responses, were recorded; there were 0.40% (4/988) and 1.32% (13/988) scores identified as outliers, respectively. The main effect of interface for the latency of changes for WIP size was significant,
Changes in Machining Operation
The number of changes to the machine operation being performed at a machining center and the latency of these control input were recorded; there were 0.22% (5/2253) and 1.11% (25/2253) scores identified as outliers, respectively. The main effect of interface was significant for both the number of,
The interaction between interface and day was also significant for latency,
Boundary 3 (Work Domain Metrics)
Delay
The formula for calculating delay is
Value
The formula for calculating value is
Mass: Inventory
The formula for calculating inventory is
Mass: Production Goals (Absolute)
The formula for calculating production goals (absolute) is
Mass: Production Goals (Signed)
The formula for calculating production goals (signed) is
Acquisition Time
Acquisition time is scored by determining the first simulation update (1–600) in which the number of completed parts enters a target band (which is constructed by adding 1 to, and subtracting 1 from, the goal value at each simulation update). A score of 600 is assigned if this never occurs. There were 2.75% scores (37/1344) identified as outliers. The main effect of interface was significant for acquisition time,
Settling Time
Settling time is scored by determining the first simulation update in which the actual level of completed parts enters the target band and then stays inside that band throughout the remainder of the shift. A score of 600 is assigned if the number of completed parts is outside the target band at the end of the shift. No scores were identified as outliers. The main effect of interface was significant for settling time,
The next five variables are calculated using two lines which summarize actual and goal production levels across the entirety of a shift. They are plotted on a graph with simulation updates (i.e., 0–600) as the x axis and the cumulative number of parts completed as the y axis. The goal line is a straight line connecting the origin to the goal production value for a part type on the y axis. The actual line is formed by plotting points corresponding to successive completed parts and connecting them with line segments (see supplemental materials for additional details).
Priority
The formula for calculating priority is
The EcoFlex interface (intact perception-action loop) produced a positive average priority score (raw score, not standardized). This indicates that supervisory controllers were prioritizing parts in anticipation of future production needs (i.e., parts were expedited early, before they were late). In contrast, negative average priority scores were obtained for the other three interfaces with a broken perception-action loop: supervisory controllers were increasingly less able to anticipate production needs and less able to prioritize parts effectively.
Four dependent variables to estimate the overall quality of control in the shift were calculated (Poulton, 1974).
Constant Position Error (CP)
The formula for calculating constant position error is
Modulus Mean Error (MM)
The formula for calculating modulus mean error is
Root Mean Square Error (RMS)
The formula for calculating root mean square (RMS) error is
Standard Deviation of the Error (SD)
The formula for standard deviation of the error is
Composite Variable
A composite variable (e.g., Ley, 1972; Song et al., 2013) was calculated to summarize Boundary level 3 dependent variables. The formula is Results for a composite variable which combines all Boundary level 3 dependent variables: (A) Mean values for interface; (B) Statistical results for ANOVA and comparisons.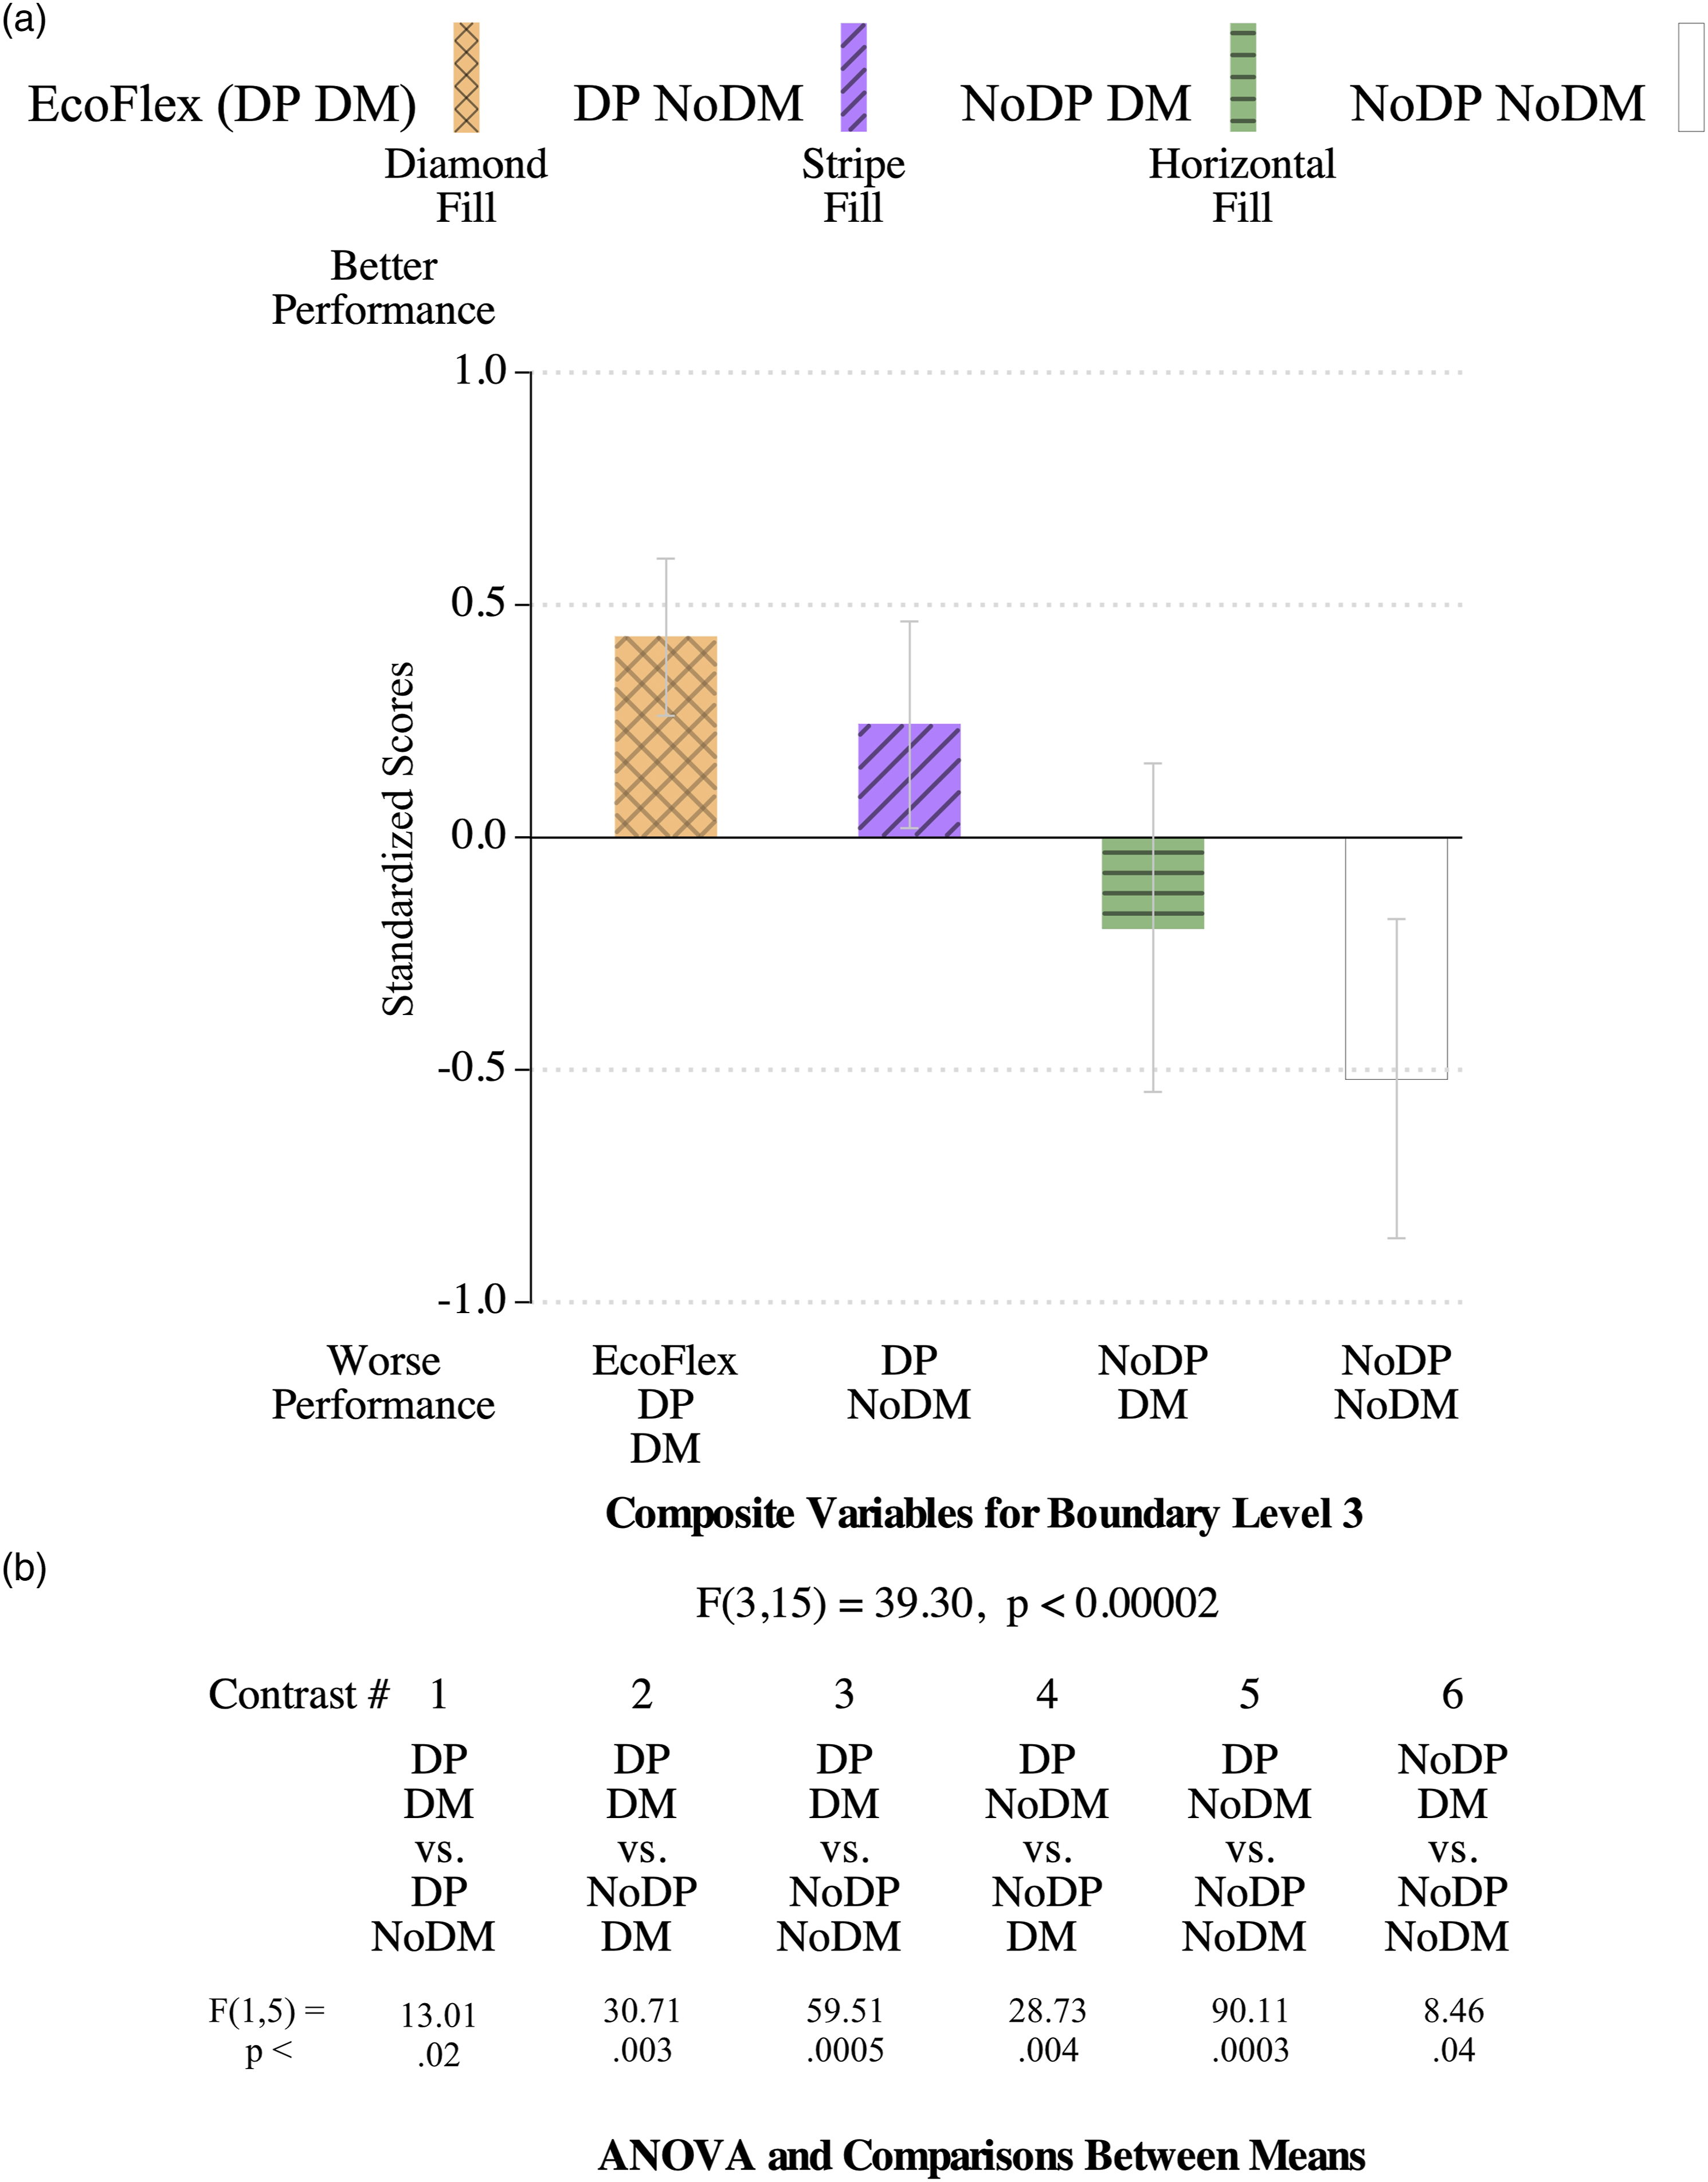
Discussion
The motivation behind the term “ecological interface” was based on Gibson’s approach to perception with an emphasis on the functional coupling between perception and action. (Bennett & Flach, 2011, p. 269, p. 269)
The results are interpreted from two complementary perspectives. The first perspective is the original design principles of EID as proposed by Vicente and Rasmussen (Rasmussen & Vicente, 1989, 1990; Vicente & Rasmussen, 1990, 1992). The three modes of human behavior described in Rasmussen’s (1983) SRK (skill-, rule-, and knowledge-based behaviors) taxonomy must be supported in the interface. Skill-based behavior (SBB) involves high-capacity perceptual-motor skills: analogical, continuous space-time signals from the environment are processed automatically and without conscious awareness. Rule-based behavior (RBB) involves the automatic recognition of stereotypical situations (signs) and the automatic execution of previously acquired procedures (without conscious awareness), once the decision has been made to initiate the behavior. Knowledge-based behavior (KBB) occurs when a controller is faced with a novel situation (i.e., is engaged in problem solving) and therefore must consciously reason about specific properties (symbols) of the work domain in order to devise a solution.
The second perspective is the “dynamic meaning processing” or “triadic” framework described in Bennett and Flach (2011). As Figure 8 illustrates, there are three fundamental system components: work domain, interface, cognitive agent. Each of these components will contribute a unique set of behavior-shaping constraints. The quality of overall system performance will be determined by the extent to which all three of these mutually interacting sets of constraints are well-matched. Note that more detailed descriptions of how the EcoFlex interface achieves a high quality of constraint matching is provided in our companion manuscript (Bennett et al., In Press). We also describe results from the closed-loop control dynamic perspective which is also represented in Figure 8 (the arrows). A triadic/control-theoretic perspective of the CSE/EID approach. (Adapted with permission from Bennett, K. B., and Flach, J. M., Display and Interface Design: Subtle Science, Exact Art. Copyright 2011 by CRC Press. All rights reserved.)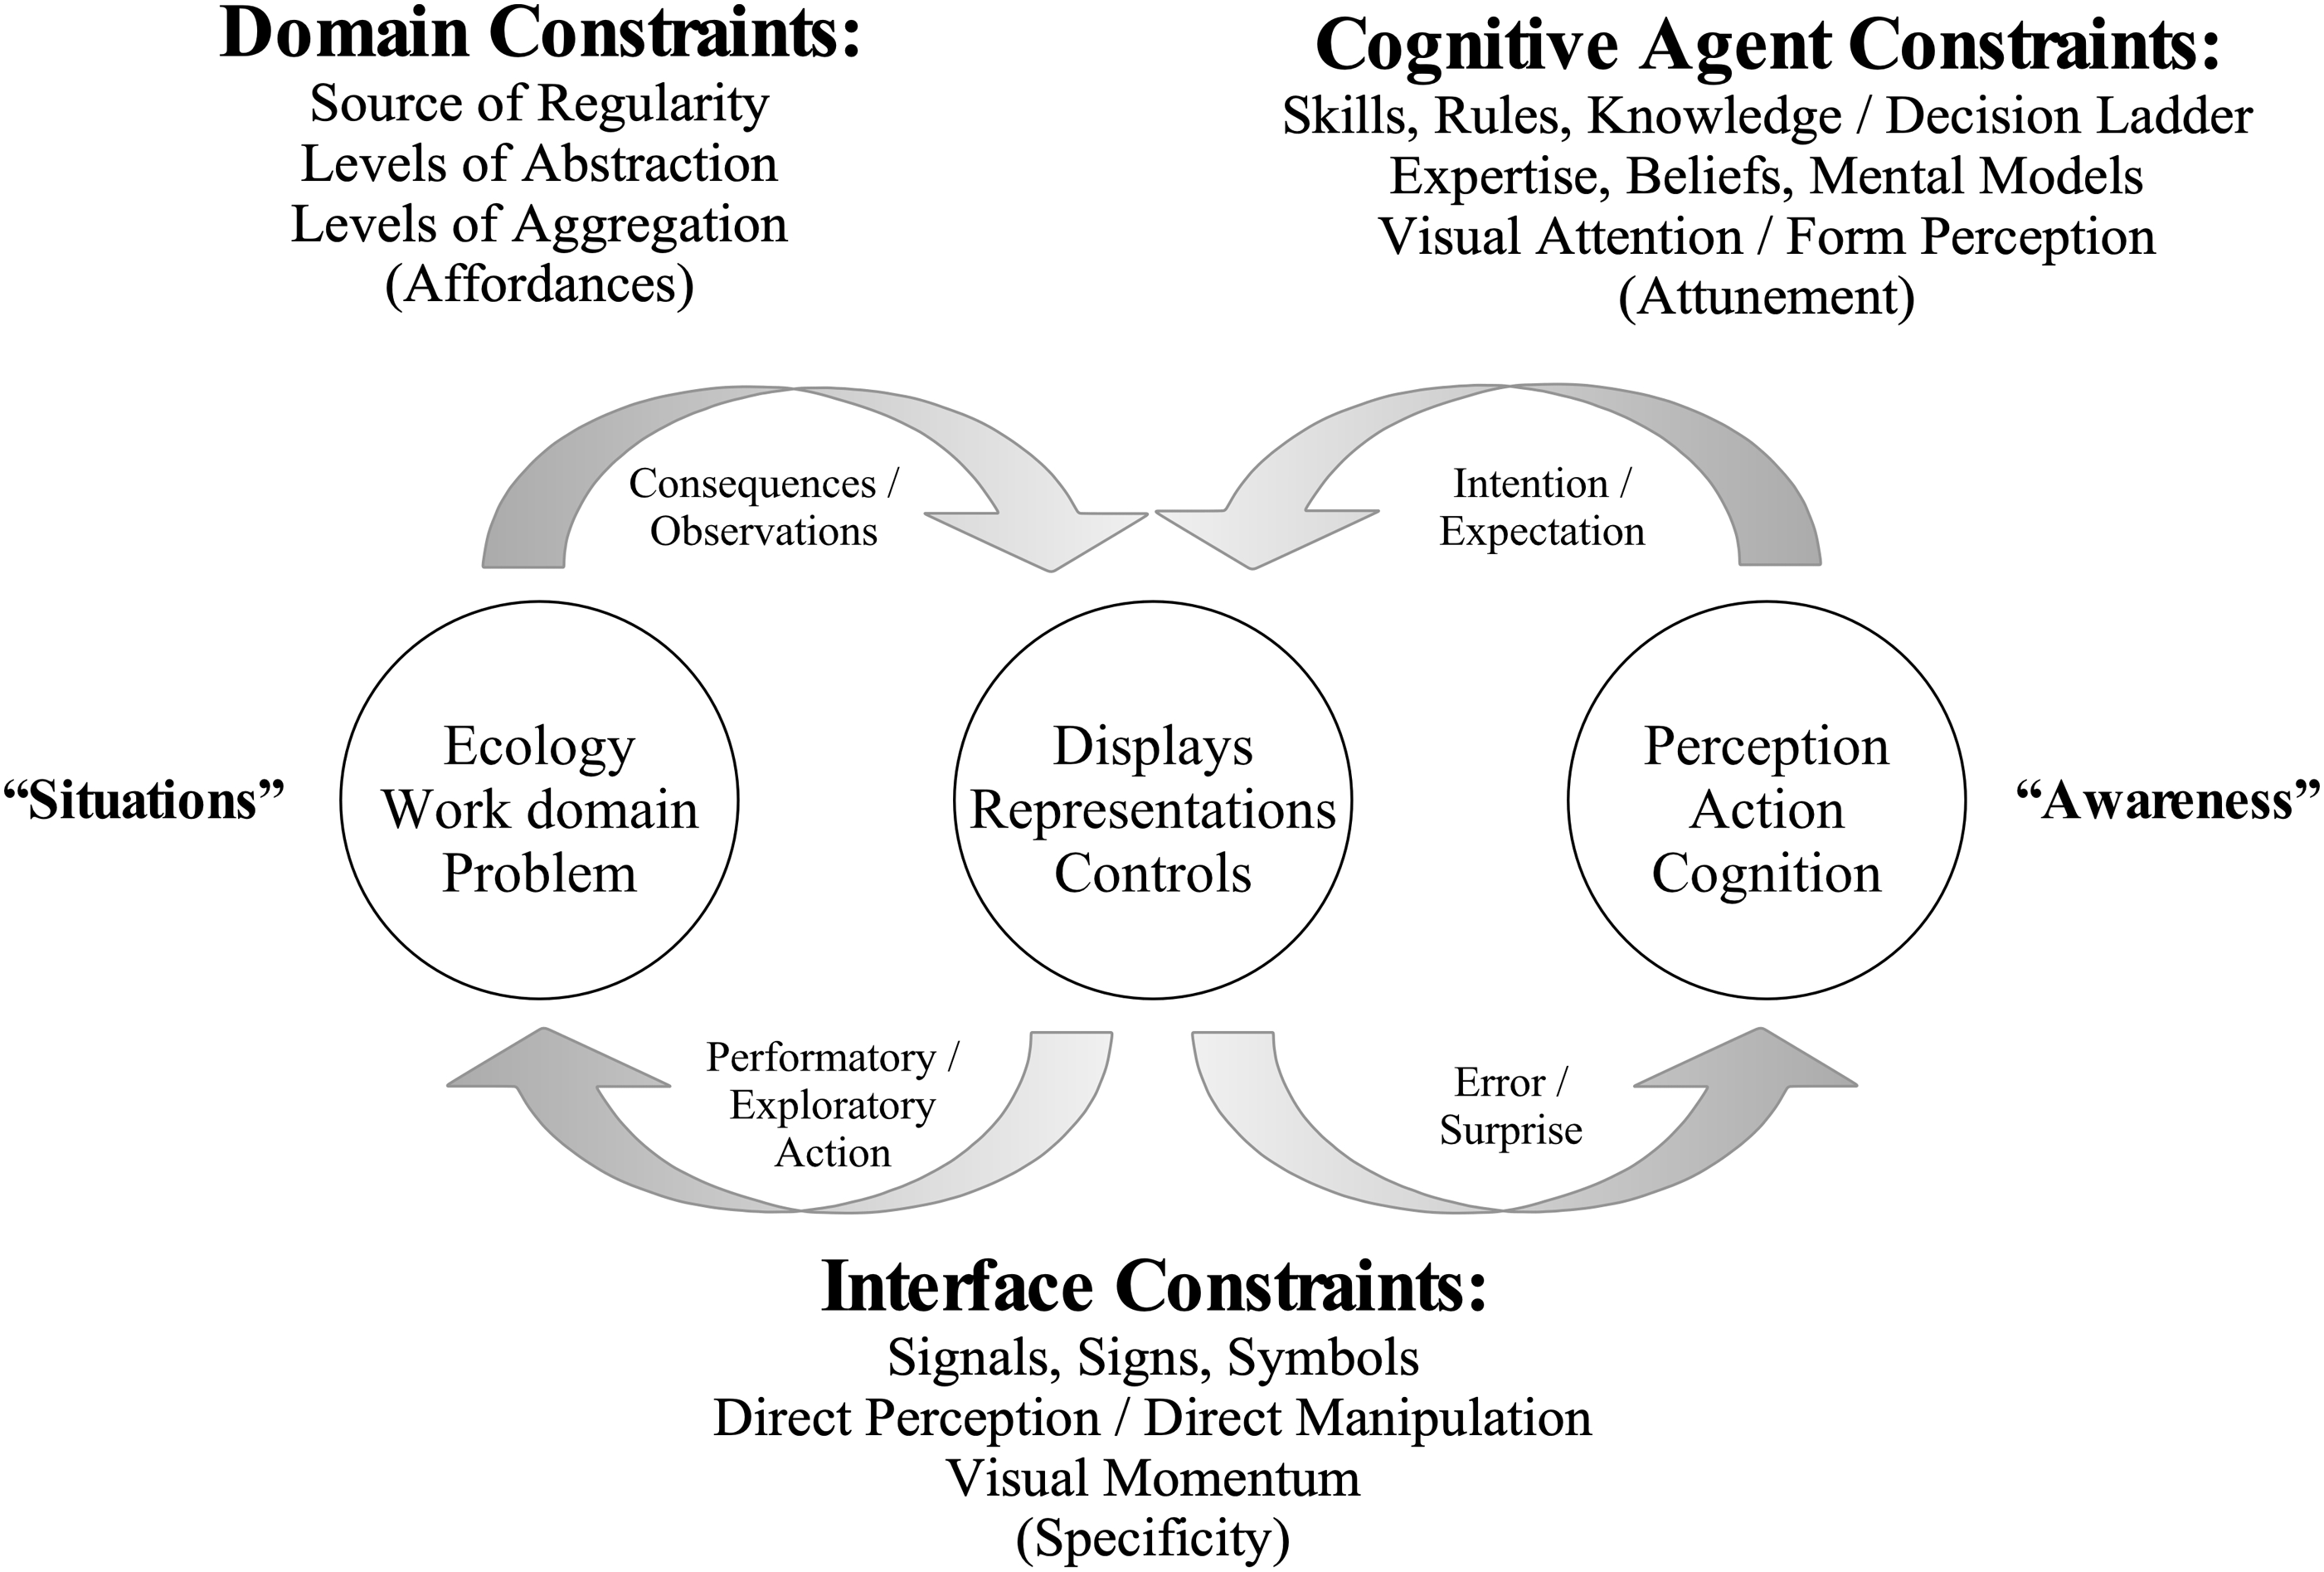
The Perception-Action Loop
This leads naturally to a rationality that is grounded in the ecology or, rather, in the coupling between perception (observation) and action (control) … Actions and observations flow together in a continuous stream. (Bennett & Flach, 2011, p. 34, p. 34)
To think of direct perception and direct manipulation as separate, independent constructs is both easy and sometimes necessary (as in the serial processes of writing or speaking). However, doing so is overly facile: observation and action will often occur simultaneously and in parallel. Consider one familiar example of the continuous stream referred to above. An effective driver will perceive the road while simultaneously applying constant, unconscious control actions to the steering wheel of a vehicle as a function of perceived error (i.e., desired vs. actual location of vehicle in the road), even when the road is straight.
Breaking the Loop
In essence, our experimental manipulations of direct perception and direct manipulation constitute alternative ways to design the interface so that the perception-action loop is either intact or broken. The overall pattern of results (see Figure 6) emphasize the need for an intact loop. The EcoFlex interface (DP DM; intact loop; Figure 1) was consistently the most effective interface in the experiment. The contrasts illustrated in Figure 6 reveal that there were more significant results favoring the EcoFlex interface (32 significant effects with diamond fill) than the other three interfaces combined (28 significant effects with striped, horizontal or no fill). Furthermore, the three interfaces with a broken loop (see Figures 2, 3 and 4) never produced significantly superior performance relative to the EcoFlex interface: Figure 6 reveals that all of the icons in Contrasts 1, 2, and 3 (i.e., those which involve the EcoFlex interface) have diamond fills (thus favoring this interface).
In this section we provide a more detailed interpretation of these results. In the first part we consider perception and action independently and this discussion is organized along evaluation boundaries. We then consider perception and action together in terms of the coupled dynamic which occurs across all three system components.
Boundary 1
Direct Manipulation
Direct manipulation had a powerful and positive impact in supporting performance at Boundary level 1. Overall, direct manipulation (diamond or horizontal fills) was present in 18 of the 19 significant differences between interfaces (see Figure 6a). More specifically, when one interface had direct manipulation applied while the other did not (i.e., contrasts 1, 3, 4, and 6) all 18 of the significant contrasts favored the interface with direct manipulation.
These results suggest that direct manipulation resources in the interface (i.e., point, click, drag, and drop via the mouse) impose a set of constraints which are very compatible with human constraints (i.e., basic human capabilities and limitations). Supervisory controllers executed control input by acting directly upon the objects of interest with the mouse. The controls (e.g., cursor) and objects (e.g., parts) in the interface provide analogical, continuous space-time signals which support the most powerful mode of behavior: skill-based behavior. Because the supervisory controllers were well trained, it is also likely that they developed sequences of automatic activities (i.e., procedures) which could be executed (i.e., rule-based behavior) when needed. For example, the point, click, drag and drop movement of an expedited part from the arrival buffer to the load/unload stations occurred quite often and very likely became automated (thereby freeing up attentional resources for other activities).
Conversely, the arbitrary key-presses and button pushes which were required with the NoDM interfaces imposed a set of constraints that were not a good match to human constraints. These controls essentially move system control to an alternative mode of behavior (i.e., knowledge-based behavior), one that is less efficient because it is dependent upon symbolic representations and limited capacity resources.
Direct Perception
There is very little evidence that direct perception had a significant impact on the results obtained at Boundary 1. There was only one significant result supporting DP when it was varied while DM was held constant (i.e., Contrast 5 in Figure 6a). Note that this should not be interpreted as an inherent limitation of the interface to support direct perception at Boundary 1. The graphical representations in the EcoFlex interface were designed (Bennett et al., In Press) to be simultaneously compatible with both the affordances of the work domain and the constraints of the human visual system (e.g., emergent features; visual salience). However, a corresponding Boundary 1 evaluation was not conducted (e.g., pause the simulation and ask for differences between actual and goal levels of production at that particular moment in time).
Boundary 3
Direct Perception
In sharp contrast, the results clearly indicate that the presence or absence of direct perception is the dominant factor controlling performance at Boundary level 3 where the dependent variables are defined by the semantics of the FMS. Overall, direct perception (i.e., diamond or striped fills) was present in 38 of the 41 significant differences between interfaces (see Figure 6b). More specifically, when one interface had direct perception applied while the other did not (i.e., contrasts 2, 3, 4 and 5) all 36 of the significant contrasts favored the interface with direct perception.
Constraint Matching/SBB
These results indicate that the graphical displays for DP were designed to produce a very high-quality mapping between all three sets of constraints represented in Figure 8 (see Bennett et al., In Press, for detailed descriptions). The application of direct perception design principles produced a virtual ecology where the affordances of the work domain are reflected directly in the visual properties of the displays. Simultaneously, the visual salience (e.g., emergent features) of this information was specifically designed to allow semantic properties of the work domain to be picked up directly by the supervisory controller via powerful skill-based behaviors.
Constraint Matching/RBB
Once again, it is likely that rule-based behaviors were also developed to automate behavior. Here information serves as a sign which triggers the execution of a previously learned procedure. For example, a large discrepancy in goal vs. actual production levels observed in the production balance display might serve as a sign which triggers an automatic sequence of activities required to locate and move parts of that type into the system. This is viewed as a short cut in the decision ladder and it is conceptually very similar to the type of naturalistic, recognition-primed decision making described by Klein (e.g., 1989).
Constraint Matching/KBB
Conversely, without direct perception resources, the supervisory controllers were required to collect and interpret information about the work domain via alpha-numeric representations. Once again, these constraints on interaction move corresponding activities to an alternative mode of behavior (i.e., knowledge-based behavior), which is dependent upon symbolic representations and more limited capacity resources.
Direct Manipulation
There was evidence that direct manipulation improved performance at Boundary 3, where the dependent variables are defined by work domain metrics. The results presented in Figures 5b and 6b reveal that significant performance advantages were obtained for prioritization when direct manipulation resources were added to the interface (while direct perception resources are held constant, see Contrasts 1 and 6). As outlined in the introduction, the prioritization (i.e., scheduling) of parts for completion is perhaps the fundamental task in FMS; experience has demonstrated that human supervisory controllers must coordinate and cooperate with automation for the scheduling of parts to be successful.
There were additional indications that direct manipulation improved performance at Boundary 3. Figure 6b indicates that there were 3 additional significant results: Contrast 1 for settling time; Contrast 6 for both goal vs. actual part production and acquisition time. In addition, Figure 5b illustrates that the addition of DM to the interface consistently improved average performance (diamond vs. striped fills and horizontal fill vs. unfilled).
Composite Variable
Given this pattern of results, and the fact that there were only 6 participants in the study (i.e., a very small sample size), we calculated a composite variable for Boundary 3 dependent variables with the goal of improving statistical power. Figure 7 presents the results of an ANOVA conducted on these data; the main effect and all contrasts between interfaces were significant. Contrasts 1 and 6 are critical for direct manipulation, since DP is held constant while direct manipulation is varied; both are significant and favor the interface with DM resources. These results suggest that if statistical power were increased by alternative means (e.g., increasing the number of participants), then adding direct manipulation resources to the FMS interface would lead to significant improvements in performance for Boundary level 3.
Poor Constraint Matching
Collectively, these results for direct manipulation do not fit well with an interpretation based on constraint matching alone. The mappings between interface (direct manipulation resources) and the work domain (constraint envelope of the Boundary 3 evaluation) are quite low: the input technology (mouse and cursor) has a limited ability to directly convey information about the semantics of the work domain itself (as opposed to, for example, a haptic glove).
The Closed-Loop, Dynamical Control System Perspective
The interpretation of these results requires a perspective incorporating the concept of a closed-loop dynamical control system (e.g., Jagacinski & Flach, 2003). This perspective emphasizes the continuous and parallel interactions which occur between triadic system components (represented by the arrows in Figure 8). An example of this perspective is found in Gibson’s (e.g., 1966, 1979) concept of the perception-action loop: perception and action are activities which occur over time as a direct consequence of an organism’s interaction with the ecology. These activities are directly coupled and inexorably intertwined: higher-order visual properties (i.e., optical invariants and optical flow) are specific to both the properties of the ecology and the organism’s navigational path through it.
Control of Complex Systems
The dynamic control perspective is also clearly relevant for complex, dynamic work domains when the interaction is computer mediated (see Figure 8). Observation (via displays) and action (via controls) occur simultaneously and are inexorably intertwined. Higher-order properties of the dynamic visual displays (e.g., emergent features) are specific to both the properties of the work domain and to the path of navigation which is taken through the system’s state space (where some locations are desirable and some locations should be avoided).
Consider two types of control input which are possible in these systems. The first type of control input are “performatory” in nature (i.e., they are executed in pursuit of specific goals and intentions). These control input generate changes in system state and thereby provide informative feedback: did the control input produce the desired effect (e.g., did it move system state closer to the intended goal state?) or was the supervisory controller surprised? The second type of control input are “exploratory” in nature. These control input are executed when current system state is ambiguous; the goal is to see how the system responds (thereby making current system state less ambiguous).
Control-Theoretic Interpretation
These considerations set the stage for an interpretation of the findings which demonstrate that direct manipulation resources are capable of improving performance for dependent variables at Boundary level 3. Control input constitute the actions which ultimately determine the specific navigational path which is taken through the state space of the system. That is, they produce changes in system state and movement towards or away from system goals (in addition to other considerations which are critical for the Boundary level 3 constraint envelope). Much like an organism navigating an ecology, the dynamic changes in the visual appearance of the graphical displays over time are specific to this path. Thus, the constant interplay between observations and actions produce feedback which is a critical component of the closed-loop dynamical control perspective depicted in Figure 8.
General Discussion
Despite a previous unsuccessful attempt to apply the AH to an FMS [6], there are good theoretical reasons for believing that the applicability of EID is not limited to process control … While it is far from straightforward to create a design along the lines described in the previous section, the potential advantages of an ecological interface warrant a significant design and development effort … Given the importance of human behavior for AMS [FMS] performance … the potential benefits of EID are well worth pursuing. (Kinsley et al., 1994, pp. 297–300)
We believe that our research program is a representative example of this type of analysis, design, and development effort. The products of this program are innovative and make theoretical and applied contributions to both FMS and CSE/EID.
Contributions to FMS
Work Domain Constraints
Perhaps the defining characteristic of the EID approach is its emphasis on the work domain. The synthetic task environment used in our evaluation is very representative of real-world constraints. Mitchell and her colleagues (e.g., Dunkler et al., 1988) analyzed a real-world FMS and originally developed this STE. It is both complex and realistic, providing “… a high-fidelity … controlled laboratory environment in which to implement and evaluate the supervisory control perspective for FMS scheduling” (Krebs et al., 1989, p. 966).
Furthermore, we adapted the STE in ways that increased its representativeness (i.e., time stress, changing production goals and abnormalities). Ultimately, these manipulations add elements of unanticipated variability (e.g., Roth et al., 1987) or context-conditioned variability (Vicente, 1999), a critical component of real-world settings. Similarly, this increases the need for adaptive, situated action (Suchman, 1987) on the part of the supervisory controller (in concert with automation).
Interface Constraints
To some readers, it may seem like a straw man because it lacks some information … However, this [interface] is not atypical of actual control rooms. (Christoffersen et al., 1997, p. 526, p. 526)
A primary focus of the program was on the development of FMS decision making support (i.e., the EcoFlex interface). As the triadic perspective maintains (see Figure 8), the interface will contribute a set of behavior-shaping system constraints. This is clearly evident in the present experiment, as demonstrated by the systematic differences in performance obtained between interfaces.
Venturing out of the laboratory into applied settings often reveals a surprising gap between theoretical advances and practical application. Our contacts at a modern and profitable production facility indicate that their computerized interfaces occupy a very similar place in conceptual design space as the NoDP NoDM interface: predominately alpha-numeric displays, predominately touch keyboard input (including arrow keys) and a single-sensor single-display design philosophy (i.e., the portrayal of lower-level physical data, but no higher-order functional information). This is of course only one data point, but the potential for aspects of the EcoFlex interface to generalize to real-world settings may be substantial.
Controller Constraints
Subjects were given extensive experience at controlling the system so that the results would be more likely to generalize to experienced operators. (Vicente, 1997, p. 410, p. 410)
System controllers also contribute a set of constraints; this is true of both automation and human controllers (only human constraints are listed in Figure 8). Although the automation in our STE was extensive (as described in the supplemental materials), it was not particularly complex. This was a conscious decision; we wanted to produce situations where interventions by the supervisory controller were necessary.
Our participants were students and not FMS supervisory controllers. However, they were very well trained (i.e., approximately 24 hours of experience) and they achieved a high degree of proficiency in working with this complicated and representative synthetic task environment. For example, the average score for actual versus goal production levels (the top priority) with the EcoFlex interface revealed that participants were deviating from the goal value by an average of less than 1/2 of one part for each part type during a shift.
Novel Dependent Variables
We developed novel methods of measuring performance including priority and various measurements adapted from manual control in continuous variable systems (e.g., Poulton, 1974). These adapted methods proved to be very sensitive in assessing differences in performance associated with alternative forms of decision support. Consider the results for mass. The dependent variables adopted from manual control (i.e., mass results located at the bottom of Figure 6b) produced 20 significant differences between interfaces while the traditional dependent variables for mass (middle of Figure 6b) produced only 7. The results are even more emphatic in the preliminary evaluation (see supplementary materials). They indicate that 10 significant differences between interfaces were obtained with the adapted measurement techniques while none were obtained with the traditional measurements for mass.
Potential for Generalization
Rasmussen’s approach to specifying the generalizability of an empirical investigation was to be very specific about the constraints that might vs. might not be operating on an actor in the context of an empirical evaluation. The constraints in operation in an empirical study will dictate the situations and context to which the results of the evaluation can generalize. (Sanderson & Burns, 2017, p. 650, p. 650)
The issue of generalization is complicated and has been discussed in a variety of research literatures. Rasmussen’s CSE evaluative framework was specifically designed to address these concerns. This framework asserts that the potential for the findings of an evaluation to generalize to real-world settings depends upon the quality of the mapping between the constraints which exist in the evaluation setting and the constraints which exist in the real world: more overlap translates into better potential to generalize. The triadic conceptualization (see Figure 8) provides for a finer grained analysis of these constraint mappings.
As the details of this section suggest, the present experiment meets many of the conditions required for generalization. Specifically, the three major system components in Figure 8 are representative: a realistic synthetic task environment, well-trained participants, and interfaces designed with constraints of both the work domain and the worker in mind. Generalization to real-world settings will occur to the extent that 1) the underlying simulated constraints here (e.g., the need to schedule and prioritize manufacturing processes) are similar to those constraints found in the target FMS and 2) how well the specific design features of the EcoFlex interface (e.g., the production balance display) can be adapted to the specific characteristics of other FMS settings.
Principles of Interface Design
Thus, in its present form, the scope of EID is limited … Ideally then, work on these other problems should be integrated with the EID approach to provide a comprehensive approach to interface design. (Vicente & Rasmussen, 1992, p. 591).
As this quote indicates, Vicente and Rasmussen were clearly comfortable with an expansion of their original EID principles. The framework illustrated in Figure 8 accomplishes this goal. There are three interface design principles: direct perception, direct manipulation and visual momentum. We will examine each principle of design and discuss how it relates to, and is consistent with, the original design principles of EID.
Direct Perception
That is, given an understanding of the human perceptual system, the designer should use computer technology to make the previously identified affordances available to the organism in a form that “vision is ready to pick up” (Gibson, 1979, p. 260).
As this quote suggests, our use of the term direct perception is very consistent with the original principles of EID. The graphical displays of an interface should be designed to provide signals (SBB), signs (RBB) and symbols (KBB) which support all three modes of behavior (i.e., the original three principles of EID).
Vicente and Rasmussen focused on the quality of mappings between properties of the work domain and geometrical properties of the graphical displays (i.e., the left two system components represented in Figure 8). We expanded EID display design principles by simultaneously focusing on “an understanding of the human perceptual system” (e.g., Bennett & Flach, 1992; 2011). This is the complementary quality of mappings which occur between the right two system components in Figure 8: the relationship between geometrical properties of graphical displays and the human perceptual system (i.e., visual salience and emergent features). Once again, it is convenient to talk about each set of mappings independently, but it is the overall quality of the mappings between all three components which will determine the effectiveness of display design.
Direct Manipulation
The final principle of EID is concerned with action. What means does the interface provide for the operator to control the system? EID suggests that, whenever possible, commands should be communicated by directly acting on the display-
Vicente and Rasmussen actually list direct manipulation as a component of the original EID principles of design (under the heading of SBB). The notion of a perception-action loop that is either closed (intact) or open (broken) is a primary consideration of the present study. See Rasmussen (1986) for a semiotic based (i.e., involving the three triadic components in Figure 8) discussion of the implications of breaking the perception-action loop in alternative ways (control surfaces, display surfaces, or both).
Visual Momentum
One of the biggest problems in scaling up EID is …
Finally, the need to provide interface resources which guide the navigation of the work domain’s state space as well as the ability to locate relevant data in complex socio-technical systems has long been recognized. The principle of visual momentum (e.g., Bennett & Flach, 2012; Woods, 1984) addresses these needs. Although Vicente and Rasmussen chose not to address visual momentum in their formulation of EID principles, they clearly recognized its importance.
An Integrated, Comprehensive Framework
The theoretical framework presented in Figure 8 provides an integrated and comprehensive expansion of CSE/EID which builds upon, but does not replace, the original principles. The core concepts of CSE (e.g., conceptual distinctions and analytical tools) and EID (e.g., design principles based on modes of behavior) remain intact. The principles of interface design in this expansion (direct perception, direct manipulation, visual momentum) are aligned with the fundamental interface components (displays, controls, navigational resources) which are needed to support human controllers in making decisions and solving problems effectively. The critical perspective of the semiotic triad (Peirce, 1931-1935a, 1931-1935b) is made explicit in this expansion (see also Gibson, 1966; 1979; Nadin, 1988; Rasmussen, 1986; Woods & Roth, 1988). The ability to interpret performance in terms of the quality of constraint matching between these three components is a very powerful one (e.g., Bennett & Flach, 1992; 2011). Finally, the perspective of a dynamical closed-loop control system has also been incorporated. As the interpretation of the results in the present evaluation indicate, this is also a powerful and useful theoretical vantage point.
Summary
For over 3 decades there was a belief that computer-based solutions would “solve” complex industrial scheduling problems, yet most manufacturing organizations still require human contributions for effective scheduling performance. (Jackson et al., 2004, p. 533, p. 533)
From a joint cognitive systems perspective (e.g., Roth et al., 1987), the goal of system design is not to replace a perceived deficiency in the human (e.g., the ability to prioritize or schedule) with a technological prosthetic device (e.g., more sophisticated forms of automation). Rather, the goal is to provide interface resources which allow human experts to leverage both their expertise and their formidable perceptual-motor skills. The success of this research program demonstrates that the CSE/EID approach is perfectly well-suited for developing interface resources which support the human in their role as a supervisory controller of an FMS system. It also adds to accumulating evidence (e.g., Bennett & Flach, 2019) that the CSE/EID framework is suitable for developing decision making and problem solving support for work domains of all types.
Footnotes
Acknowledgments
The preliminary study reported in the supplementary materials was completed in partial fulfillment of the requirements for the undergraduate psychology honors program for Natalie Jackson. The main study was completed in partial fulfillment of the requirements for the master of science degree for Dylan Cravens. We thank Kelvin Kreager for his contributions of time, effort and first-hand knowledge of FMS. We thank the participants for their diligent efforts in learning how to become effective FMS supervisory controllers. The first author would also like to thank John Flach and David Woods for decades of productive collaborations.
Declaration of Conflicting Interests
The author(s) declared no potential conflicts of interest with respect to the research, authorship, and/or publication of this article.
Funding
The author(s) received no financial support for the research, authorship, and/or publication of this article.