






Abstract
Modern action teams operate in high-tempo, uncertain environments that demand continuous adaptation across multiple dimensions. Despite growing interest in real-time team assessment, few methods exist for detecting dynamic reorganization in team interaction patterns. This paper represents a methodological step toward establishing Collective Systems Adaptation (CSA) analysis as a generalizable analytic framework. We explicate the core analytic procedure underlying CSA and demonstrate its feasibility using communication behavior from two 14-person U.S. Army tank platoons. Time-varying measures of communication flow were derived to capture both temporal and structural interaction dynamics, and CSA was applied to quantify characteristics of adaptive activity. Results indicated that dynamic communication characteristics were systematically related to multiple dimensions of combat performance. Collective System Adaptation derived metrics further demonstrated that larger, discrete reorganization events were associated with improved targeting accuracy, and greater cumulative adaptation corresponded to reduced overall effectiveness. Together, these findings demonstrate the feasibility of CSA for detecting emergent patterns of team reorganization and illustrate its potential value for assessing adaptive team functioning in complex operational settings. Implications for methodological development, real-time monitoring, and training evaluation are discussed.
Introduction
In the postindustrial era, rapid technological advancements have continuously reshaped the nature of work across industries (Kozlowski & Chao, 2018). The rise of computerization, digitization and high-speed information transmission has enabled individuals to collaborate in novel ways across increasing spatial and temporal scales. Although these technologies offer clear benefits in terms of reach, efficiency and scalability, they have also introduced new complexities, making modern work environments more susceptible to unforeseen challenges, latent system hazards and coordination breakdowns (Hollnagel & Woods, 2005; van Eijndhoven et al., 2023a, 2025). In response to these shifts, modern teaming science recognizes that success in complex, high stakes domains such as aerospace, healthcare and defense, depends on flexible, adaptive and interdependent human systems (Cooke et al., 2013; Mathieu et al., 2019; Salas et al., 2018). Unlike the Tayloristic work arrangements typical of the industrial era, many modern teams are fluid, cross-functional and geographically dispersed. These teams must not only align on shared goals and roles but must also develop trust, implicit coordination and adapt in real time to dynamic operational demands (Edmondson & Lei, 2014; Kozlowski & Chao, 2018; Mathieu et al., 2019).
The increasing complexity of modern work has led scholars to conceptualize teams not as static units, but as complex adaptive systems. From this perspective, teams are considered open loop, dynamic entities composed of interdependent agents whose behaviors evolve over time through interactions and environmental feedback (Arrow et al., 2000; Ramos-Villagrasa et al., 2018). Team effectiveness cannot be reduced to a linear summation of individual inputs (Dekker et al., 2011). Instead, team behavior arises from recursive and context-dependent processes that exhibit emergent properties (Cooke et al., 2013; Goldstein, 1999; Rosen et al., 2011; van Eijndhoven et al., 2023b; Waller et al., 2016).
To study these dynamics, researchers have increasingly turned to dynamic approaches that offer a mathematical and conceptual framework for modeling team behaviors as time-dependent and adaptive (Gorman, Amazeen, & Shope, 2012, 2017, 2019, 2025; Amazeen, 2018; Klonek et al., 2019; Kozlowski & Chao, 2018; Mathieu et al., 2019; McGrath et al., 2000). Such approaches preserve the temporal structure of interaction and enable analysis of coordination, variability, and synchrony across behavioral, cognitive, and physiological signals (Amon et al., 2019; Gorman, Cooke, & Amazeen, 2010; Guastello & Liebovitch, 2009; Likens et al., 2014; Likens & Wiltshire, 2021; Stevens & Galloway, 2014; van Eijndhoven et al., 2023a, 2023b, 2025). Importantly, these methods reflect the view that effective teams are neither rigid nor chaotic, but instead exhibit adaptive variability and structured flexibility, which are core features of self-organizing systems. (Demir et al., 2016; Hollnagel et al., 2006; Kelso, 1995).
At the same time, the increasing integration of technology into team-based work has been accompanied by a proliferation of data capturing team interactions over time (Kozlowski & Chao, 2018; Salas et al., 2018). Data sensed unobtrusively and opportunistically—such as communication recordings, chat logs and transcripts, global positioning systems, interface input records, proximity sensors (e.g., Bluetooth), and accelerometry or physiological signals from wearable devices—have become both more accessible and more reliable (Braun et al., 2024; Gorman et al., 2019; Kozlowski & Chao, 2018; Likens et al., 2014; Sheehan et al., 2023). Such data sources provide a powerful opportunity to examine the emergent cognitive, affective and behavioral dynamics of teams as they unfold in real time (Gorman et al., 2019; Kozlowski & Chao, 2018; Likens et al., 2014). Despite this potential, relatively few studies have developed robust methodologies to harness these data for modeling dynamic team processes (Kozlowski & Chao, 2018; Ramos-Villagrasa et al., 2018).
The present work addresses this gap by advancing Collective Systems Adaptation (CSA), a developing analytic approach designed to examine team adaptation from a systems perspective. Collective Systems Adaptation aims to characterize adaptation by identifying coordinated deviations across multiple time-series indicators of team interaction, reflecting reorganization at the system level. More broadly, CSA is motivated by the need to understand adaptation as a multidimensional process that emerges through interacting team dynamics over time.
This paper represents a methodological step toward establishing CSA as a generalizable analytic approach. Here, we explicate the core analytic procedure underlying CSA and demonstrate its feasibility using communication behavior as an illustrative case. This focused application enables a detailed description of the method’s logic, assumptions, and interpretive goals while intentionally limiting scope to a single interaction dimension. Prior work has explored CSA’s applicability across additional dimensions (Landfair et al., 2025; Peel, Landfair, Johnson, et al., 2025) and its potential as a multidimensional framework integrating communication, geospatial coordination, and physiological data (Peel, Landfair, Renwick, et al., 2025) but has not fully articulated the analytic procedures that support these applications. Accordingly, the present study should be understood as a methodological contribution toward the development of CSA rather than a complete and definitive guide of the method.
For clarity, we organize our discussion of CSA into four main sections. We begin by discussing teams and team adaptation. We then outline the CSA methodology, including its theoretical grounding and design rationale. Next, we present a case study illustrating the method’s utility, highlighting how its outputs relate to distinct facets of team performance. Finally, we consider the broader theoretical implications of this approach, discuss potential applications in future research and practice, and address key limitations.
Background
Organizations favor teams for tackling complex challenges because, when they function well, they are adaptable and resilient (Cooke et al., 2013; Salas et al., 2018). Teams can accomplish more than individuals working alone by combining their unique knowledge, skills, and experiences (Goodwin et al., 2018). Although team members operate in the same task environment, they may possess different information or opportunities, making them inherently diverse (Cooke et al., 2013). This diversity allows teams to: (1) integrate and apply complementary expertise; (2) support and monitor one another; (3) reorganize their resources and capacities to manage workload and dynamic environmental constraints; and (4) creatively discover novel solutions to unique challenges. However, this potential depends not simply on the composition of individual competencies, but on how effectively team members interact over time (Cooke et al., 2013; Gorman, Amazeen, & Cooke, 2010; Gorman, Cooke, & Amazeen, 2010).
No two teams are functionally identical, even within the same domain, due to variation in temporal coupling, role interdependence, hierarchy, and risk exposure. For instance, a primary care team may rely on loosely coupled interactions over long time horizons, whereas a trauma team must coordinate rapidly and intensely under acute pressure (Salas et al., 2018). These differences shape not only how teams are organized but how coordination unfolds in real time, challenging static or metaphorical conceptions of teams. Among the broad spectrum of team types, action teams exemplify high-functioning, high-stakes coordination under uncertainty and time pressure; examples include surgical teams, emergency responders, and military crews. These teams must adapt fluidly to shifting demands, where failures in coordination can carry immediate consequences (Gorman et al., 2020; Sundstrom et al., 1990).
Researchers investigating teams have often focused on studying team cognition (Salas & Fiore, 2004). This is because much of the work performed by teams, particularly action teams, can be considered fundamentally cognitive. Teams must collectively perceive, interpret, decide, and act in response to complex and evolving situations. Even when individuals execute tasks independently, their actions are embedded within a broader, shared decision-making framework. Through interaction, coordination, and information exchange, teams give rise to emergent, system-level cognitive processes that are not reducible to any single member. However, traditional approaches to studying team cognition often rely on post hoc assessments or aggregated individual perceptions to infer shared knowledge structures. Though informative, they fail to capture how team-level cognition emerges and evolves dynamically through interaction, particularly in the fast-paced, high-risk contexts in which action teams operate (Dekker et al., 2011; Gorman, Cooke, & Amazeen, 2010).
In contrast, the Interactive Team Cognition (ITC) framework conceptualizes cognition as an activity that unfolds through interaction rather than a static property stored in individuals (Cooke et al., 2013). From this view, team cognition emerges dynamically through communication, coordination, and behavior embedded within specific task and environmental contexts. This perspective aligns naturally with complex adaptive systems theory and has important implications for how adaptation should be defined and measured in action teams (Gorman, Amazeen, & Cooke, 2010; Gorman, Cooke, & Amazeen, 2010; Johnson, 2023; Li et al., 2023; Nguyen et al., 2025; Robinson et al., 2023).
Team Adaptation
Traditional accounts of team adaptation often emphasize deliberate, top-down processes such as problem recognition, planning, and coordinated execution (Burke et al., 2006). Although useful in some organizational contexts, these frameworks capture only part of how adaptation unfolds in dynamic action teams. In fast-paced environments, adaptation is not always deliberate or attributable to a single definable cause. Instead, it may emerge through continuous recalibration of coordinated behavior in response to evolving situational demands.
From a complex adaptive systems perspective, team adaptation is defined as measurable reorganization of interaction processes arising from changing contextual constraints (Gorman et al., 2010, 2017, 2025). These reorganizations are reflected in evolving patterns of coordination over time rather than discrete events or isolated decisions (Gorman, Cooke, & Amazeen, 2010). Crucially, while adaptation is fundamentally a process of structural reorganization, these shifts do not inherently guarantee improvement; the resulting dynamics can move a team toward a more functional state or, conversely, lead to maladaptive patterns that degrade overall performance. Context, in this view, is inseparable from system behavior and cannot be fully specified or independently manipulated (Amazeen, 2018; Dekker et al., 2011; Gorman, Cooke, & Amazeen, 2010; Haken, 1977; Wiltshire et al., 2024). Instead, it is implicitly encoded within temporal interaction dynamics, observable through changes in coordination structure and variability (Gorman, Cooke, & Amazeen, 2010; Haken et al., 1985; Schöner & Kelso, 1988; Wiltshire et al., 2024).
This perspective shifts emphasis away from explaining why a team adapted and toward understanding how the system reorganizes in an attempt to maintain functional stability under uncertainty (Dekker et al., 2011). Adaptation, in this sense, is closely linked to both flexibility, the capacity to adjust behavior in real time, and resilience, the ability to rapidly respond, reorganize, and recover from conditions beyond its prior competence boundaries (Grimm et al., 2023; Hoffman & Hancock, 2017; Woods, 2015). Of significance for the present work is the fact that adaptation is inherently multidimensional, unfolding across different system components and temporal scales, yet governed by lawful patterns of coordination and reorganization (Amazeen, 2018; Gorman et al., 2025; Likens et al., 2014; Wiltshire et al., 2024).
Measuring Team Adaptation
Despite broad agreement regarding the importance of adaptation for team effectiveness, relatively few methods directly capture how adaptive processes unfold in real time (Gorman, Amazeen, & Shope, 2012). Advances in real-time data collection techniques have opened new opportunities to observe teams continuously and unobtrusively, motivating a wide range of analytic approaches including time-series modeling, machine learning, and agent-based simulations (see Kozlowski & Chao, 2018). However, several limitations constrain their utility for assessing team adaptation. Supervised models, for instance, require labeled data for training and validation. In naturalistic contexts, however, adaptation events are rarely easily defined or attributable solely to outcomes, which can complicate labeling efforts. In addition, more advanced approaches such as deep learning lack explainability. Their “black box” nature makes them less suited for feedback or training, and shifts in task demands may challenge their stability over time.
These limitations have contributed to growing interest in dynamic approaches that model team behavior as a set of interdependent, evolving processes embedded within a changing environment. Methods that can be captured under the broad heading of a Dynamical Systems Analysis (DSA) toolbox preserve temporal structure while capturing coordination and variability in interaction dynamics (Amazeen, 2018). Those techniques include entropy-based complexity measures (Shannon & Weaver, 1949), Recurrence Quantification Analysis (RQA; Webber & Zbilut, 2005), Cross-Recurrence Quantification Analysis (CRQA; Coco & Dale, 2014), Lyapunov exponents (Wolf et al., 1985), Detrended Fluctuation Analysis (Peng et al., 1994), and Hurst exponents (Gorman, 2005; Hurst, 1951). Extensions of this work have further demonstrated how adaptation can be examined across interacting behavioral layers using multilevel dynamic approaches (Gorman et al., 2019, 2025; van Eijndhoven et al., 2025). Collectively, the DSA toolbox offers interpretable, time-sensitive tools that are well-suited to capturing adaptive reorganization in complex team systems.
As an overarching framework, DSA emphasizes the multiscale, context-sensitive nature of team interaction, and its toolbox is under continual expansion (Amazeen, 2018). Realizing the full potential of this framework requires ongoing development of analytic methods that can detect reorganization across multiple dimensions of behavior while remaining interpretable and applicable in realistic settings. Beyond methodological feasibility, however, an important question concerns why adaptation should be measured in this way and what such measures offer beyond traditional performance outcomes.
Why Measure Team Adaptation
Measuring team adaptation provides insight into aspects of team functioning that are not captured by traditional performance outcomes alone. Performance metrics are often post hoc, task-specific, and incomplete indicators of team quality (Brannick et al., 1995). Good teams may fail due to unfavorable conditions, chance events, or constraints beyond their control, while poorly coordinated teams may succeed due to luck, low task difficulty, or the extraordinary efforts of a few individuals. As a result, performance outcomes do not necessarily reflect how well the team functioned as a coordinated system. In contrast, measures of adaptation derived from interaction dynamics offer a window into how teams reorganize in response to changing demands, enabling detection of meaningful patterns in team behavior that may signal effective coordination, strain, or instability, sometimes as these processes unfold (Gorman et al., 2020; Grimm et al., 2023).
A second motivation for measuring adaptation lies in its potential to support diagnosis and training. By identifying points in time where significant reorganization occurs, adaptation measures can help direct attention to moments that may warrant closer examination during after-action review or other training exercises. Although such measures do not fully explain why an adaptation occurred, and contextual attribution may remain incomplete, they can nonetheless highlight periods where coordination broke down, shifted, or stabilized. In this way, adaptation measures serve as indicators of when the team changed in consequential ways, providing a structured starting point for deeper qualitative analysis, after-action review, or intervention. In the following section, we introduce a developing analytic approach that builds on these foundations.
Collective Systems Adaptation
Collective Systems Adaptation analysis aims to identify and characterize team adaptation by analyzing the temporal relationships between significant deviations across multiple variables of team interaction. It is designed for use in complex, naturalistic environments where teams face unpredictable challenges. Collective Systems Adaptation analysis treats adaptation as an emergent, temporally structured phenomenon, inferred from patterns of change within and across synchronized time series measures of team behavior.
Collective Systems Adaptation rests on several theoretical tenets, the first two of which are adapted from ITC theory (Cooke et al., 2013). First, team adaptation is a dynamic process, reflected in temporal shifts in patterns of interaction rather than in static levels of behavior or cognition. Second, team adaptation must be interpreted within the context of the team’s current state. Absolute values of a given measure do not inherently indicate adaptation; rather, significant changes in those measures signal potential reorganization. Third, team adaptation can be understood by investigating the relationship between variations in coupled measures of team interactions (Gorman et al., 2004). By detecting emergent adaptation in real time, CSA supports scalable assessment of team functioning in settings in which traditional methods may fall short.
Collective Systems Adaptation is situated within a small but growing body of work that seeks to infer meaningful properties of teams directly from changes or variation in their interaction processes over time (e.g., Gorman et al., 2004; Gorman, Cooke, & Amazeen, 2010; Grimm et al., 2023; Likens & Wiltshire, 2021). Rather than relying on externally defined events, this line of research treats reorganization in team dynamics as a primary signal of adaptive behavior. For example, Grimm et al. (2023) operationalized team resilience using multivariate entropy time series derived from sliding windows, capturing moments of team reorganization. Similarly, work by van Eijndhoven and colleagues has examined changes in coordination states (i.e., team coordination breakdowns) using time series measures of physiological synchrony captured through multivariate recurrence quantification analysis (MRQA) combined with a form of predictive modeling derived root mean square error (RMSE; van Eijndhoven et al., 2023a).
These efforts align with the general analytic framework articulated by Wiltshire et al. (2024), which outlines how temporal changes in team processes can be leveraged to infer adaptive states and, in applied settings, potentially inform real-time feedback or intervention. Collective Systems Adaptation analysis follows a similar process and is organized into four core stages:
Interaction Measure Selection and Preparation
Collective Systems Adaptation analysis operates on continuous, time-aligned measures of team interaction that capture aspects of a team’s ongoing process. These interaction measures, sometimes called coordination measures, emerge from the broader coordination dynamics literature, which has largely focused on how pairs of coupled elements evolve toward stable patterns of organized behavior (Gorman et al., 2004; Wiltshire et al., 2024). Classic work demonstrated these principles in physical systems, such as arrays of mechanically coupled metronomes that spontaneously synchronize or the coordination of fin movements in swimming fish (Amazeen, 2018; Amazeen et al., 1995; von Holst, 1937). Subsequent research extended these ideas to human motor coordination, showing how interpersonal movement patterns exhibit lawful tendencies toward synchronization and phase-locking (Amazeen, 2002; Amazeen et al., 1998; Haken et al., 1985; Kelso, 1995; Zanone & Kelso, 1992, 1997).
More recently, coordination dynamics-based approaches have been generalized beyond dyadic interactions to capture coordination patterns among multiple human team members (Frank & Richardson, 2010) and, increasingly, among human and technological agents in human–autonomy teams (McNeese et al., 2018). In these settings, interaction measures have been developed across a variety of interaction dimensions, including communication (Gorman et al., 2012, 2019; Grimm et al., 2023), geospatial positioning and movements (Frank & Richardson, 2010; Nalepka et al., 2019; Peel, Landfair, Johnson, et al., 2025; Sheehan et al., 2023), postural positioning and body movement (Amon et al., 2019; Strang et al., 2014; Wiltshire et al., 2019), and physiological synchrony (Braun et al., 2024; Landfair et al., 2025). These works suggest that “team interaction measures” can serve as an umbrella term for a broad, evolving set of metrics that quantify how teammates’ behaviors co-vary and constrain one another over time. The construct is therefore intentionally flexible and still developing, as new team contexts and sensing modalities motivate additional indicators.
Operationally, a team interaction measure is defined over all interacting agents of interest such that each agent’s behavior can influence the value of the measure at each point in time. For example, in a three-person team, independent counts of how often each individual speaks would not qualify as an interaction measure, whereas a time-series index of speaking order or turn-taking would. Similarly, trajectories describing each team member’s position are not, by themselves, interaction measures unless they are transformed into metrics that reflect relative positioning, movement synchronization, or shared use of regions. In this way, interaction measures are time series data that emphasize relational structure among teammates rather than isolated individual activity.
The selection of appropriate interaction measures is inherently task dependent and should be grounded in a systematic task analysis such as Team Cognitive Task Analysis (Klein, 2000). Through such analyses, researchers identify the cognitive and behavioral demands of the team’s work, the roles and interdependencies among members, and the domains of interaction most critical to performance (e.g., communication, spatial coordination, or joint attention). On this basis, they select three or more time-varying interaction data streams (i.e., continuously collected time series signals) that either span distinct dimensions of team interaction (e.g., communication flow, geospatial coordination, physiological synchrony; Peel, Landfair, Renwick, et al., 2025) or represent differentiated signals within a single dimension (e.g., multiple communication variables). This preprocessing step yields a set of synchronized streams that jointly reflect how the team’s interaction unfolds and enables subsequent construction of CSA state space representations.
Data Stream Anomaly: Detection of Anomalies Within Each Stream
Each stream is analyzed independently using a sliding z-score transformation that is used to identify statistically significant deviations from local behavioral norms. For each time point, Visualization of Collective Anomaly Identification.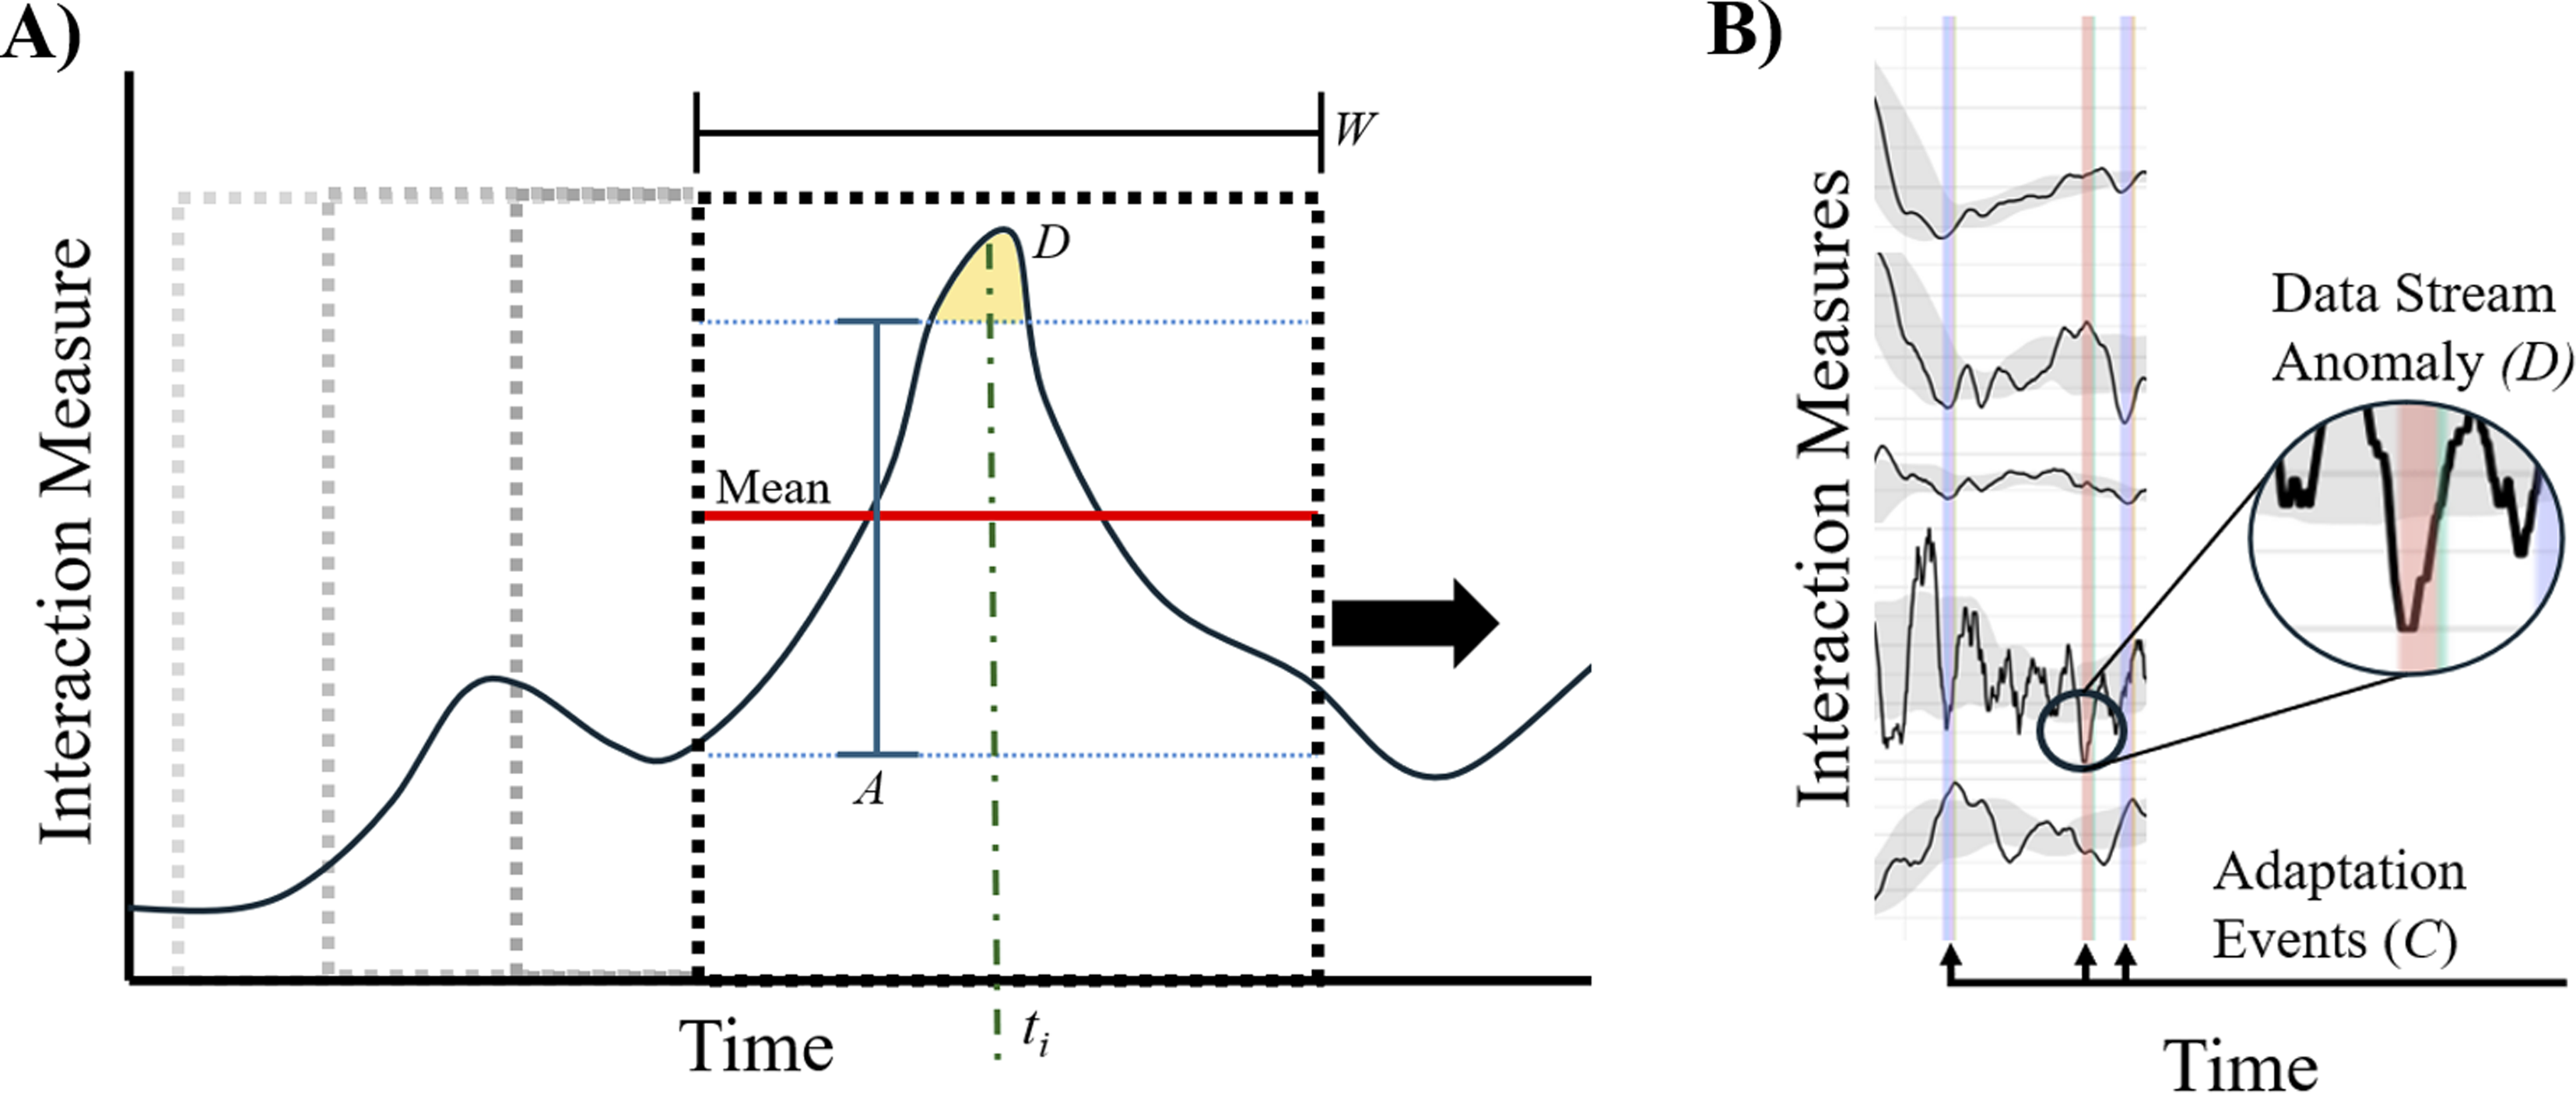
Collective Adaptation: Identification of Cross-Stream Coordination
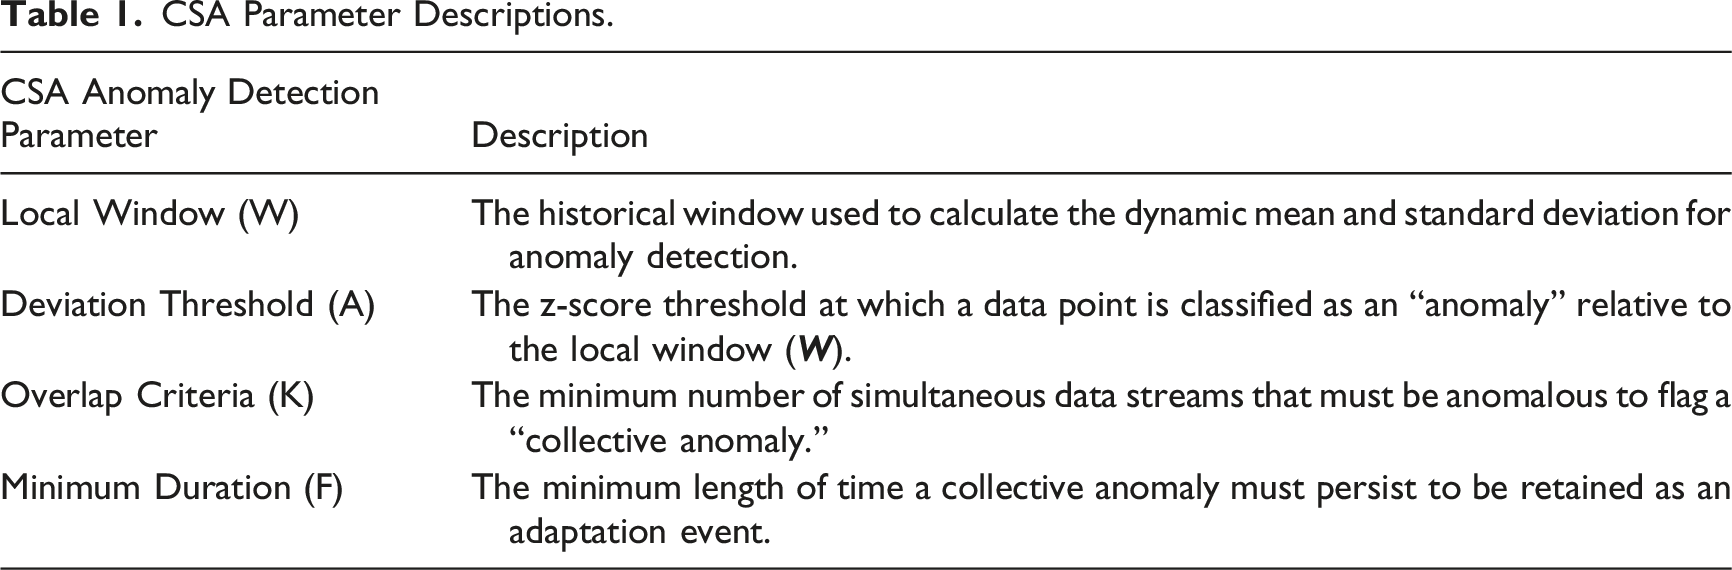
CSA Parameter Descriptions.
Measures of CSA
Several measures of adaptation events are produced by CSA. These measures can include both event-level characteristics of individual adaptation episodes and aggregated summaries across predefined observation windows. At the event level, the primary measure of co-occurrence is the area under the curve (AUC). Area Under the Curve quantifies the overall strength of a multi-signal adaptation event by summing the standardized values of all active signals at each time point during the event minus the observed
Collective Systems Adaptation analysis also supports aggregation of these measures over predefined time windows, enabling analyses of adaptation across larger task segments. For example, the Average AUC summarizes the typical strength of adaptation events across an epoch, the Total AUC represents the cumulative adaptive activity during that window, and the Event Count provides a simple index of adaptation frequency. These period-level metrics can be used to create “adaptation profiles” that characterize how frequently and extensively teams reorganize over time, offering insight into both the adaptive capacity of the team and the demands imposed by the environment. By characterizing these profiles, researchers may relate them to certain outcomes, helping them understand which adaptation patterns are maladaptive and which are beneficial. Figure 2 highlights how different AUC measures capture different aspects of team adaptation behavior. For instance, higher Average AUC reflects larger individual adaptation events, but, unlike Total AUC, it does not imply greater overall amounts of deviation across the task segments (e.g., Figure 2b compared to Figure 2c). Visualization of Total Versus Average Area Under the Curve.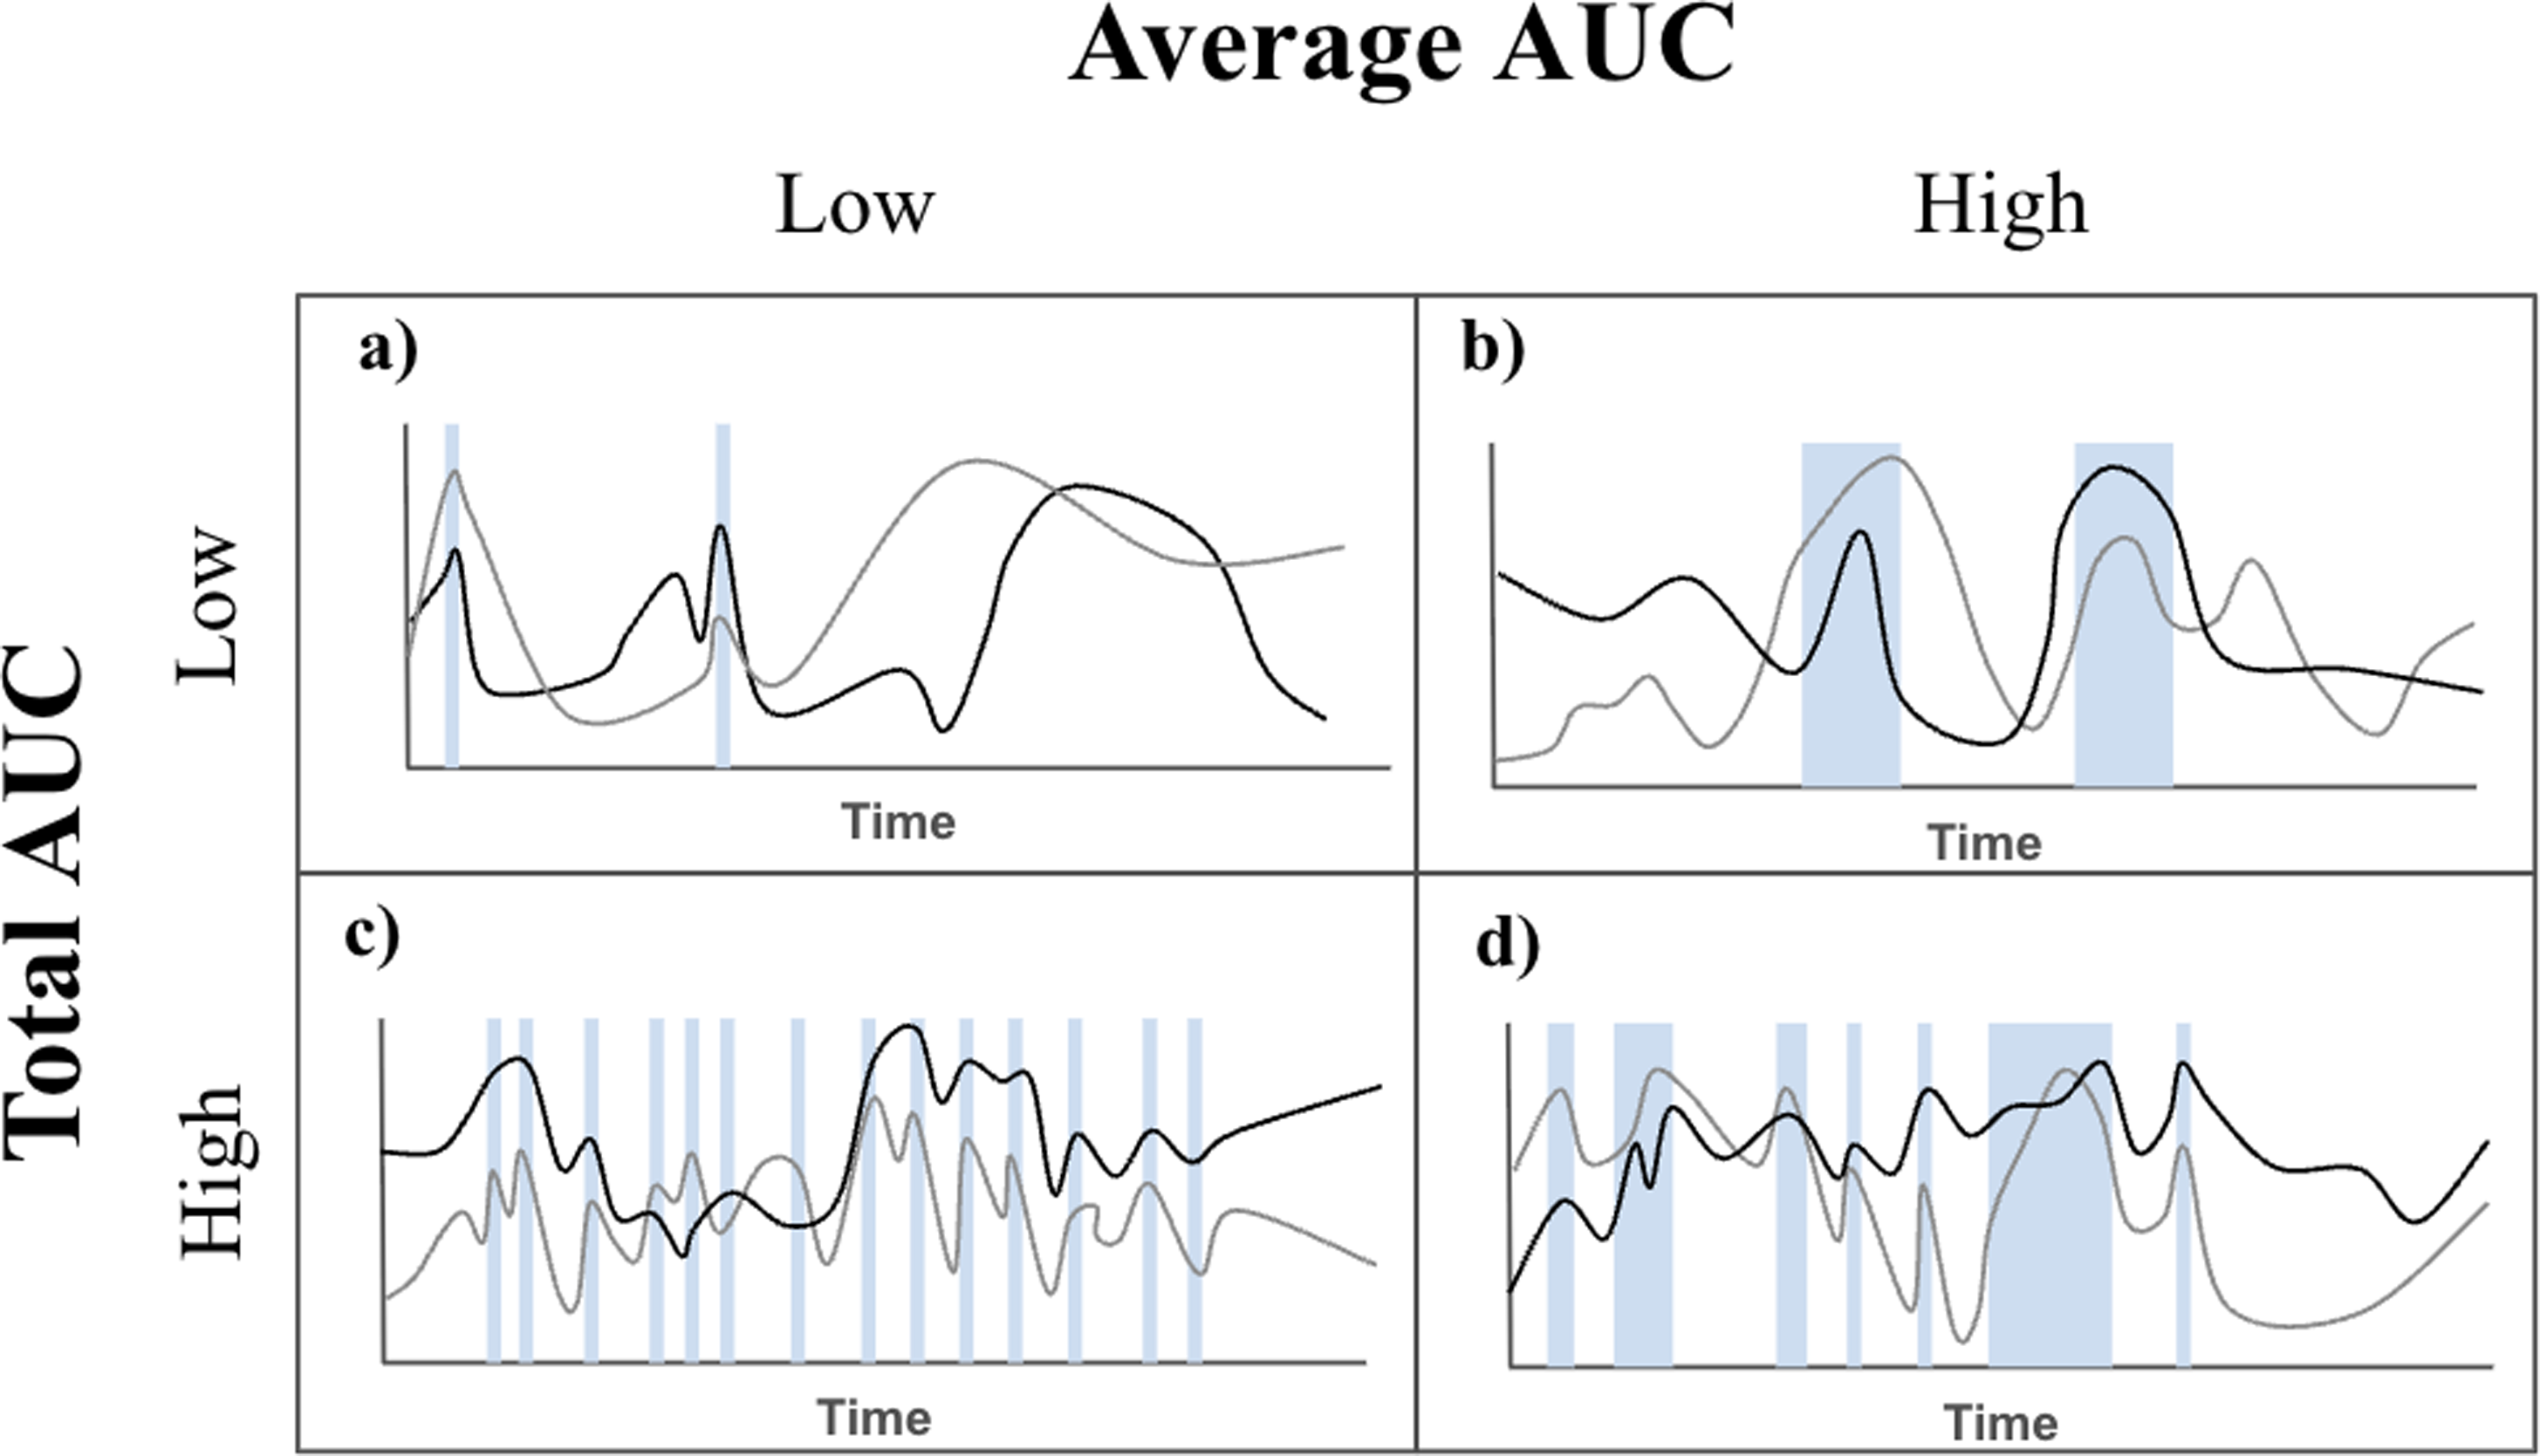
Measuring Communication
In this study, we aim to develop bottom-up measures of team adaptation to better understand its relationship with effectiveness. Combat teams, such as mounted infantry platoons, provide an ideal context for studying team behaviors due to their hierarchical structure, high operational tempo, and exposure to rapidly evolving, high-stakes environments. These teams operate across nested levels, such as individuals, sections, and platoons, and must adapt continuously to shifting demands while maintaining coordinated performance. Their operations often unfold in technology-rich environments that generate continuous, multimodal data streams, making them especially well-suited for examining the temporal dynamics of team adaptation.
Among the available behavioral signals, communication is especially well-suited to capture adaptation in real time (Cooke et al., 2017; Demir et al., 2021; Gorman, Amazeen, & Shope, 2012; Grimm et al., 2023). Communication serves not only as information transmission, but as a core mechanism of team cognition. Measuring team communication adaptation dynamically is, therefore, valuable for understanding how action teams think and adapt collectively under changing conditions.
Communication measurement encompasses a broad spectrum of approaches, ranging from basic quantitative indicators (e.g., word counts, utterance rates, or speaking turns) to more complex representations of information flow, semantic content, or affective tone. Among the many approaches to measuring and analyzing communication data, methods can generally be classified along two continua (Johnson, 2023). The first continuum concerns how they handle time, where different analytic techniques provide static, sequential, or time-sensitive assessments. Static analyses do not preserve communication dynamics over time; rather, they characterize communication behaviors within a span or “epoch” of time (such as a single trial or time period) and provide a summary measure or value (Abney et al., 2025). Conversely, sequential and time-sensitive analyses both preserve information about temporal dynamics to different degrees.
The second continuum concerns whether communication analysis techniques characterize content, flow, or a combination of both (Cooke & Gorman, 2009). Communication content refers to the semantics or meaning of information transmissions. Content-based analysis is often executed with manual coding strategies (e.g., Strang et al., 2014), which can be relatively labor-intensive, although automated methods are advancing (Tolston et al., 2019). Communication flow refers to how information moves throughout the team, for instance, by characterizing who talks to whom. For a more comprehensive overview of communication analysis methods and their applications in team research, see Cooke and Gorman (2009).
Current Study
The present study focuses on demonstrating CSA by examining adaptation across different aspects of communication flow derived from two U.S. Army tank platoons conducting simulated operations in a high-fidelity combat environment. Importantly, we treat communication not as a unidimensional construct, but as a composite of various signals, each of which contain unique information about changes in team states. The time series measures of communication flow in this study can be thought of as containing information about the temporal dynamics (stability and predictability derived via RQA) and structural dynamics (intensity and centralization) of the team’s communication.
Our goal of the current analysis is to demonstrate the relevance of communication flow dynamics for understanding team performance and to illustrate how CSA metrics can provide additional insights into adaptive team processes and underlying cognitive mechanisms. Accordingly, our research questions for this investigation are:
Research Questions
1. Exploratory Communication Dynamics Hypothesis: Different measures of communication dynamics will exhibit unique relationships with specific dimensions of team performance.
1. Adaptation Quality Hypothesis: Larger, more focused adaptation events (higher Average AUC) will correlate with better tactical outcomes, such as greater precision (e.g., Figure 2b).
2. Adaptation Instability Hypothesis: Greater cumulative adaptation (higher Total AUC) may reflect instability or inefficiency (e.g., Figure 2c).
Methods
Participants
Two 14 person teams (N = 28) composed of Active-Duty Soldiers were recruited from U.S. Army Forces Command (Age: Group 1, M = 23.8; Group 2, M = 25.7). Recruitment targeted intact units with relevant mounted armor experience to ensure cohesive teams with appropriate training (Years Experience: Group 1, M = 3.81, Min = 1, Max = 15: Group 2, M = 6.19, Min = 1, Max = 20). All participants had normal hearing and normal or corrected-to-normal vision to support effective communication and interface use. Individuals were excluded if they had physical conditions preventing prolonged seating in the simulation chair or if they were susceptible to simulation sickness.
Testbed
A high-fidelity combat simulation was developed by the Army Research Laboratory (ARL), as part of the Information For Mixed Squads (INFORMS) project, using the Unreal Engine to emulate scenarios representative of future military operations (Krausman et al., 2025). The simulation environment spanned a 5 km
Team Structure and Roles
Each platoon was divided into two subteams—also called sections—consisting of a section leader and three vehicle crews, with each vehicle crew composed of a driver and a gunner (see Figure 3). Crew members were assigned roles—Section Leader, Gunner, or Driver—based on their military background. Section Leaders managed their section’s vehicles and personnel, oversaw the auxiliary weapon subsystem, coordinated across sections, and communicated with higher command. Gunners operated the primary weapon system and its autonomous functions, while Drivers controlled the mobility subsystem. All crew members were also expected to operate non-default subsystems as needed, coordinate with the other section (Figure 3), and provide contact reports during missions. A confederate acting as a higher-echelon commander was included in each team to simulate realistic command interactions, increase task demands, and ensure doctrinal consistency. Commander responsibilities included requesting reports, issuing orders, correcting major deviations, participating in mission planning, and supporting tactical engagement through coordination of indirect fire. Communication was structured across five network channels, supporting coordination within and across vehicles, sections, and the full platoon. The Commander and Principal Investigator (PI) had access to all channels. Team Structure.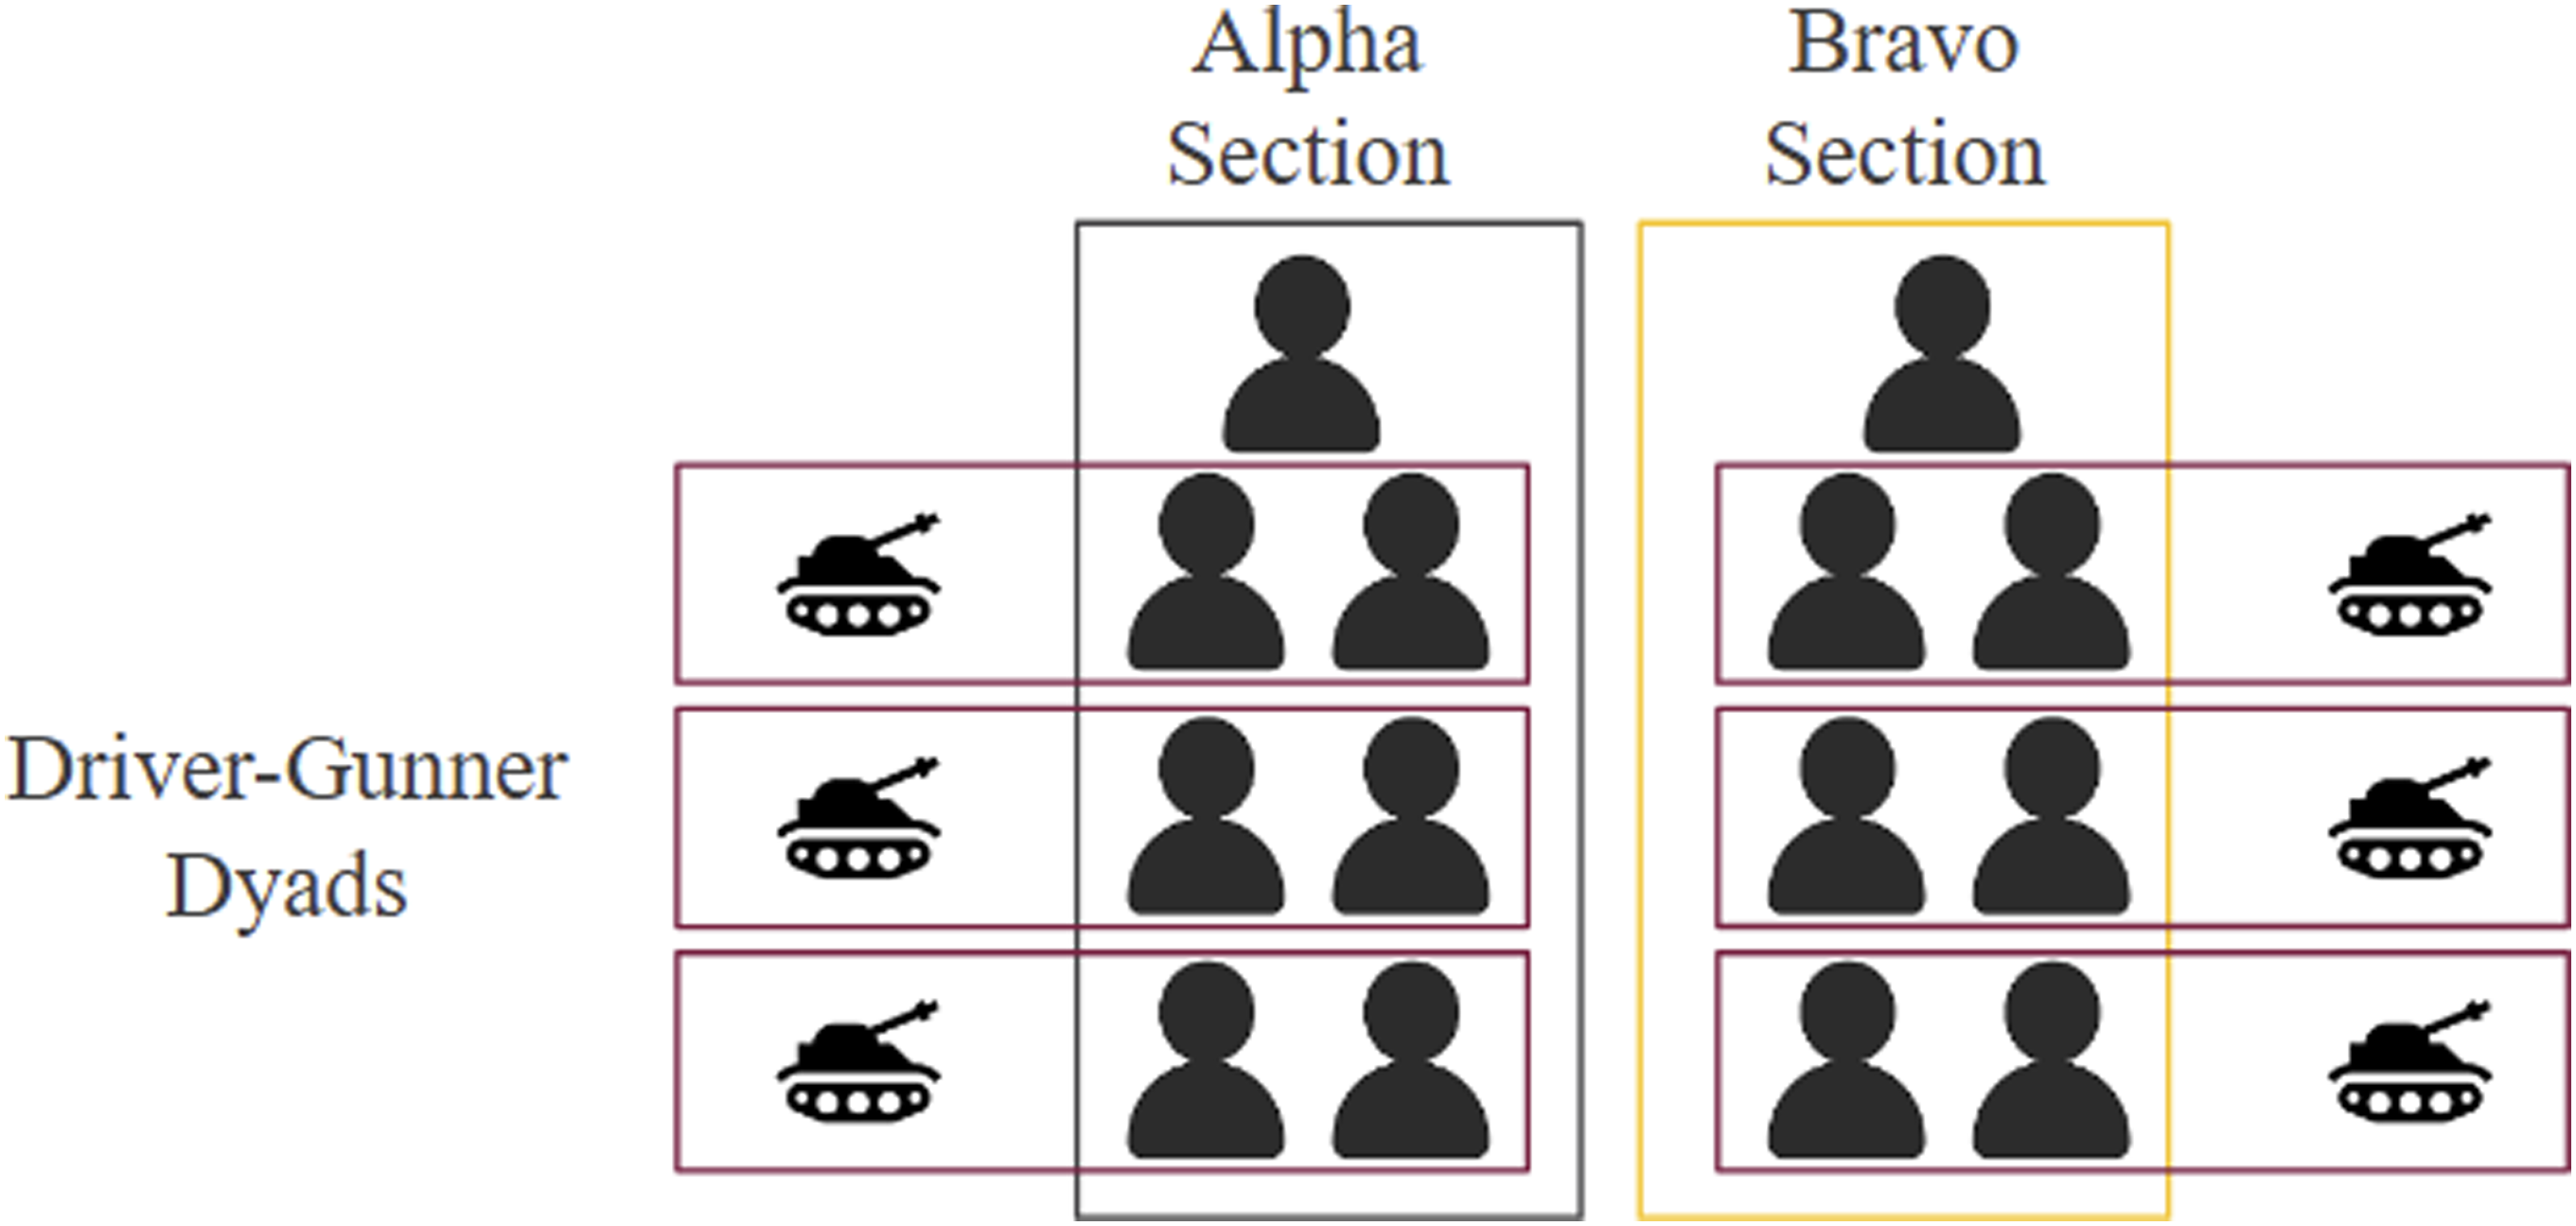
Training
Before beginning the experimental tasks, all participants received two 90-minute standardized training sessions that included a briefing on the study context, followed by role and crew station assignments and a practice mission. They then completed hands-on instruction at their assigned stations, learning to operate vehicles, weapons, communication systems, and mission interfaces. The training covered essential system functions but left tactical application decisions to the participants. Both Soldiers and OPFOR received the same training, and prior pilot testing ensured comparable proficiency. Before the full missions, the Platoon completed a day of structured practice tasks across different terrain types, allowing participants to reinforce key skills and enabling the commander to rehearse supervisory and monitoring duties.
Experimental Mission Design and Team Tasks
Each 60–90-minute mission involved navigating mixed terrain (Figure 4) to a named objective, detecting and reporting objects and oppositional threats, coordinating within the platoon, and engaging enemy forces using a variety of vehicle systems, including primary weapons, auxiliary systems, and mobility controls. Crews maintained 360° situational awareness using indirect vision, navigated interfaces, and coordinated actions based on orders from section leaders. Prior to each mission, participants received a briefing that included partial intelligence on the oppositional force (see Figure 5), then engaged in a 15-minute planning session during which the platoon developed a strategy for engagement. Missions were composed of four phases that involved tasks like reconnaissance, ground advancement, objective capture, strong point defense, and enemy engagement. In this study, “phase” refers to predefined operational segments of the mission specified by the scenario design. Each phase introduced distinct oppositional force compositions and engagement scenarios controlled in real time by OPFOR confederates. Accordingly, phase-level analyses were used to index changes in task context and demands and to provide a common temporal frame for comparison within and across teams. ARL INFORMS Combat Simulation. Operation Planning Materials: Briefing Map.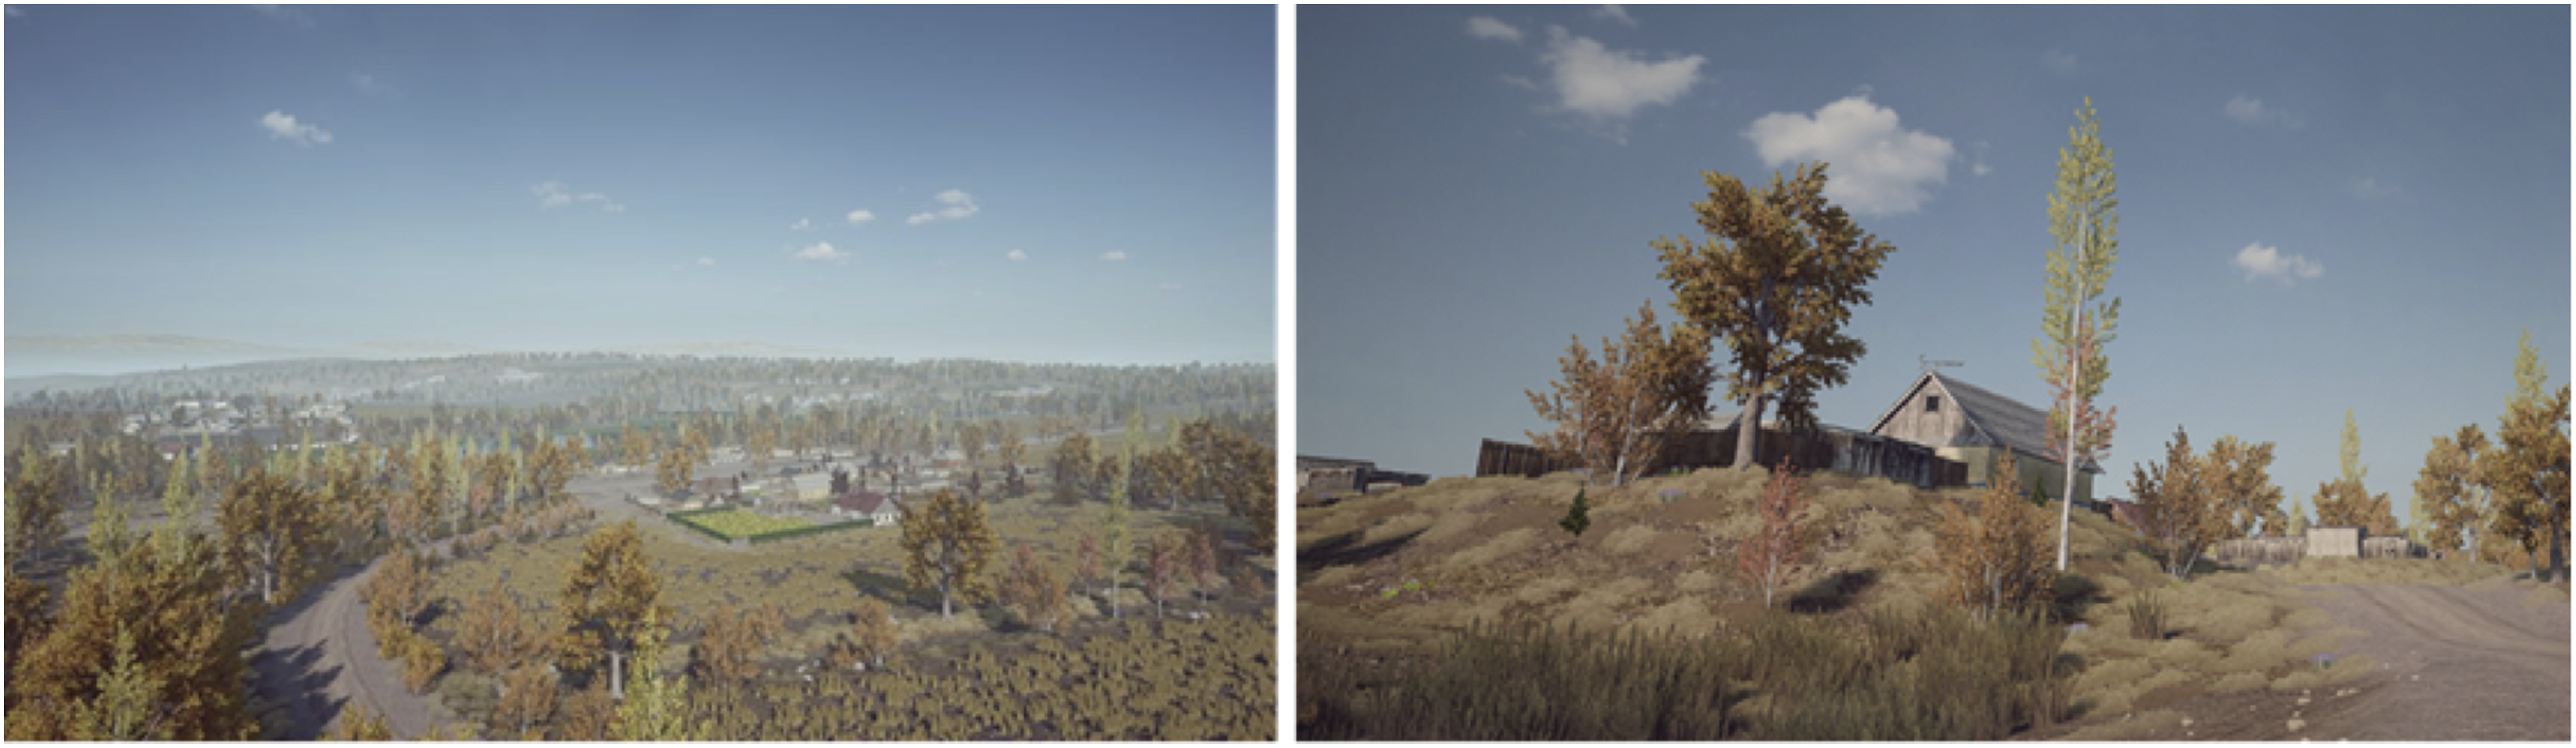
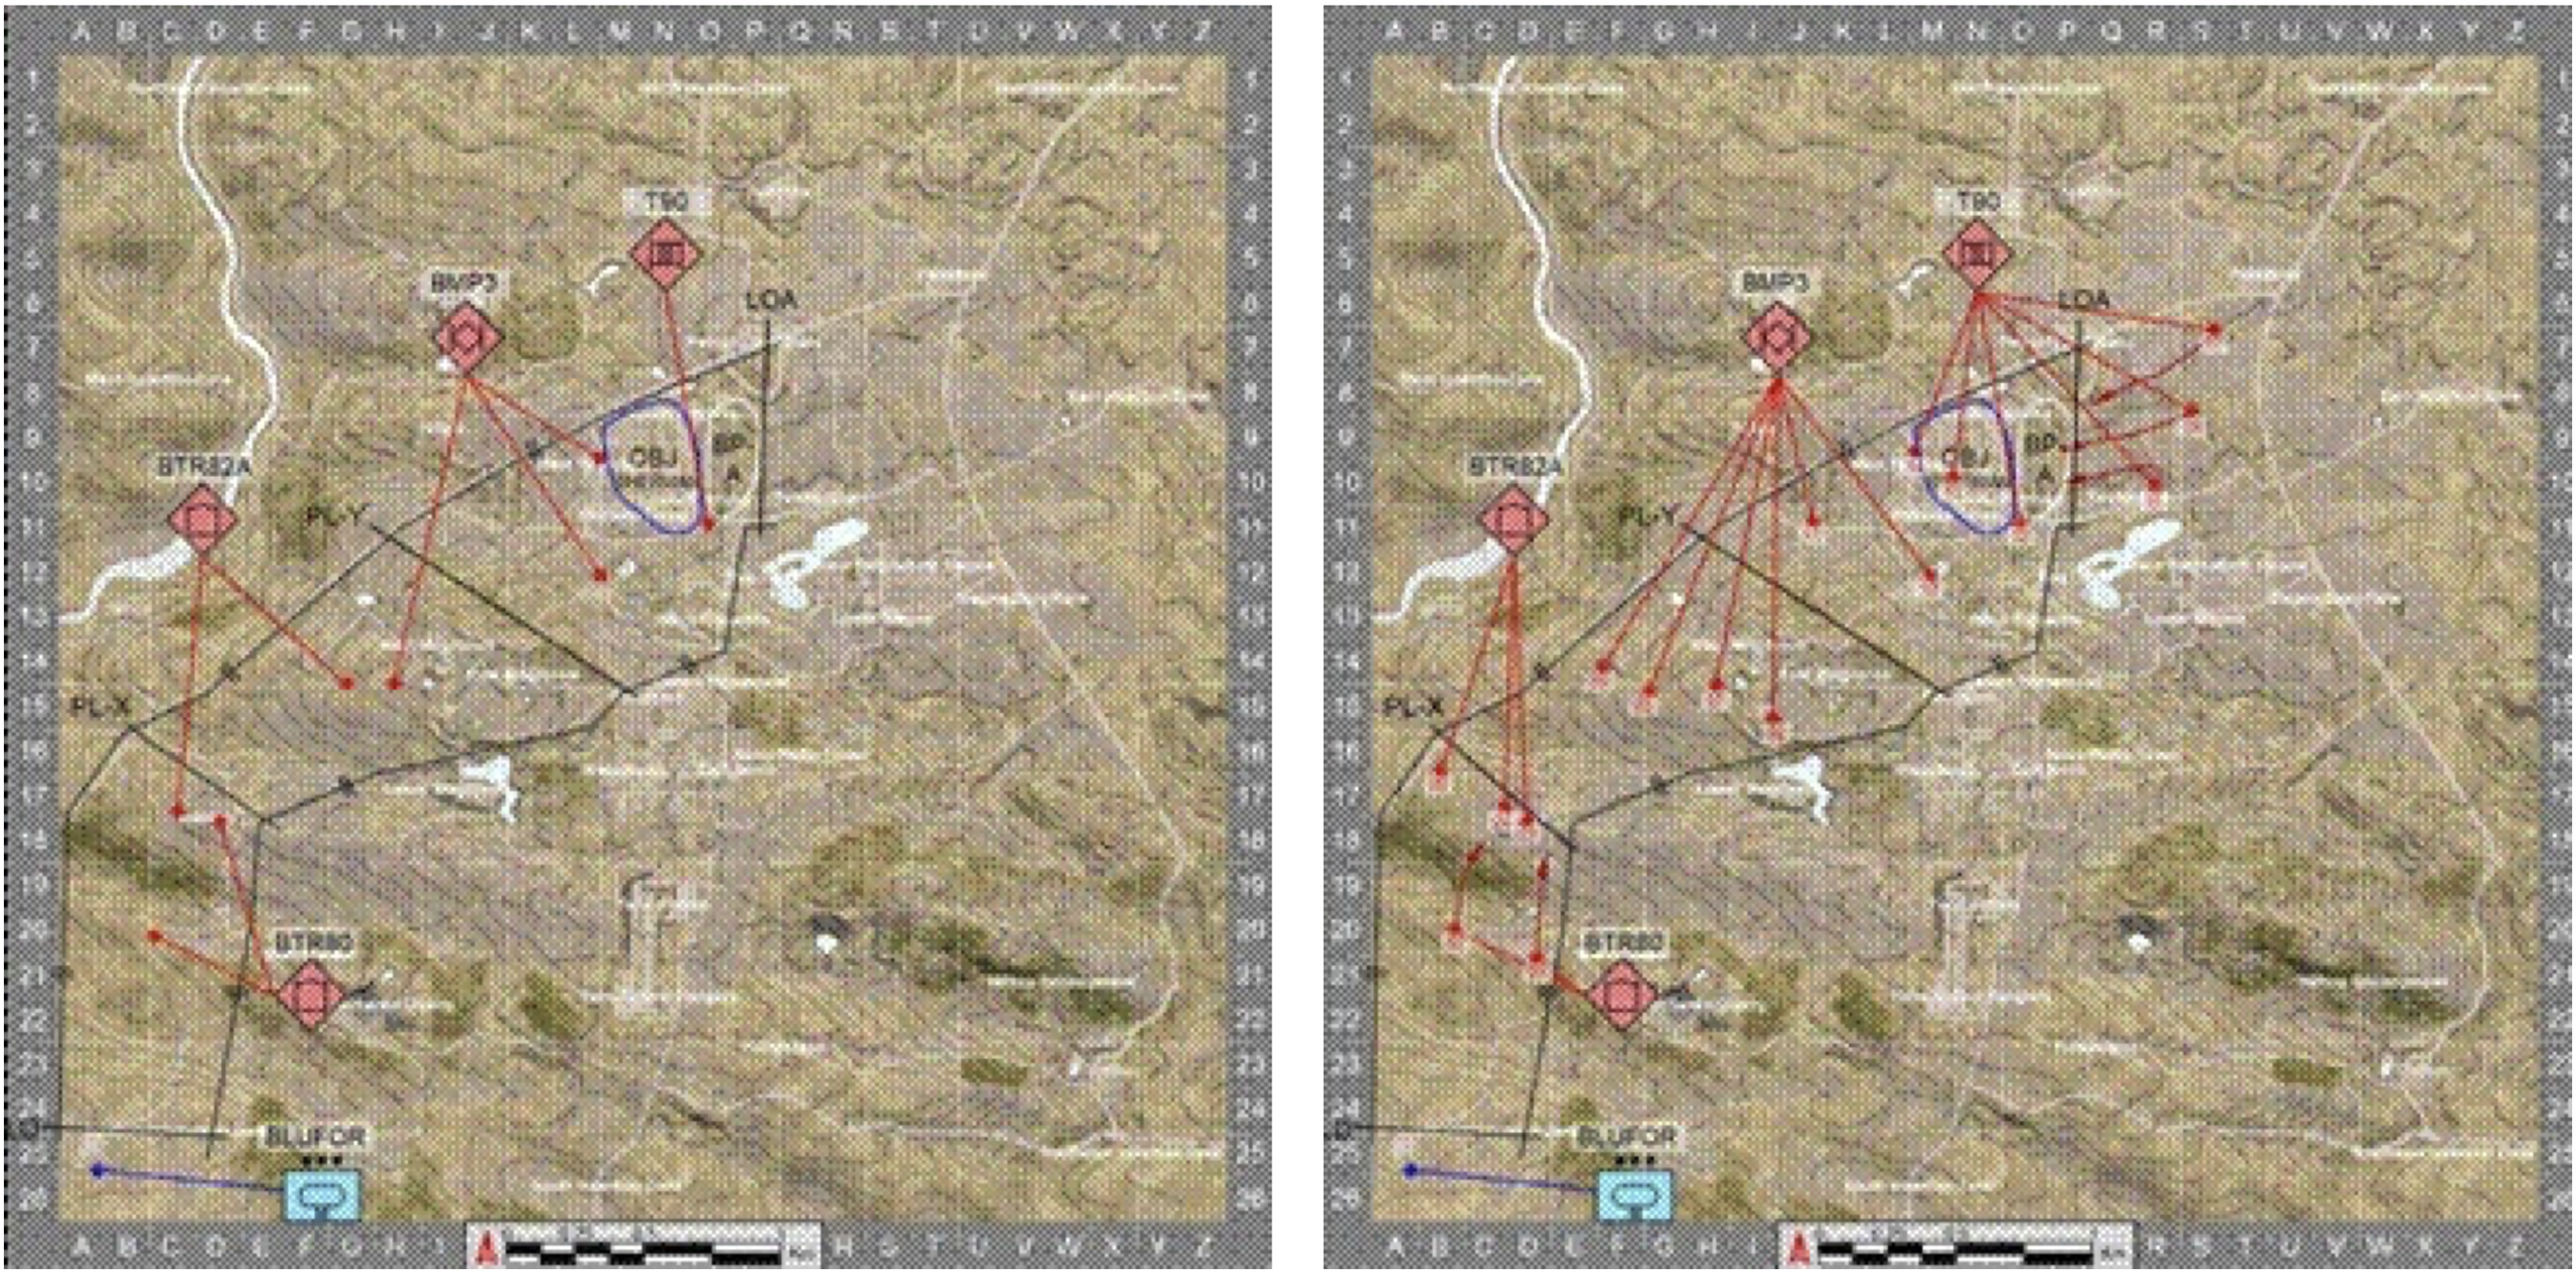
Oppositional forces (OPFOR) were composed of trained experimenters who acted as enemy forces throughout the missions. They operated a range of simulated vehicles with varying offensive and defensive capabilities, selected to match the desired challenge level for each mission phase. OPFOR behavior was allowed to fluctuate in real time, enabling dynamic responses to the platoon’s actions with the goal of maintaining a realistic challenge throughout missions.
Equipment
The testbed configuration contained 14 crew stations that supported the control of six simulated combat vehicles. Each crew station contained three touchscreen displays and other physical interface devices, such as an instrumented steering yoke and pedals (see Figure 6). The commander was seated at a separate desk behind the crew stations, with access to a desktop computer to view and manipulate a command interface, a communication system, and a tablet computer to annotate mission performance. The headsets used to deliver auditory stimuli and record speech were commercial off-the-shelf gaming headsets (JBL Quantum One) with built-in microphone booms. A local server running communication software allowed the crew to communicate with one another and with experimenters using the steering yoke buttons to select the appropriate channel. Speaker turn taking and duration was calculated based on the recorded yolk button presses for each crew station. Other measures, such as physiological (via Zephyr BioHarness 3.0) and eye tracking (via Tobii Pro Glasses 3), were also collected, but this paper is focused on measures of communication. Crew Station Layout.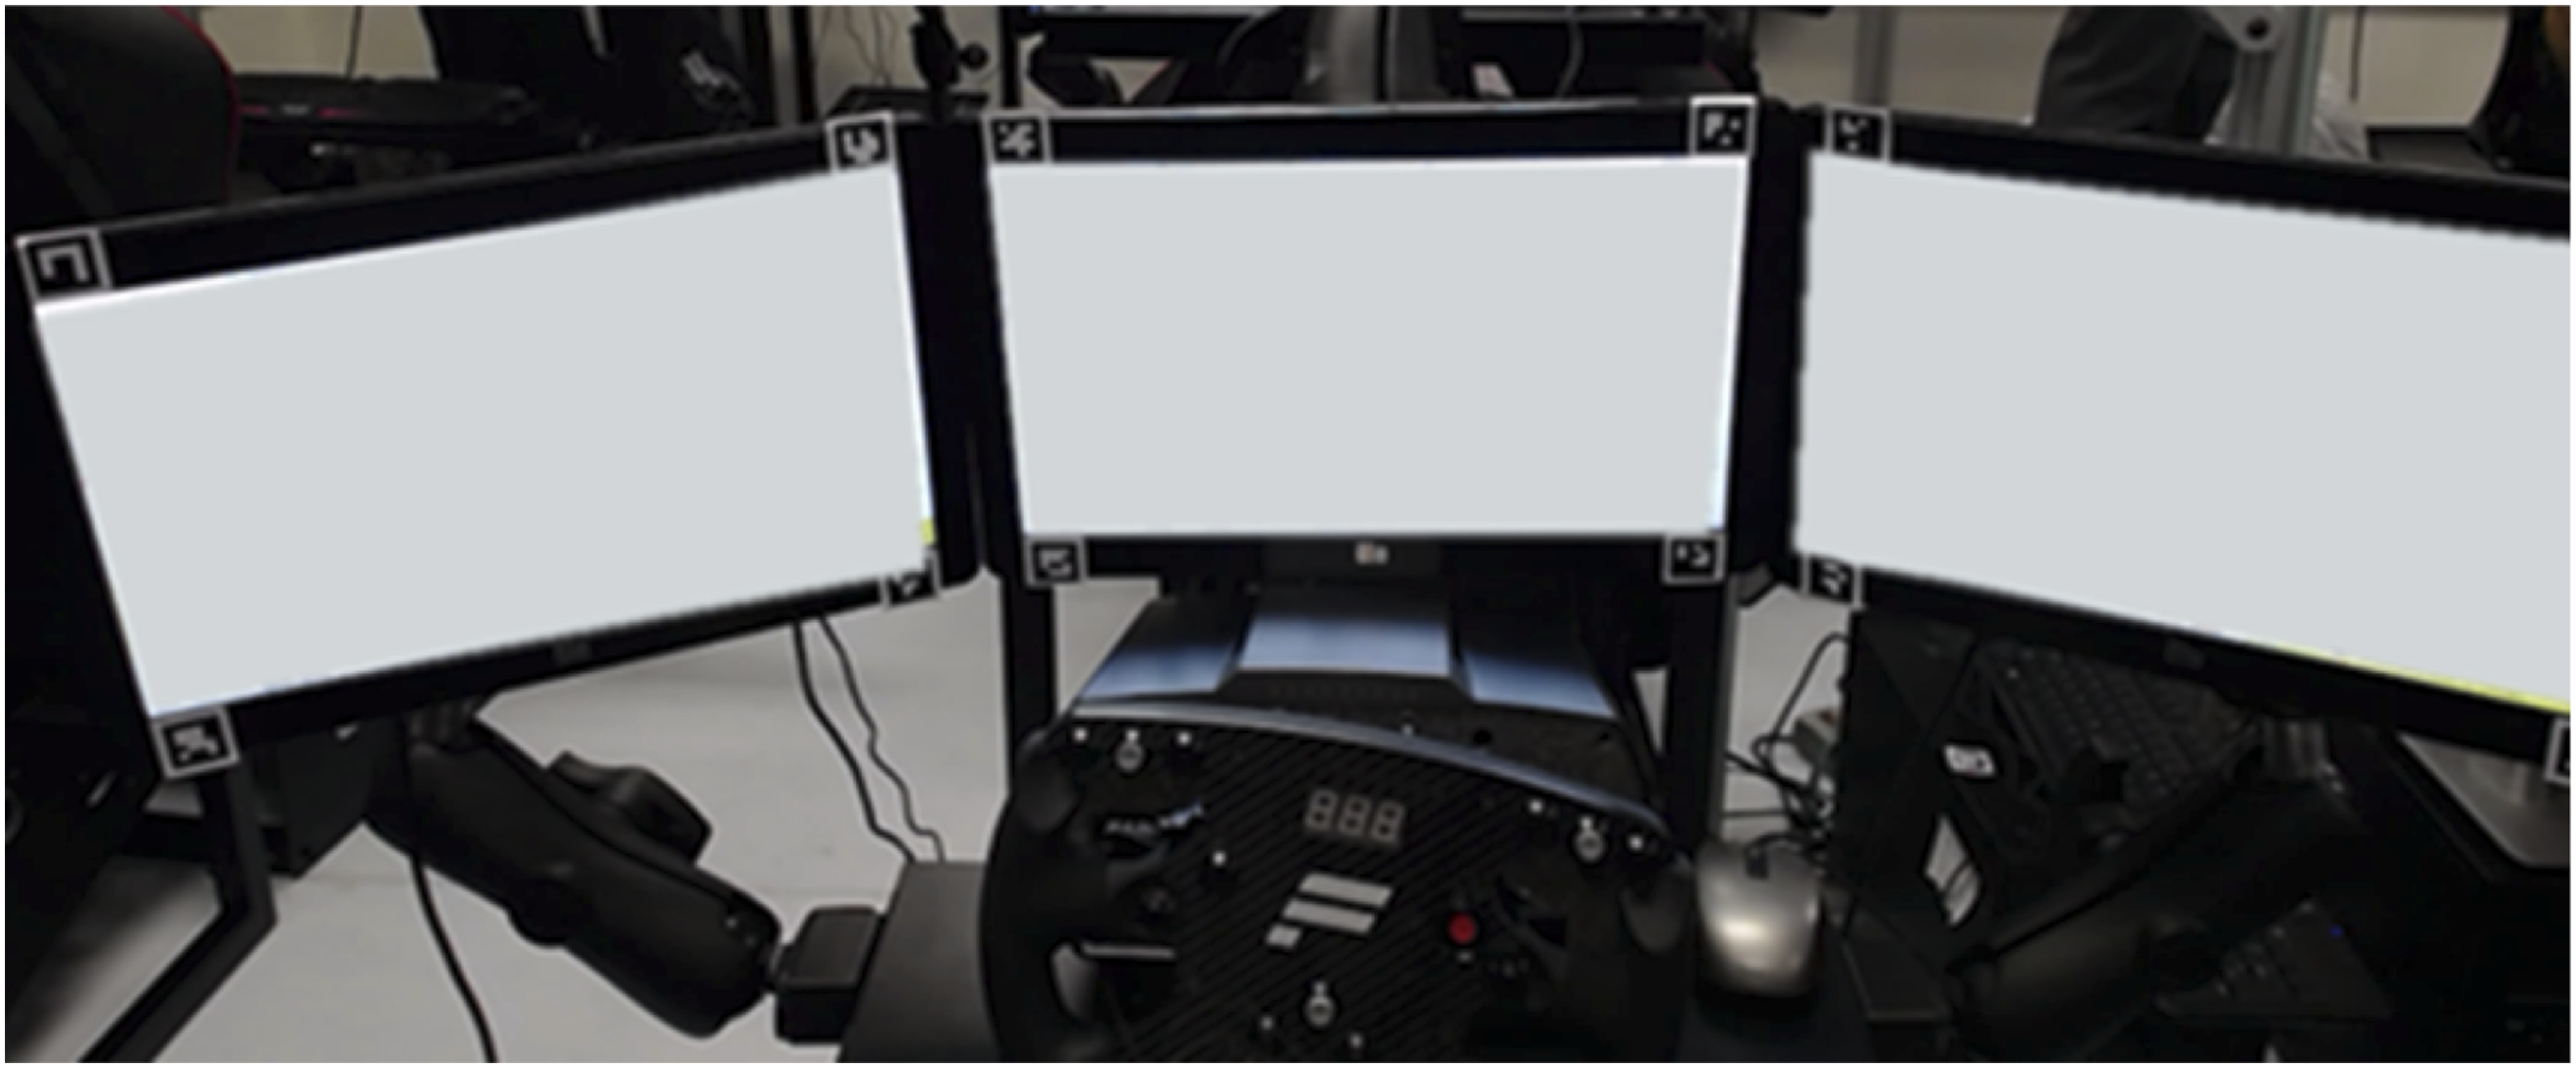
Measures
Several measures of team performance and team communication behavior were calculated to answer RQ1 and RQ2.
Team Performance Measures
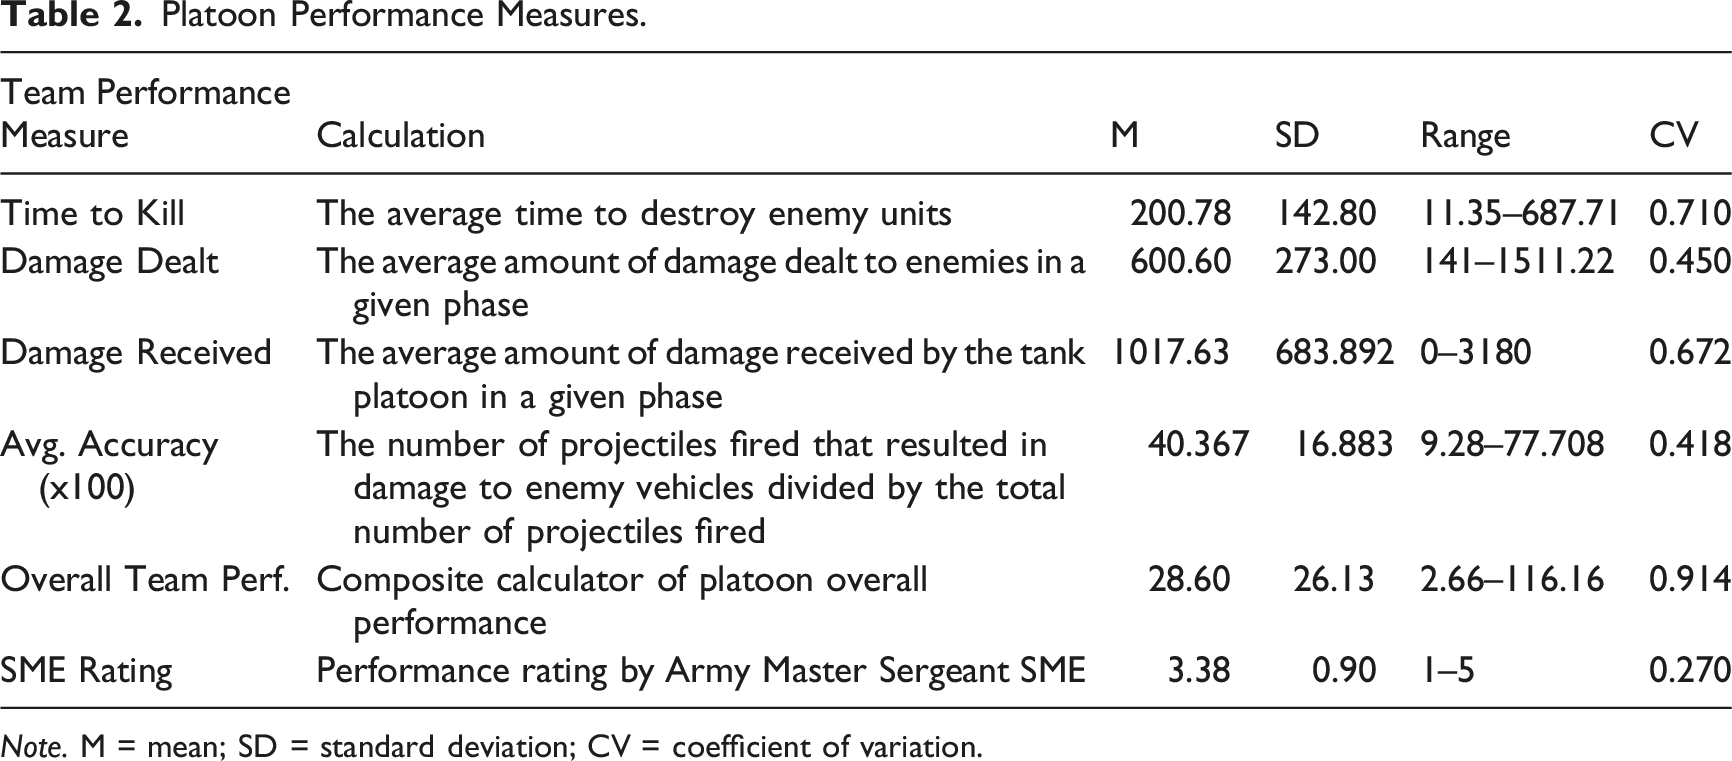
Each platoon’s performance was measured for each mission phase using four combat metrics. Time to Kill (TTK) measured the average time it took the platoon to destroy each enemy unit in a phase. The duration was calculated from the moment an enemy either damaged or was damaged by an ownship vehicle, to the point that they were completely disabled. Although enemy robustness and number varied by phase, TTK provided an effective measure of combat efficiency. Damage Dealt was calculated as the total amount of health points lost (damage) by enemy vehicles throughout a phase. Damage Dealt provided a measure of combat effectiveness and enemy vehicle robustness, as more robust vehicles had greater amounts of health points and required more hits to disable. Damage Received was calculated as the total amount of platoon health points lost as a result of enemy fire. Though oppositional forces were dynamic and capable combatants, Damage Received provided, to some degree, information about how well the platoon leveraged defensive tactics, such as cover and concealment, as well as situation awareness and reconnaissance capabilities. Average Accuracy was a ratio of the total number of munition fires across all weapons systems that hit OPFOR to the total number of fires. All ammunition was limited and required operators to engage enemy forces conservatively. Average Accuracy provides information about how well Gunner/Driver teams synchronized with one another to provide proper line of sight. It also provides an indication of how well the platoon coordinated with one another to provide support by fire or other tactical maneuvers like flanking.
In addition to the four primary combat metrics, an Overall Performance score was calculated using a composite equation (Equation (1)) that integrates offensive effectiveness, survivability, and engagement speed. To represent survivability, Damage Received was subtracted from a standardized maximum health value of 9800. This constant was selected to ensure that all values remained positive and comparable across mission phases, regardless of the severity of damage sustained. Offensive efficiency was computed by multiplying the total Damage Dealt by Accuracy (ratio), thereby weighting raw damage output by how precisely it was delivered. This formulation ensures that identical damage values yield different scores depending on firing accuracy, emphasizing precision over volume alone. The survivability and offensive components were then summed and divided by the average TTK, such that faster neutralization of enemy targets resulted in higher overall performance. In this formulation, longer TTKs penalize the score, reflecting slower operational effectiveness.
Equation 1:
Platoon Performance Measures.
Note. M = mean; SD = standard deviation; CV = coefficient of variation.
Correlations Among Combat Measures and Overall Performance.
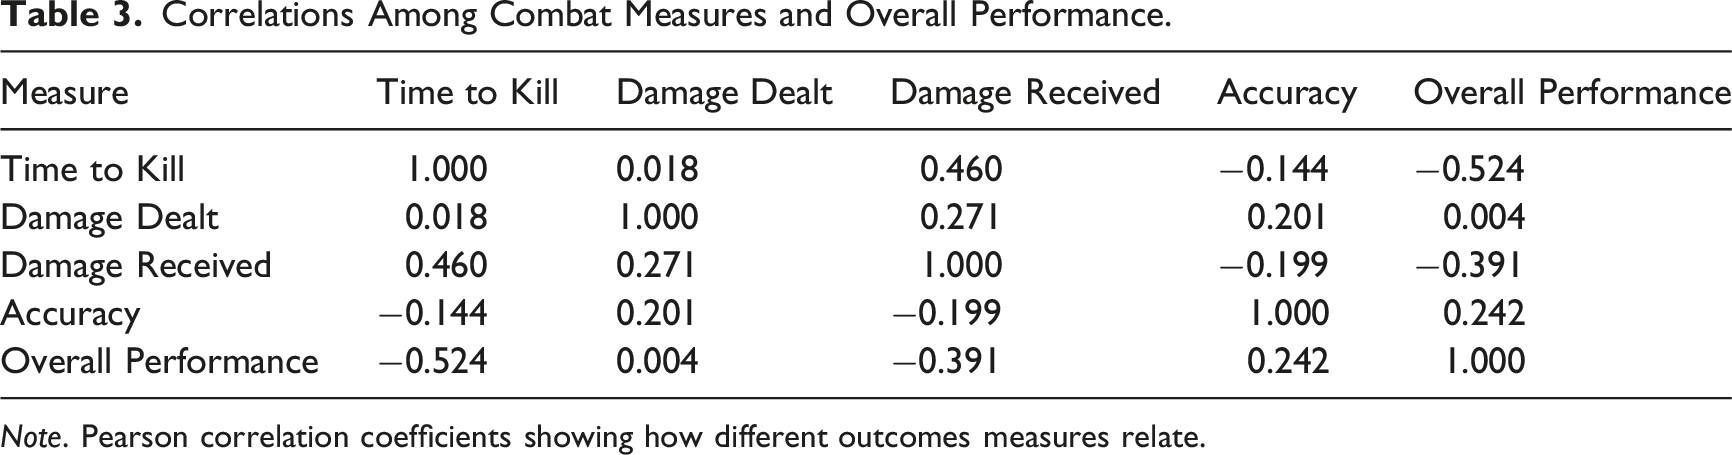
Note. Pearson correlation coefficients showing how different outcomes measures relate.
Team Interaction Measures
We selected communication flow as our focal team interaction measure because it provides a continuous record of how information is distributed, shared, and coordinated among teammates over time. We characterize measures of communication flow in this study as capturing two complementary aspects of team interaction: temporal dynamics and structural dynamics. Temporal dynamics refer to how stable, predictable, and complex the team’s communication patterns are over time, and were quantified using Recurrence Rate (RR), Determinism (DET), and Categorical Entropy (CatH) derived via Recurrence Quantification Analysis (RQA). Structural dynamics refer to how much and how broadly communication is distributed across the team, and were indexed using Intensity and Centralization, as investigated by Johnson (2023). Together, these two sets of measures characterize both how communication unfolds over time and how it is organized across team members.
To construct a common representation of communication for all measures, we first encoded team communication as a symbolic time series (Gorman et al., 2019; Grimm et al., 2023). For each mission, the team state at each second was represented as a 14-element binary vector indicating each member’s talking status (1 = talking, 0 = silent). For example, the state 10000000000000 denotes any moment when only the first team member is talking, while 11000000000000 denotes a moment when the first two team members are talking simultaneously. This categorical representation served as the shared basis for computing both the temporal (RQA-based) and structural (Intensity, Centralization) measures of communication.
Team Interaction Measures: Definitions, Calculations, and Descriptive Statistics.
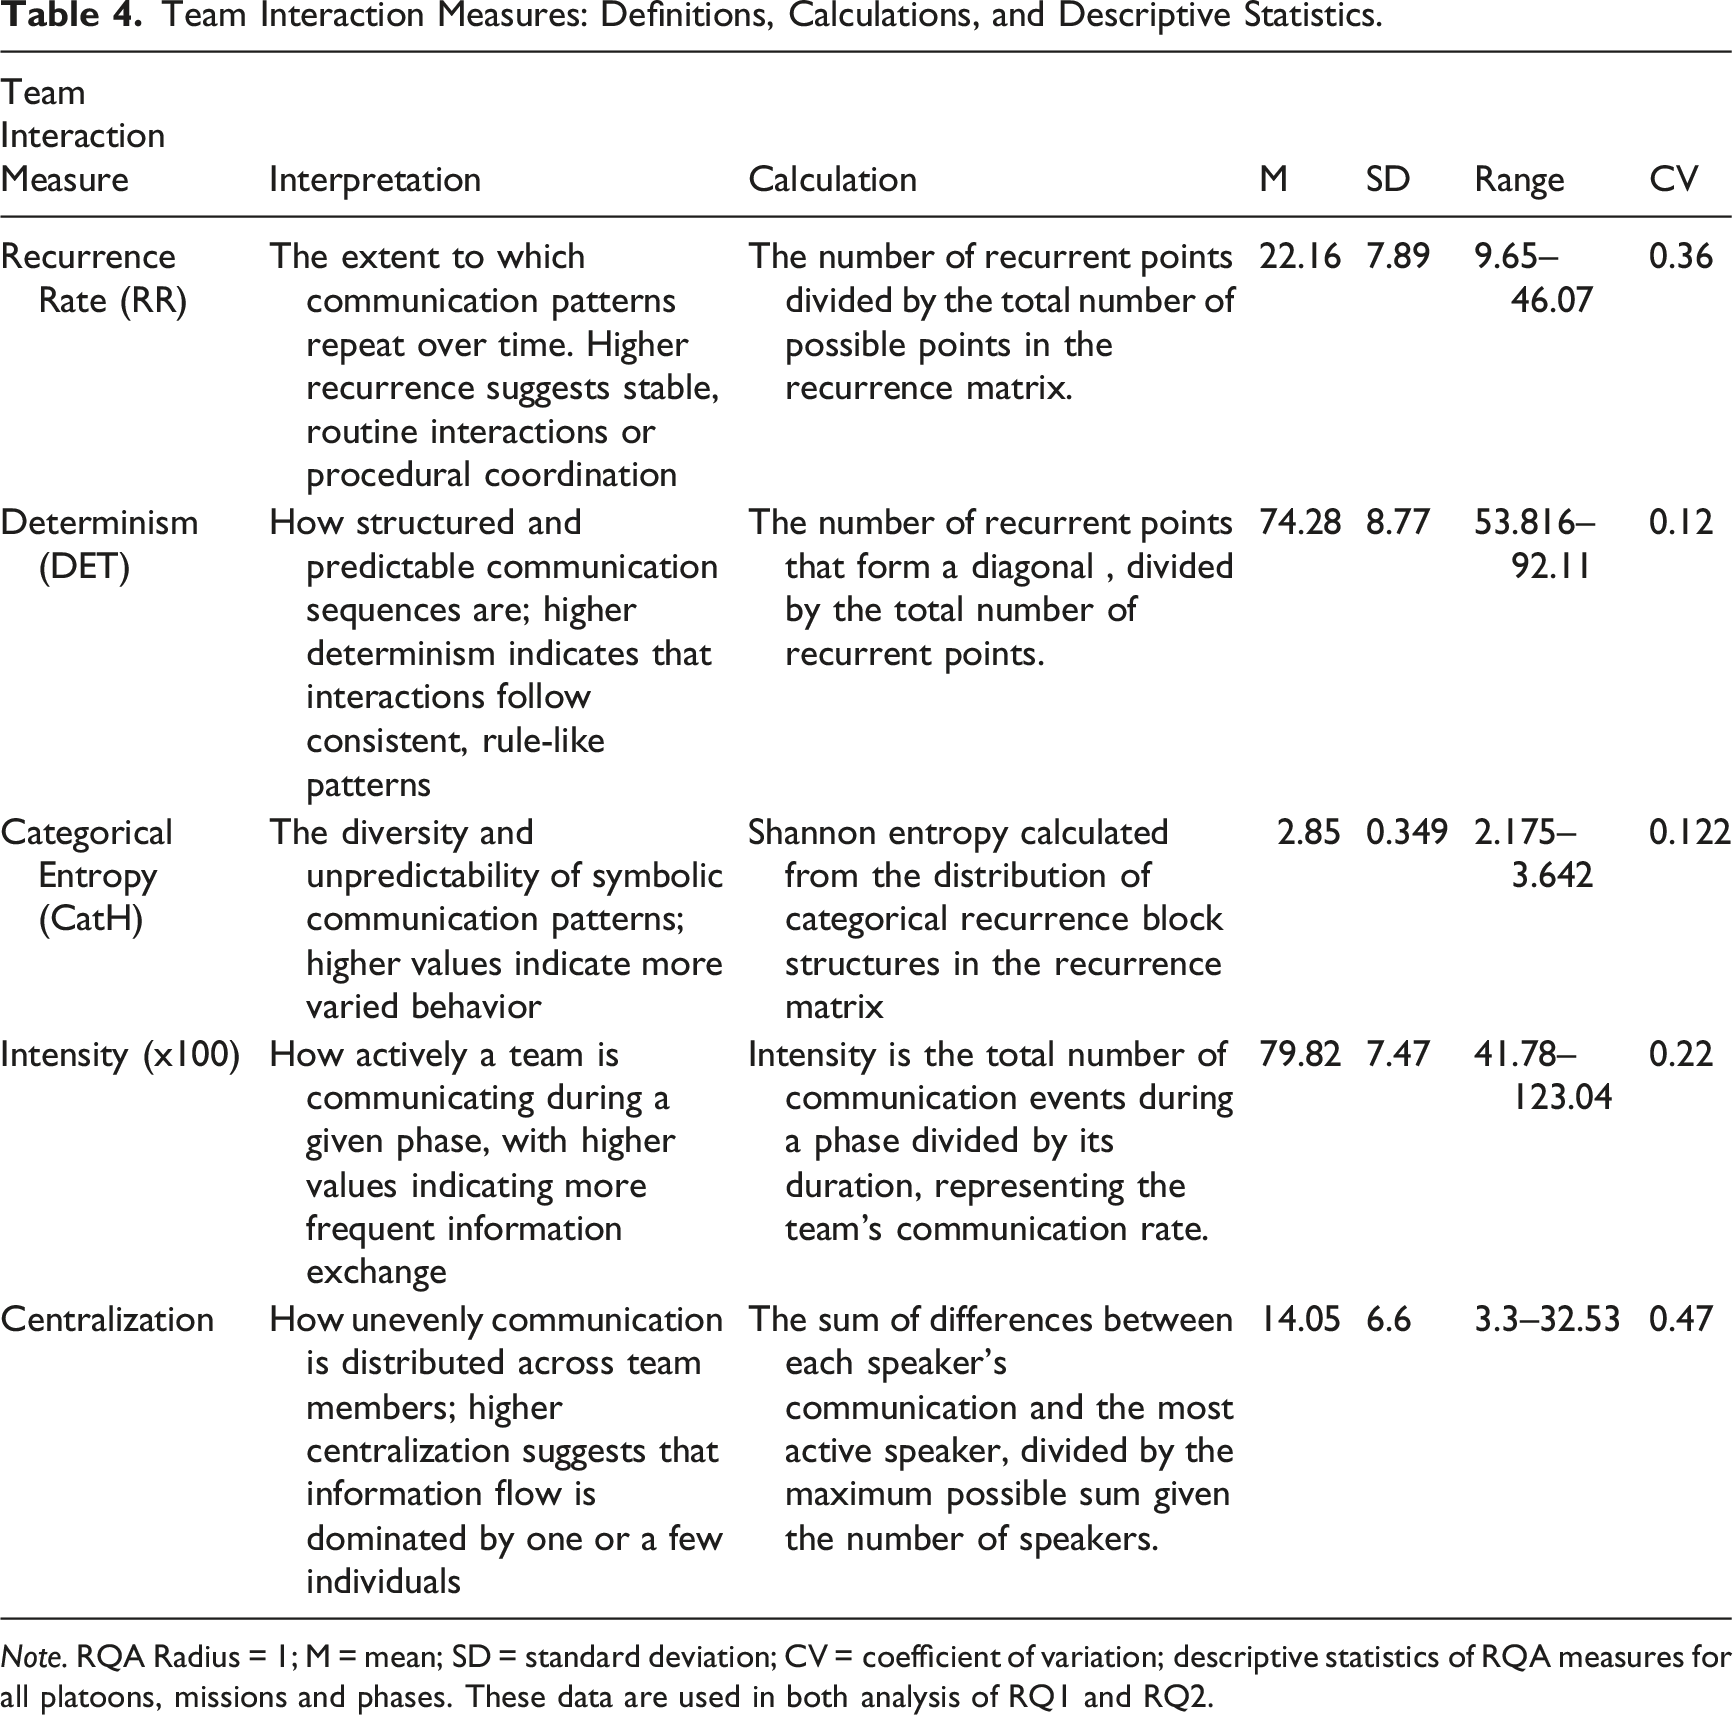
Note. RQA Radius = 1; M = mean; SD = standard deviation; CV = coefficient of variation; descriptive statistics of RQA measures for all platoons, missions and phases. These data are used in both analysis of RQ1 and RQ2.
We used additional interaction metrics to capture structural aspects of information flow. Intensity reflects the overall amount of communication over time and was operationalized as the team’s average time spent speaking per minute within a given analysis interval, expressed as a percentage. Centralization captures how unevenly communication is distributed across team members and was calculated as the coefficient of variation of individual communication quantities within the interval, defined as
For RQ1, we derived phase-level communication flow metrics across each mission phase, yielding a single value per measure (RR, DET, CatH, Intensity, Centralization). These epoch-based summaries are well suited for linking communication flow to trial-level outcomes but can obscure finer-grained temporal fluctuations in coordination. For RQ2, we derived time-series communication flow metrics using a sliding window approach, in which all five measures were computed within 120-second windows advanced by 1 second, producing synchronized time series for RR, DET, CatH, Intensity, and Centralization. This parameter selection follows precedent in the literature on communication dynamics. For instance, Gorman et al. (2020) successfully applied a 120-second window to model communication dynamics in simulated healthcare teams. Furthermore, methodological testing by Grimm et al. (2017) indicated that while RQA is generally robust across window sizes of 60–120 seconds, windows below 60 seconds reduced temporal precision and increased the likelihood of false positives. Consistent with Coco and Dale’s (2014) guidance that parameters must be tailored to the specific temporal characteristics of the data, the 120-second duration was selected to balance sensitivity to transient changes with the stability required to detect meaningful coordination patterns. In the following section, we use these sliding window communication flow data streams as inputs into CSA analysis to measure adaptation in communication flow.
Communication Adaptation Measures
Parameter Selection.
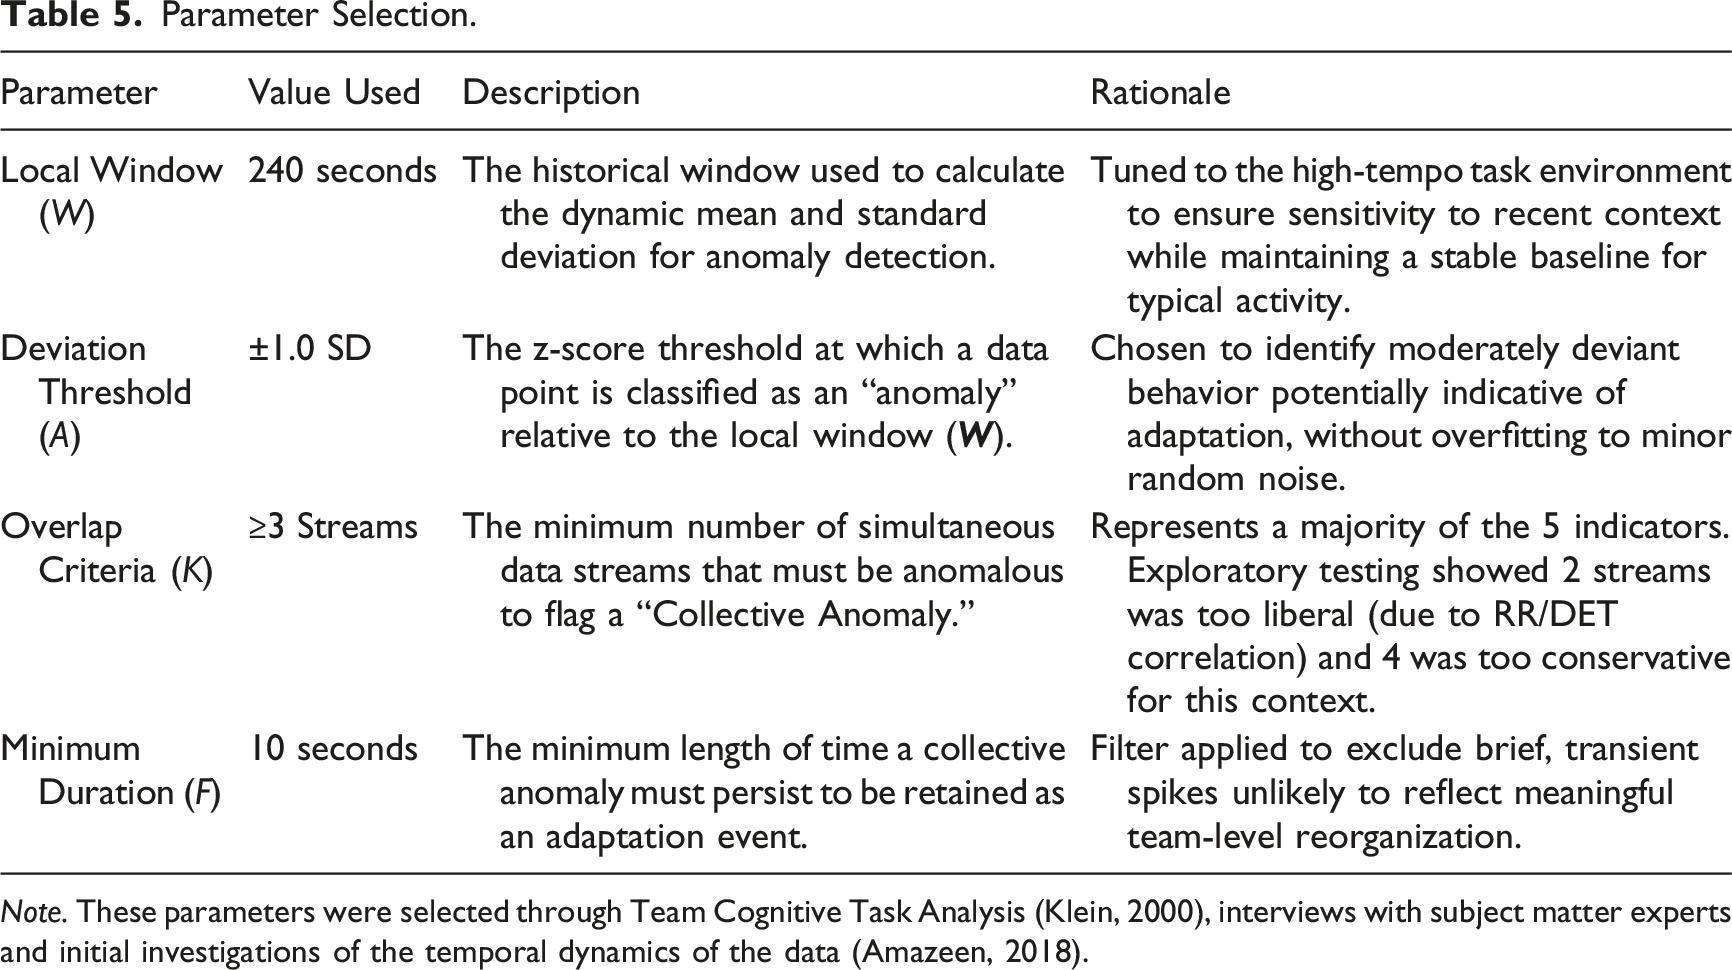
Note. These parameters were selected through Team Cognitive Task Analysis (Klein, 2000), interviews with subject matter experts and initial investigations of the temporal dynamics of the data (Amazeen, 2018).
Collective systems adaptation analysis was applied using a ±1 standard deviation threshold (
Parameter choices were informed by preliminary visual exploration of CSA plots for a single mission. We examined combinations of window sizes ( Collective Systems Adaptation Analysis Visualization.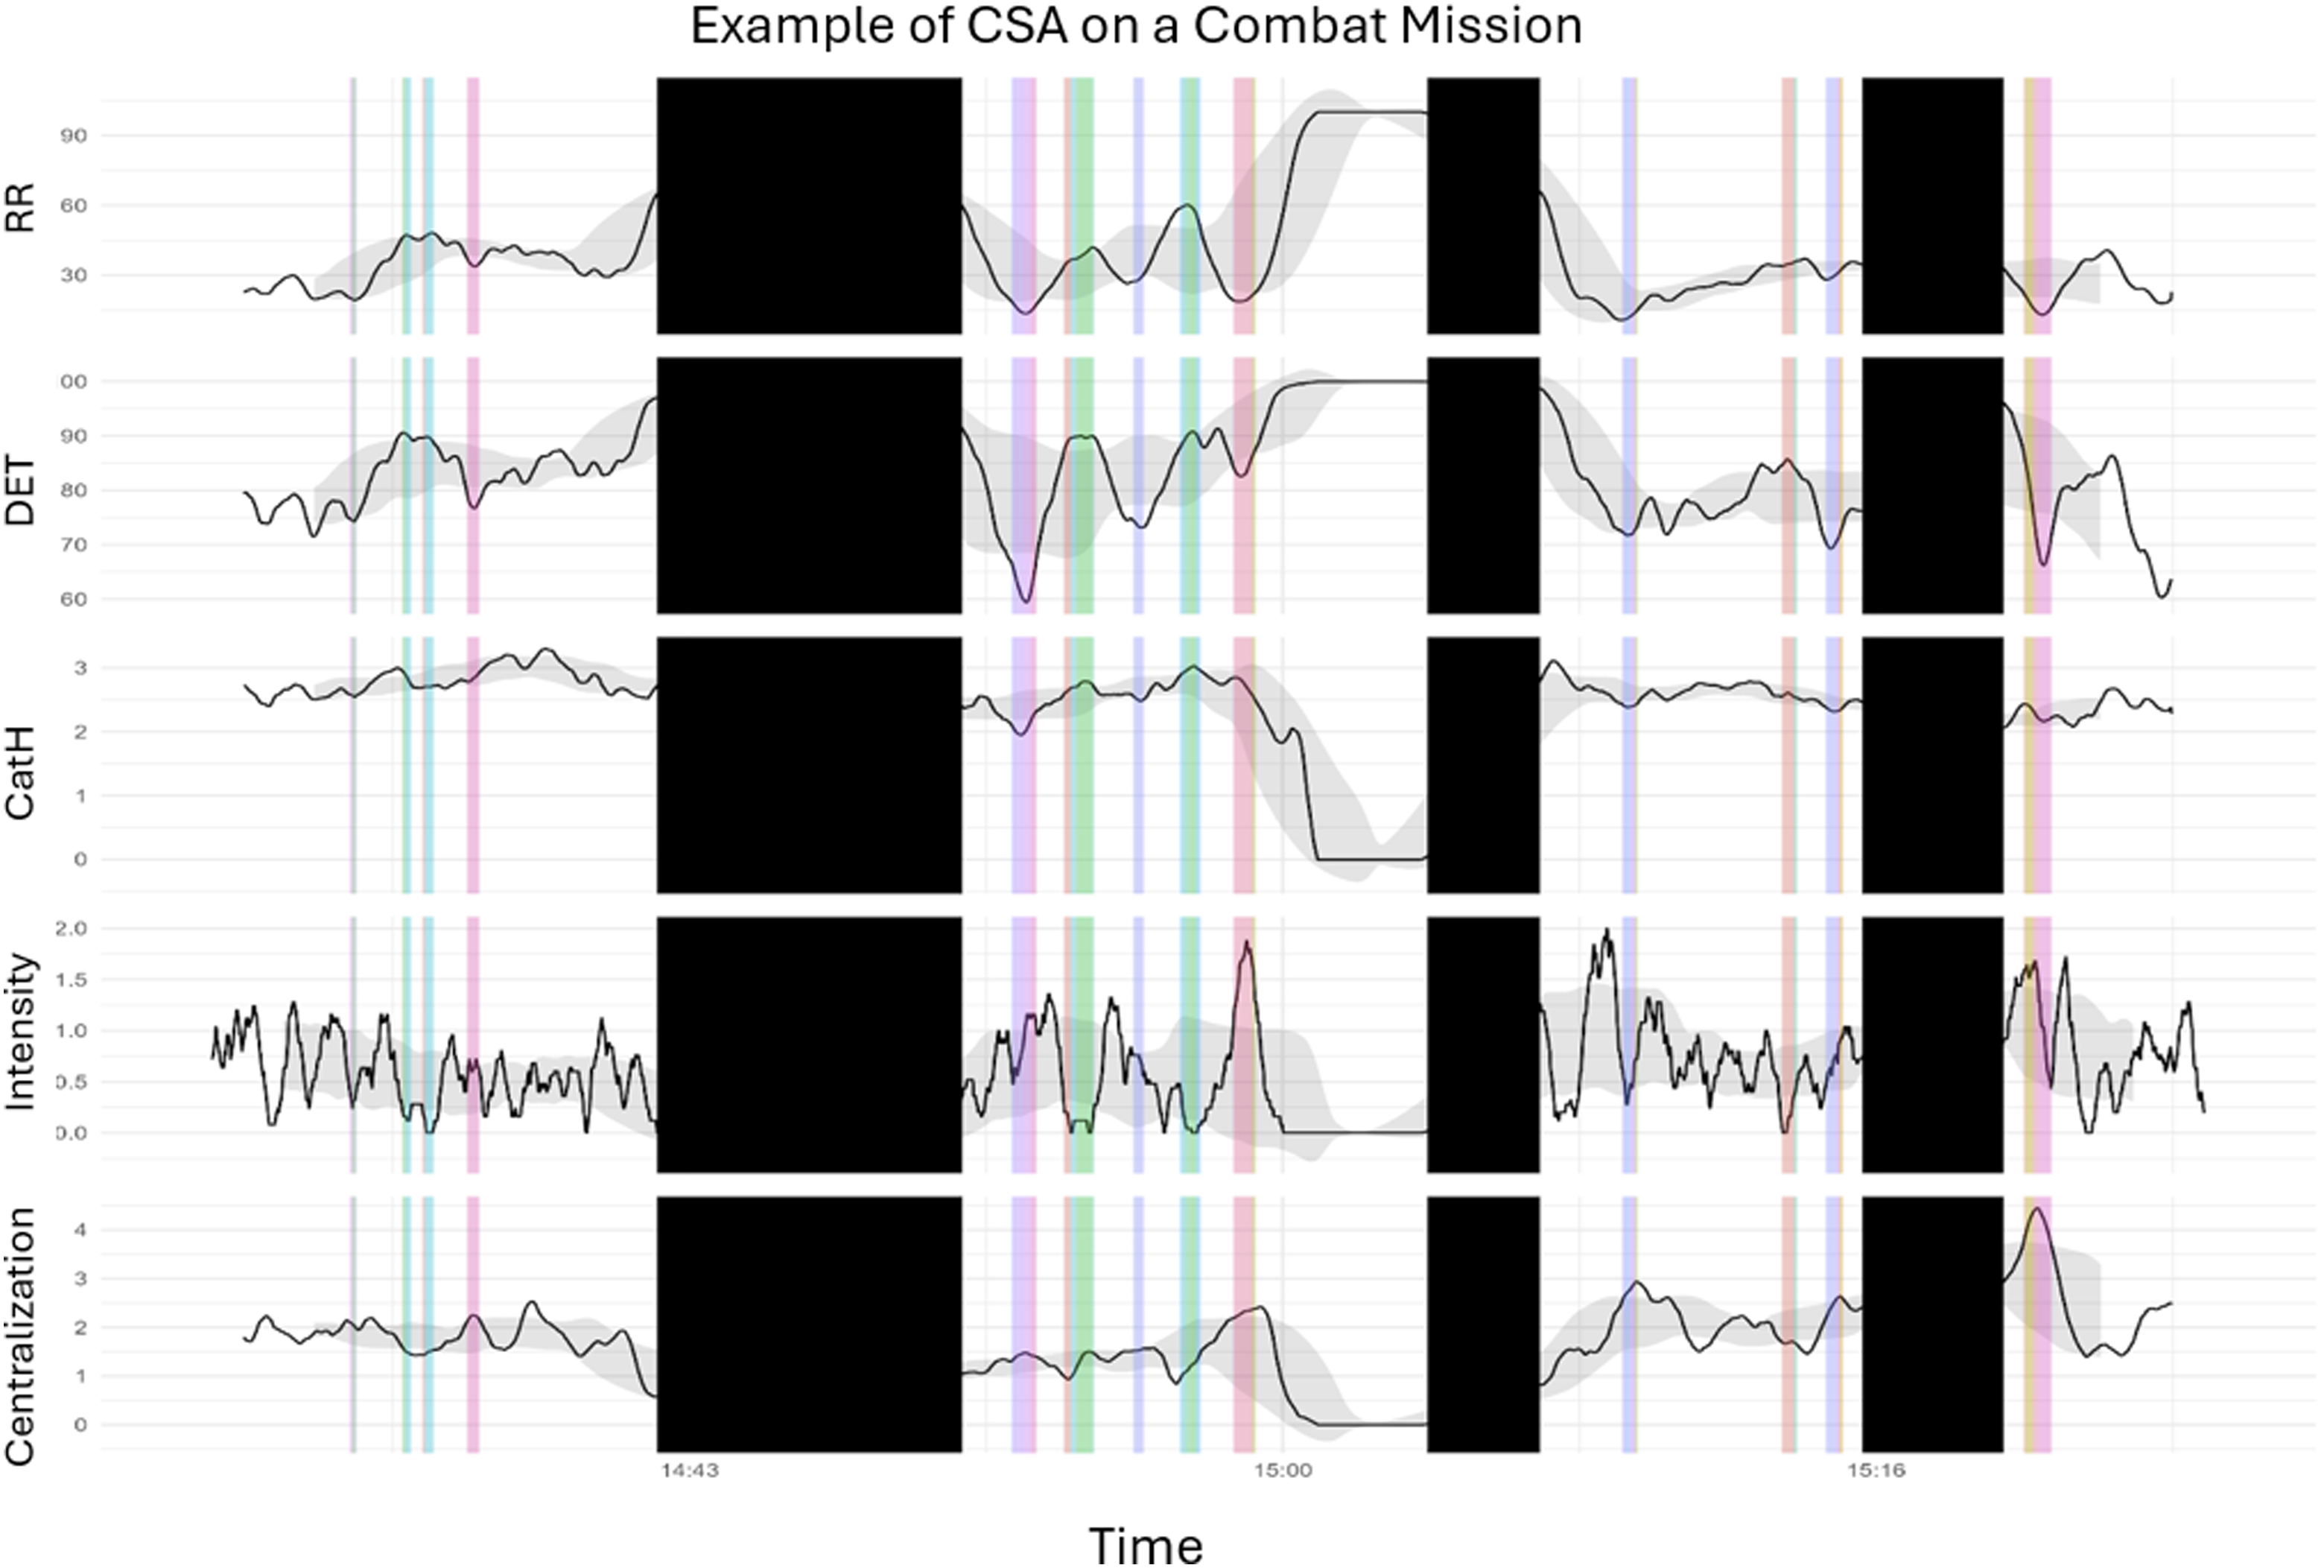
Collective System Adaptation Measures
Derived CSA Metrics.
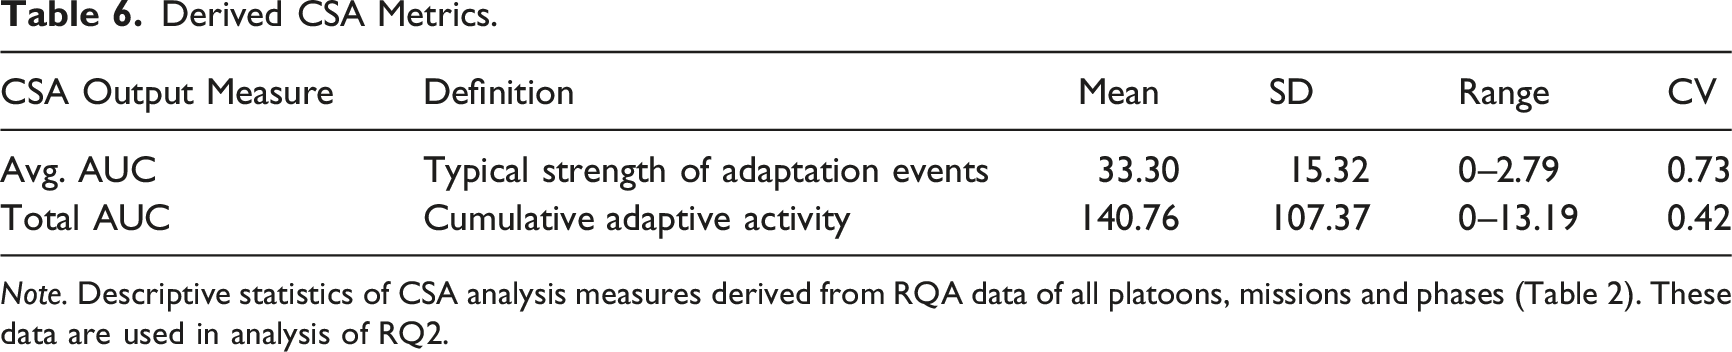
Note. Descriptive statistics of CSA analysis measures derived from RQA data of all platoons, missions and phases (Table 2). These data are used in analysis of RQ2.
Analysis RQ1: Dynamic Communication Flow Measures and Performance
To evaluate the relationship between communication flow measures and team performance at the highest level, each interaction measure was calculated for each phase, and five linear mixed-effects models (LMM) were fitted using the lme4 package in R (Bates et al., 2015). Prior to analysis, both predictor and outcome variables were screened for outliers. To preserve the validity of the regression models, any phase with values exceeding ±3 standard deviations from the mean was excluded. Specifically, one phase was removed due to an extreme value on the Overall Performance metric (z = 7.08), and another was excluded for an outlier in RR (z = 3.06).
Due to the hierarchical nature of the experimental design, several candidate sources of random variation were considered. Specifically, we tested whether including random intercepts for each platoon, mission, or phase would account for meaningful variance in the data. Initial model comparisons indicated that neither platoon nor mission-level grouping improved model fit or accounted for significant variance. In contrast, phases differed substantially in their operational contexts and demonstrated meaningful variation in performance outcomes. Accordingly, phase was modeled as a random intercept in all LMMs. This decision was theoretically justified because, although platoons consisted of comparably trained warfighters and missions followed a consistent structural format, each mission phase introduced distinct operational goals and environmental dynamics.
Prior to this analysis, each outcome variable was assessed for normality and heteroskedasticity using Shapiro-Wilk, Levene’s, and Breusch-Pagan tests. Several variables showed moderate violations of these assumptions. However, instead of transforming these variables, we proceeded with modeling using the original scales. This decision was based on the use of cluster-robust standard errors, calculated at the phase level using the clubSandwich package (Pustejovsky, 2023), which have been shown to provide consistent inference even when residual distributions deviate from normality or heteroskedasticity (McCaffrey et al., 2004; Pustejovsky & Tipton, 2018). Additionally, visual inspections of residuals and sensitivity checks with transformed models revealed no meaningful differences in model estimates or inferential conclusions. Given the interpretability of untransformed model results, particularly in applied settings, and the use of cluster-robust standard errors, we report results based on the original metric.
Finally, preliminary modeling revealed that the inclusion of the CatH measure did not yield significant associations with any performance outcomes and consistently reduced overall model fit. Therefore, to maintain parsimony and interpretability, CatH was excluded from the final models examining the relationship between communication-based interaction measures and performance at the phase level.
Analysis RQ2: CSA Measures of Adaptation and Performance
Five linear mixed-effects models were fitted to evaluate the relationship between communication adaptation and phase-level performance outcomes following the same procedures outlined for RQ1 analysis. Model comparisons tested the inclusion of random intercepts for mission and phase; only phase-level grouping improved model fit and was retained. As in analysis for RQ1, outcome variables were screened for outliers (z > ±3), and cluster-robust standard errors were applied to account for potential violations of normality and heteroscedasticity. No CSA-derived variables were excluded based on preliminary model fit or multicollinearity.
Results
RQ1: Dynamic Communication Flow Measures and Performance
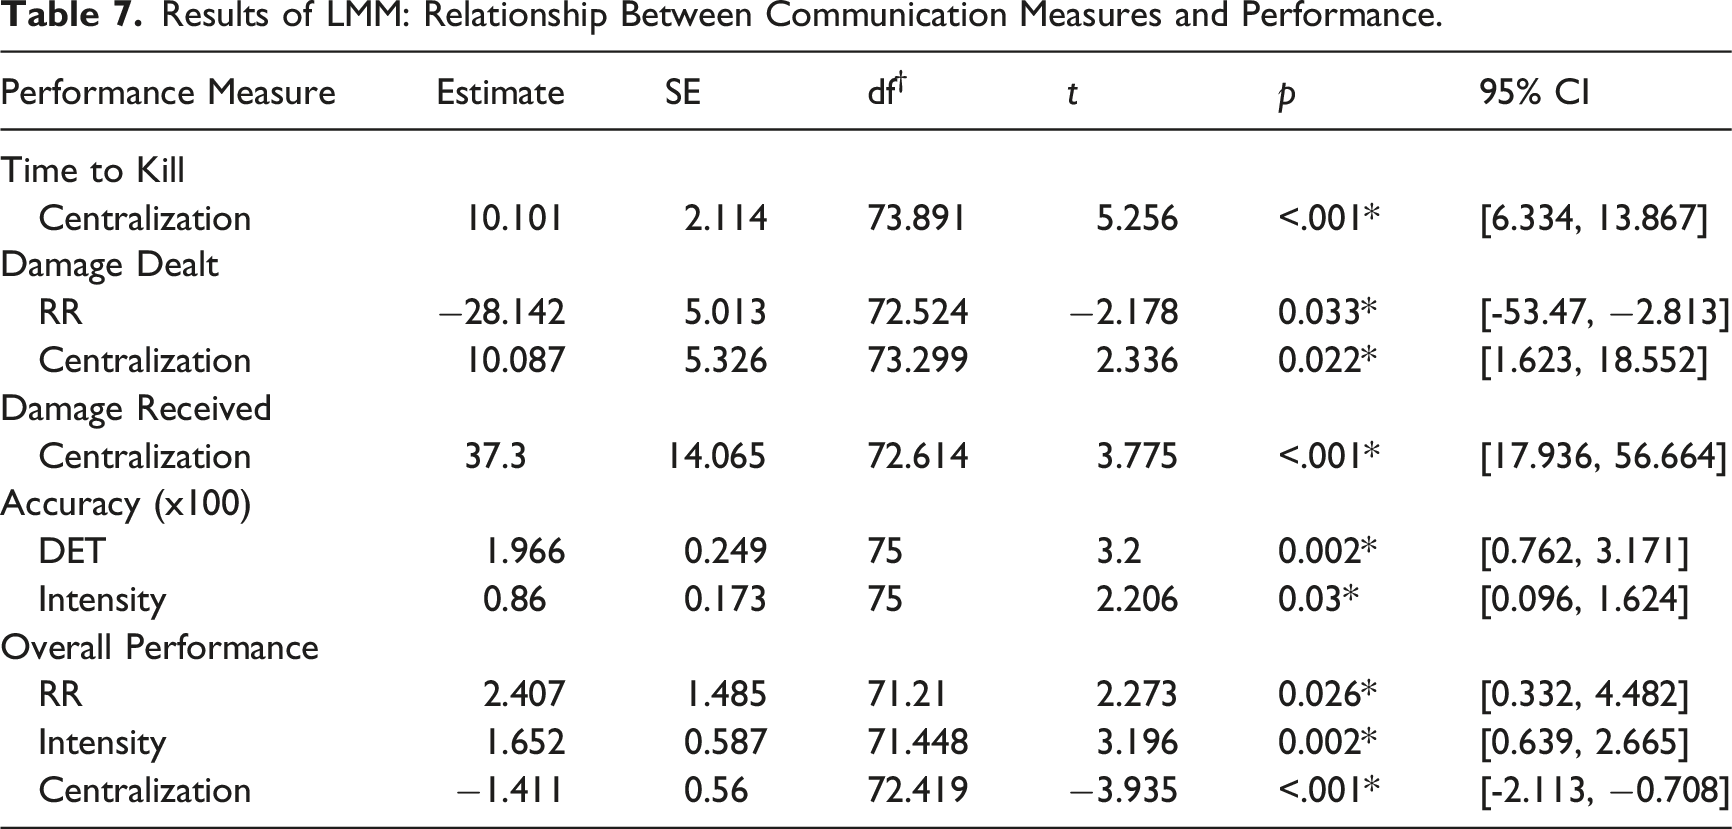
Results of LMM: Relationship Between Communication Measures and Performance.
Practical Effects of Communication Flow Measure Changes on Performance.
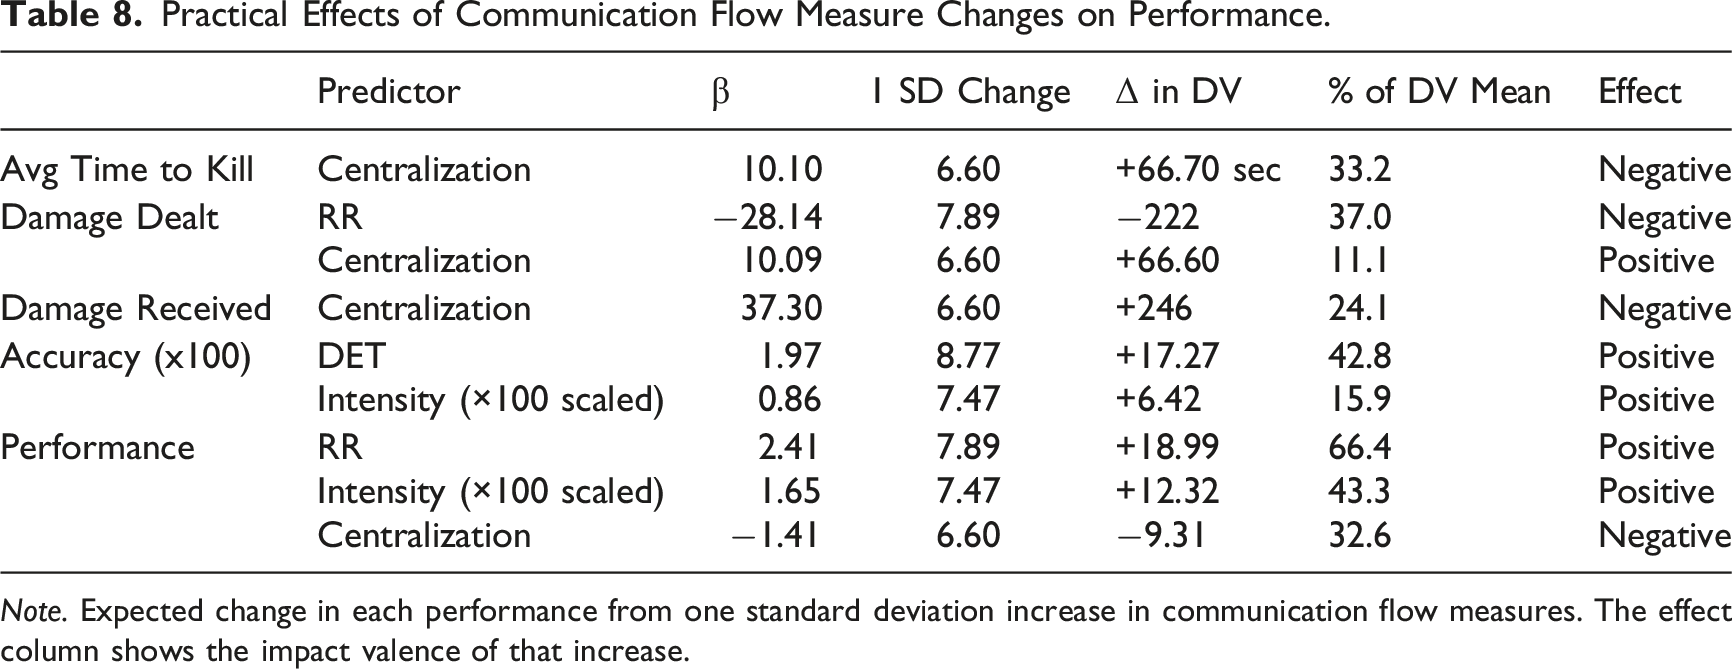
Note. Expected change in each performance from one standard deviation increase in communication flow measures. The effect column shows the impact valence of that increase.
Additionally, a one standard deviation increase in Recurrence Rate resulted in a 222-point reduction in damage dealt (37.0% of the mean), suggesting that excessive patterning may impede offensive output. Meanwhile, Determinism and Intensity both predicted meaningful increases in Accuracy—17.27 points (42.8%) and 6.42 points (15.9%), respectively—emphasizing the value of structured and dynamic information flow. Most notably, Intensity also emerged as the strongest predictor of overall performance: a one standard deviation increase yielded a 12.32-point gain, amounting to 43.3% of the mean, highlighting interaction rate as a dominant factor in team mission success.
RQ2: CSA Measures of Adaptation and Performance
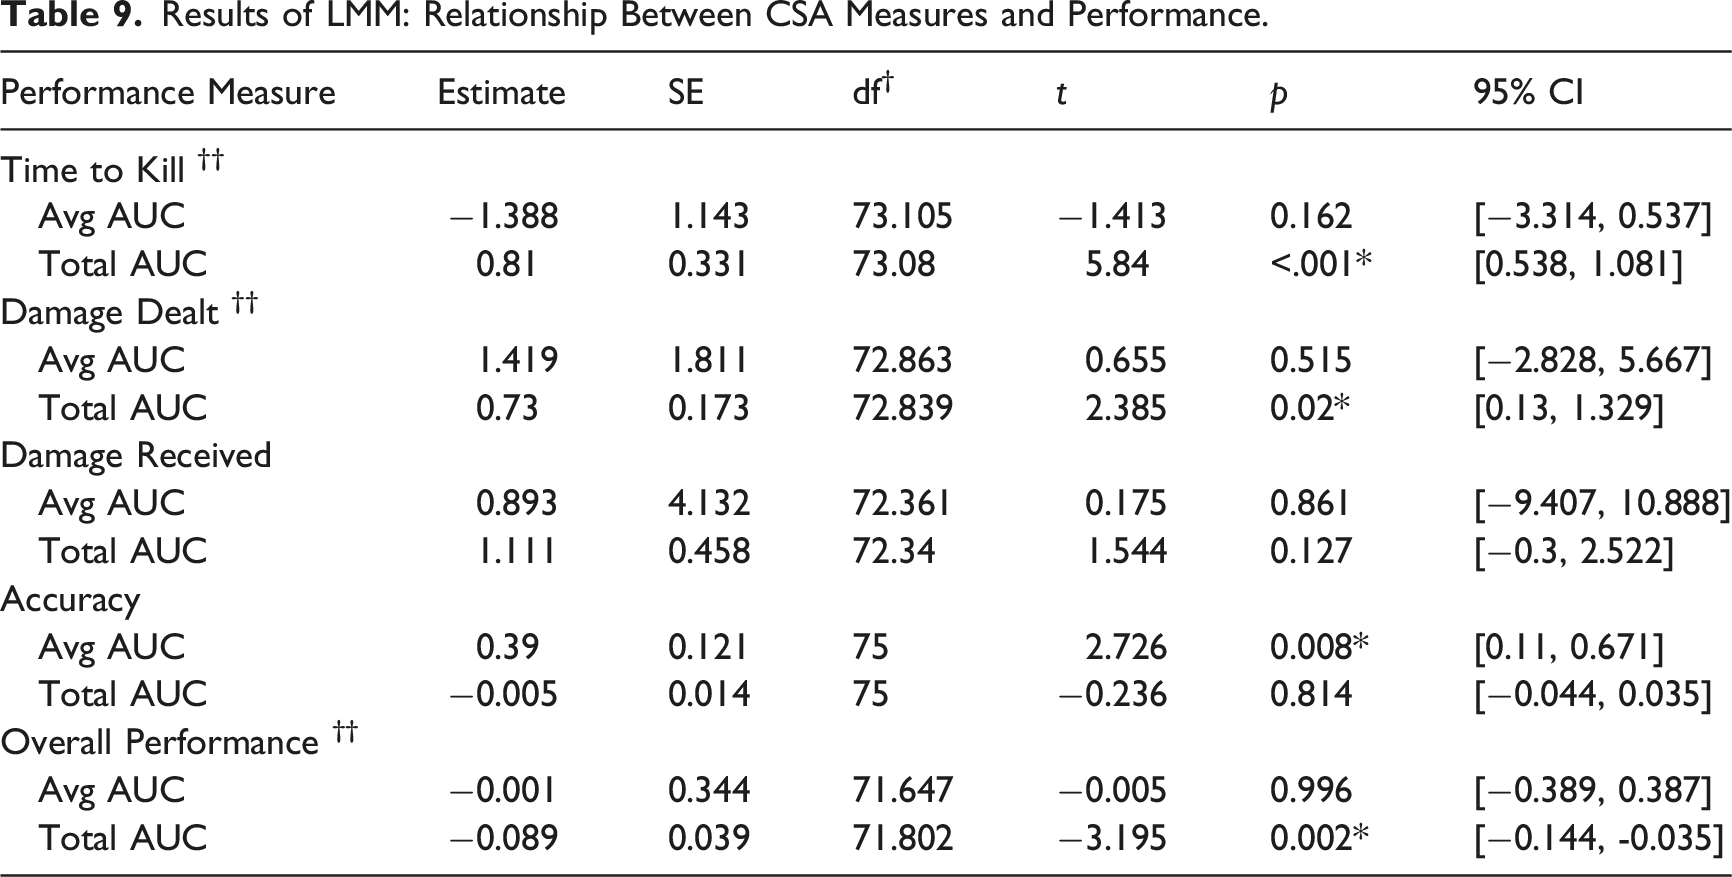
Results of LMM: Relationship Between CSA Measures and Performance.
Alternatively
Practical Effects of CSA Measure Changes on Performance.
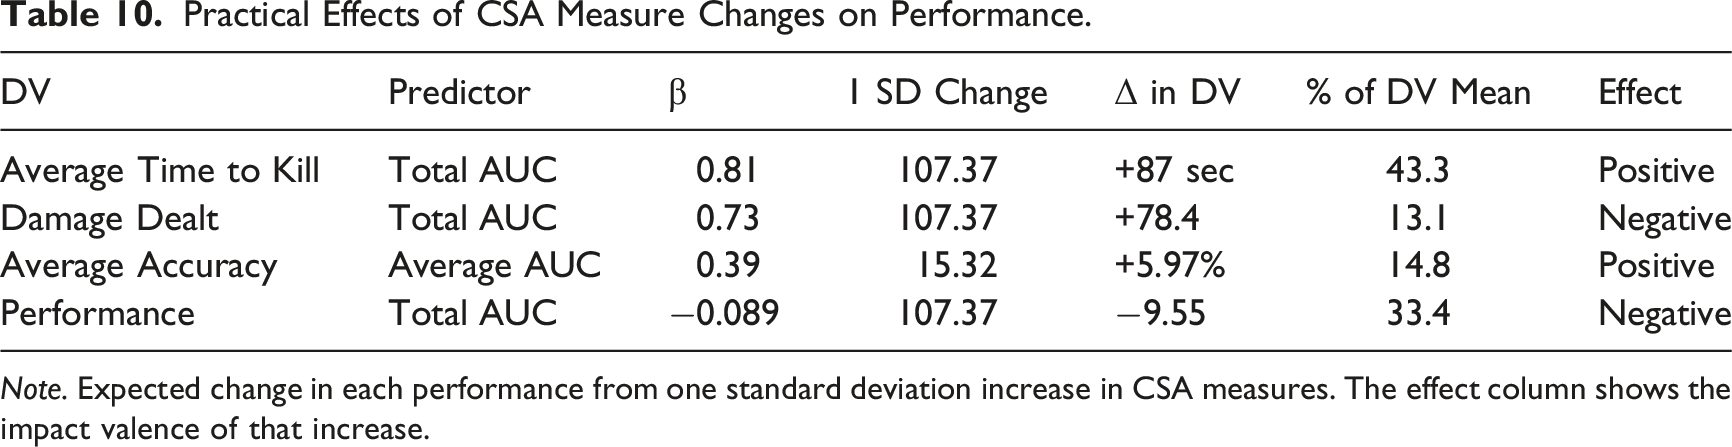
Note. Expected change in each performance from one standard deviation increase in CSA measures. The effect column shows the impact valence of that increase.
In contrast, Average AUC—which reflects the typical size of individual adaptation events—was positively associated with Accuracy, predicting a 5.97% increase in average targeting precision (14.8% of the mean). This indicates that larger average adaptations, when they occur, may support more precise coordination. Taken together, these findings suggest that although more frequent or extensive adaptive activity may relate to task engagement, they do not necessarily result in better team-level outcomes.
Discussion
In the current study, we investigated how communication flow interaction measures and adaptation relate to tactical performance outcomes in combat teams. Specifically, we examined the communication behavior of U.S. Army tank platoons conducting simulated operations in a high-fidelity combat environment. Using both direct measures of communication flow and derived metrics from CSA, we sought to assess how real-time communication patterns reflect and support adaptive team functioning.
RQ1: Dynamic Communication Flow Measures and Performance
The findings for
Centralization was the most consistently associated predictor across outcomes, suggesting that more centralized communication patterns were linked to both offensive and defensive tradeoffs. Specifically, higher Centralization was associated with longer engagement durations (Time to Kill), greater Damage Dealt, and greater Damage Received, while also predicting lower Overall Performance. This pattern indicates that although centralized communication may facilitate concentrated offensive actions, it may come at the cost of flexibility and responsiveness. Communication Intensity, reflecting the overall rate of information exchange, also played a critical role. Greater Intensity predicted improvements in both Accuracy and Overall Performance, emphasizing the value of maintaining active, high-volume information flow during complex tasks. Notably, a one standard deviation increase in Intensity corresponded to a 43.3% improvement in Overall Performance, making it the strongest positive predictor among the variables examined.
The recurrence-based measures, RR and DET, provided additional insight into team structuring over time. Higher RR was negatively associated with Damage Dealt but positively associated with Overall Performance, suggesting that some degree of patterned communication may support broader coordination without necessarily enhancing immediate offensive output. Conversely, greater DET was positively associated with Accuracy, indicating that more structured communication dynamics facilitate more precise task execution.
From a systems perspective, these results illustrate that communication dynamics not only reflect, but likely shape, how teams self-organize across epochs of activity. Communication analyses may capture sustained interaction patterns that unfold over larger temporal epochs, allowing researchers to observe overarching organizational structures that transient analyses might miss. By linking these dynamics to performance, we gain insight into the balance between structured communication (e.g., high determinism, moderate recurrence) and adaptive flexibility (e.g., decentralized, high-intensity communication) that armored infantry platoons must strike to succeed in their dynamic operating environments, though these findings may not generalize to all action teams. In our context, many forms of implicit coordination (e.g., body language, glance behavior) were constrained because soldiers were confined to vehicle cockpits and arranged in such a way that visual cues were limited. In settings in which rich implicit coordination is possible, these communication–performance relationships may weaken or even reverse. This underscores the need for careful task analysis when selecting which interaction measures to capture and interpret.
RQ2: CSA Measures of Adaptation and Performance
The results for
In contrast, Average AUC, which reflects the magnitude of discrete adaptation events, was positively associated with Accuracy. This finding provides support for the Adaptation Quality Hypothesis, implying that larger/longer, focused bursts of communication reorganization may enhance targeting precision and fine-grained coordination. Collectively, these results support the theoretical distinction between quality and quantity of adaptation and highlight CSA as a promising tool for capturing these dynamics. However, they also caution that adaptation, while essential, does not inherently lead to improved outcomes; its impact likely depends on context, timing and execution. These findings offer initial support for CSA’s potential sensitivity to qualitatively distinct adaptation profiles and its applicability to dynamic, high-stakes team environments (Figure 2).
Taken together, the findings support the idea that successful teams adapt strategically—demonstrating large, but infrequent shifts in communication dynamics—while teams that continuously fluctuate may struggle to stabilize. This result aligns with prior research suggesting that both rigidity and excessive adaptation can hinder performance (Demir et al., 2018). Collective System Adaptation’s ability to distinguish between average and total adaptation offers a nuanced perspective on team interaction, emphasizing the importance of controlled, purposeful reorganization in dynamic settings. These results are especially compelling given the naturalistic experimental design, which afforded operators a high degree of autonomy and freedom to solve problems in diverse ways. Unlike controlled laboratory studies, this setting imposed minimal experimental constraints, resulting in greater behavioral variability and ecological validity.
Practical Guidelines and Parameter Considerations
The present study was designed as a methodological contribution that explicates the core logic of CSA and demonstrates its feasibility in a single interaction dimension. This multidimensional method was developed to be implemented on large scale data sets as a fully standardized protocol. Within that scope, the current implementation suggests several practical considerations for researchers interested in using CSA to examine team adaptation.
Preparatory Work
CSA requires continuous, time-aligned indicators of team interaction sampled at a resolution that meaningfully reflects the timescale of reorganization in the target context. In the current study, data stream selection and preprocessing were guided by a task analysis and by prior work on dynamic communication in action teams. This kind of preparatory work—for example, task analysis, identification of promising interaction measures, time series synchronization, and data quality checks—is a necessary prerequisite for effective CSA application and should be tailored to the coordination pace of the team in question rather than treated as a one-size-fits-all recipe. As in any time-series analysis, developing a data processing pipeline to produce clean and usable data from naturalistic observations can be challenging and time-consuming, though once established, much of CSA analysis may be automated.
Data Selection
With respect to temporal scope, CSA is conceptually scalable to data series that span minutes, hours, or weeks. The method operates on any time series, provided researchers adjust the window size (
Because CSA identifies adaptation via synchronized deviations, the spectral and statistical properties of the selected measures are central to its functionality. Input streams from different dimensions (i.e., physiological, geospatial) may exhibit diverse behaviors, ranging from stationary processes to those defined by non-stationarity or periodicity (see Amazeen, 2018, for more information on characteristics of time series). In the current study, all data streams were derived from a shared underlying measurement dimension (categorically classified communication) and thus exhibited congruent temporal dynamics. However, researchers must exercise caution when integrating multidimensional data or data with different temporal signatures. For instance, high-frequency signals such as those captured by physiological sensors often contain rapid, stochastic fluctuations that may lack temporal commensurability with slower-frequency variables. Collective Systems Adaptation’s use of adaptive, context-dependent thresholds may mitigate these disparities by filtering out transient, non-influential volatility and accounting for non-stationary drift through the context-dependent standard deviation threshold (A). In effect, this standardizes scale and variance across heterogeneous measures. Nevertheless, this compensation is not absolute, and stream selection must be driven by consideration of theoretical relevance and signal characteristics. Researchers may find it beneficial to conduct preliminary spectral analyses (e.g., Power Spectral Density or Fast Fourier Transform; Amazeen, 2018) to characterize dominant frequencies and typical variability prior to finalizing CSA parameters. Investigating how to use multiple data streams from different dimensions with varying temporal dynamics is a primary future direction.
A related issue concerns the number of measures to include and the criteria for declaring a collective adaptation. In principle, CSA can accommodate any number of data streams, but included measures should reflect core aspects of team coordination in the phenomenon of interest. In this study, five communication measures were used within a single domain, and a
Although the present implementation weighted all measures equally, CSA does not require equal weighting. In theory, researchers could assign higher or lower
Generalizability
The inherent tuning of CSA to the temporal structure and interaction patterns of a particular context complicates generalizability and cross-study comparability. At present, CSA is best viewed as a domain-flexible analytic framework in development rather than a fully standardized methodology. While its output measures (e.g., Average and Total AUC) may be structurally comparable across studies, their interpretation relies heavily on how measures are calibrated to the specific context. These measures are most applicable in applied settings in which important performance outcomes may not be so easily understood or measured. In such cases, CSA parameters may be tuned to a given context during training or simulation then used to understand team performance in lieu of those performance outcomes.
This is analogous to nonlinear methods like RQA, where the selection of tunable parameters must be explicitly reported and justified to ensure validity (Landfair et al., In Review). Consequently, cross-study comparisons must be conducted with the understanding that parameter selection will inherently differ across domains to accommodate different team properties. Near-term comparative efforts are therefore most feasible for within-study designs (e.g., contrasting experimental conditions within a team).
As discussed in the methods, the parameterization for the current study was determined a priori through task analysis and theoretical constraints. However, the optimal selection of these values is influenced by a complex array of factors, including team size, temporal scale, team familiarity, implicit coordination, and the stationarity of the input data. Furthermore, dynamic properties such as team entrainment, individual experience, communication capabilities, and the density of expected perturbations are likely to shape both the stability of baseline coordination and the patterns of adaptive episodes. One of the primary directives for future research is to establish heuristic benchmarks for these settings. This directive includes the creation of parameterization guides similar to those found in current literature on RQA, which will assist researchers in systematically tuning CSA to maximize sensitivity and specificity across diverse research contexts.
Limitations
Several limitations should be considered when interpreting the findings and the scope of the CSA approach. First, the measured adaptations of CSA were not related to post hoc identified or classified adaptation events in the traditional sense. Instead, team adaptation was defined operationally from a bottom up rather than top down perspective. Prior research has attempted to relate variation in team processes to manually coded coordination breakdowns or experimentally induced perturbations (Grimm et al., 2023; Van Eijndhoven et al., 2025). Though these types of analyses may be potentially feasible in future examinations, our decision to relate CSA-derived adaptation profiles to combat performance reflects both theoretical and practical constraints. From a theoretical perspective, complexity theory cautions against assuming that events of interest can be reliably attributed to single causes (Dekker et al., 2011). Post hoc reconstruction of the cause of a given adaptive episode is therefore inherently uncertain, which renders manual coding of adaptation episodes unreliable in complex domains. From a practical perspective, communication data in military settings are restricted as personally identifiable information and controlled unclassified information, which limits the feasibility of detailed human review.
In addition, the number of communication networks in the present setting precludes comprehensive human interpretation of team state at any given moment. Although advances in automated transcription and semantic analysis may eventually mitigate some of these challenges, current tools remain poorly suited to military communication because of domain specific terminology and contextual dependence. Given these constraints, the present work does not attempt to retrospectively label or narratively explain individual adaptation events. Instead, CSA is used to characterize patterns of change in team communication and to examine how these patterns relate to meaningful operational outcomes.
Additional limitations relate to the experimental design and analytic approach. Multiple observations were collected across missions and phases from the same teams, introducing potential within-team dependencies that limit strict independence of observations. Although random-effects modeling was used to account for this structure, residual dependence cannot be entirely ruled out. Moreover, the analyses are correlational in nature and do not establish causal directionality. For example, observed associations between longer engagement durations and greater CSA-derived adaptation cannot determine whether increased adaptation prolonged engagements or whether longer engagements necessitated greater adaptation.
Finally, the current implementation of CSA relies on anomaly detection based on sliding standard deviation thresholds. While this approach is transparent, computationally efficient, and sensitive to local variation, it may not generalize equally well across all data types or behavioral contexts. Alternative thresholding strategies, including multivariate methods that account for interactions among streams, are an important area for future development and may enhance CSA’s flexibility and robustness across domains.
Future Directions
Collective Systems Adaptation is a developing methodological effort, and several important steps remain before it can be applied routinely in practical settings. A primary near-term priority is strengthening validation strategies beyond initial demonstrations of feasibility. One promising approach involves the use of surrogate data analysis, in which temporal dependencies and autocorrelation structures are systematically disrupted while preserving first-order statistical properties such as mean and variance (Moulder et al., 2018). By comparing observed CSA-derived patterns against those obtained from shuffled or phase-randomized surrogates, future work can more directly test whether detected adaptation events reflect meaningful system-level reorganizations rather than artifacts of non-stationarity or chance structure in the data. Applying surrogate analyses to communication flow time series would provide a principled statistical benchmark for evaluating the robustness of CSA outputs.
Beyond validation, an important direction for continued development involves extending CSA to incorporate data streams from multiple dimensions, such as geospatial coordination and physiological synchrony. This extension is motivated by a systems perspective in which team adaptation is inherently multidimensional, emerging from interactions among nested processes operating at different levels and timescales. Changes in task demands, environmental conditions, or internal team states often manifest across multiple channels, either concurrently or in close succession. Integrating cross-domain signals within CSA may therefore enable more comprehensive representations of adaptation, revealing layered or interacting patterns of reorganization that are not apparent when examining a single modality in isolation.
A related extension concerns the temporal structure of adaptation itself. In its current form, CSA emphasizes synchronous co-occurrence of deviations across streams. However, real-world adaptation frequently unfolds in a cascading or sequential manner, with changes in one subsystem propagating to others over time. Incorporating temporal lag structures into CSA would allow the method to capture these delayed and distributed dynamics, better reflecting the multiscale nature of adaptive processes in complex team systems.
Finally, future work will focus on improving how CSA characterizes the internal structure and qualitative content of detected adaptation events. Rather than treating all collective deviations as equivalent, ongoing efforts aim to identify patterns based on the direction, valence, and sequencing of deviations across streams. For example, an increase in communication centralization accompanied by reduced recurrence and determinism may reflect a qualitatively distinct mode of adaptive coordination. Developing methods to classify such patterns could enhance the interpretability of CSA outputs and support richer distinctions among different forms of team reorganization.
Taken together, these directions reflect a broader effort to increase the resolution, flexibility, and interpretability of CSA. By advancing its methodological foundations and expanding its scope, future work aims to establish CSA as a useful tool for studying complex adaptive behavior across a range of applied and theoretical team contexts.
Conclusion
In conclusion, CSA has the potential to provide a promising new framework for capturing systemic reorganization in team behavior. Its design preserves the temporal structure of adaptive events, allowing researchers to trace how team processes evolve dynamically rather than retrospectively. Although the current findings highlight CSA’s potential for identifying meaningful patterns of adaptation linked to team performance, further work is needed to refine its algorithms, extend its application to broader domains, and validate its outputs against independent markers performance. Future research will focus on enhancing CSA’s sensitivity and generalizability, expanding its use across multimodal behavioral streams, and exploring its integration with complementary modeling approaches. Ultimately, we aim to position CSA as a flexible tool not only for post hoc analysis, but also for real-time monitoring and adaptive support in dynamic team environments. Though this work represents an initial step within a specific communication testbed, it lays the groundwork for future research to refine these techniques across broader modalities and operational contexts, ultimately advancing our ability to monitor and support teams in complex environments.
Footnotes

Funding
The authors disclosed receipt of the following financial support for the research, authorship, and/or publication of this article: This research was partially supported by CCDC DEVCOM Army Research Laboratory, Award W911NF-23-2-0234. The work presented here is part of a larger effort and the views represent those of the authors and not necessarily those of the Department of Defense.
Declaration of Conflicting Interests
The authors declared no potential conflicts of interest with respect to the research, authorship, and/or publication of this article.