
Abstract
This case is designed to highlight issues related to data inquiry in education, the role of leaders (specifically building-level administrators) in setting conditions for effective data conversations on teams, and the challenge of developing and deepening data use in a school over time. It was created based on interviews with a real elementary school in a district in the southwestern United States; however, all names of places and people are pseudonyms. The case challenges educators to consider how school leaders can create stronger connections between information about student learning and teachers’ instructional decisions.
Case Narrative
Principal Diane Williams sat at her computer at King Elementary School in Southwest School District and began to type up the agenda for her first whole-faculty meeting after the winter break in January. She wanted to celebrate the progress her staff had made in the first half of the year, but she also wanted them to know that they should always be improving. Specifically, she considered how much energy and attention had gone into instituting the data inquiry routines in their grade-level teams, and how much she and Assistant Principal Linda Holland emphasized using data to inform decisions about students who needed differentiated instruction or intervention. She also recalled what a struggle it had been to institute the “Enrichment and Intervention” (E&I) block as part of the daily schedule at King Elementary School, but teachers had finally accepted the E&I block as part of their routine. Students identified as “gifted and talented” seemed to excel with the support of the enrichment opportunities offered during the E&I block. The problem was students who were identified as needing extra help during the E&I block never seemed to move out of that group, as she and the faculty had hoped. What else could they do to strengthen the use of data, team meetings, and instructional interventions at King Elementary School in a way that would lead to measurable progress for their students?
The Culture of Teamwork at King Elementary School
When Diane Williams first became principal at King Elementary 3 years ago, she walked into a school with a strong culture of cooperation and friendly relationships. Many of the teachers had been teaching at King for more than 10 years and had spent time developing their expertise and building relationships with colleagues. Principal Williams had worked closely with Assistant Principal Linda Holland over the past 3 years to develop what she perceived were equally strong and trusting relationships with the faculty.
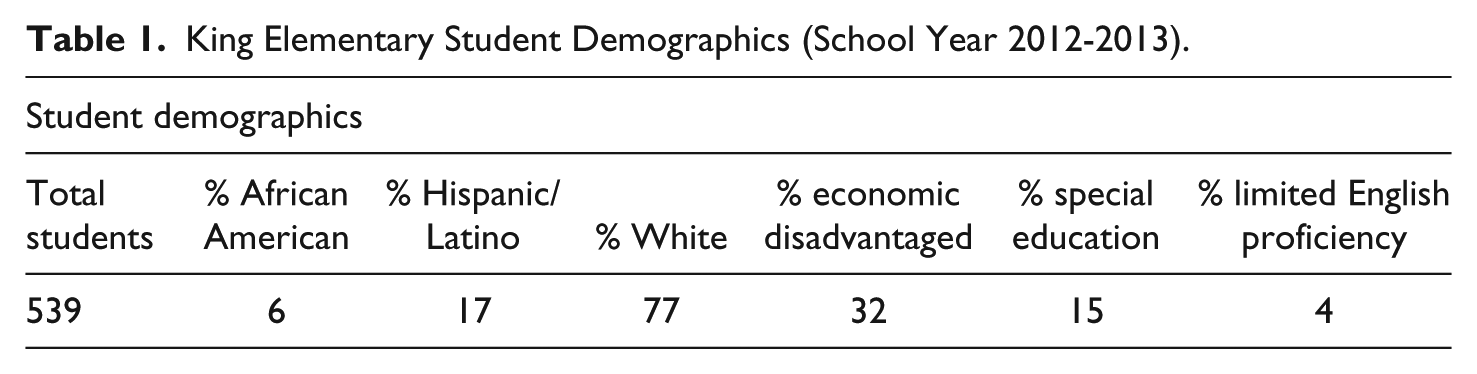
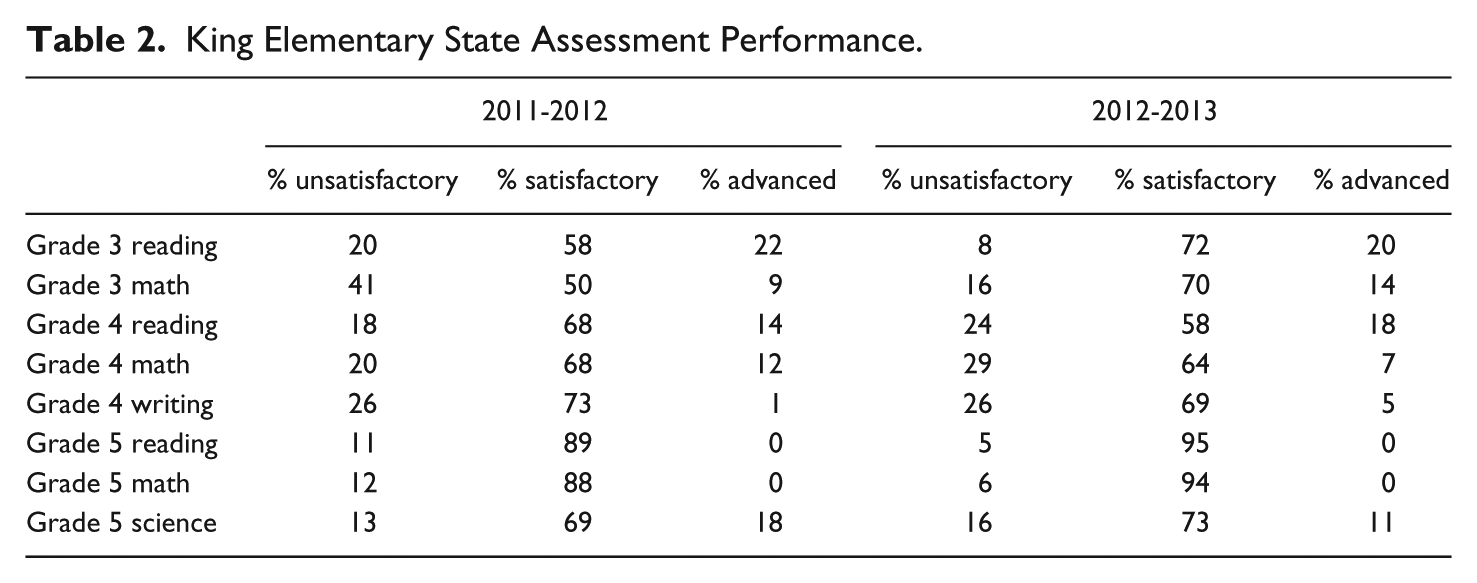
Principal Williams believed that this collegial environment was one of the reasons why King tended to be successful on annual state assessment tests. However, she also recognized that the school served a more affluent and White population than surrounding schools in the district (see Table 1). There was a real pride in the success they had as a school in supporting student learning, with a large and growing proportion of students meeting or exceeding state standards in mathematics and reading on the annual state assessment (see Table 2).
King Elementary Student Demographics (School Year 2012-2013).
King Elementary State Assessment Performance.
Principal Williams described herself as a collaborative leader, explaining, “It is rare that I would say ‘This is how we’re going to do it.’ I try to be supportive, listen, and make sure teachers have everything they need to be successful.” As part of this, Williams tried to make sure that there were structures in place to support teachers’ work, such as team time, grade-level chairs to facilitate team meetings, and mentors for new teachers. In addition, both administrators regularly visited each teacher once every other week and gave feedback on instruction. Teachers described the feedback as brief and generally positive, encouraging them to “keep going” or making suggestions for new strategies to try. All teachers received advanced notice of what the administrators would be looking for when they entered the classrooms.
Williams and Holland both described the teachers as “engaged.” Assistant Principal Holland explained that “kids learn in this school” because they believed their teachers were there to teach them. “Our teachers teach,” she added, emphasizing her view that teachers in the school worked hard to support student learning. Teachers were largely veteran teachers, and even newer teachers had taught in other settings before coming to the school. As a result, teachers seemed to have strong beliefs about their own expertise and appreciated the autonomy they received from administrators. According to teachers, Williams and Holland treated teachers like professionals by allowing them to make decisions and trusting them to do their jobs. One teacher explained,
The administrators give us a lot of autonomy. I think that shows the trust that they have in the faculty. I mean, we’re professionals and we’ve been doing this for a while, so we should know what to do by now.
Another teacher described the faculty as “dedicated for the most part” but, in her view, “teachers could use more direction” than administrators gave them, especially regarding how to use the E&I time.
Teachers thought of their colleagues as a “family” who helped each other both personally and professionally. Teachers celebrated and supported each other, whether a teacher was new to the school, having a baby, or fell ill. Some teachers pointed out that they “bounced ideas off” each other during meetings or talked informally over lunch. In one grade level, the teachers shared responsibility for lesson planning, where one teacher would plan the week’s worth of reading lessons, and other teachers planned the mathematics, science, and social studies lessons, but everyone in the grade level used the same plans. In the upper grades, the teachers were departmentalized, so two teachers would teach English language arts and the other two would teach mathematics and science.
With the support of Williams and Holland, teachers had been working in teams to use interim (curriculum-based) assessment data to inform their instructional practice for the past year and a half. Collaboration among teacher teams had a long history at King and data inquiry was starting to feel like part of the culture at the school. As described in their Campus Educational Improvement Plan, teachers met in grade-level teams every 6 weeks to review student data, determine the instructional interventions necessary to support student learning, and monitor students’ progress over time. Williams and Holland made using data in teacher teams a priority by sitting in on data inquiry meetings with each of the grade-level teams every 6 weeks.
As a school, the faculty decided to support all students’ growth by creating the “Enrichment and Intervention” (E&I) block: This allowed opportunities for intervention when students struggled and enrichment to challenge students to reach higher levels of learning. Specifically, the faculty had been working on supporting students’ individual needs by implementing an E&I block 3 times a week for an hour at the end of the day. According to Williams, while not all teachers were on board initially, she believed that they achieved success with asking all teachers to group students by ability during the E&I time. In each grade, students were grouped homogeneously based on their performance on the interim assessments: Students were designated as “below grade level,” “on grade level,” or “advanced” in a content area such as English language arts or mathematics. Because of this grouping, students might spend E&I block in a class not taught by their typical classroom teacher.
Williams and Holland credited the previous year’s data inquiry meetings for changing teachers’ perceptions of the E&I time. They explained that originally some teachers were hesitant to have students leave their original classrooms to work with another teacher. Through their data inquiry meetings, teachers identified students’ individual needs based on the assessment data. However, they recognized how difficult it would be to differentiate instruction to address the range of students’ needs in their own classrooms. They collectively decided that each E&I teacher would take a different group of students, based on level, during the E&I time. However, Williams and Holland were concerned that they had no concrete evidence that this strategy was working for students.
The content focus of the E&I block had evolved over time. Initially, this was an enrichment class for students identified as “gifted and talented.” Currently, teachers who had more advanced students used the district’s “gifted and talented” curriculum, teachers who had students who were on grade level did work related to the current lessons, and teachers who had students below grade level used the time for review and remediation. As one teacher recalled, they had been “servicing more the gifted kids and then the other three rotations were pretty much make-up work,” but now, she said that the time was supposed to be seen as “enrichment for everybody.” This teacher described the process as “whatever concept we’re doing that week, we just try and meet them where they are, and set the goal a little higher, and just make it fun.”
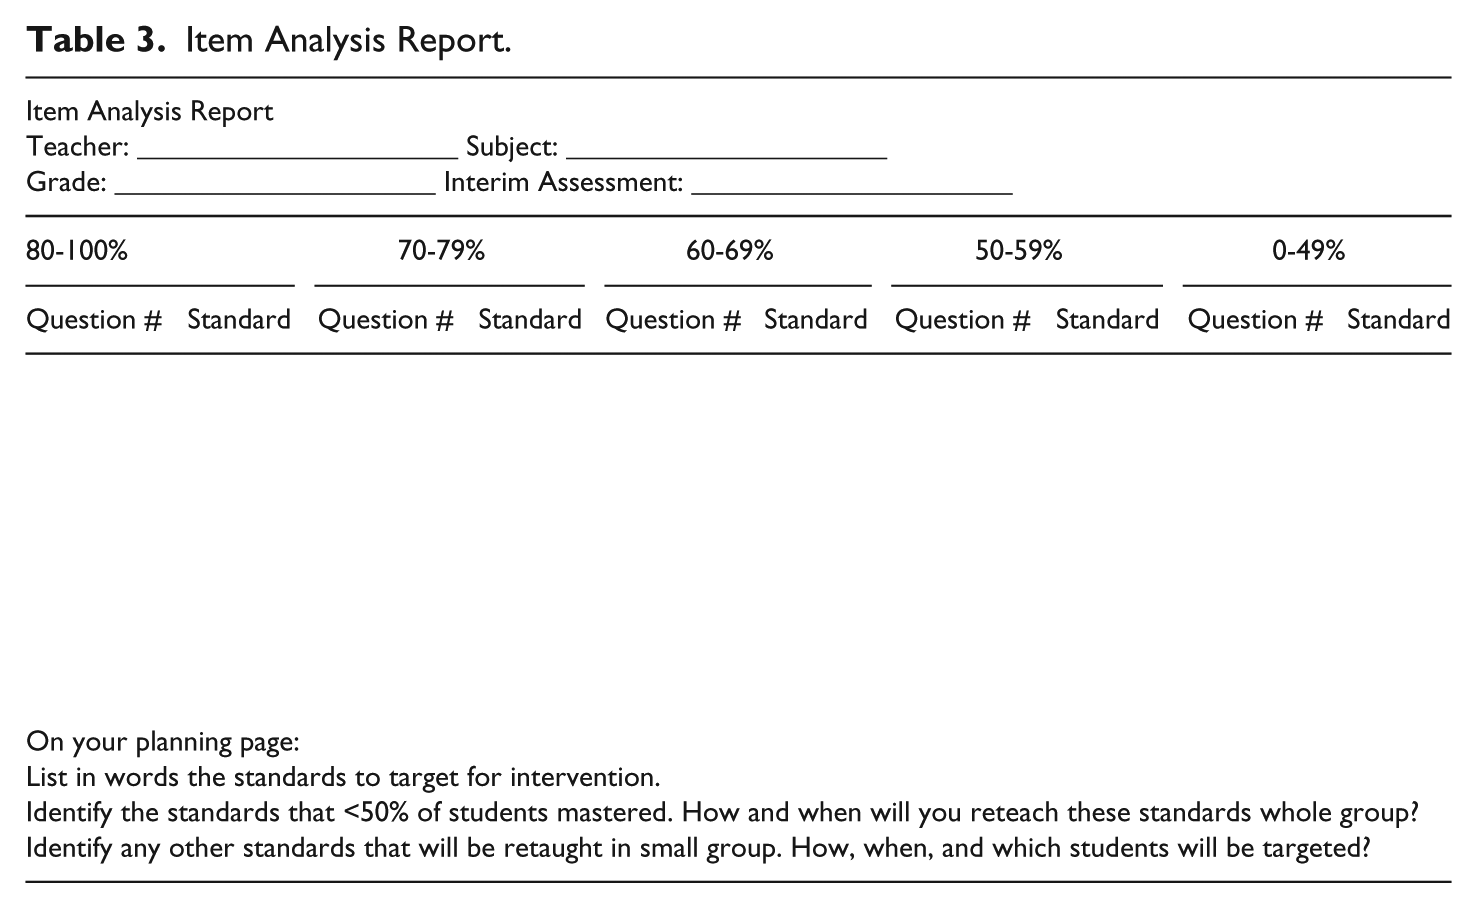
Principal Williams received the results from the district’s second interim assessments given before the winter break and planned to use their January faculty meeting to prepare teachers to use these data to inform instruction. She felt that teachers were already comfortable using an Item Analysis Report from the interim assessment to identify the standards with which students struggled, and teachers were able to select students to put into smaller E&I groups (see Table 3). However, Williams believed that the teachers needed more support with selecting instructional strategies that were truly differentiated by students’ levels. She and a group of five teachers had recently attended a district professional development workshop on how to use a Data Inquiry Cycle to support teacher teams with planning, implementing, and monitoring instructional interventions (see Figure 1). She planned to introduce the Data Inquiry Cycle in the upcoming faculty meeting, as she thought it built upon the teachers’ knowledge of looking at data and would help them create better differentiated action steps.
Item Analysis Report.
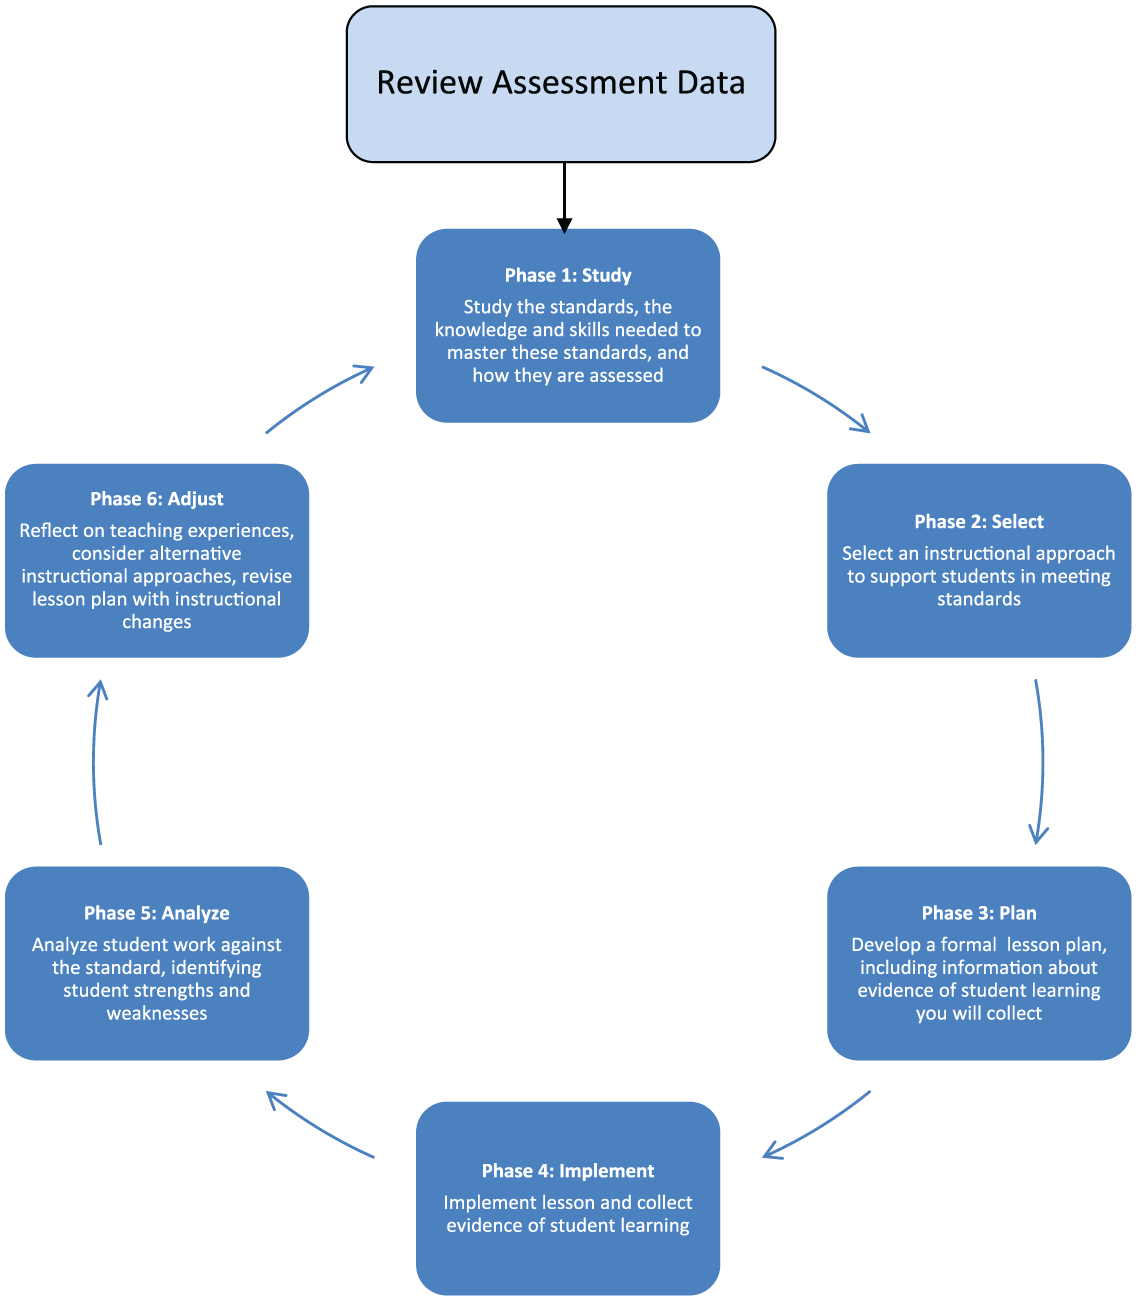
Data inquiry cycle.
When Williams met with Holland to plan the January faculty meeting, Williams explained,
I really want teachers to focus on the parts of the Data Inquiry Cycle where they identify the area that is a challenge for students according to the assessment results, think about how they taught it, and think about what they could do differently.
At the January faculty meeting, Williams announced that they would be working with their grade-level teams the following week to analyze the data from the district’s second interim assessment using the Item Analysis Report (see Table 3). Williams explained, “We are going to look at the percentage of students who got the items related to each standard correct, look at the standards, and then identify what you will reteach to the whole class and small groups.” Then Williams described the recent professional development session she and others from the school had attended on the Data Inquiry Cycle. She explained,
Using this cycle for planning instructional interventions is not a huge jump from what you have already been doing in grade-level teams. You are already looking at data and working with your teams to plan. One thing that would be different is that you might look at data and—as a team—choose to focus on one area that had been challenging for students. Then you would look at strategies and instructional techniques that relate to that weakness, try them out, come back, and see how successful they were.
Teacher teams hold their data meetings
On Monday morning of the following week, Williams and Holland met to plan for the grade-level meetings where teachers would review the students’ interim assessment data. They agreed to have teachers complete the “Item Analysis Report” using their interim assessment data, a tool the teachers had become familiar with over the last year and a half (see Table 3). Williams explained,
This will be used to decide what to reteach. In the next couple of weeks, I want them to really think about who are those students who are really behind, so they can better support them during Enrichment & Intervention time. Those students can start coming to afterschool tutoring too. The end of year test will be here before we know it. We need to really target struggling students.
Williams and Holland wanted grade-level teams to function with less direction from administration, but they believed most teams still needed guidance. Williams planned to work on strengthening teacher leaders to help address school’s loss of English language arts and mathematics coaches, who used to provide one-on-one coaching and facilitate teacher teams. Although the coaches did not have an evaluative role, Holland described most coaches as “forceful.” She noted that teachers breathed a sigh of relief once the coaches left. Now the administrators sat in on grade-level meetings each week and were primarily responsible for facilitating the meetings.
In grade-level meetings that week, most teachers brought their students’ assessment data, which provided details about which items students responded to correctly, the proportion of students who responded to each item correctly, and the state content standard each item was designed to measure. In each meeting, Williams handed out additional copies of the interim assessment scores and a copy of an Item Analysis Report.
In the fourth-grade team meeting, Williams explained, “Let’s start out by filling out the Item Analysis Report and looking at each question for mathematics. You can go across the report and find the question number. The row below that shows the content standard for that question.” Teachers quietly began filling out the sheet with the item numbers and mathematics standards that students answered correct at a rate of more than 80%, 70% to 79%, 60% to 69%, 50% to 59%, and below 50% correct. After about 10 minutes, they began to discuss their results.
Williams started the discussion by saying to the group: “Mainly I would like to focus on the questions that 60% or less got right, so we can focus on reteaching.” A teacher said: “I have two new students who were homeschooled and performed poorly on the assessment.” Holland suggested: “Get them into afterschool tutoring.” Another teacher commented: “Some mistakes showed that they knew the concept but had trouble with the wording. For instance, they thought ‘roast beef’ was two items in a combination math problem.” Another teacher added: “Yeah, I think that confused my students too.” Williams asked: “What was question 11?” A third said: “That was the graphing problem with a grid. The picture made it very difficult to read the graph.” The first teacher noted: “Standard 4.13—probability and statistics—is a definite problem area. I need to review that.” Williams responded: “If you really can see that there are things they should have gotten but didn’t, let’s build in time to reteach for that.” A fourth teacher said: “Can I suggest that the next time we do the E&I schedule, we pull those three to nine students who really need it for reteaching just that standard about probability and statistics?” The first teacher responded: “I have many students from my own class that need reteaching in a different standard. I think it would be too difficult to change the E&I schedule regularly to group students for each standard. We need to think about some things we can do with the whole class.”
As they were running short on time, teachers did not discuss this idea further. The principal closed the meeting by asking teachers to finish filling out the Item Analysis sheet and turn in a copy to her mailbox.
In the next meeting with the first-grade team, the four teachers began filling out their Item Analysis Reports as Williams and Holland looked over the data from the mathematics interim assessment for each class. Williams noticed that most items fell into the 80% to 100% correct column, except four items on the 15-item assessment. She tried to encourage teachers to discuss the four items that seemed to be challenging for students.
Williams: “There were a few of these items—12, 13, 14, 16—that were really low. On the other hand, there was quite a bit of variation between classes. We might talk about differences in how you approached these items.” A teacher responded: “I know on question 12, about number sequence, I want to work on that with the calendar. We can use the calendar to work on which numbers are before and after.” Another teacher commented: “We’re trying to teach them to think sequentially on the number line, but this item is on a hundreds chart. We hadn’t done the hundreds chart yet.” A third teacher chimed in: “I think that calendar idea is a good idea.” Holland added: “I’m going to throw another idea out there. The Big Brains computer program should help students practice this. You can sign up to use it during computer time.”
At the end of this discussion, teachers had shared multiple strategies, but Williams noticed that they did not make specific commitments to try a particular approach or revise previously used approaches. She made a mental note to follow up with this team to see what each teacher decided to implement during E&I time that week. She also wondered if the teachers needed something else, in addition to the Item Analysis Report, to help them talk in more depth about differentiating instruction and new ways to teach mathematics.
Students stuck in intervention
After meeting with each of the grade-level teams, Williams and Holland met to review the schoolwide data and identify any patterns in student performance across the school. Looking through the Item Analysis Reports submitted by the teachers, they noticed students who were identified for “below grade level” intervention were the same students who were consistently recommended for remediation. Those students were always grouped together during E&I time, and they did not seem to be making progress. Teachers had been looking at data in their grade-level team meetings for 2 years, they all had agreed to use these data to inform their work with students, but the same students continued to struggle.
Williams and Holland walked by a first-grade teacher’s classroom and asked how things were going, based on what the team agreed to during their grade-level meeting. “From the data team meeting, we know number sequencing is tough for the kids,” said the first-grade teacher. “During the E&I block I tried practicing sequencing with the calendar, but they still don’t get it. I think I am going to just practice more with the number line, like I was doing before.” When the administrators asked the fourth-grade teachers how they were reviewing probability and statistics with their students, they all seemed to be trying different things, from having students flip coins and roll dice to calculate probabilities to having students calculate averages from sets of numbers. Holland wondered if they needed to be pushing teachers to make decisions about how to teach differently during data team meetings. Williams was exasperated, “Clearly these data team meetings are not having the impact we had hoped.” Williams and Holland committed to spend the following afternoon discussing their next steps for data inquiry in their school.
Teaching Notes
This case is designed to highlight issues related to data inquiry in education, the role of leaders (specifically building-level administrators) in setting conditions for effective data conversations on teams, and the challenge of developing and deepening data use in a school over time. It was created based on interviews with a real elementary school in a district in the southwestern United States; however, all names of places and people are pseudonyms. The case challenges educators to consider how school leaders can create stronger connections between data about student learning and teachers’ instructional decisions.
Data inquiry on educational teams
The work of educators at King Elementary School highlights how difficult it can be to use data to make meaningful improvements in instruction and student learning. School-based practitioners such as teachers and administrators are increasingly expected to use multiple sources of data in their work, a process known as “data use” or “data inquiry” (Coburn & Turner, 2012). This process occurs when teachers define questions of interest, gather sources of student data to address those questions, analyze and communicate their findings from the data, determine instructional next steps, and analyze the results of their actions (Boudett, City, & Murnane, 2013; Hamilton et al., 2009). Due to its importance in school improvement, school leaders increasingly make time for teacher teams to meet collaboratively and engage in data inquiry (Cosner, 2014; Means, Chen, DeBarger, & Padilla, 2011).
Despite increasing awareness of the importance of data inquiry, schools and districts are still building the capacity to lead data work. First, practitioners are transitioning from using data for accountability toward using data for improvement (Mandinach & Gummer, 2016; Mandinach & Jackson, 2012). Data use for improvement requires information beyond summative scores on a statewide or national assessment; it also requires formative and local data that can be used to adapt instruction on an ongoing basis. This involves a forward-looking and results-oriented stance to what might be changed about instruction (Murphy, 2009), rather than simply looking backward to understand how students performed on an assessment (Nelson, Slavit, & Deuel, 2012). Teams might need other tools, such as curriculum objectives or performance standards, to identify students’ needs and the implications for practice (Nelson, Kennedy, Deuel, & Slavit, 2009).
In addition, while many educators use data individually to make instructional decisions, educators are still learning to engage in collaborative data inquiry, or “co-investigating a commonly agreed-upon element of teaching and learning” (Nelson & Slavit, 2008, p. 103). Educators who collaboratively discuss their data have increased opportunities to learn from each other about effective instruction (Horn & Little, 2010; Supovitz, 2002). When teachers collaborate, knowledge and practices that were once private and held by individual teachers become public and shared across a group.
When inquiry cycles become routine, teams use data to explore underlying assumptions, question current practices, and revise their understandings of teaching and learning over time (Boudett et al., 2013; Timperley, 2008). Moreover, well-developed schoolwide data inquiry practices are associated with improved student learning outcomes (Gallimore, Ermeling, Saunders, & Goldenberg, 2009; Saunders, Goldenberg, & Gallimore, 2009; Talbert, Mileva, Chen, Cor, & McLaughlin, 2010). King Elementary’s data inquiry routine is an example of such a practice (see Figure 1).
Opportunities and challenges of leading data teams
Educators often struggle with collaborative data inquiry due to the presence of norms such as individualism and autonomy that persist in schools (Little, 1990; Lortie, 1975). These norms, which affect educators’ mind-sets and practices, hold that one teacher’s instructional practice is just as good as another’s, that teachers should have sole decision-making power over what they do in classrooms, and that teachers make decisions about practice based on personal experience. To be successful with data inquiry, educators must have a shared language or frame of reference for discussing instruction and curriculum (Horn & Little, 2010), as well as trust and collective responsibility for achieving student outcomes (Bryk & Schneider, 2002; Sherer & Spillane, 2011).
Research also suggests teams evolve in their ability to work with data and inquiry. Teams need time to develop an orientation toward raising questions and seeking answers that might test and alter their beliefs about teaching (Nelson et al., 2009). In a longitudinal case study of leadership practice, Sherer and Spillane (2011) observed one school’s assessment routine involving student data. The school required several years of consistently interacting with, modifying, and expanding the practice of the assessment routine to cultivate a culture of continuous improvement.
In addition, teachers move through developmental stages in their data inquiry work (Means, Padilla, & Gallagher, 2010). In the first stage, educators use data primarily to identify students who are having trouble on large-scale assessments and to identify broad areas of need. In the second stage, teachers start to look more closely at the performance of students within their classes to determine content to review or to make differentiated groups. However, in the more advanced stages of data use, teachers use data as a starting point for discussing insights about pedagogy and for planning their instruction—they focus less on what content to teach in favor of how to teach it (Means et al., 2010).
Principal leadership and teacher leadership are crucial to addressing the challenges associated with developing an inquiry-based culture (Talbert et al., 2010). School leaders make key decisions about data use in schools, including conveying the strategy or vision for using data, considering coherence with other reform initiatives, modeling appropriate uses of data, supporting teachers’ capacity to learn about data, and involving teachers as partners in leading collaborative data practices (Cosner, 2014; Supovitz & Klein, 2003). Likewise, school leaders can provide faculty members with support for engaging in conversations about data to build trust and collective responsibility for achieving student outcomes (Sherer & Spillane, 2011).
Educators’ success with data inquiry is also affected by their understanding of how to lead and facilitate effective data team meetings (Talbert et al., 2010). Others have found that trained peer facilitators, inquiry-based discussion protocols, and stable settings where time for inquiry is protected proved critical to inquiry teams’ success (Gallimore et al., 2009; Nelson & Slavit, 2008). Teams’ use of tools to establish and facilitate data-informed conversational routines also matters (Kazemi & Franke, 2004; Sherer & Spillane, 2011). Cosner (2012) identified three types of tools in collaborative inquiry: (a) meeting management tools, such as agendas; (b) discussion and analysis tools, such as protocols and rubrics; and (c) team monitoring tools, such as goal-setting and progress-monitoring records. King Elementary School’s Item Analysis Report is an example of such a tool (see Table 3). Tools help provide structure and focus to data analysis work, and they also support teachers’ attempts to make their classroom practice visible to others. Without specific tools such as agendas or protocols, previous researchers have concluded that teachers rarely share their instructional thinking in detail with one another or with school leaders (Levine & Marcus, 2010).
However, even tools designed to support data use can constrain educators’ opportunities for learning. For example, teams benefit from flexible and creative use of discussion protocols, modifying them for local purposes, rather than adhering too strictly to their originally designed structure (Little, Gearhart, Curry, & Kafka, 2003). Similarly, if team members do not have the requisite background information to engage with a discussion protocol, the protocol can have little value (Levine & Marcus, 2010). Furthermore, the quality of data and tools (e.g., their specificity, clarity, alignment, and guidance regarding learning goals for students) will reflect whether teams feel supported or frustrated in their attempts to improve teaching and learning (Kazemi & Franke, 2004; Nelson, Deuel, Slavit, & Kennedy, 2010; Sherer & Spillane, 2011). Thus, which data and tools are referred to during team discussions and how they are used may shape the development of instructional conversations in teams. At King Elementary School, Principal Williams was considering a change in the tools they used to support data inquiry.
Discussion Questions
How do the administrators in this case organize the work of teacher teams and how do they establish the purpose of that work?
In your opinion, what is the main reason why students are not moving out of intervention groups at King Elementary? Explain the evidence to support your rationale.
If you were giving advice to the administrators about their next steps, what actions would you recommend and why?
What does “data inquiry” mean to the administrators? What does it mean to the teachers?
Does the Item Analysis Report help teachers to change their instruction to address students’ learning needs? Why or why not? What other tools do the grade-level teams need to be successful?
Class Activity
In this proposed activity, students will begin by making a decision about how they would rate the success of data inquiry at King Elementary. Students respond to the following prompt: “On a scale of 1-5, with 1 being low and 5 being high, how would you rate the success of the data inquiry discussions at King Elementary?” Each student will make a choice for how data inquiry discussions at the school should be ranked and then discuss their decisions as a group.
Ask students to volunteer to discuss why they selected the rating they chose. Start with students who have reasons for selecting 1 and reasons for 5. Consider writing the reasons for 1 and 5 on a board or chart paper. Ask students to describe characteristics they would expect to see and hear in data inquiry meetings at each level of development from 1 to 5. Last, have students discuss their recommendations to the King Elementary administrators to move the school to a higher level (e.g., from a 1 to a 3).
Field-Based Activity
Observe a data inquiry meeting at a school site. Take notes about the focus of the conversation (e.g., identifying students in need, identifying difficult content, planning for review or differentiated student groups, discussing changes in how teachers approach instruction). What does this evidence tell you about the connection between data and instruction? What action could you take as an instructional leader to strengthen this connection?
Footnotes
Declaration of Conflicting Interests
The author(s) declared no potential conflicts of interest with respect to the research, authorship, and/or publication of this article.
Funding
The author(s) received no financial support for the research, authorship, and/or publication of this article.