
Abstract
Background:
Preterm infants fed human milk (HM) require additional calories and nutrients, as unfortified HM alone is inadequate to support optimal growth and body composition. Fortification methods have evolved to include targeted fortification (TF), based on measured macronutrient content of HM, rather than standard fortification (SF), which relies on assumed HM composition. The energy, protein-to-energy ratio, and macronutrient content of HM influence fat mass (FM) and fat-free mass (FFM) accretion, key factors for neurodevelopment and long-term metabolic health. This narrative literature review evaluated the impact of TF versus SF on body composition among preterm infants.
Methods and Materials:
A literature search of PubMed, CINAHL, and Google Scholar was conducted for original research published since 2015. Articles were screened for relevance, and reference lists were reviewed to identify additional studies. Articles were included through August 2025.
Results:
Of 177 records identified, 17 full-text articles were screened, and 6 were included. TF methods and HM analysis protocols varied across studies. Four studies reported differences in body composition and growth outcomes from TF; only two found significant differences between groups.
Conclusions:
Current evidence does not consistently demonstrate a benefit of TF over SF for body composition outcomes in preterm infants. Findings across studies are inconsistent, and observed benefits were associated with complex TF protocols. This review provides suggestions based on limited evidence for clinical implementation when TF is utilized. Further research is needed to clarify the impact of TF on body composition and growth outcomes.
Introduction
Human milk (HM) is the recommended enteral feeding choice for all infants, including those born preterm (<37 weeks gestational age) or weighing <1,500 g.1–4 However, unfortified HM, whether mother’s own or donor, often does not provide sufficient energy and nutrients to support the expected intrauterine growth trajectory of 15–20 g/kg/day in weight gain and 1 cm/week in length and head circumference for preterm infants <2,000 g.3,5,6 As a result, preterm infants fed unfortified HM are at risk for postnatal growth failure, commonly defined as a decline in weight z-score > –1 standard deviation (SD) from birth7,8 or a decline > –1 to > –2 SD from birth through discharge.8,9 These criteria align with the malnutrition indicators for preterm infants in which weight z-score declines of 0.8–1.2 SD reflect mild, >1.2–2 SD moderate, and >2 SD severe malnutrition.10,11
Beyond growth faltering, at birth and at term-equivalent age, preterm infants also exhibit different body composition compared with term infants, characterized by lower fat-free mass (FFM),9,12–15 lower fat mass (FM),12,15,16 a reduced FM-to-FFM ratio, 16 and greater central adiposity. 9 Findings on percent body fat at term age are inconsistent, with some studies reporting higher12–14 and others lower values, 16 yet overall body fat percentage differs from that of term-born infants. Evidence highlights the importance of protein intake relative to energy: higher protein-to-energy ratio (PER) and protein-to-carbohydrate ratios are associated with greater FFM accretion.15,17,18 An enteral PER of 2.8–3.6 g/100 kcal is considered optimal for preterm infants, with higher ratios associated with greater weight and FFM accretion. 4 Importantly, FFM, not overall weight gain, is more strongly associated with improved neurodevelopment, highlighting the critical role of nutrient balance early in life. 19
The nutrient content of HM is dynamic, with macronutrient composition varying within feedings, throughout the day, by lactation stage, by milk volume, and by lactation duration. 20 Meta-analysis indicates that in the first week of life preterm HM provides an average of 60 kcal and 2.2 g protein per 100 mL; 21 however, protein concentrations decrease on average to 1.4 g per 100 mL by three weeks and to 1.0 g per 100 mL by 10 weeks, providing only 1.6 g protein/kg/day and 106 kcal/kg/day at an intake of 160 mL/kg/day.2,21 In contrast, consensus guidelines recommend 110–130 kcal/kg/d and 3.5–4.5 g/kg/d protein to support preterm infant growth targets. 2 Moreover, unfortified HM is low in key micronutrients important for growth, including sodium, calcium, phosphorus, and iron, relative to estimated needs. 2 Consequently, the Committee on Nutrition of the European Society of Pediatric Gastroenterology, Hepatology and Nutrition (ESPGHAN), American Academy of Pediatrics (AAP), Academy of Nutrition and Dietetics (AND), and European Milk Bank Association (EMBA) recommend fortifying HM feedings for all preterm infants weighing <1,500 g to achieve adequate growth.3,5,6,22
Nutrient delivery in HM-fed preterm infants is generally estimated using reference values for preterm, term, or donor HM, along with the additional contribution of human milk fortifier (HMF) or modular products. 23 Standard fortification (SF), which adds a fixed dose of HMF to a set HM volume (e.g., 5 mL liquid HMF to 25 mL HM), estimates nutrient intake based on the assumed composition of HM. 23 However, true nutrient delivery from SF, particularly for protein, often falls short, with deficits averaging 0.5–0.7 g/kg/day and up to 1.5 g/kg/day. 24 Since protein is a major driver of linear growth and FFM accretion,9,23 strategies that account for actual HM composition may better address these gaps.
To optimize HM composition, targeted fortification (TF) involves analyzing HM at least weekly for macronutrient and energy content, enabling fortification to reflect the actual rather than assumed composition. 23 This approach helps ensure nutrient provision more closely aligns with recommended targets, particularly for protein, thereby supporting growth and body composition outcomes in preterm infants. 23 Historically, HM analyzers were available only to researchers or large milk banks; however, they have become more accessible for use in clinical care in the neonatal intensive care unit (NICU). 23 Although infrared spectroscopy (IRS) devices for HM analysis have been validated,25–27 and one is approved for clinical use in the United States, 27 a recent NICU survey found limited adoption: of 119 US NICUs, only 13 had access to analyzers, two used them clinically, and none implemented TF. 27
Because anthropometrics alone do not capture growth quality, body composition offers a more accurate measure of FM and FFM accretion, outcomes closely tied to both short- and long-term health. 12 Poor linear growth and altered body composition are associated with adverse neurodevelopmental and growth outcomes, 10 while excessive energy intake and rapid accumulation of FM increase the risk of later obesity, 28 insulin resistance, 29 hypertension, 29 and cardiovascular disease. 29 In contrast, greater FFM accretion is associated with positive neurodevelopmental outcomes,9,30,31 with higher FFM z-scores in the NICU and at discharge predicting better Bayley-III scores at 12 and 24 months corrected age. 18 Since adequate PER intake supports optimal weight, linear growth, FM, and FFM accretion,19,23 evaluating the impact of TF compared to SF on body composition may inform strategies to optimize nutrition protocols and improve long-term outcomes in preterm infants. Therefore, the purpose of this narrative literature review is to investigate the impact of HM feedings with TF compared to SF on body composition by the time of hospital discharge among preterm infants born <37 weeks gestational age.
Methods
An initial literature search was conducted in September of 2022, which was repeated in August 2025, in the PubMed, CINAHL, and Google Scholar databases for original research studies published in English since 2015 meeting the following inclusion criteria: (1) hospitalized preterm infants born <37 weeks gestational age, (2) enteral nutrition (EN) feeding with HM requiring fortification, (3) TF feeding intervention based on HM analysis, and (4) growth outcomes measurements including assessment of body composition. Search terms used included premature infants, preterm infants, fortification, TF, protein, body composition, and growth. Studies that evaluated TF but did not measure body composition were excluded, as were studies that evaluated the effect of enhanced HM fortification on body composition but did not analyze HM samples for the intervention group. This study was designed as a narrative literature review to synthesize and contextualize the current evidence on targeted HM fortification, rather than to conduct a formal systematic review. A narrative approach was selected to provide a timely, clinically relevant overview of a heterogeneous and evolving evidence base, particularly in the context of ongoing systematic review efforts.
The literature search, depicted in Figure 1, shows an initial database return of 177 records along with one additional record identified by hand citation search. From these records, 34 duplicates were removed, and 143 records were screened; 127 were excluded based on title and abstract screening, leaving 17 studies available for assessment. Of the 17 studies assessed for eligibility, 11 were excluded (n = 7 did not report body composition outcome measurements; n = 2 publications of study protocols; n = 1 did not meet study design inclusion criteria; n = 1 did not meet intervention inclusion criteria), leaving six studies selected for inclusion in this review. The primary author graded the quality of each article according to the AND Quality Criteria Checklist for Primary Research, 32 which was reviewed and agreed upon by all members of the research team.
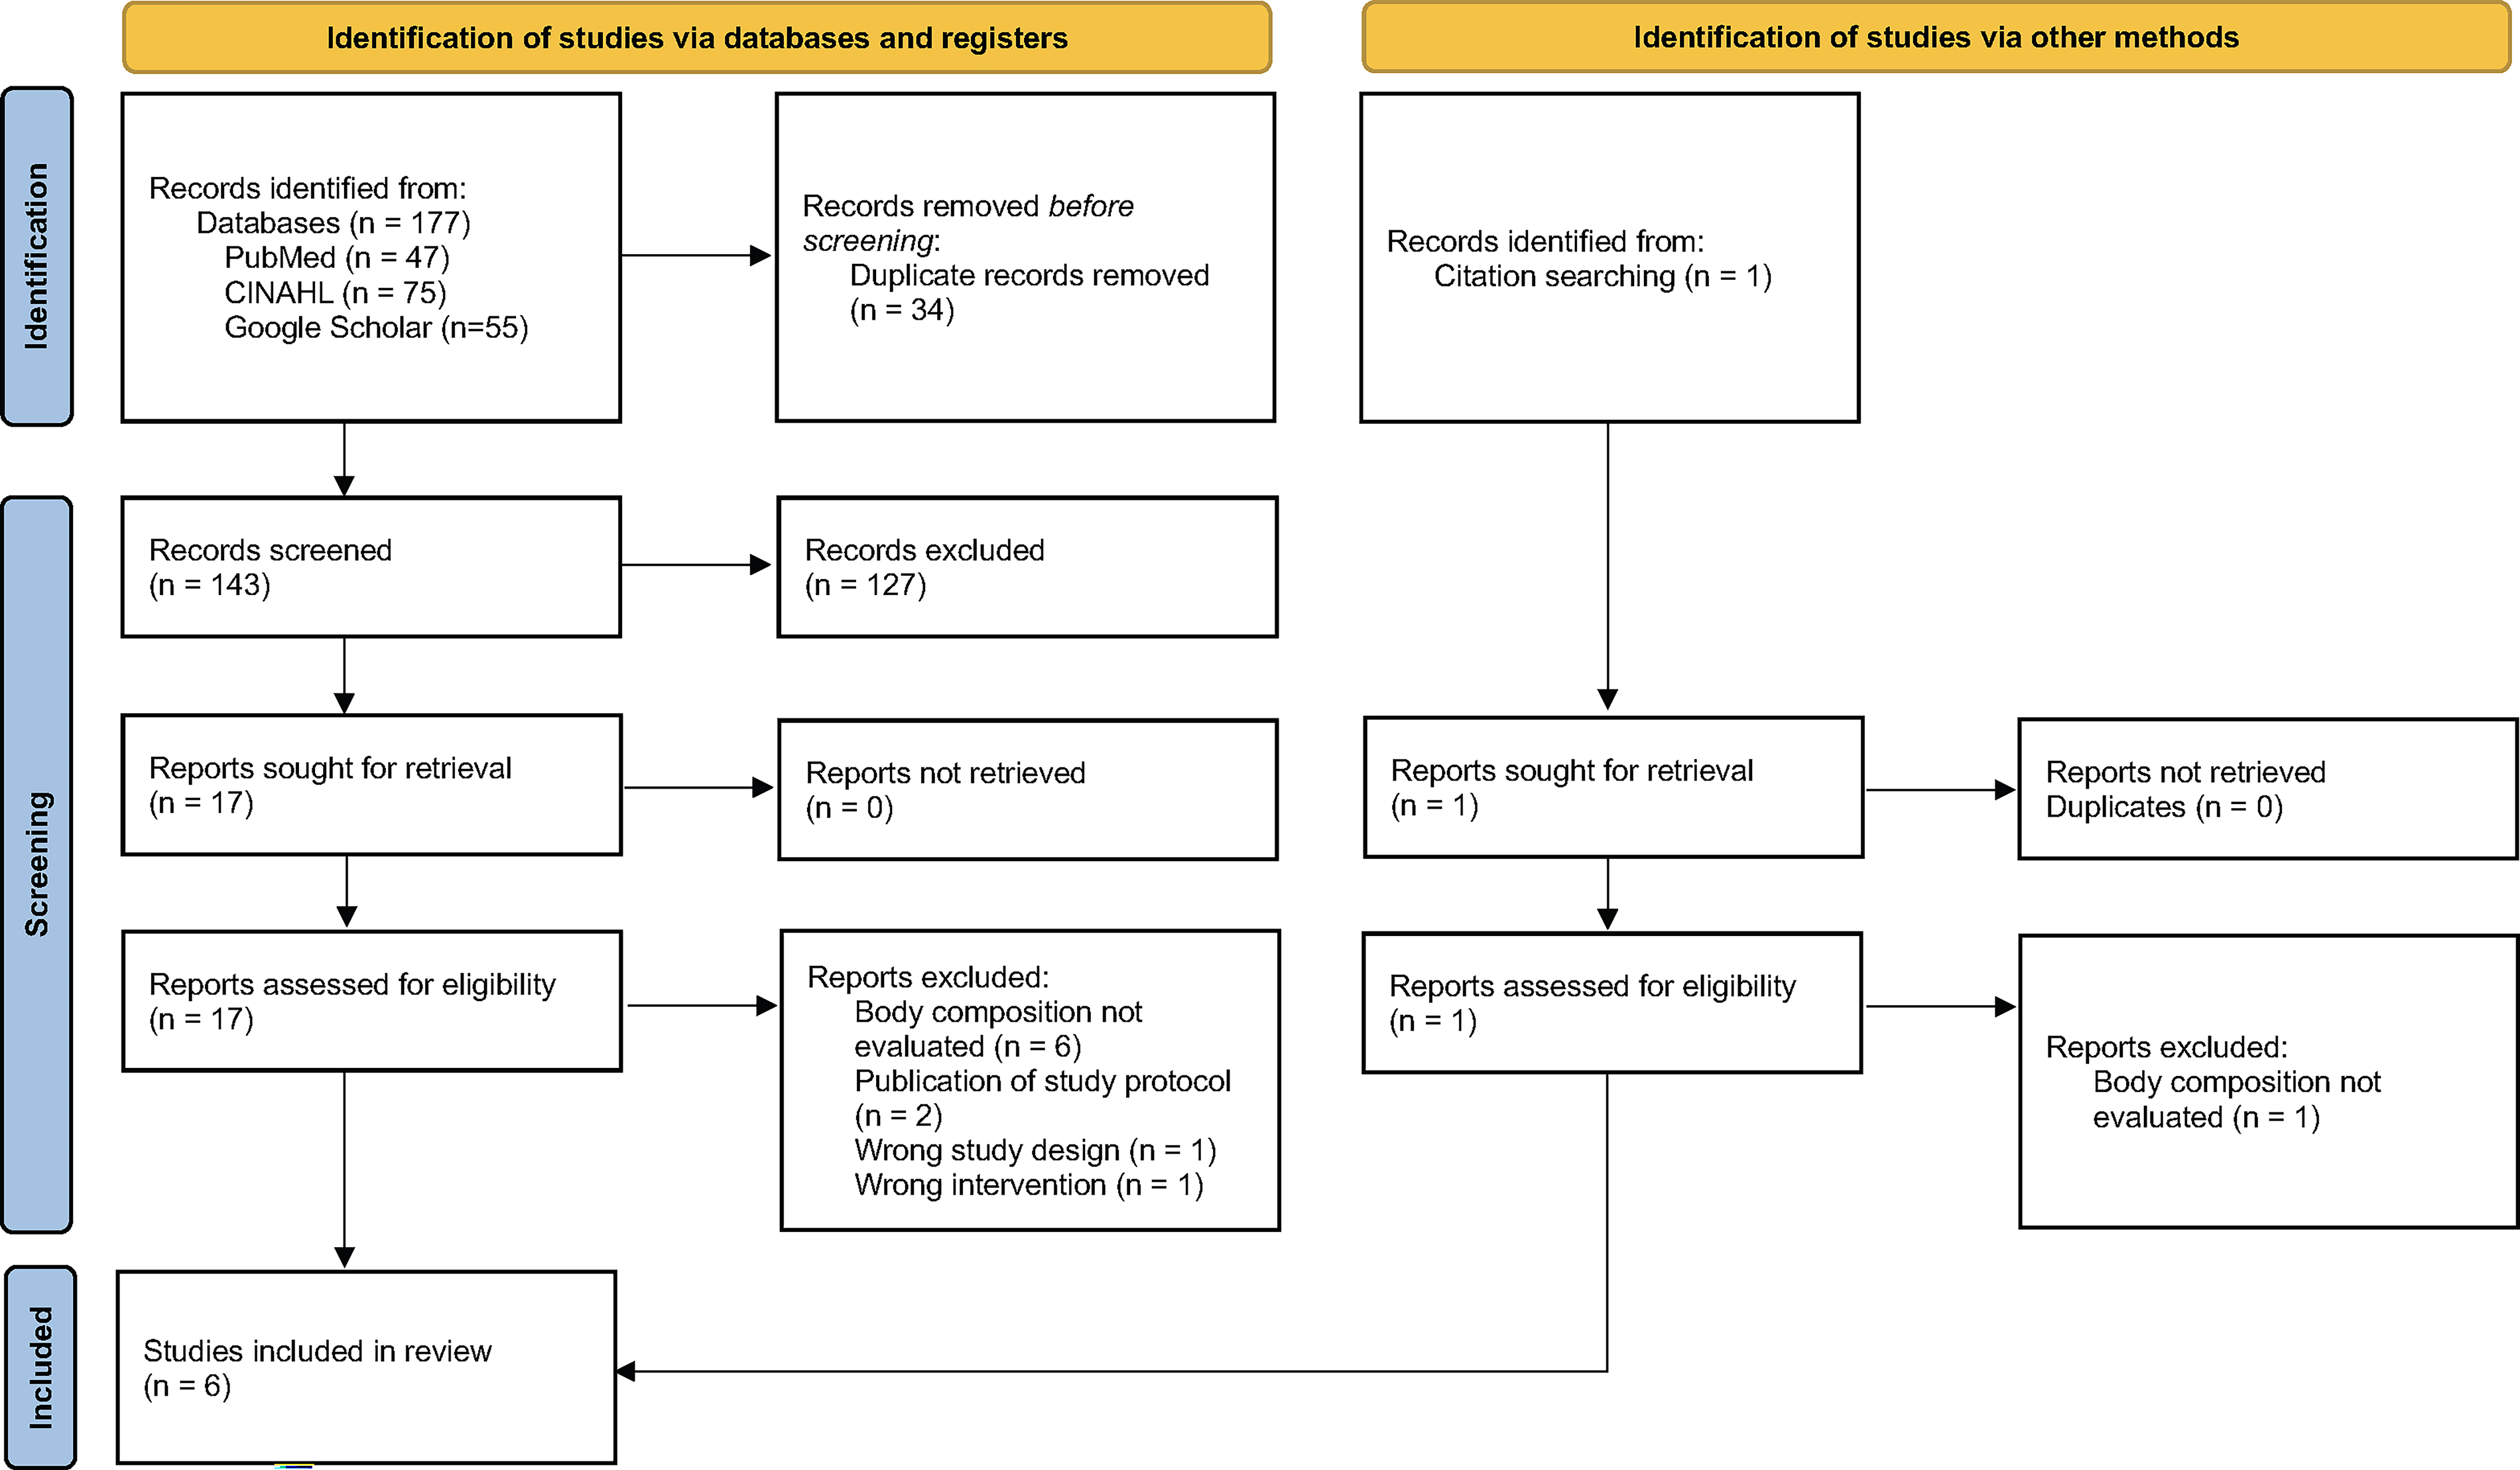
Flow diagram of study selection process.
Results
The six primary research studies were published between 2016 and 2023 and included five randomized controlled trials (RCTs) and one mixed cohort study investigating growth outcomes, including body composition, of preterm infants born <33 weeks gestational age fed an EN diet of HM fortified with a standard fixed nutrient level or a targeted nutrient level based on HM analysis.33–38 A summary of the study characteristics and outcome measurements is presented in Table 1. HM analysis and fortification interventions are presented in Table 2, which shows that the studies varied in their interpretation of SF and/or TF, the timing and method of HM analysis, the products used for fortification, and the timing of initiation and advancement of fortification.33–38
Overview of Study Characteristics
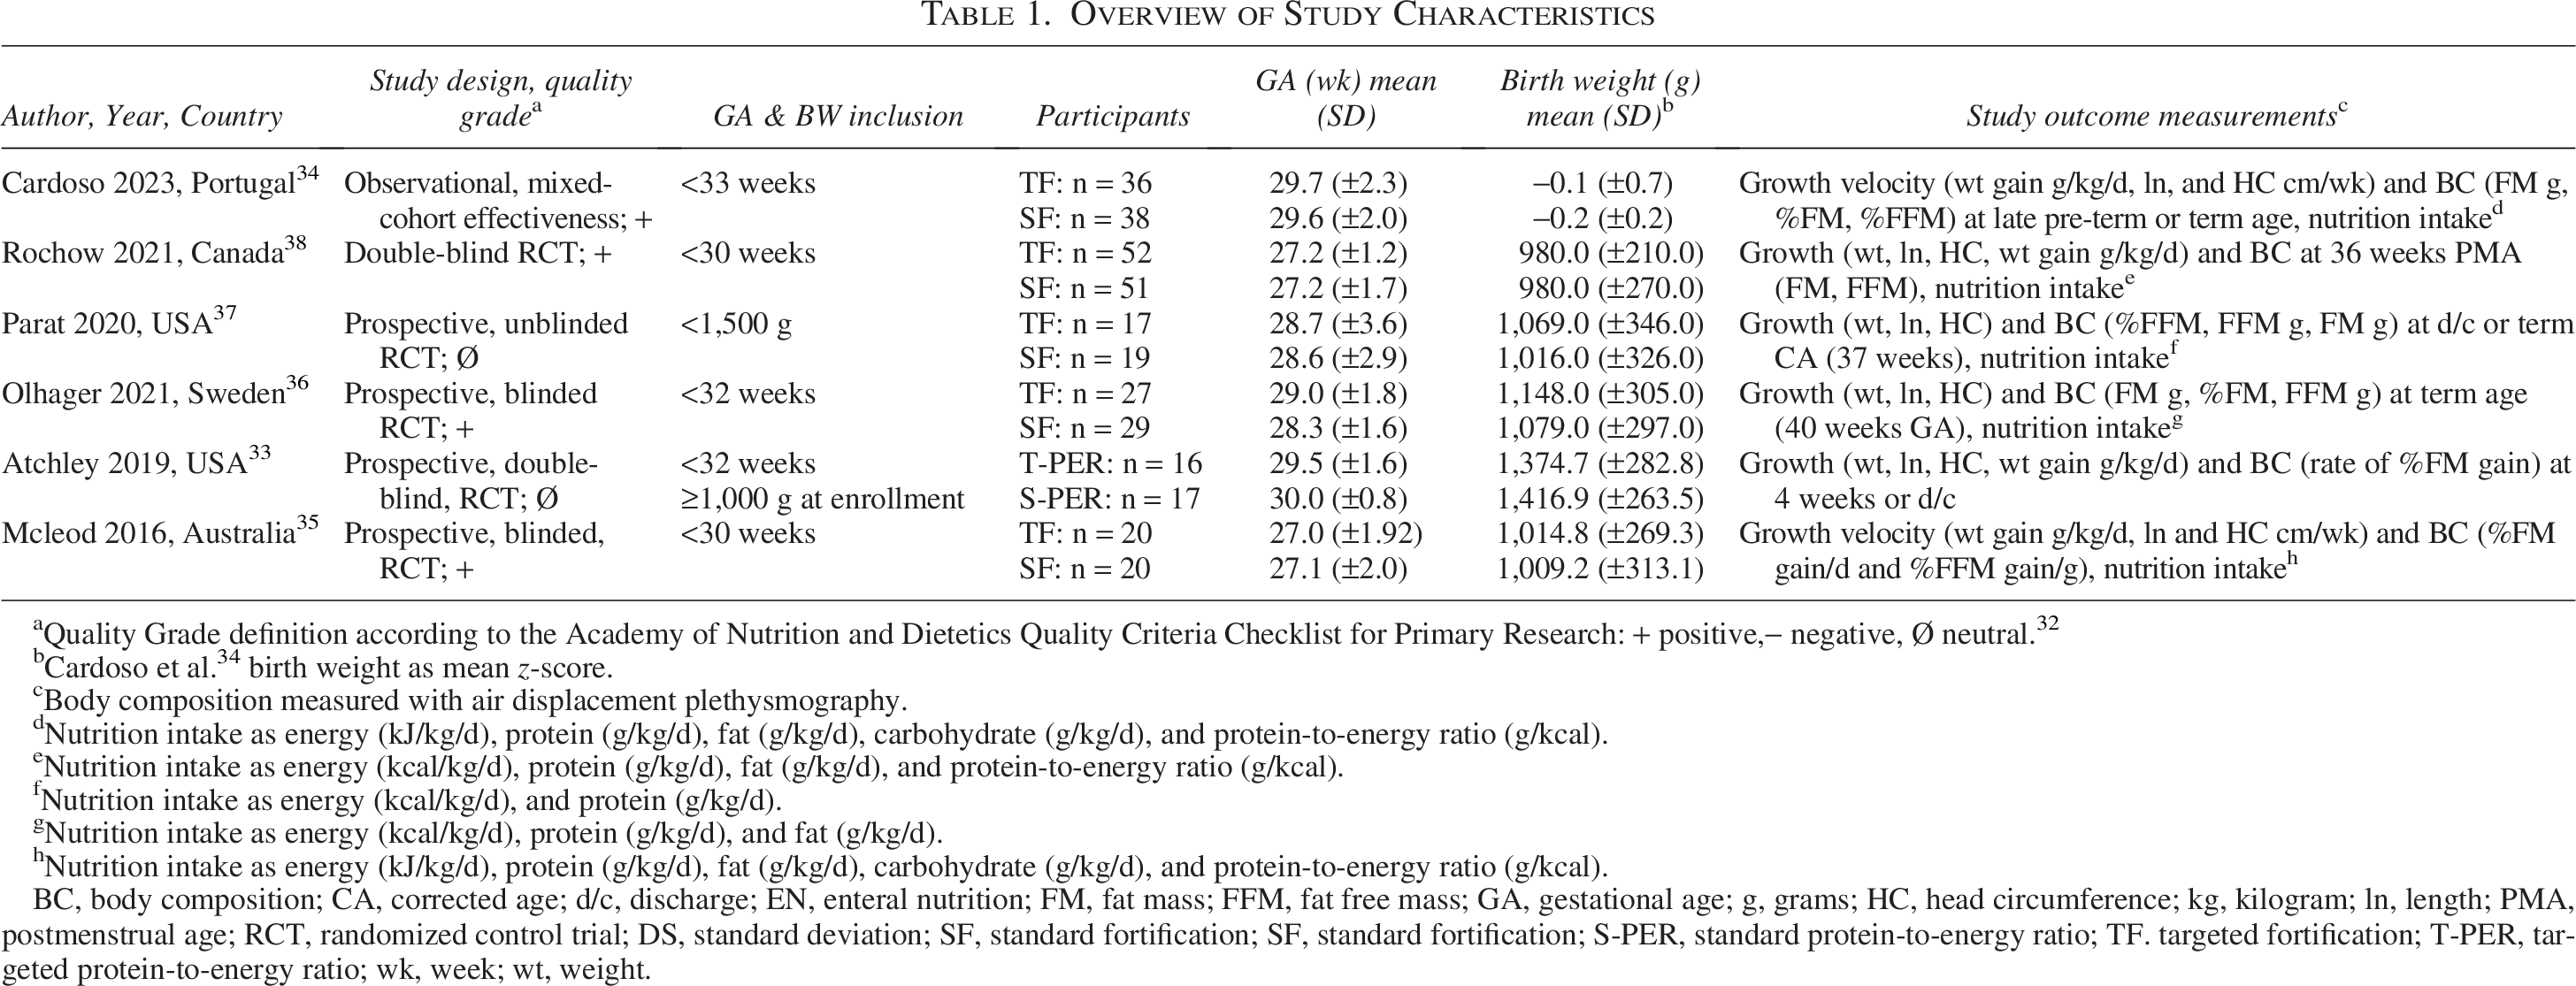
Quality Grade definition according to the Academy of Nutrition and Dietetics Quality Criteria Checklist for Primary Research: + positive,− negative, Ø neutral. 32
Cardoso et al. 34 birth weight as mean z-score.
Body composition measured with air displacement plethysmography.
Nutrition intake as energy (kJ/kg/d), protein (g/kg/d), fat (g/kg/d), carbohydrate (g/kg/d), and protein-to-energy ratio (g/kcal).
Nutrition intake as energy (kcal/kg/d), protein (g/kg/d), fat (g/kg/d), and protein-to-energy ratio (g/kcal).
Nutrition intake as energy (kcal/kg/d), and protein (g/kg/d).
Nutrition intake as energy (kcal/kg/d), protein (g/kg/d), and fat (g/kg/d).
Nutrition intake as energy (kJ/kg/d), protein (g/kg/d), fat (g/kg/d), carbohydrate (g/kg/d), and protein-to-energy ratio (g/kcal).
BC, body composition; CA, corrected age; d/c, discharge; EN, enteral nutrition; FM, fat mass; FFM, fat free mass; GA, gestational age; g, grams; HC, head circumference; kg, kilogram; ln, length; PMA, postmenstrual age; RCT, randomized control trial; DS, standard deviation; SF, standard fortification; SF, standard fortification; S-PER, standard protein-to-energy ratio; TF. targeted fortification; T-PER, targeted protein-to-energy ratio; wk, week; wt, weight.
Overview of Study Standard and Targeted Fortification Interventions, Human Milk Analysis Protocols and Daily Nutrition Goals
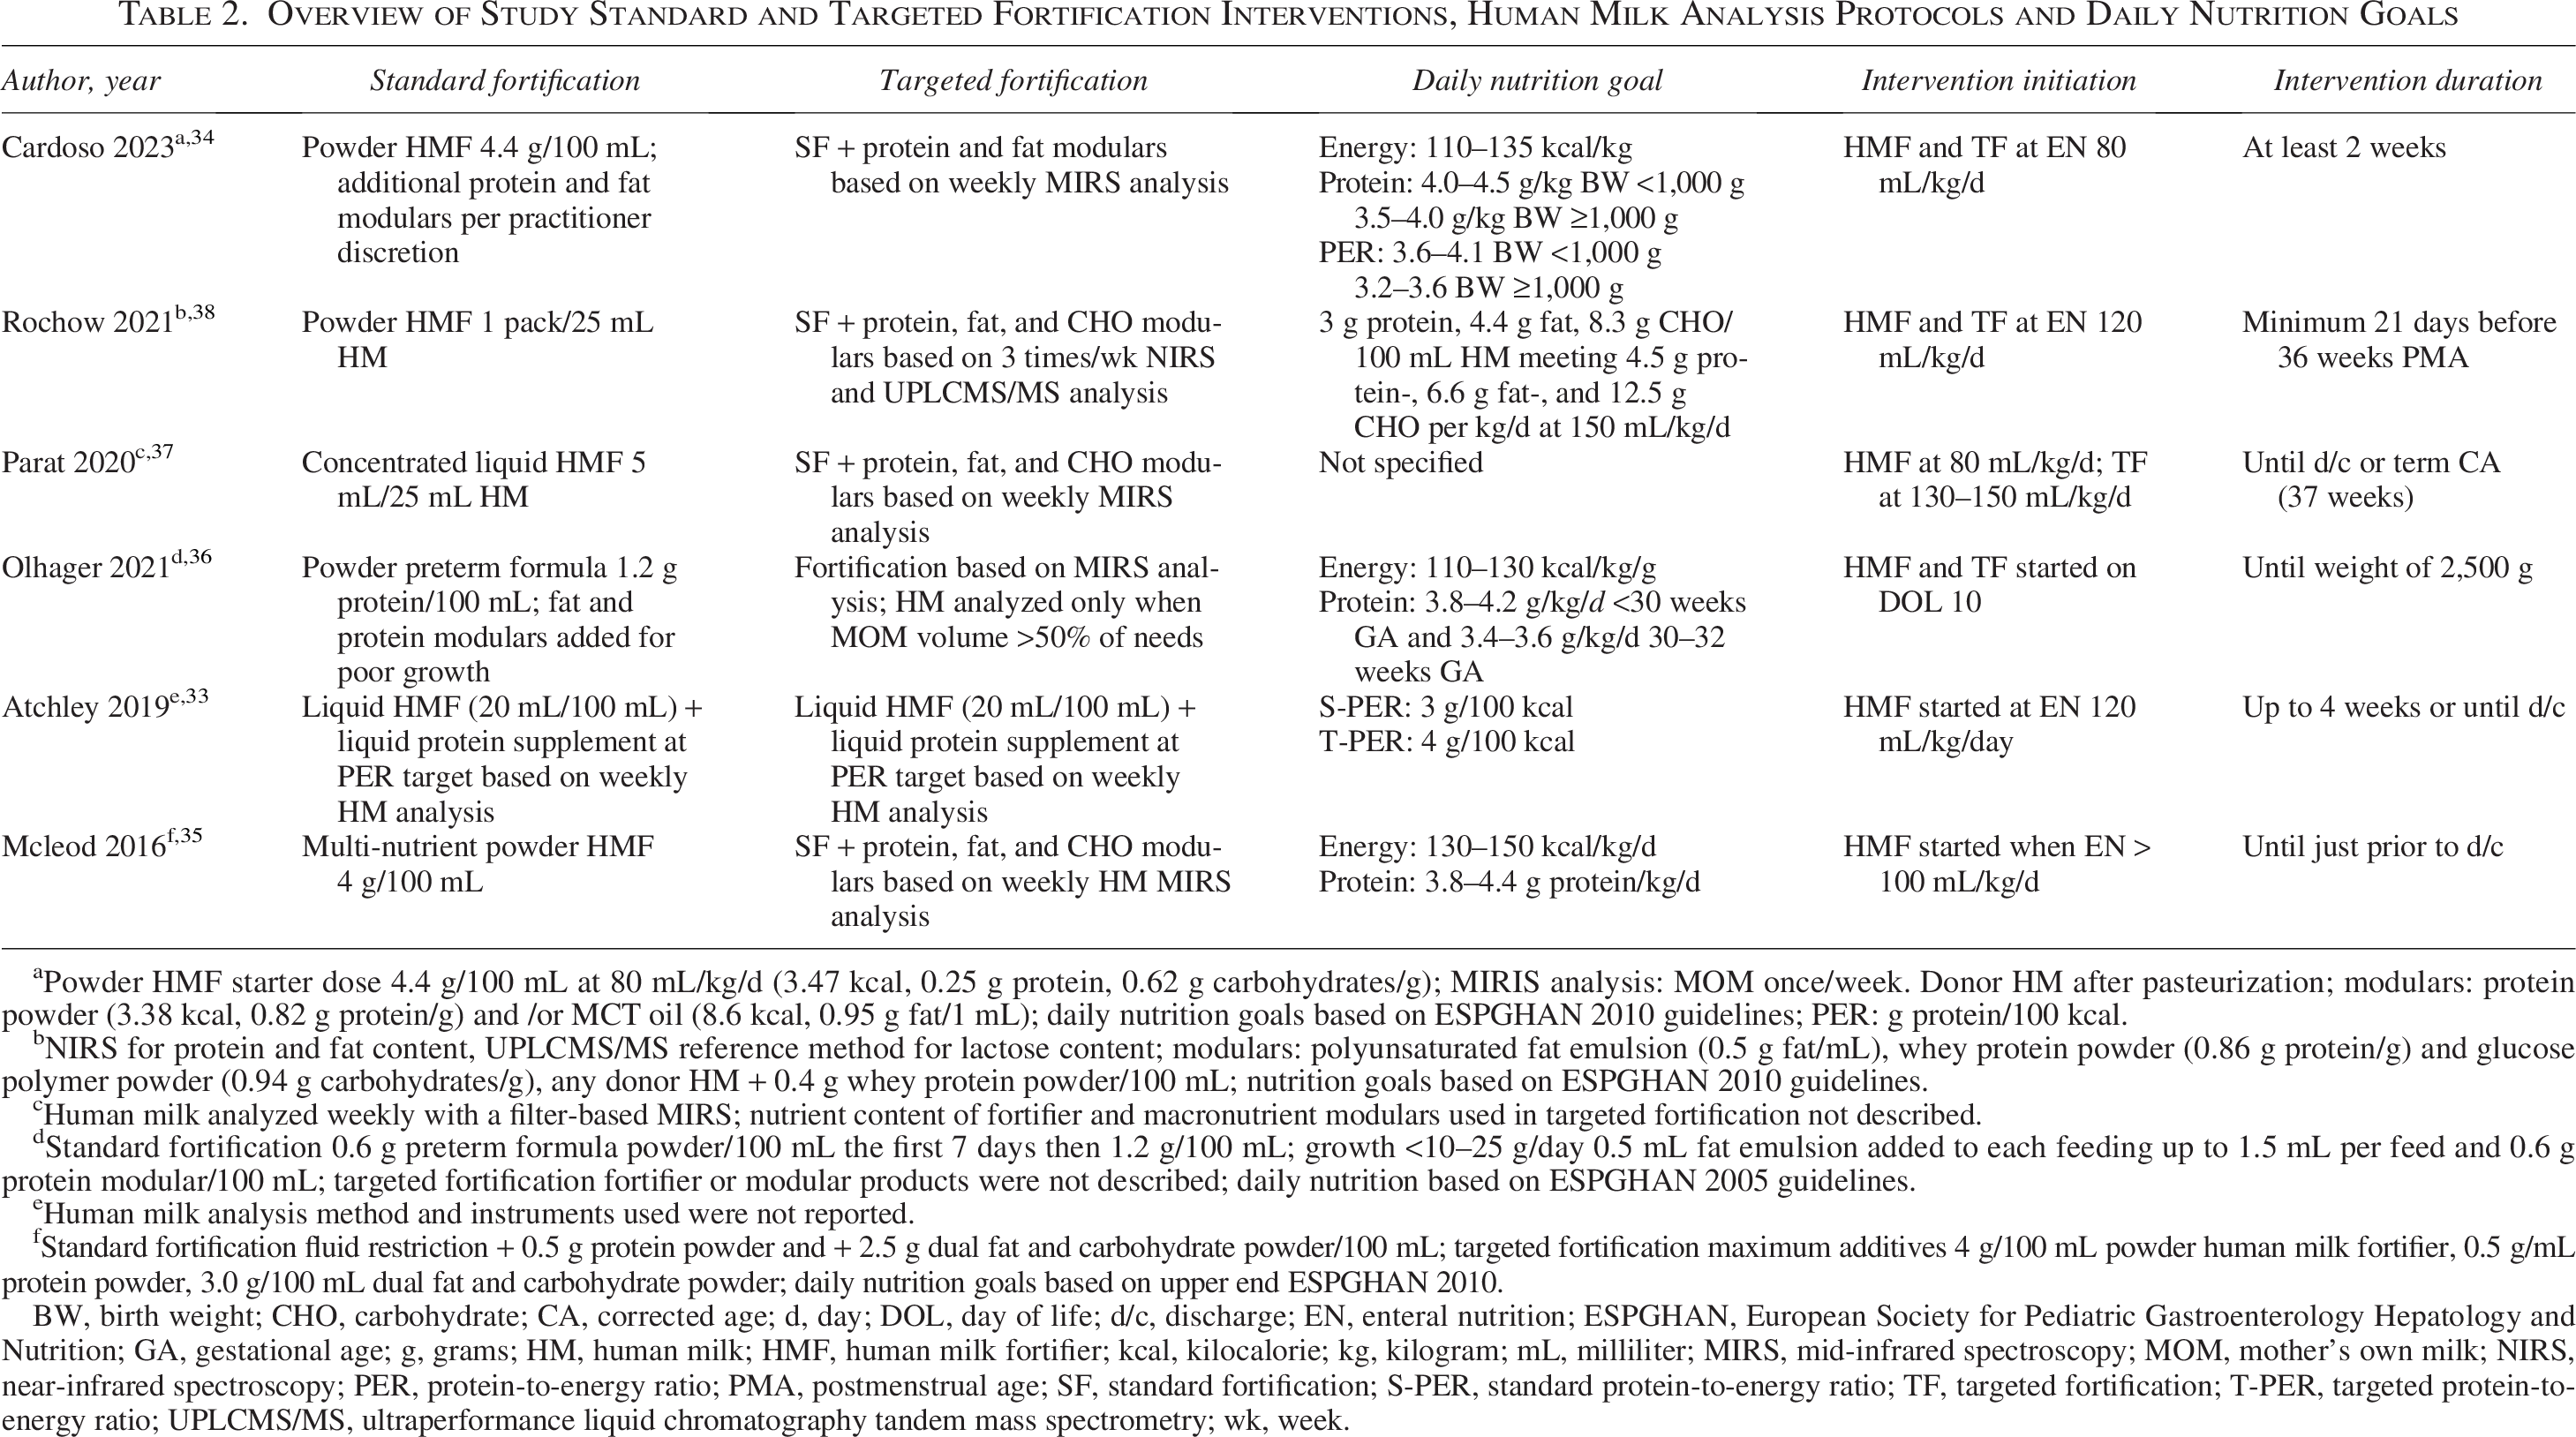
Powder HMF starter dose 4.4 g/100 mL at 80 mL/kg/d (3.47 kcal, 0.25 g protein, 0.62 g carbohydrates/g); MIRIS analysis: MOM once/week. Donor HM after pasteurization; modulars: protein powder (3.38 kcal, 0.82 g protein/g) and /or MCT oil (8.6 kcal, 0.95 g fat/1 mL); daily nutrition goals based on ESPGHAN 2010 guidelines; PER: g protein/100 kcal.
NIRS for protein and fat content, UPLCMS/MS reference method for lactose content; modulars: polyunsaturated fat emulsion (0.5 g fat/mL), whey protein powder (0.86 g protein/g) and glucose polymer powder (0.94 g carbohydrates/g), any donor HM + 0.4 g whey protein powder/100 mL; nutrition goals based on ESPGHAN 2010 guidelines.
Human milk analyzed weekly with a filter-based MIRS; nutrient content of fortifier and macronutrient modulars used in targeted fortification not described.
Standard fortification 0.6 g preterm formula powder/100 mL the first 7 days then 1.2 g/100 mL; growth <10–25 g/day 0.5 mL fat emulsion added to each feeding up to 1.5 mL per feed and 0.6 g protein modular/100 mL; targeted fortification fortifier or modular products were not described; daily nutrition based on ESPGHAN 2005 guidelines.
Human milk analysis method and instruments used were not reported.
Standard fortification fluid restriction + 0.5 g protein powder and + 2.5 g dual fat and carbohydrate powder/100 mL; targeted fortification maximum additives 4 g/100 mL powder human milk fortifier, 0.5 g/mL protein powder, 3.0 g/100 mL dual fat and carbohydrate powder; daily nutrition goals based on upper end ESPGHAN 2010.
BW, birth weight; CHO, carbohydrate; CA, corrected age; d, day; DOL, day of life; d/c, discharge; EN, enteral nutrition; ESPGHAN, European Society for Pediatric Gastroenterology Hepatology and Nutrition; GA, gestational age; g, grams; HM, human milk; HMF, human milk fortifier; kcal, kilocalorie; kg, kilogram; mL, milliliter; MIRS, mid-infrared spectroscopy; MOM, mother’s own milk; NIRS, near-infrared spectroscopy; PER, protein-to-energy ratio; PMA, postmenstrual age; SF, standard fortification; S-PER, standard protein-to-energy ratio; TF, targeted fortification; T-PER, targeted protein-to-energy ratio; UPLCMS/MS, ultraperformance liquid chromatography tandem mass spectrometry; wk, week.
The variety of EN products serving as the base HMF consisted of commercially available powder multi-nutrient HMF,34,35,38 commercially available concentrated liquid multi-nutrient HMF,33,37 and powdered preterm formula. 36 Additional macronutrient modular products were used in all studies to meet the TF nutrition intake goals as follows: two studies used liquid protein;33,37 three used whey protein powder;34,35,38 three used fat emulsion;35,36,38 one used carbohydrate powder; 38 and one used a dual-energy fat plus carbohydrate powder. 35 One study initiated HMF as early as on day of life 11, 36 three studies started HMF at an EN volume of 80 mL/kg/d,34,37,38 one study initiated at 100 mL/kg/day, 35 and one waited until an EN volume of 120 mL/kg/day. 33 Two studies began the TF protocol on the first day of fortification33,38 while the other four studies started all TF participants on the SF protocol before advancing to individualized recipes.35,37,38 The estimated daily nutrition intake is presented in Table 3.
Summary of Estimated Macronutrient Intake by Fortification Group during the Intervention Period
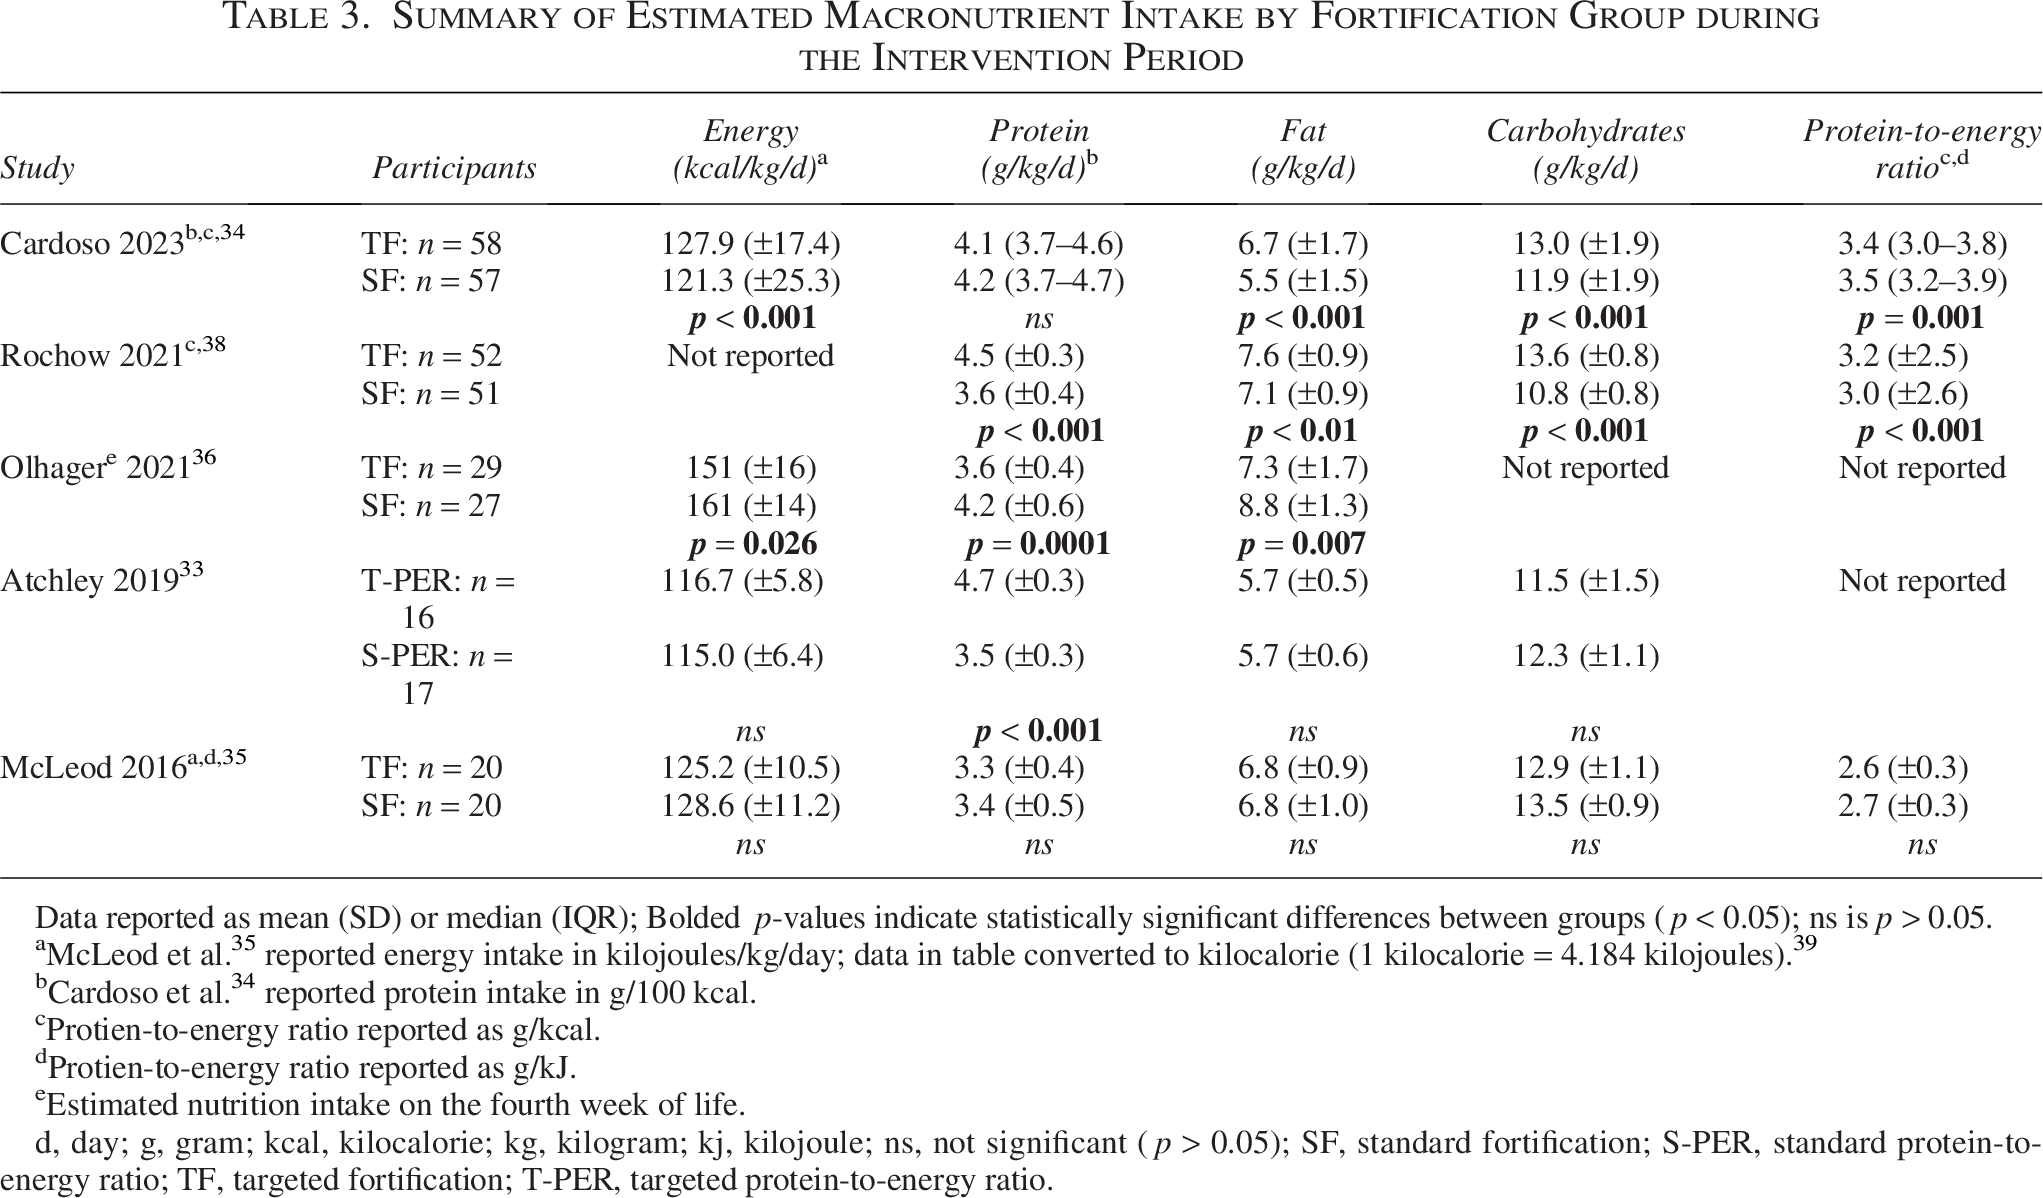
Data reported as mean (SD) or median (IQR); Bolded p-values indicate statistically significant differences between groups (p < 0.05); ns is p > 0.05.
McLeod et al. 35 reported energy intake in kilojoules/kg/day; data in table converted to kilocalorie (1 kilocalorie = 4.184 kilojoules). 39
Cardoso et al. 34 reported protein intake in g/100 kcal.
Protien-to-energy ratio reported as g/kcal.
Protien-to-energy ratio reported as g/kJ.
Estimated nutrition intake on the fourth week of life.
d, day; g, gram; kcal, kilocalorie; kg, kilogram; kj, kilojoule; ns, not significant (p > 0.05); SF, standard fortification; S-PER, standard protein-to-energy ratio; TF, targeted fortification; T-PER, targeted protein-to-energy ratio.
A summary of body composition and growth outcomes is presented in Table 4. All studies evaluated body composition using air-displacement plethysmography and allowed the use of donor HM when the volume of mother’s own milk was insufficient to meet the daily EN prescription.33–38 Samples of unfortified mother’s own milk were analyzed for energy and macronutrient content at least weekly in all studies, and the results were used to calculate TF recipes.33–38 One study performed HM analysis anytime the daily volume of expressed mother’s own milk met >50% of the participants’ daily volume needs, 36 and one study performed HM analysis three times per week. 38 Four studies used a mid-IRS analyzer,35–38 one used a near-IRS analyzer in conjunction with ultraperformance liquid chromatography tandem mass spectrometry to evaluate lactose content, 38 and one study did not describe the method or instrument used for HM analysis 33 (Table 2). All studies utilized donor HM when mother’s own milk was unavailable, and analysis methods varied across studies (Table 2), including analysis by the milk bank (timing not reported), 33 after pasteurization, 34 once per batch, 37 weekly, 35 and three times per week, 38 while one study used assumed macronutrient values. 36
Overview of Study Anthropometric and Body Composition Outcomes
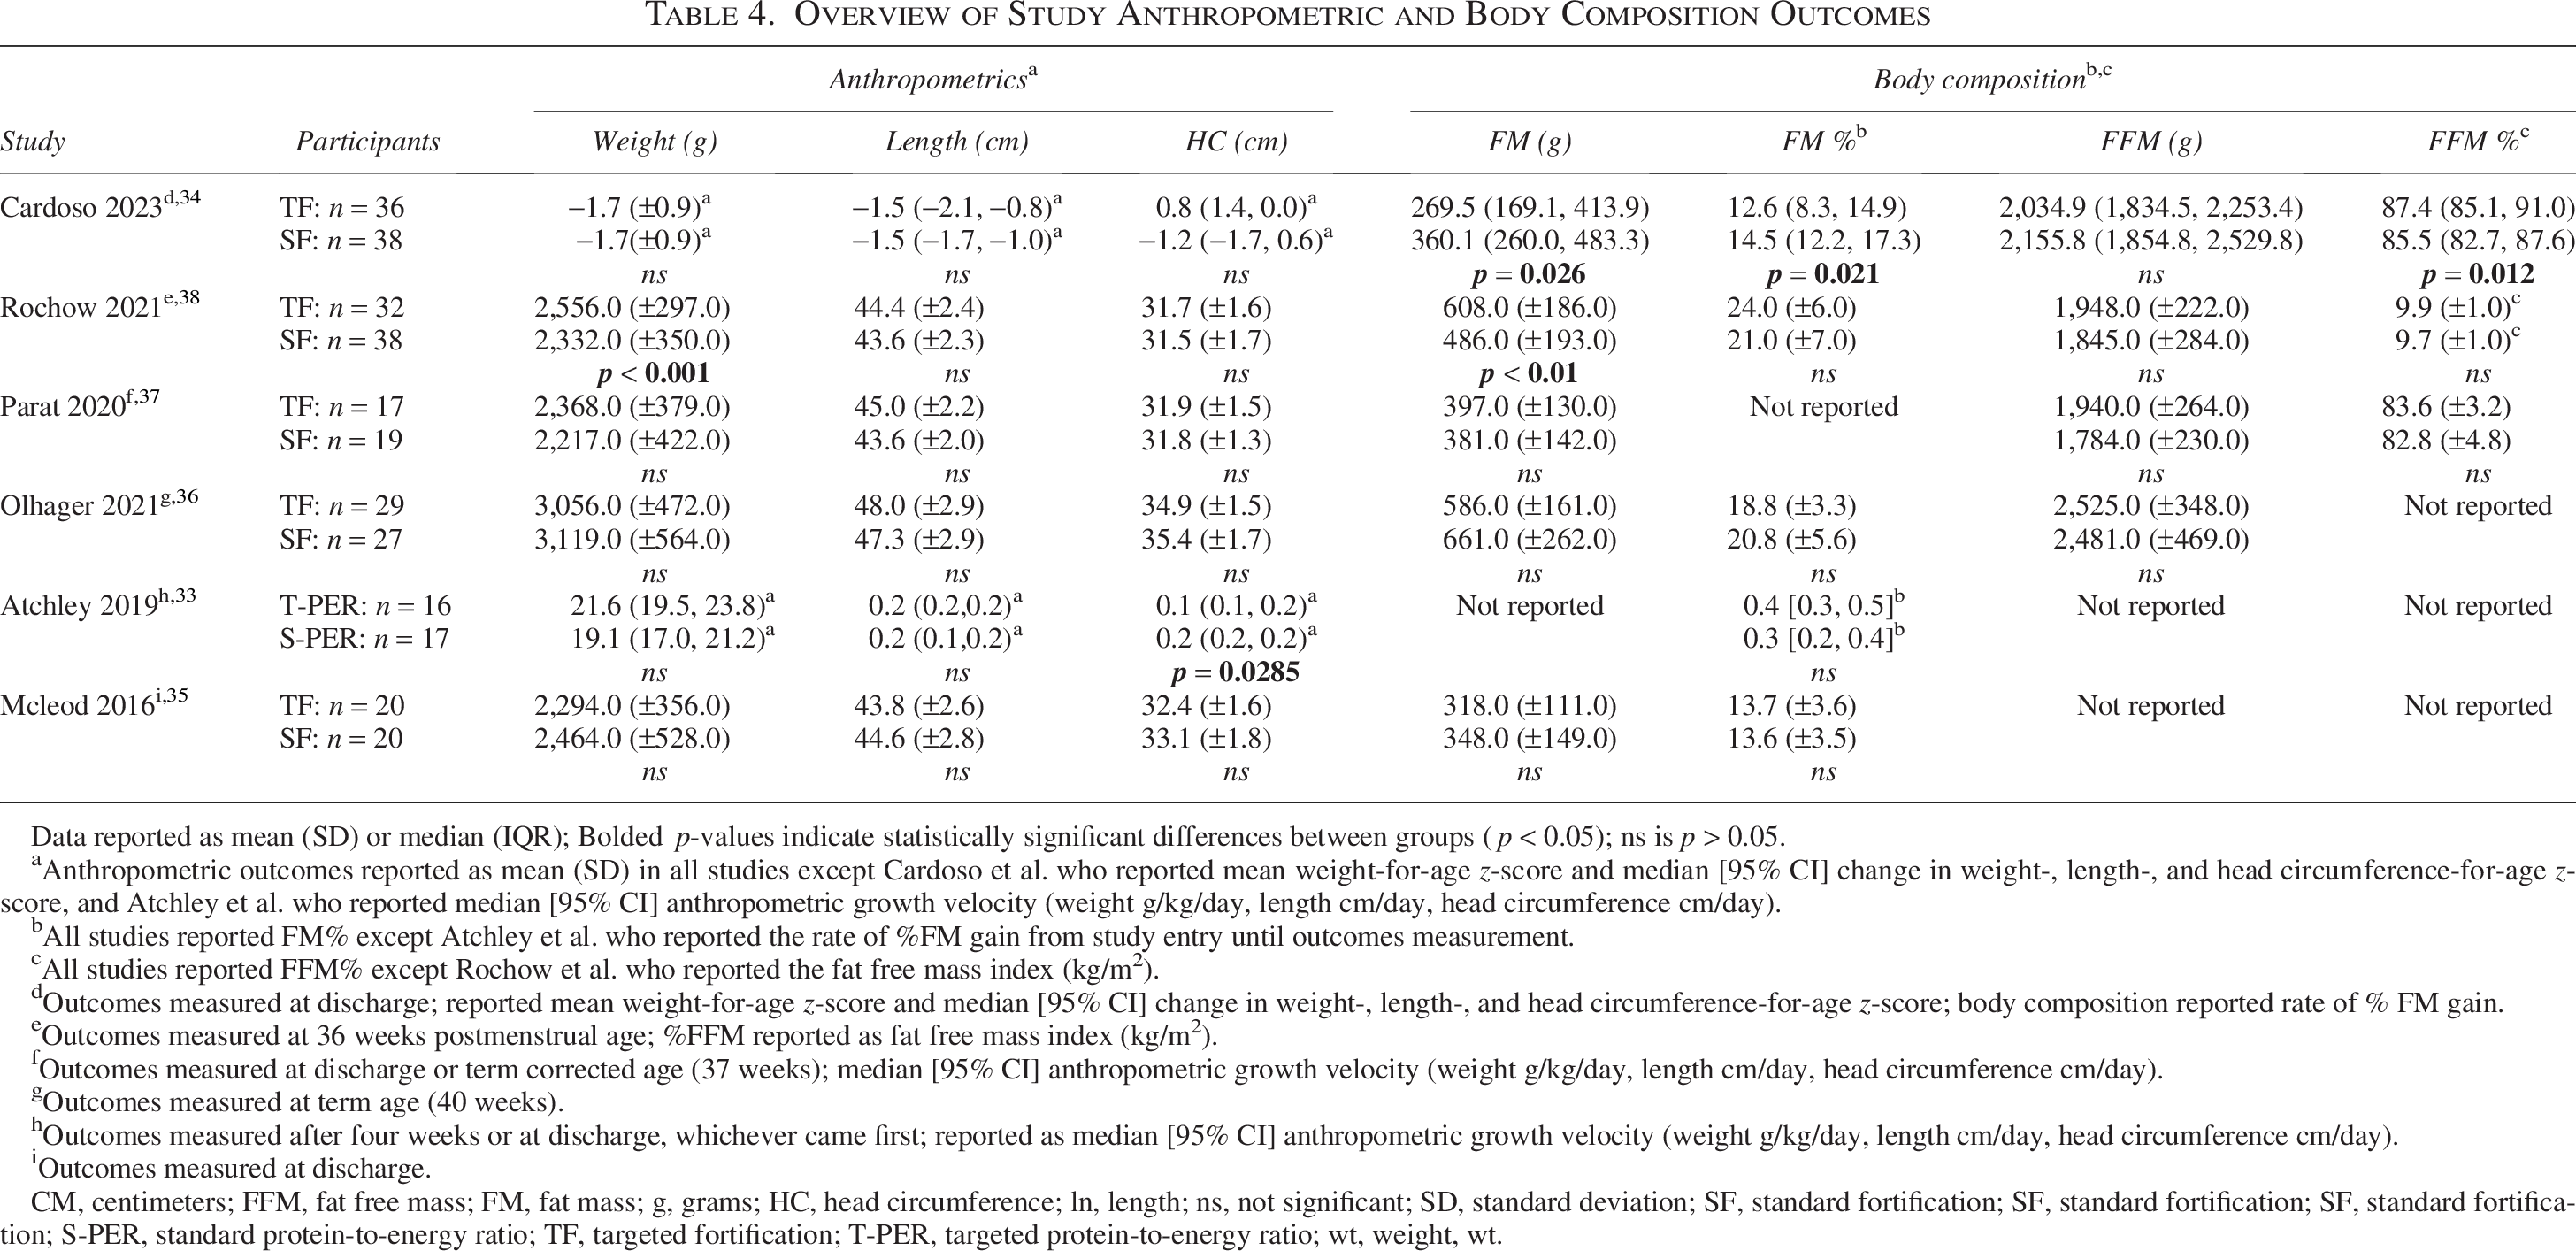
Data reported as mean (SD) or median (IQR); Bolded p-values indicate statistically significant differences between groups (p < 0.05); ns is p > 0.05.
Anthropometric outcomes reported as mean (SD) in all studies except Cardoso et al. who reported mean weight-for-age z-score and median [95% CI] change in weight-, length-, and head circumference-for-age z-score, and Atchley et al. who reported median [95% CI] anthropometric growth velocity (weight g/kg/day, length cm/day, head circumference cm/day).
All studies reported FM% except Atchley et al. who reported the rate of %FM gain from study entry until outcomes measurement.
All studies reported FFM% except Rochow et al. who reported the fat free mass index (kg/m2).
Outcomes measured at discharge; reported mean weight-for-age z-score and median [95% CI] change in weight-, length-, and head circumference-for-age z-score; body composition reported rate of % FM gain.
Outcomes measured at 36 weeks postmenstrual age; %FFM reported as fat free mass index (kg/m2).
Outcomes measured at discharge or term corrected age (37 weeks); median [95% CI] anthropometric growth velocity (weight g/kg/day, length cm/day, head circumference cm/day).
Outcomes measured at term age (40 weeks).
Outcomes measured after four weeks or at discharge, whichever came first; reported as median [95% CI] anthropometric growth velocity (weight g/kg/day, length cm/day, head circumference cm/day).
Outcomes measured at discharge.
CM, centimeters; FFM, fat free mass; FM, fat mass; g, grams; HC, head circumference; ln, length; ns, not significant; SD, standard deviation; SF, standard fortification; SF, standard fortification; SF, standard fortification; S-PER, standard protein-to-energy ratio; TF, targeted fortification; T-PER, targeted protein-to-energy ratio; wt, weight, wt.
Literature review
Cardoso et al. 34 conducted a single-center, mixed-cohort study at the Centro Hospitalar Universitário Lisboa Central NICU in Lisbon, Portugal, to investigate growth and body composition outcomes among preterm infants born <33 weeks gestational age who received either SF (n = 38) or TF (n = 36). Once the enteral feeding volume of mother’s own milk and/or donor milk reached 80 mL/kg/day, the HM feedings were fortified with 4.4 g of multi-nutrient powder HMF/100 mL. 34 In the TF group, mother’s own milk macronutrients were measured weekly, while donor HM was analyzed at pasteurization. 34 TF infants received SF plus individualized additions of protein modular and/or medium-chain triglyceride oil to achieve 110–135 kcal/kg/day, 3.5–4.5 g protein/kg/day, and a PER of 3.2–4.1 g protein/100 kcal, in accordance with 2010 ESPGHAN guidelines; 34 additional modular supplementation was permitted at clinician discretion. 34 Fortified feeding interventions continued for at least 2 weeks with no differences in the median feeding intervention of 28.0 days in the SF group and 23.0 days in the TF group (p = 0.072). 34 Weight was measured daily, length and head circumference weekly, and body composition was assessed with air displacement plethysmography at term age. 34
Among the infants with body composition measurements (TF n = 36, SF n = 38), the TF group had significantly lower grams of FM (p = 0.026), significantly lower %FM (p = 0.021), significantly greater %FFM (p = 0.012), and lower grams of FFM, which was not significantly different from the SF group (Table 4). 34 TF infants exhibited significantly greater weight gain velocity from birth to discharge (10.8 versus 9.7 g/kg/day, p = 0.023) and from HMF initiation to discharge (15.3 versus 13.0 g/kg/day, p < 0.001), along with significantly smaller declines in change in length-for-age z-scores (median −0.3 [IQR −2.1, −0.0] versus −0.7 [−1.7,−0.4], p = 0.005) change in head circumference-for-age z-scores (median 0.8 [IQR 0.4, 1.2] versus −0.3 [−0.6, 0.0], p < 0.001). 34 Infants in the TF group consumed significantly greater mean energy (p < 0.001), PER (p = 0.001), fat (p < 0.001), and carbohydrates (p < 0.001) than the SF group (Table 3). 34
Rochow et al. 38 conducted a single-center, double-blind, randomized controlled trial of 103 preterm infants born <30 weeks gestational age, randomized to receive HM with either SF (n = 51) or TF (n = 52). 38 HM feedings consisted of mother’s own milk and/or donor HM, with donor HM feedings supplemented with 0.4 g whey protein powder/100 mL across both groups. 38 Fortification was initiated for all infants with one pack of powder HMF per 25 mL HM at an EN volume of 120 mL/kg/d, continuing for 21 days. 38 In the TF group, HM was analyzed three times weekly, and individualized modulars of whey protein powder, polyunsaturated fat emulsion, and glucose polymer were added to achieve macronutrient levels per 100 mL of HM of 3 g protein, 4.4 g fat, and 8.3 g carbohydrate 38 to provide in g/kg/d 4.5 g protein, 6.6 g fat, and 12.5 g carbohydrate at an EN volume of 150 mL/kg/d in line with the 2010 ESPGHAN guidelines. 1
Anthropometric and dietary intake outcomes were measured at the end of the 21-day feeding intervention, and body composition was assessed at 36 weeks postmentrual age (PMA). 38 The TF group had significantly greater FM gain (608 ± 186 g versus 486 ± 193 g, p < 0.01) and greater but not statistically significant %FM (24 ± 6% versus 21 ± 7%), FFM (1,948.0 ± 222.0 g versus 1,845.0 ± 284.0 g), and FFM index (9.9 ± 1.0 kg/m2 versus 9.7 ± 1.0 kg/m2). 38 As shown in Table 4, growth outcomes were also improved in the TF group, including significantly greater weight (p < 0.001) and a trend toward greater length compared with the SF group. 38 The SF group’s mean intake of protein did not meet the 2010 ESPGHAN protein recommendations, 1 with >50% of the infants consuming <3.5 g protein/kg/d. 38
In a prospective, single-center, unblinded RCT, Parat et al. 37 evaluated growth and body composition in 36 very low birth weight preterm infants randomized to SF (n = 19) or TF (n = 17). SF consisted of 5 mL concentrated liquid HMF per 25 mL HM (mother’s own milk or donor HM), and TF included the SF protocol plus a liquid protein modular to achieve 4 g/kg/day based on weekly HM analysis. 37 HMF was initiated at an EN volume of 80 mL/kg/day (5 mL HMF/50 mL HM), increasing to 5 mL/25 mL HM at 100 mL/kg/day, and the protein modular was added between 130 and 150 mL/kg/day. 37 At 37 weeks gestational age or discharge, the TF group had significantly higher mean energy (p = 0.003) and protein intake (p < 0.001) (Table 3) but no significant differences in growth or body composition, though trends favored the TF group for %FFM, grams FFM, %FM, weight, length, and head circumference (Table 4). 37 Mean HMF initiation was 33.7 (SF) versus 33.4 weeks (TF), with intervention durations of 26.5 versus 31.4 days. 37 In infants with >30 days of exposure (n = 8 per group), the TF group had higher %FM (22.0 ± 3.1% versus 18.2 ± 2.9%, p = 0.046) and %FFM (81.8 ± 2.9% versus 78.1 ± 3.0%, p = 0.046). 37
Olhager et al. 36 conducted a single-center, prospective, blinded RCT evaluating growth and body composition outcomes at term age in 56 preterm infants born <32 weeks gestational age randomized to receive SF (n = 29) or TF (n = 27). In both groups, EN was initiated with mother’s own milk and/or donor HM, with infant formula used if HM was unavailable. SF fortification began on EN day 10 with powdered preterm formula. 36 The SF protocol added fat emulsion in stepwise increments and additional preterm formula when growth was <10–25 g/day. 36 TF fortification was based on HM analysis when mother’s own milk volume was >50% of the infant’s daily needs; 36 macronutrient modulars (recipe undisclosed) were added to meet 2005 Consensus Guidelines 40 targets of 110–130 kcal/kg/day and protein intake 3.4–4.2 g/kg/d stratified by gestational age (GA) (Table 2). 36 At term age, there were no differences in growth and body composition outcomes between groups. 36 Despite fortification based on HM analysis, the SF group had significantly higher mean intake of energy (p = 0.026), protein (p = 0.0001), and fat (p = 0.007) from the fourth week of life (Table 3). However, no differences in intake were observed between groups from day 29 through 36 weeks GA. 36 The greater nutrient intake in the SF group likely resulted from protocol-driven modular additions for suboptimal growth; however, it is unclear if similar adjustments were applied to the TF group. 36
In 2016, McLeod et al. 35 published one of the first blinded RCTs evaluating the growth and body composition outcomes from TF in 40 preterm infants born <30 weeks gestational age, randomized either to SF (n = 20) or TF (n = 20). 35 Nutrition goals for both groups targeted the upper range of the 2010 ESPGHAN guidelines (Table 2).1,35 SF consisted of 4 g powder multi-nutrient HMF per 100 mL HM for unrestricted feeds, or 4 g powder multi-nutrient HMF plus 0.5 g protein powder and 2.5 g dual energy modular per 100 mL HM for fluid-restricted infants. 35 TF was individualized based on weekly HM analysis, with adjustments up to 4 g HMF, 0.5 g protein modular, and 3.0 g dual-energy modular per 100 mL, prioritizing protein over energy. 35 Despite individualized TF, no significant differences were found between groups in mean intake of energy, protein, carbohydrate, fat, and mean PER (Table 3). 35 At discharge, there were no significant differences between groups in body composition or growth outcomes, including mean grams FM, %FM, weight, length, head circumference, or weight gain velocity (Table 4). 35 Although not statistically significant, several mean growth outcomes were lower in the TF group, including grams FM (318 ± 111 g versus 348 ± 149 g), weight (2,294 ± 356 g versus 2,464 ± 528 g), length (43.8 ± 2.6 cm versus 44.6 ± 2.8 cm), and head circumference (34.9 ± 1.5 cm versus 35.4 ± 1.7 cm). 35 Additionally, after birthweight regain, the mean growth velocity was suboptimal and below the recommended 15–20 g/kg/day 1 in both the SF (14.3 g/kg/d) and TF group (13.4 g/kg/d). 35
Atchley et al. 33 conducted a prospective, double-blind RCT enrolling 33 preterm infants born <32 weeks gestational age and weighing <1,000 g, randomized to either a standard PER group (3 g/100 kcal; n = 17) or a targeted PER group (4 g/100 kcal; n = 16) to compare weight gain and FM accretion over four weeks. 33 Although this study investigated two levels of protein intake rather than a specifically defined TF, it was included because HM analysis and fortification were adjusted weekly to meet PER targets, body composition was assessed, and the PER targets in both groups were similar to those in the two studies that analyzed PER for all participants.33–35 Donor HM supplemented mother’s own milk as needed, and infant formula was used if HM was unavailable; 33 60.1% (n = 20) of participants consumed ≥75% of EN from HM, with no between-group differences. 33 Baseline %FM was higher in the standard PER group (7.29%) than in the targeted PER group (5.15%, p = 0.0579), and the standard PER group had more males (70.6% versus 37.5%, p = 0.0844). 33 Head circumference growth velocity was significantly greater in the standard PER group compared to the targeted PER group (median [95% CI] cm/d: 0.17 [0.2–0.2] versus 0.14 [0.1–0.2], p = 0.0285). 33 The targeted PER group had greater weight gain velocity (median [95% CI] g/kg/d: 21.6 [19.5, 23.8] versus 19.1 [17.0, 21.2], p = 0.095) and a higher rate of %FM gain (median [95% CI] 0.4 [0.3, 0.5] versus 0.3 [0.2, 0.4], p = 0.0878) compared to the standard PER group, although neither result reached statistical significance. 33 Adjusting for baseline %FM, infants with lower %FM at enrollment gained FM significantly faster (p < 0.0001); however, between-group differences remained non-significant (adjusted p = 0.3586), except for a significant increase in FM gain among infants with %FM below the median (p = 0.0270). 33 The investigators concluded that in this study population, greater protein intake contributed to weight gain and FM accretion but did not improve length growth velocity. 33
Discussion
Targeted fortification
Targeting HM fortification to the measured energy and macronutrient content, rather than assumed values, has the potential to influence growth and body composition outcomes in preterm infants. Across the six studies included in this review33–38 statistically significant effects of TF were observed in only two, with divergent findings.34,38
Cardoso et al. 34 reported TF based on weekly HM analysis resulted in a significantly greater FFM accretion (+1.9%), significantly lower FM (−90.6 g), and significantly lower %FM (−1.9%) compared to SF. 34 The TF group also demonstrated significantly greater weight gain velocity and positive changes in both length- and head circumference-for-age z-scores from birth to discharge. 34 In contrast, Rochow et al. 38 found that TF was associated with significantly greater weight gain and significantly greater mean FM accumulation (+122.0 g), with mean FM 3.0% higher in the TF group, while no significant differences in FFM (g or %) were observed. 38 These opposing findings highlight uncertainty regarding whether TF preferentially promotes lean mass accretion or increased adiposity.
The remaining four studies did not demonstrate statistically significant differences in body composition and growth outcomes between the TF and SF groups,33,35,36 although Atchley et al. 33 reported significantly greater head circumference growth in the standard PER group. In Atchley et al. 33 and Parat et al., 37 the limited duration of exposure to TF (mean 17.0 and 31.4 days, respectively) and delayed initiation of HMF (at 120 mL/kg/day 33 and mean 33.0 weeks gestational age, 37 respectively) may have contributed to the absence of significant findings. Experts recommend initiating HMF when the EN feeding volume reaches between 50 and80 mL/kg/d2,3 or when EN meets 33 − 67% of the goal volume, 2 therefore, it cannot be ruled out that exposure to a higher intake of protein over a longer duration might have improved body composition and growth outcomes in the Atchley et al. targeted PER group. 33
Similarly, Olhager et al. 36 and McLeod et al. 35 reported no significant differences in anthropometric or body composition outcomes between study groups; however, both studies noted lower gains in grams FM, weight, and head circumference in the TF groups.35,36 The TF group in the Olhager et al. 36 study had greater mean grams FFM, lower %FM, lower grams of FM, and greater linear growth than the SF group, suggesting that the TF protocol promoted lean mass accretion; however, the TF group also weighed less and had lower head circumference growth than the SF group. The allowance of additional modular fortification for poor growth in Olhager et al. 36 resulted in the SF group’s significantly greater mean energy, protein, and fat intake, complicating the interpretation of TF efficacy. 36 McLeod et al., 35 similarly reported lower nutrient intake in the TF group, potentially related to the overestimation of HM protein content and protocol-imposed limits on modular fortification.
Taken together, the limited number of studies demonstrating statistically significant effects and the opposing direction of those effects underscore the uncertainty surrounding the clinical relevance of TF on body composition outcomes. This uncertainty is further compounded by the lack of consensus regarding optimal body composition targets for preterm infants at NICU discharge and the absence of well-established fetal reference standards.41–43
HM analysis
The recent availability of IRS analyzers for clinical use has enabled TF based on actual HM macronutrient content at or near the time of feeding. 44 Mid-IRS and near-IRS devices, originally designed for dairy milk, have been adapted for HM analysis; however, differences in matrix composition, fatty acids, and oligosaccharides can reduce accuracy, particularly for lactose measurement. 44 In HM, the high oligosaccharide content may be misread as free lactose 44 due to the terminal lactose molecule on all HM oligosaccharides. 25 Since adequate non-protein calorie intake from carbohydrates supports protein accretion and growth, inaccurate lactose estimation may affect body composition outcomes. 25
In a systematic review of HM analyzers used in research and clinical care, Fusch et al. 44 reported that 30–40% of studies found inaccuracies in macronutrient measurement compared with chemical reference methods. 44 Validation studies have shown that both near- and mid-IRS devices perform poorly for lactose measurement; the mid-IRS device demonstrated good agreement for fat but underestimated protein, while the near-IRS device underestimated fat, overestimated protein in low-protein HM, and underestimated protein in high-protein HM. 25 An international, multicenter validation study of 15 analyzers across 13 medical centers similarly found clinically significant variability, with coefficients of variation ranging from 0.7 to 16.2% for fat, 0.5 to 9.3% for lactose, and 1.5 to 31.6% for protein. 26 Notably, protein errors exceeded 1 g/dL, potentially misestimating intake by approximately 1.6 g/kg/day, enough to alter growth rates by ± 8–10 g/kg/day. 26
For TF using HM analyzers, experts recommend validation against chemical reference methods, daily calibration, adherence to Good Clinical Laboratory Practice standards, and the use of the ultraperformance liquid chromatography tandem mass-spectrometry (UPLC-MS/MS) method for lactose measurement.26,44 Among the studies included in this review, Cardoso et al. 34 calibrating a mid-IRS device before each use, while Olhager et al. 36 and McCleod et al. 35 used mid-IRS devices without reporting calibration procedures. Parat et al. 37 reported daily calibration of a filter-based analyzer, and Atchley et al. 33 did not describe the device or calibration procedure. 33 Only Rochow et al. 38 reported validation and calibration of the near-IRS analyzer used and uniquely used UPLC-MS/MS for lactose measurement.
Multi-nutrient HMF
A variety of products are available to fortify HM, including powders, bovine liquid, HM-based multi-nutrient HMFs, and single- or dual-nutrient modulars.3,8,45 Multi-nutrient HMFs vary in protein content, and some modular products are not specifically designed for preterm infants.3,8,45 In addition to energy and protein, most multi-nutrient HMFs also supply carbohydrates, lipids, and selected vitamins and minerals. 3 Consensus guidelines from ESPGHAN, 4 EMBA, 3 AND, 22 AAP5,46,47 and Koletzko et al. 48 recommend multi-nutrient HMF as the foundation of HM fortification, reserving single-nutrient modulars for use with adjustable or targeted methods or to address specific nutrient gaps or poor growth.3,8,45 Notably, all but one of the included studies used a multi-nutrient HMF as the base product; in Olhager et al. 36 fortification was instead based on preterm infant formula plus fat emulsion. 36 Conducted before current recommendations, this trial likely reflected the product availability and fortification practices in Sweden at that time. 36
HMF protein content
The protein content of multi-nutrient HMFs varies, with newer formulations providing higher levels than older versions still in use.8,45 The AAP 47 and Koletzko et al.8,45 recommend using higher-protein products, since their nutrient composition more closely meets estimated requirements and supports better anthropometric growth.45,47 In a systematic review, Tonkin et al. 49 found that fortified HM providing 4.0–4.5 g protein/kg/d, through higher-protein multi-nutrient HMF or added protein, was associated with greater weight, length, and head circumference than lower-protein formulations. 49 Similarly, a meta-analysis by Liu et al. 50 reported that higher-protein HMF (1.0–3.2 g/100 mL when mixed with HM) significantly improved weight, length, and head circumference gains compared with standard-protein HMF. 50
Regarding body composition, McLeod et al. 51 reported that combined protein and carbohydrate intake was associated with greater FFM accretion measured by air displacement plethysmography. 51 In an RCT, Salas et al. 52 found that adding 0.75 g protein/100 mL to SF resulted in significantly greater weight, length, and FFM at 36 weeks PMA compared with SF alone. Similarly, Ramel et al. 18 observed that higher protein intake during the first week of life and throughout the NICU stay was positively associated with FFM z-scores at discharge. 18 Only three included studies were conducted after the introduction of higher-protein multi-nutrient HMF,33,37,38 yet Rochow et al., 38 Parat et al. 37 and Atchley et al. 33 used lower-protein formulations, possibly reflecting product availability at their centers.
Strengths and limitations
This review has several strengths: all included studies enrolled preterm infants born <33 weeks gestational age or weighing <1,500 g, body composition was consistently assessed using air displacement plethysmography, and TF nutrition targets were aligned with expert recommendations available at the time. Limitations include small sample sizes (<100 in all but one study) and wide variation in HMF initiation, fortification products, HM analysis methods, TF protocols, and duration of HMF exposure.33–38 Further research is needed to determine whether TF yields clinically meaningful benefits for growth and body composition that justify the added workload and cost of HM analysis. Future studies should employ RCT designs comparing TF and SF with standardized feeding protocols, timing of HMF initiation, and nutrient targets consistent with current guidelines.
Conclusions
Current evidence does not consistently demonstrate benefits of TF over SF for body composition outcomes in preterm infants. Optimizing nutrition in preterm infants through TF of HM is an emerging strategy with potential to enhance FM, FFM, and anthropometric growth compared with SF; however, this narrative literature review did not identify sufficient consistent evidence to draw definitive conclusions regarding the impact of TF on body composition outcomes. Across studies, findings were heterogeneous, and observed benefits were primarily observed in trials employing more complex TF protocols.
Based on this narrative review, the following suggestions for TF, informed by limited evidence, include: (1) HM analysis at least once a week using a validated and calibrated HM analyzer, (2) initiation of HMF at an EN volume of 50–100 mL/kg/d, (3) introduction of TF shortly after achieving full-strength base fortification, (4) use of a high-protein multi-nutrient liquid HMF as the foundation, and (5) addition of single-nutrient modulars on top of multi-nutrient HMF only as needed to meet TF energy and macronutrient targets. Further well-designed studies are needed to clarify the effects of TF on body composition and growth outcomes in preterm infants.
Authors’ Contributions
T.R.: Conceptualization, methodology, formal analysis, investigation, writing—original draft, writing—review and editing. J.Z.: Writing—review and editing, and supervision. M.N.: Methodology, writing—review and editing, and supervision.
Footnotes
Disclosure Statement
Tara Rebele serves on the Mead Johnson Nutrition Speaker’s Bureau. The remaining authors declare no conflict of interest.
Funding Information
No funding was received for this article.