
Abstract
The classification of immune and nonimmune genes in cattle is crucial for understanding immune mechanisms and their link to disease resistance. Traditional methods rely on manual curation and conventional bioinformatics tools, which are often time-consuming and labor-intensive. We introduce ImmFinder, a multimodal fully connected neural network (FCNN) framework designed to classify immune genes by integrating genomic and transcriptomic datasets. ImmFinder achieved an accuracy of 85.67%, an F1-score of 0.85, a precision of 0.86, and a recall of 0.85, demonstrating strong predictive performance. Additionally, the area under the curve-receiver operating characteristic (AUC-ROC) curve scores of 0.9250 (test set) and 0.9264 (validation set) further validate its robustness. These findings highlight the potential of a multimodal deep learning approach for immune gene classification, advancing functional genomics in cattle. The limitations of ImmFinder include reliance on the available bovine genomic and transcriptomic datasets used for training and evaluation, which may constrain immediate generalization to other breeds or species; additional external validation and experimental follow-up will be required to confirm biological hypotheses derived from model predictions. Currently, ImmFinder demonstrates the value of multimodal data fusion for functional gene annotation and provides a scalable baseline for integrating data types, such as genomics and transcriptomics. In future work, we will expand the training cohorts, broaden the range of data modalities, and pursue experimental validation of high-confidence model predictions. ImmFinder is implemented in Python, and all datasets, training models, preprocessing, and model development scripts are available on GitHub.
Introduction
Genomics studies in livestock can play a crucial role in identifying the genes associated with various traits such as disease resistance, milk yield, growth rate, heat tolerance, adaptability, and meat production (Hossein-Zadeh, 2024). In cattle, identifying immune genes from nonimmune genes is vital for understanding immune mechanisms and their link to phenotypic traits, particularly disease resistance. However, conventional approaches such as literature mining and traditional bioinformatics tools remain the primary approaches for immune gene identification, which are often time-consuming and labor-intensive. Notably, no computational model currently utilizes multi-omics data to predict immune genes in cattle.
Deep learning has gained significant popularity in genomics research (Zou et al., 2019), demonstrating an advantage over traditional machine learning methods such as support vector machine (SVM) and logistic regression (Sharifi-Noghabi et al., 2019; Cadow et al., 2020; Chiu et al., 2019). The primary objective of deep learning is to train models capable of learning high-level features from single input data by processing them through multiple layers. Recently, multimodal deep learning (MDL) approaches have emerged as powerful tools for integrating multiple data sources to identify complex patterns and extract significant biological insights. In MDL, earlier layers capture simpler data abstractions, which are progressively refined in deeper layers to form more informative and complex representations (Ramachandram and Taylor, 2017; Bengio et al., 2013). For example, integrating single-cell multi-omics using an MDL approach provides a comprehensive understanding of the molecular characteristics at the cellular level (Zhu et al., 2023). Unlike traditional computational methods that require manually extracted features for each modality, MDL can automatically learn a hierarchical representation using a multilayer neural network, extracting meaningful features from a diverse data source. This capability allows MDL to manage high-dimensional data effectively by mapping features from different modalities into a smaller, unified subspace, facilitating better insights into biological research (Adossa et al., 2021; Athaya et al., 2023).
MDL has been widely applied in various domains. This integrative approach has been proven to improve the accuracy and efficiency of various tasks in different clinical decision-making with imaging and structured data such as omics data, lab test data, and demographic data (Sun et al., 2023; Holste et al., 2021). For instance, multimodal frameworks have been used to enhance COVID-19 diagnosis by combining clinical, imaging, and laboratory data (Hardy-Werbin et al., 2023); predict glioma genotypes using MRI-based features (Wei et al., 2023); cluster single-cell multi-omics data for complex biological functional studies (Lin et al., 2022); and improve brain state classification with EEG features (Ieracitano et al., 2020). Compared to the traditional machine learning model, MDL enables the fusion of different data types and predicts complex underlying patterns with better accuracy than unimodal (Stahlschmidt et al., 2022). Several MDL techniques have been developed, including fully connected neural network (FCNN), convolutional neural network (CNN), recurrent neural network (RNN), and residual fully connected neural network (RFCN) (Xu et al., 2021). Among these, the FCNN framework is particularly useful in genomic research due to its ability to establish connections between all nodes across successive layers, facilitating efficient information processing (Kobayashi et al., 2020; Alharbi and Rashid, 2022). Researchers have employed FCNN in various studies such as predicting Alzheimer’s disease by integrating gene expression and DNA methylation data (Park et al., 2020) and combining messenger RNA and microRNA data to predict cancer patient survival (Huang et al., 2019).
InnateDB—the most widely cited repository of innate immunity genes and interactions—was designed around human and mouse data and extends to other species largely by one-to-one orthology mapping (Breuer et al., 2013). In cattle, this strategy yields a catalog of barely 1200 genes, omits breed-specific or ruminant-specific duplications, and provides no mechanism for incorporating new genome assemblies or expression evidence. Because each entry is static, InnateDB cannot indicate whether a gene is truly expressed in immune tissues, upregulated after infection, or linked to favorable health phenotypes. Moreover, the database offers no classifier that can score unannotated loci: if a bovine gene is not already in the table, InnateDB simply returns “no data.” These gaps limit its usefulness for modern livestock genomics, where researchers routinely generate RNA sequencing (RNA-seq), single-nucleotide polymorphism, and epigenomic datasets and need a tool that can integrate such multiomics evidence to flag previously unknown immune candidates.
In this study, we developed ImmFinder, an FCNN-based multimodal framework that integrates genomic and transcriptomic datasets to accurately and efficiently classify immune genes in cattle genomes. This approach utilizes deep learning techniques to overcome the limitations of traditional methods and offers an efficient way to predict immune genes in cattle.
Materials and Methods
Data collection
Genomic variation data were obtained from a comparative genomic analysis previously conducted between Bos taurus (Hereford breed, Accession ID: GCA_002263795.3) and Bos indicus (Nelore breed, Accession ID: GCA_000247795.2) using GSAlign (Lin and Hsu, 2020) and SyRI (Goel et al., 2019), followed by automated annotation using a Python script. The resulting dataset includes structural variations such as insertions, deletions, and substitutions for genes present in Hereford cattle. Transcriptome data for infected and noninfected cases of bovine were retrieved from Gene Expression Omnibus (GEO), selecting seven datasets: GSE141962, GSE62048, GSE152959, GSE167574, GSE159268, GSE241059, and GSE107366.
Data preprocessing
The genomic variations datasets were preprocessed to ensure data quality and consistency. Redundancy entries and missing values were removed using a Python script. The transcriptome datasets were divided into two groups based on the time postinfection: two hours and six hours, resulting in a total of eight datasets. Further, the dataset was filtered based on log2FoldChange (log2FoldChange ≥ 2 for upregulation) and (log2FoldChange ≤ −2 for downregulation), merged, and duplicates were removed using a Python script. We chose an absolute log2FoldChange threshold of 2 because it corresponds to a minimum four-fold change in expression (22 = 4 for upregulation and 2−2 = ¼ for downregulation), a magnitude that is generally regarded as biologically meaningful and well above the level of technical variation observed in most RNA-seq experiments. Setting the cutoff at ±2 fold therefore enriches the dataset for transcripts whose changes are large enough to be reproducible in independent assays (e.g., quantitative PCR) and to exert measurable effects on cellular pathways while still retaining a sufficient number of genes for robust downstream enrichment and network analyses.
Identifying immune-related genes
We matched immune-related genes from genomic variant and transcriptome data against the InnateDB database (https://www.innatedb.com/) containing 1697 innate immunity genes. Additionally, we performed a keyword-based search using immune terms such as immunoglobulin, immunoreceptor, autoimmune, Toll-like receptor (TLR), IgG, autophagy, immunogen, immune, innate, T-cell, B-cell, lymphocyte, histocompatibility, CD24, CD4, LY96, IFIT3, PGLYRP1, NKG2D, UL16, leukocyte, cytokine, antimicrobial peptide, beta-defensin 2, IL15, IL2, and chemokine, to identify immune-related genes beyond those listed in InnateDB.
Addressing class imbalance
Our dataset exhibited substantial class imbalance, with nonimmune genes (majority class) greatly outnumbering immune genes (minority class). To overcome this, we used multiple undersampling techniques using the imbalanced learn (imblearn) Python package. This included NearMiss, Tomek Links, ClusterCentroids, Neighbourhood Cleaning (NC), Edited Nearest Neighbors (ENN), Condensed Nearest Neighbours (CNNs), One-sided Selection (OSS), Repeated Edited Nearest Neighbors (RENN), adaptive iterative instance-based K-Nearest Neighbour (AIIKNN), and Instance Hardness Threshold (IHT) to balance the true positive (immune gene) versus true negative (nonimmune gene) distribution. Imbalanced datasets can bias the model toward the majority class, reducing predictive accuracy. It also leads to skewed precision–recall and ROC curves, which misrepresent model performances. We focused on undersampling techniques because our dataset is high-dimensional biological data with a relatively large number of majority-class genes, which can bias machine learning models. Undersampling techniques such as NC, ENN, CNN, OSS, RENN, AIIKNN, and IHT were selected as they are widely used and effective in reducing majority-class dominance while maintaining the minority-class signal in high-dimensional feature space. Alternative approaches such as hybrid sampling (combining over- and undersampling) or cost-sensitive learning were considered; however, hybrid sampling often relies on synthetic oversampling method (e.g., SMOTE), which can generate synthetic data or artificial gene profiles that may not reflect true biological variation, potentially biasing model training. Prior work has shown that in high-dimensional data, synthetic resampling can increase error rates and introduce artifacts (Blagus and Lusa, 2013). Similarly, cost-sensitive learning requires careful tuning of class weights, which can be dataset-specific and may complicate cross-dataset generalization (Krawczyk B, 2016). Based on this consideration, we implemented undersampling techniques to mitigate model bias, improve predictive reliability, and reduce computation costs, ensuring an accurate and robust immune gene classification.
Multimodal neural network framework
We developed an FCNN-based multimodal framework to process genomic and transcriptomic data separately using two parallel branches (Fig. 2). Each branch consisted of two dense layers with eight and four neurons, respectively, and utilized the ReLU activation function. The choice of two dense layers is supported by prior studies showing that two hidden layers are sufficient to capture complex nonlinear biological patterns while minimizing the risk of overfitting and maintaining interpretability in high-dimensional datasets (Kim et al., 2018; Dandi et al., 2024). Wilentzik Müller et al. (2020) demonstrated that shallow neural networks with one or two hidden layers achieve high accuracy in classifying biological traits based on gene expression, and adding a second hidden layer improved performance, but deeper models did not show significant gains. They also emphasized the importance of keeping models interpretable and avoiding overly complex architectures given typical biological sample sizes. Similarly, Li et al. (2023) reviewed deep learning in gene regulation and reported that two-layer fully connected networks are widely used in genomics tasks. Based on this evidence, we selected a two-layer dense architecture as a balanced and supported design for immune versus nonimmune gene classification. L2 regularization was applied to prevent overfitting, and a dropout rate of 10% was incorporated to randomly deactivate 10% of neurons during training. The outputs of both branches were concatenated and passed through a final dense layer with two neurons, followed by a single-neuron output layer with a sigmoid activation function for binary classification. The model was compiled using the Adam optimizer, which dynamically adjusts the learning rate for optimal convergence, and employs the focal loss function to address class imbalance. Accuracy was used as an evaluation metric to track model performance during training.
Model training
The input data were preprocessed using OrdinalEncoder to convert categorical features into numerical representations and LabelEncoder to encode categorical labels for classification tasks. Numerical features were standardized using StandardScaler, which adjusted values to have a mean of 0 and a standard deviation of 1 for improved model training. The dataset was split into training (60%), validation (20%), and testing (20%) sets. Training was conducted for 50 epochs with a batch size of 32, and early stopping was implemented to halt training when validation loss ceased to improve. Model performance was evaluated on each dataset using accuracy, precision, recall, and F1-score.
Results and Discussion
Here, we developed an FCNN-based multimodal model integrating the genomic variant and transcriptomic datasets to classify the immune-related genes. The overall workflow of our study is shown in Figure 1.
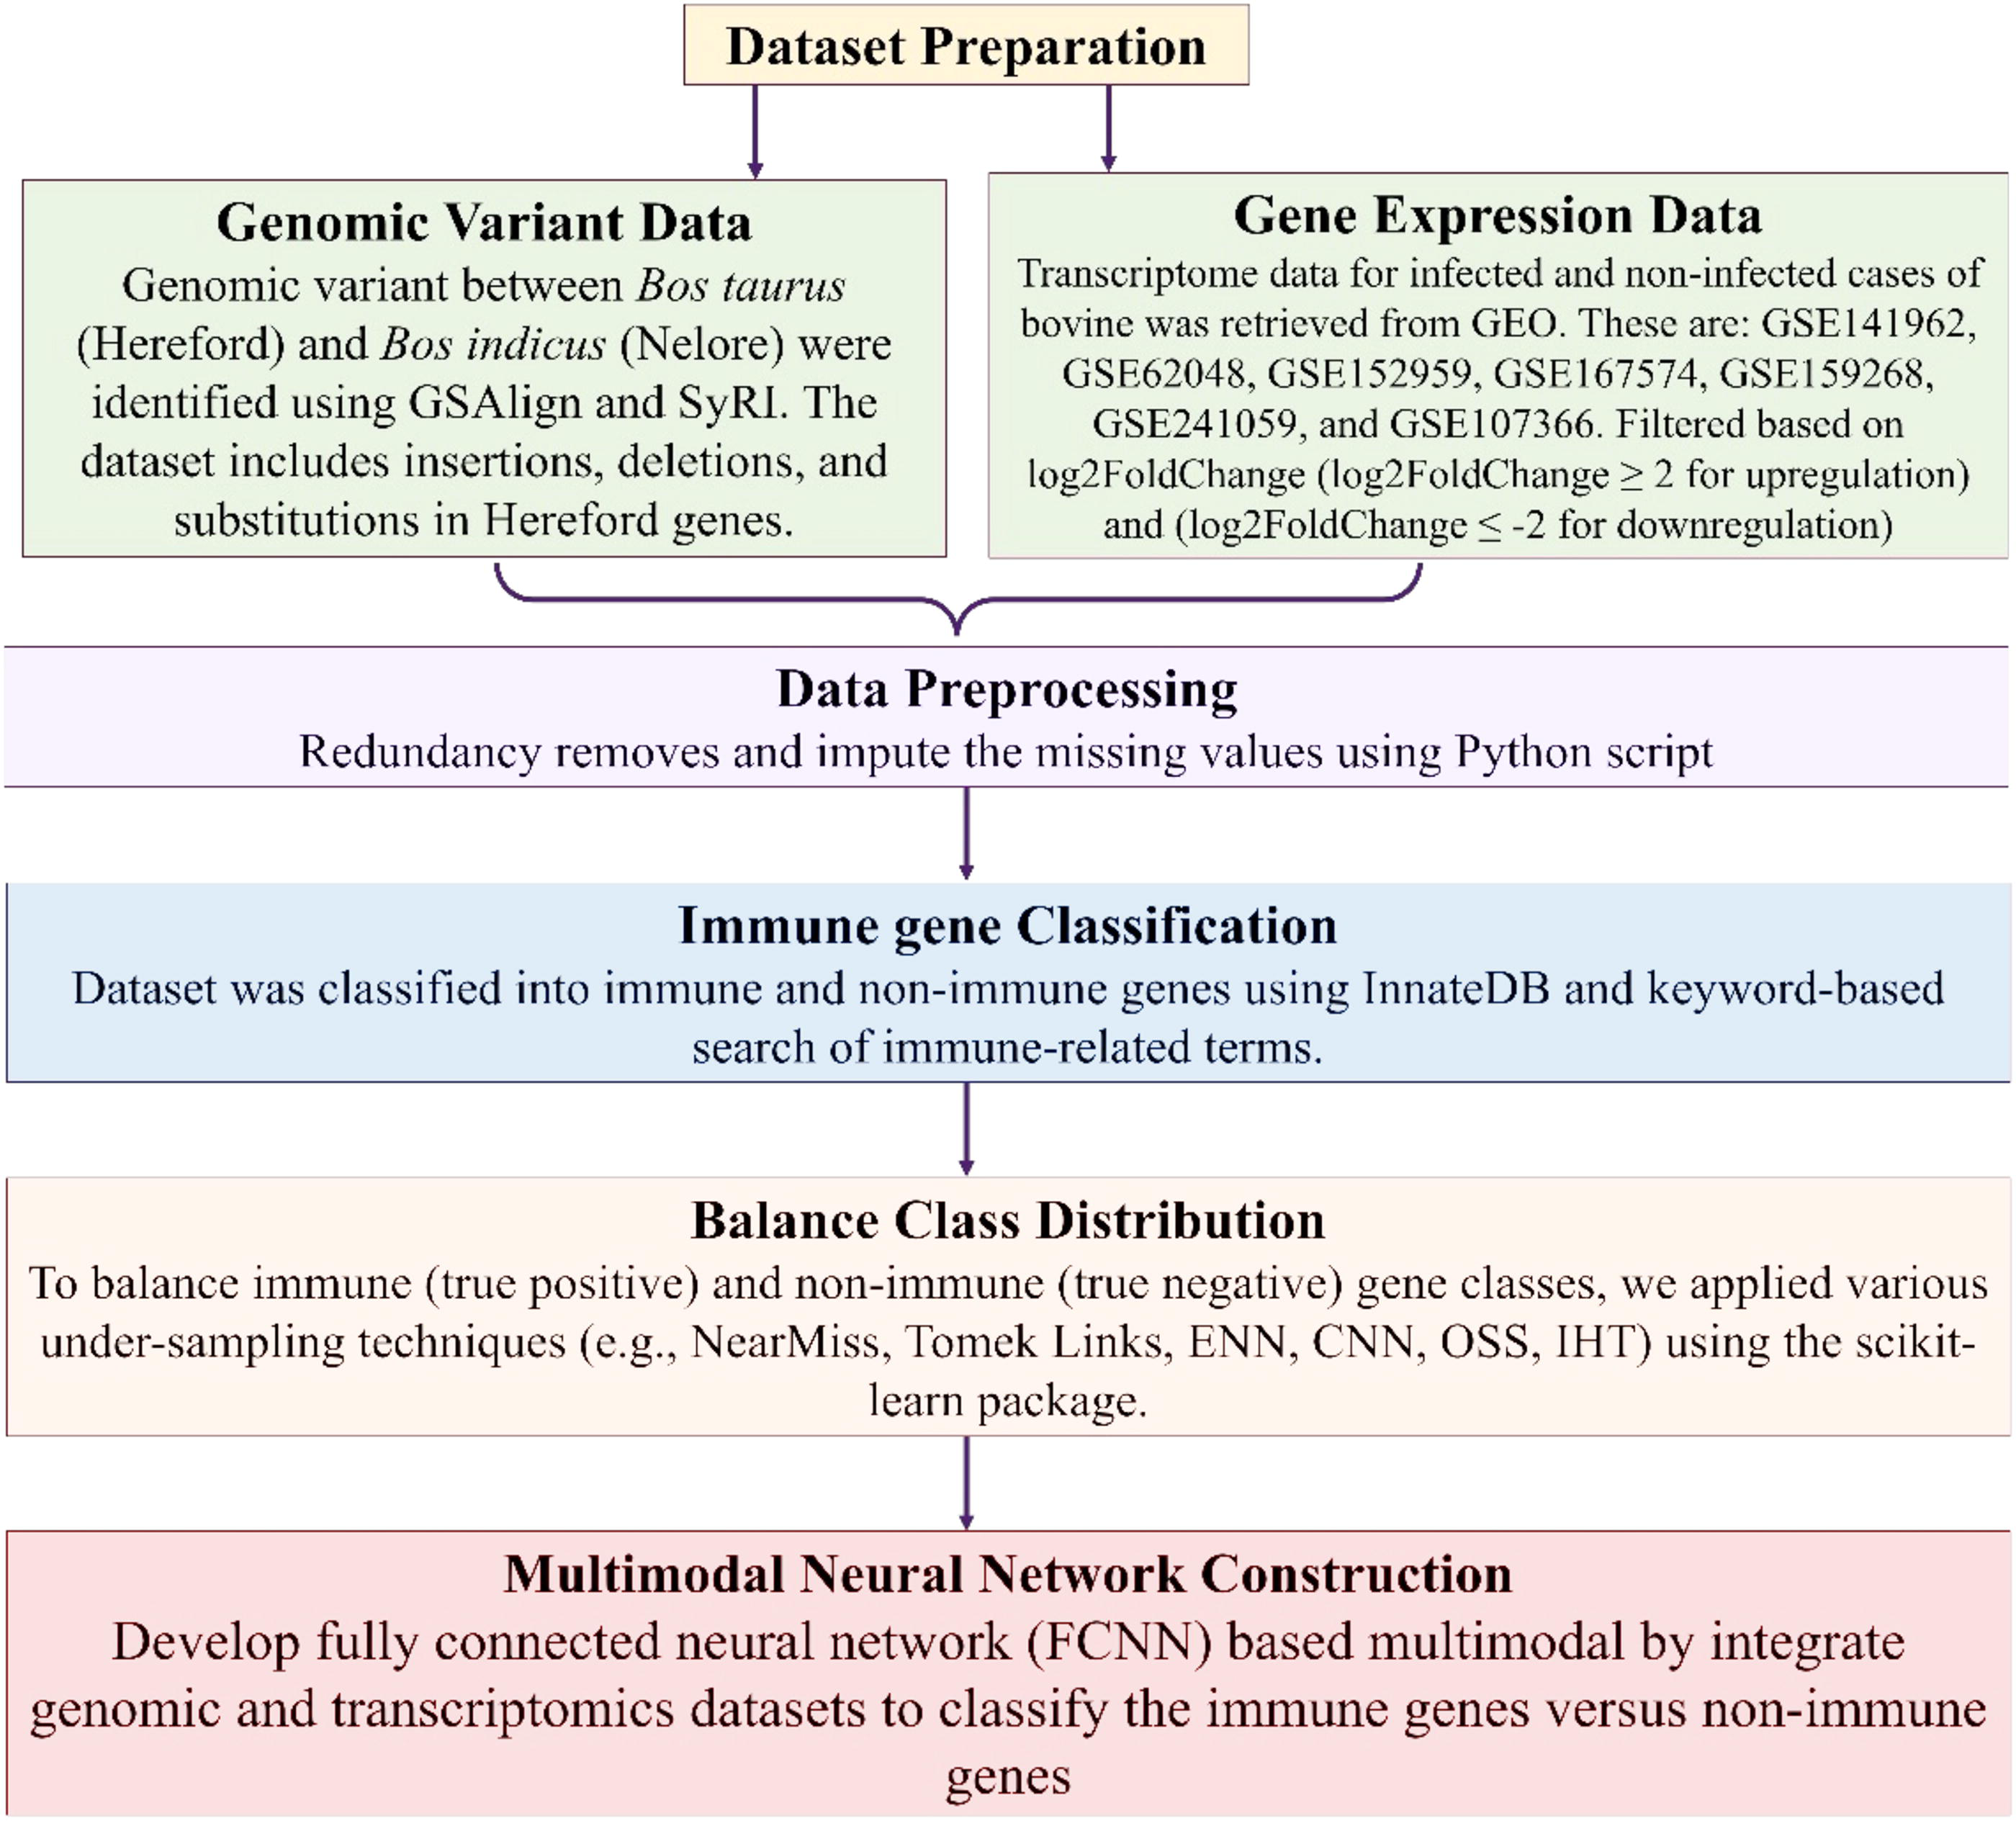
Workflow of our study. Genomic variant and gene expression datasets were preprocessed to remove redundancy and impute missing values, and then classified into immune and nonimmune genes using InnateDB and immune keyword-based searches. To address class imbalance, various under-sampling techniques were applied. A fully connected neural network (FCNN)-based multimodal deep learning model was then developed by integrating genomic and transcriptomic datasets to classify immune genes from nonimmune genes.
Feature selections in genomic and transcriptomic datasets
The preprocessing step included removing duplicates, handling missing values, and classifying genes as immune or nonimmune using the InnateDB database and keyword matching.
The genomic datasets contained features such as chromosome number, gene start and end position, orientation, gene name, gene type, protein length, intergenic region position, QTL class obtained from AnimalQTLdb (https://www.animalgenome.org/cgi-bin/QTLdb/index), variant start and end position, reference and alternate allele, variant type, variant length, and gene category.
The transcriptome datasets included the gene name, log2FoldChange, p-value, adjusted p-value, species, conditions, and gene category. Both datasets were labeled accordingly, enabling classification into immune and nonimmune gene categories. Transcriptome data were sourced from multiple GEO datasets generated on different sequencing platforms and protocols. While batch effects are a known concern in such cases, our study relied on differential expression summary statistics (log2FoldChange, p-values, adjusted p-values) along with gene annotations (gene symbol, gene category, immune type) as input features for model training, rather than raw or normalized per-sample expression matrices. Since these features are gene-level summaries, traditional batch-effect correction methods (e.g., ComBat, RUVSeq) are not directly applicable. Moreover, because our aim was to distinguish immune genes from nonimmune genes rather than to compare expression values across experiments, dataset-specific technical variability is unlikely to cause systematic bias in the classification. At most, such variability may add noise, but the model can still learn robust features across datasets. To assess feature importance in our model, we analyzed cross-correlation values among the genomic and transcriptomic training features. In the genomic dataset, chromosome, genomic position, and variant position showed stronger correlations compared to other features. In the transcriptomic dataset, log2FoldChange, p-value, species, and conditions were more strongly correlated. These patterns suggest that the selected features capture meaningful relationships, supporting the robustness of our multimodal approach for immune gene detection. The corresponding cross-correlation matrices are provided in Supplementary Figures S1 and Figure S2.
Balancing class distribution
The imbalanced distribution of classes makes it hard to train an efficient learning model, causing the majority class with high accuracy but the minority class with low accuracy (Shahabadi et al., 2021). To obtain an efficient model with balanced datasets, we evaluated ten different undersampling techniques. Among them, Cluster Centroids performed well over other methods like NearMiss by achieving balanced datasets while retaining more samples. We maintained an approximate 1:1 ratio of immune and nonimmune genes, resulting in 1745 descriptors per class in the genomic dataset and 767 descriptors per class in the transcriptomic dataset. This allowed us to build a balanced training set without discarding valuable minority class data. We deliberately avoided oversampling or hybrid methods, such as SMOTE, to prevent the introduction of synthetic or artificial gene expression profiles that might distort true biological variability.
Adding synthetic data such as those generated by oversampling techniques like SMOTE can be harmful when building models, particularly in high-dimensional biological contexts. First, synthetic data generated by methods like SMOTE reduce gene-level variance by interpolating between minority class samples, creating “variance-shrinkage” that narrows the natural expression ranges and degrades the model’s ability to learn biologically relevant patterns (Blagus and Lusa, 2013). Such synthetic samples are often placed in nonrepresentative or biologically implausible regions of the feature space, which introduces ambiguous labels and distorts decision boundaries, ultimately impairing the model’s discriminative power (Viñas et al., 2022). Furthermore, the artificial replication of patterns through oversampling can lead to overfitting, especially in models such as tree-based algorithms, by inflating cross-validation performance with near-duplicate data that fails to generalize to external datasets (Gygi et al., 2023). Additionally, synthetic minority oversampling has been shown to propagate and often amplify biases or confounding factors inherent in the original dataset, thereby compromising model fairness and reliability (Alkhawaldeh et al., 2023). Together, these issues demonstrate that the naive use of synthetic data can reduce model fidelity and biological interpretability, justifying the avoidance of SMOTE in favor of alternative methods that better preserve genuine biological variance and structure.
Model performance and evaluation
We implemented an FCNN, a conventional form of deep neural networks with two dense layers per branch to build the multimodal model by integrating genomic and transcriptomic datasets for immune gene classification (Fig. 2). In this neural network, every neuron in a layer is fully connected to all neurons in the subsequent layers. Performance was evaluated using F1-score, precision, and recall. The model achieved accuracy scores of 84.72% in the training datasets, 85.11% in the test set, and 85.10% in the validation set. The F1-score was accepted as a more robust indicator for machine learning-based predictions (Gao et al., 2019). Hence, the model was obtained with F1-scores of 0.85 (test set) and 0.85 (validation set), precision of 0.85 (test set) and 0.86 (validation set), and recall of 0.86 (test set) and 0.85 (validation set). These results demonstrate the model’s strong generalization capability in immune gene classification.
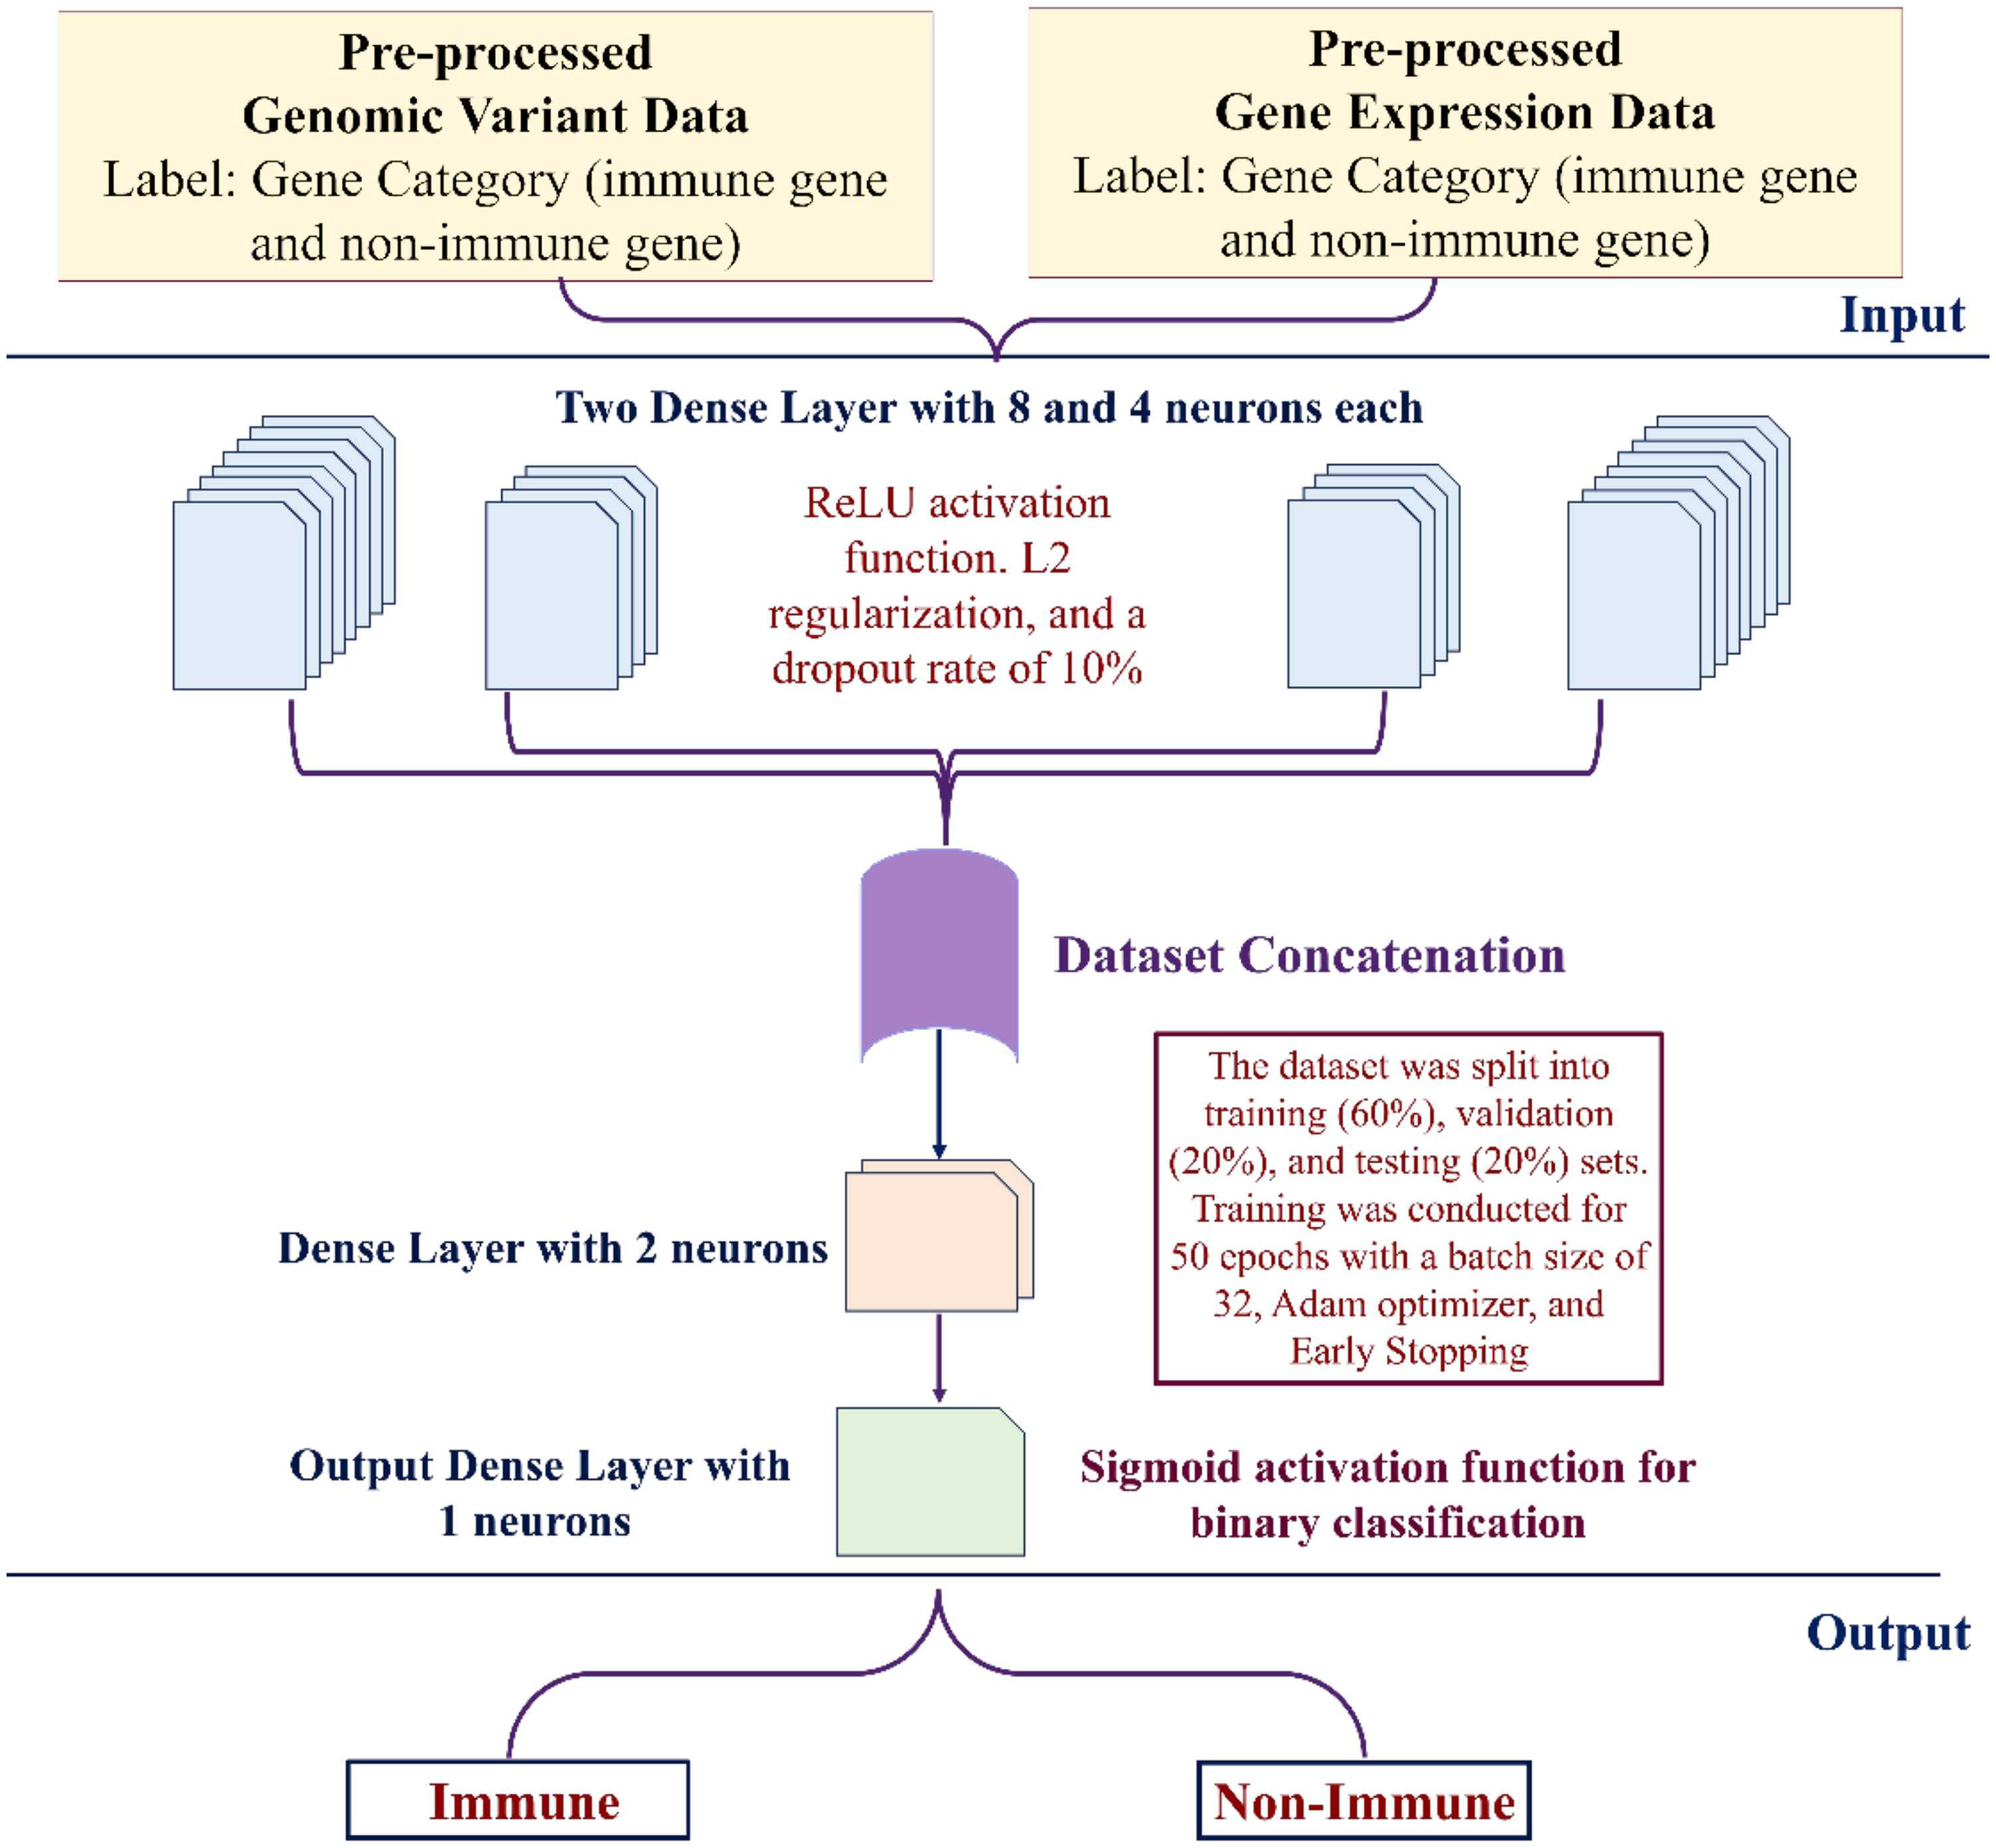
Architecture of the FCNN-based multimodal deep learning framework for immune gene classification in cattle. Preprocessed genomic variant data and gene expression data were used as inputs, each labeled into immune and nonimmune gene categories. Both datasets were passed through two dense layers (eight and four neurons) with ReLU activation, L2 regularization, and a dropout rate of 10%. The resulting feature representations were concatenated and further processed through a dense layer with two neurons, followed by an output dense layer with one neuron. The dataset was split into training (60%), validation (20%), and testing (20%) sets, and training was performed for 50 epochs with a batch size of 32 using the Adam optimizer and early stopping. A sigmoid activation function was applied for binary classification of genes into immune and nonimmune categories.
To assess the performance of the proposed FCNN model, we conducted a comparative analysis using classical machine learning algorithms trained solely on the transcriptomic dataset. The training dataset consisted of 920 datapoints. Additionally, the features for the SVM were derived from transcriptomic data, including one-hot encoded categorical variables (species, condition, adaptive, innate) and standardized numerical features (padjusted, p-value). The SVM achieved a test accuracy of 92.5%. We also tested the training dataset using a traditional neural network consisting of two hidden layers with 128 and 64 neurons, respectively, and a single-neuron output layer, which had a baseline performance of 93% for either genomics data or transcriptomics data, individually. However, such trained neural network models have inherent limitations. Random Forest and XGBoost both achieved 100% accuracy, though this was accompanied by perfect performance on training and validation sets, indicating overfitting. In contrast, the FCNN model, trained on a combination of transcriptomic and genomic features, achieved a lower accuracy of 86%. Despite this, the FCNN architecture offers the advantage of integrating heterogeneous data types within a unified deep learning framework. These findings suggest that while single-omics models may achieve higher predictive accuracy, the multiomics FCNN provides a scalable and integrative solution for future biological applications.
Analysis of the model performance
Accuracy and loss
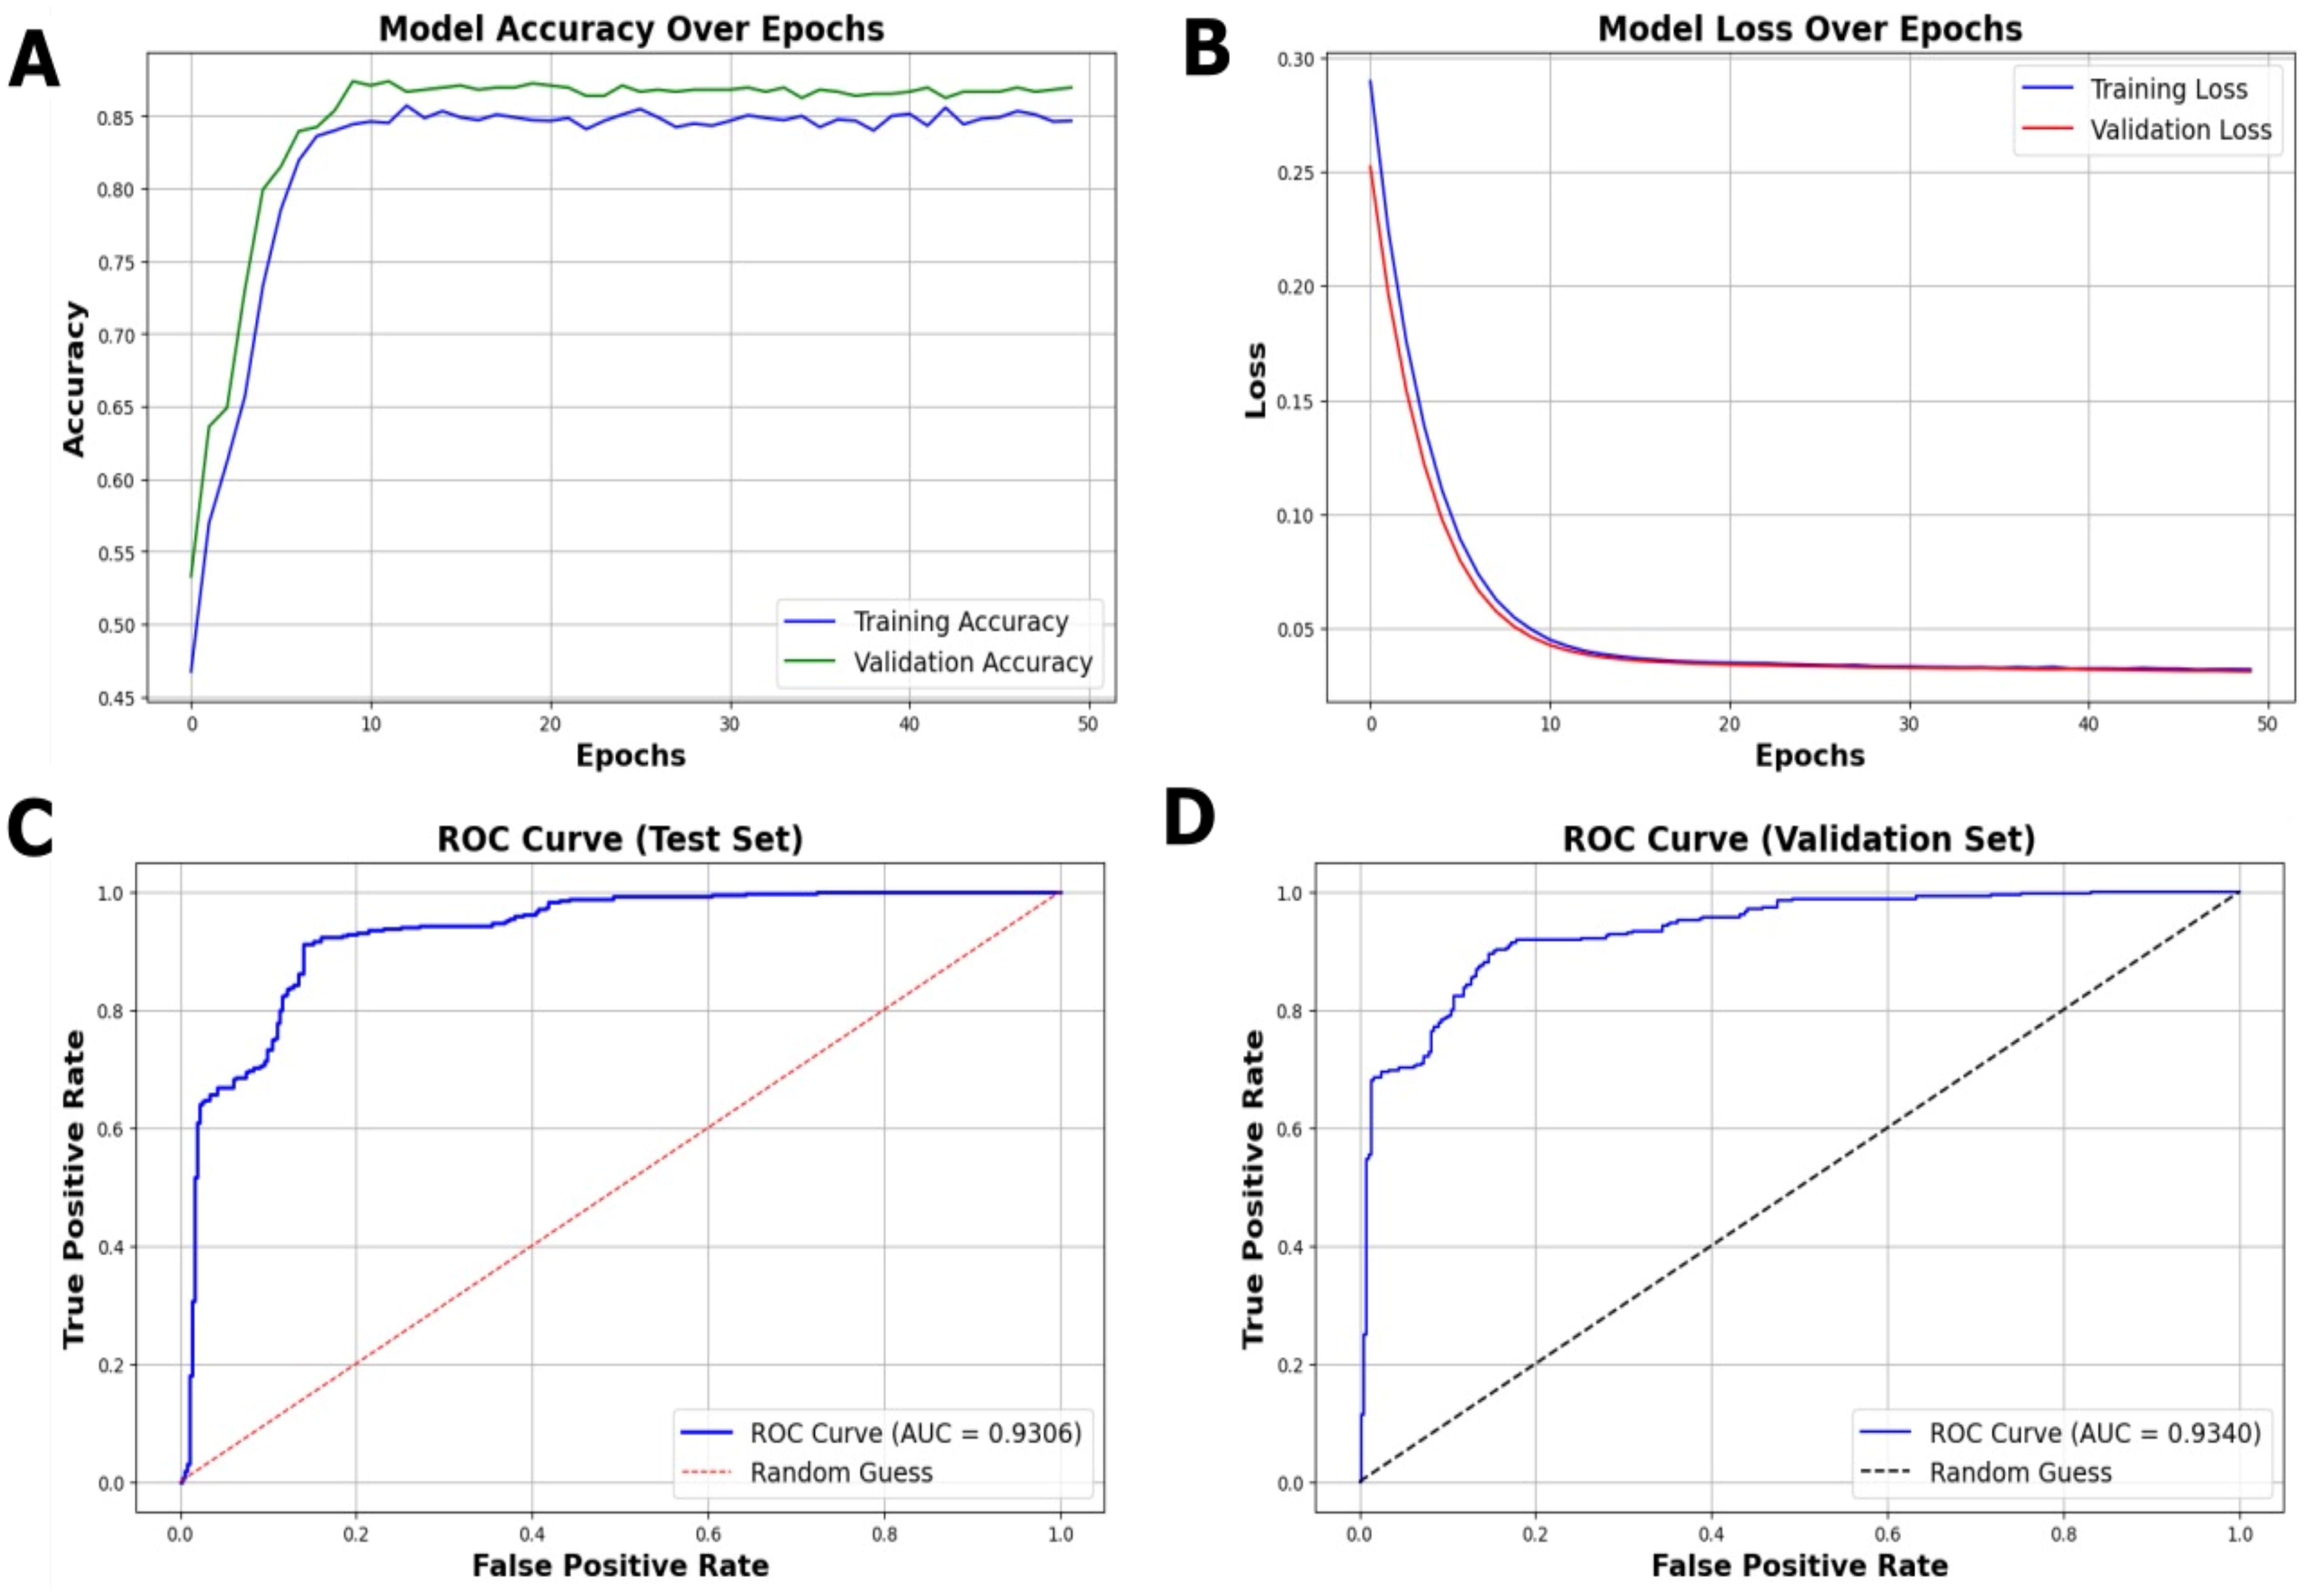
The model achieved a stable accuracy of 85%, indicating consistent performance across training and validation sets (Fig. 3A). Interestingly, the training accuracy was consistently lower than the validation accuracy. While such behavior can arise from the use of dropout and other regularization techniques, in our case, it is more likely attributable to subtle differences in the data distribution between the training and validation sets. Specifically, the validation set contained a relatively more balanced representation of immune and nonimmune genes, whereas the training set included a higher proportion of difficult-to-classify cases, which led to slightly lower training accuracy. Importantly, both accuracy and loss curves remained stable across epochs, indicating that this trend does not reflect overfitting but rather the inherent variability in the dataset split.
Multimodal model’s performance. Model performance of the developed model was evaluated based on
The loss values exhibited a sharp decline during initial training epochs, followed by a plateau, denoting effective learning without signs of overfitting (Fig. 3B). This possibly suggests that the model is reasonably successful in capturing the meaningful patterns in the data.
Confusion matrix analysis
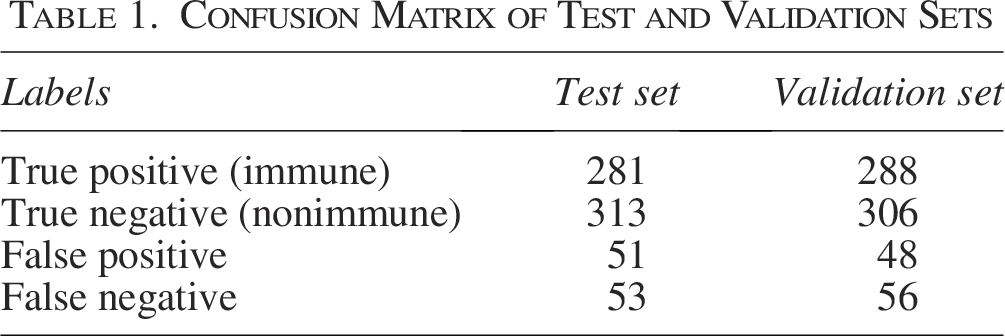
The model demonstrates high true positive and true negative rates, validating its reliability in classifying immune-related genes (Table 1). The minimal occurrence of false positives and false negatives further confirms its predictive strength.
Confusion Matrix of Test and Validation Sets
Area under the receiver operating characteristic curves
The area under the curve (AUC) scores of 0.9306 for the test set (Fig. 3C) and 0.9340 for the validation set (Fig. 3D). These high AUC values reflect the model’s capability and robustness to distinguish between immune and nonimmune genes. Overall, the results indicate the model’s effectiveness in classifying immune-related genes with high accuracy, controlled loss behavior, and stable area under the receiver operating characteristic curve (AUC-ROC) performance.
Potential applications of ImmFinder for future research in livestock genomics
Although human and mouse immunity databases would help livestock scholars to identify common immune genes to an extent, the genes involved in innate and adaptive immunity vary between species, especially among those distantly related evolutionarily. It is well known that ruminants (Cattle, buffalo, etc.) and simple-stomach species (e.g., human, mouse) are evolutionarily distant. Therefore, a bioinformatics tool exclusively useful for cattle and other dairy animals is required. In this context, the developed ImmFinder would be highly useful to the scholars conducting research on the immunity of cattle as well as on other ruminants. Particularly, the ImmFinder is useful for functional annotation of immunity genes in genomic, transcriptomic, proteomic, and epigenomic studies targeting differences in immunity genes or proteins among different breeds of ruminant species and under different challenge studies with pathogenic molecules. Additionally, ImmFinder would be useful to identify the genome-wide immune genes that show genetic differences such as copy number variations among different breeds of cattle, so that future molecular breeding methods can be developed and implemented to improve disease resistance in cattle. Furthermore, ImmFinder would be useful for nutrition and nutrigenomics studies targeting to modulate the specific function of a particular immune gene for improving the immunity of cattle in general, as well as during vaccination and disease outbreaks in particular. In other words, ImmFinder would be useful to select the immune genes from a total of differentially expressed gene lists of cattle in healthy and disease conditions, thereby specific immune modulators can be selected to include in cattle rations. It is well known that the 70% expense of any dairy industry is nutrition. Hence, the ImmFinder would not only be useful to basic research but also for the livestock industry.
Conclusions
The identification of immune genes from nonimmune genes in cattle is important to understand the immune mechanisms and their association with the disease resistance trait. Accurate classification of these genes can provide valuable insights into livestock health and genetic traits, contributing to advancements in breeding programs and disease management. Traditional methods for immune gene identification often rely on single-omics data, limiting their predictive power and comprehensiveness.
MDL models have emerged as powerful tools for integrating multiple data sources to capture significant insights. In this study, we introduced ImmFinder, an MDL-based framework utilizing an FCNN to integrate genomic and transcriptomic data for immune gene classification in cattle.
ImmFinder marks a significant advancement in immune gene classification in livestock genomics, obtaining a training accuracy of 85.24% and a validation accuracy of 85.67%. The training accuracy remained slightly lower than validation accuracy, likely due to subtle differences in data distribution between the two sets rather than model artifacts. The model exhibited strong generalization and good performance, with F1-scores of 0.8512 on the test set and 0.8509 on the validation set. The high AUC scores of 0.9306 for the test set and 0.9340 for the validation set further highlight its ability to effectively distinguish immune genes from nonimmune genes.
Importantly, unlike human and mouse immunity databases that only partially aid livestock research, ImmFinder is tailored specifically for cattle and other ruminants, which are evolutionarily distinct from simple-stomach species. This tool holds significant promise for functional annotation of immune genes across genomic, transcriptomic, proteomic, and epigenomic studies and for understanding immune variation among cattle breeds under different pathogenic challenges. Furthermore, ImmFinder could facilitate the discovery of immune-related genomic differences, such as copy number variations, thereby enabling future molecular breeding strategies to enhance disease resistance. Its utility also extends to nutrition and nutrigenomics studies, where it can help identify immune modulators for dietary interventions, a critical aspect given that nutrition accounts for nearly 70% of dairy production costs.
This approach can be further enhanced by incorporating additional gene variants and transcriptomic data from diverse cattle populations, improving immune gene classification and broadening its applicability in livestock research.
Authors’ Contributions
M.T., P.P.K., M.S., and S.S.: Data curation, formal analysis, investigation, validation, and writing—original draft. D.S., S.K.O., and R.M.Y.: Conceptualization, project administration, resources, supervision, and writing—review and editing.
Footnotes
Acknowledgments
The authors thank the Indian Council of Agricultural Research-National Agricultural Science Fund (ICAR-NASF), SASTRA Deemed to be University, and the Indian Council of Agricultural Research-National Dairy Research Institute.
Author Disclosure Statement
The authors declared that there are no conflicts of interest.
Funding Information
This work has been supported by the ICAR-NASF (F. No. NASF/SUTRA-02/2022-23/50) to R.M.Y., D.S., and S.K.O.
Data and Code Availability
Supplemental Material
Supplemental Material
Supplemental Material
Abbreviations
References
Supplementary Material
Please find the following supplemental material available below.
For Open Access articles published under a Creative Commons License, all supplemental material carries the same license as the article it is associated with.
For non-Open Access articles published, all supplemental material carries a non-exclusive license, and permission requests for re-use of supplemental material or any part of supplemental material shall be sent directly to the copyright owner as specified in the copyright notice associated with the article.