
Abstract
Integrating Big Data, such as large-scale transcriptomic datasets across diseases, continues to be a major challenge. This is in part due to inconsistent preprocessing and the lack of a standardized, reproducible analytical framework. Existing pipelines often rely on manual parameter tuning and fragmented scripts, which limits cross-dataset comparability and downstream interpretability. We developed disint (disease integration and clustering toolkit), an open-source Python framework for standardized cross-dataset expression integration, embedding, and clustering. The pipeline implements housekeeping gene-based normalization, disease-specific log2 fold-change computation, automated Uniform Manifold Approximation and Projection hyperparameter optimization, and adaptive K-means clustering. Building on its outputs, we further implemented a prototype downstream module, disease reposition, which extracts disease-specific gene signatures, evaluates their shared components, and explores potential drug repositioning candidates. The framework was validated on 28 transcriptomic datasets encompassing 34 disease categories and 386 samples, including 255 patient and 131 healthy control samples, covering 194,182 genes in total. These results highlight the reproducibility, scalability, and translational versatility of our proposed framework.
Keywords
Introduction
Recent advances in transcriptome analysis technologies have produced large-scale heterogeneous transcriptomic multi-datasets spanning diverse diseases (Zheng et al., 2024). The integration of multi-omics data—including genomics, transcriptomics, proteomics, and metabolomics—offers an opportunity to elucidate complex biological systems, identify shared molecular signatures underlying disease mechanisms, and accelerate drug repositioning (DR) research (Jiang et al., 2025; Salvati et al., 2025; Zheng et al., 2024). In particular, computational DR approaches can substantially reduce development time and cost by repurposing approved compounds with established safety profiles (Salvati et al., 2025). The incorporation of artificial intelligence (AI) and machine learning (ML) methods into multi-omics analyses has dramatically increased both the efficiency and precision of such efforts (Cong and Endo, 2022; Salvati et al., 2025).
Nevertheless, extracting reproducible and biologically meaningful disease groupings from heterogeneous transcriptomic datasets remains a major challenge (Nakatsuka et al., 2025). The growing complexity of single-cell and bulk transcriptomic data, often spanning multiple conditions and laboratories, inevitably introduces batch effects and unwanted variations (Jiang et al., 2025; Luecken et al., 2022; Zheng et al., 2024). Moreover, differences in experimental protocols, normalization strategies, and dimensionality-reduction parameters frequently lead to inconsistent clustering results, complicating cross-study comparisons (Cong and Endo, 2024).
For highly heterogeneous diseases such as Alzheimer’s disease (AD) or schizophrenia, these issues can obscure differentially expressed genes (DEGs) or even introduce artificial cluster separation (Nakatsuka et al., 2025). Similar difficulties arise in tumor transcriptome analyses, where intratumoral heterogeneity further complicates the cluster interpretation (Ku et al., 2021).
To overcome these obstacles, it is essential to establish a reproducible and generalizable computational framework that standardizes preprocessing, optimizes embedding parameters, and systematically evaluates the clustering quality (Jiang et al., 2025; Oestreich et al., 2022). The horizontal integration of transcriptomic data—integration across datasets of the same omics type—requires robust approaches that minimize technical noise and emphasize biologically relevant signals (Luecken et al., 2022). Ratio-based normalization strategies, such as those employing common reference genes, have demonstrated higher reproducibility than absolute value profiling (Zheng et al., 2024). Similarly, network-based representations and transformation-based integration methods have proven to be effective in improving data robustness prior to clustering (Ahmed et al., 2023; Zhang et al., 2019).
For dimensionality reduction, AI/ML-based embedding techniques such as AutoEncoder, masked autoencoders, and AI-based manifold embedding have been developed alongside classical methods including uniform manifold approximation and projection (UMAP) and principal component analysis (PCA) (Dorrity et al., 2020; Lei et al., 2024; Ma and Zhang, 2019; McInnes et al., 2018; Yu, 2022). When coupled with unsupervised clustering algorithms such as K-means, these approaches have been shown to effectively improve the accuracy of cluster detection in large-scale omics datasets (Cong et al., 2022; Hozumi et al., 2021; Sakagianni et al., 2024).
This study focuses on the methodological development and validation of a reproducible, general-purpose pipeline for transcriptomic data integration and clustering. We developed an open-source Python framework, disint (disease integration and clustering toolkit), which standardizes and automates the key steps of expression data processing: housekeeping gene (HKG)-based normalization, disease-specific log2 fold-change (log2FC) computation, PCA-UMAP embedding with automated hyperparameter optimization, and adaptive K-means clustering.
Designed as a lightweight, modular, and mathematically oriented toolkit, disint provides a generalizable framework applicable to transcriptomic datasets across diverse disease contexts. To demonstrate the versatility of the framework without applying it to any specific disease, we applied disint to a set of multi-dataset bulk transcriptomic datasets. These applications highlight how disint supports disease-level similarity mapping, reproducible cross-dataset integration, and extraction of biologically meaningful structures, which together establish a foundation for future translational extensions.
Materials and Methods
The overall design and implementation of the disint pipeline included modular procedures for transcriptomic data preprocessing, normalization, embedding, clustering, and evaluation procedures. Each component was designed to operate independently or as a part of the complete workflow. Unless otherwise specified, all analyses were performed using transcriptomic datasets processed using identical normalization strategies and parameter settings.
Overview of the disint pipeline
disint was developed as an open-source Python framework that provides a standardized and reproducible workflow for large-scale transcriptomic data integration and visualization (Fig. 1).
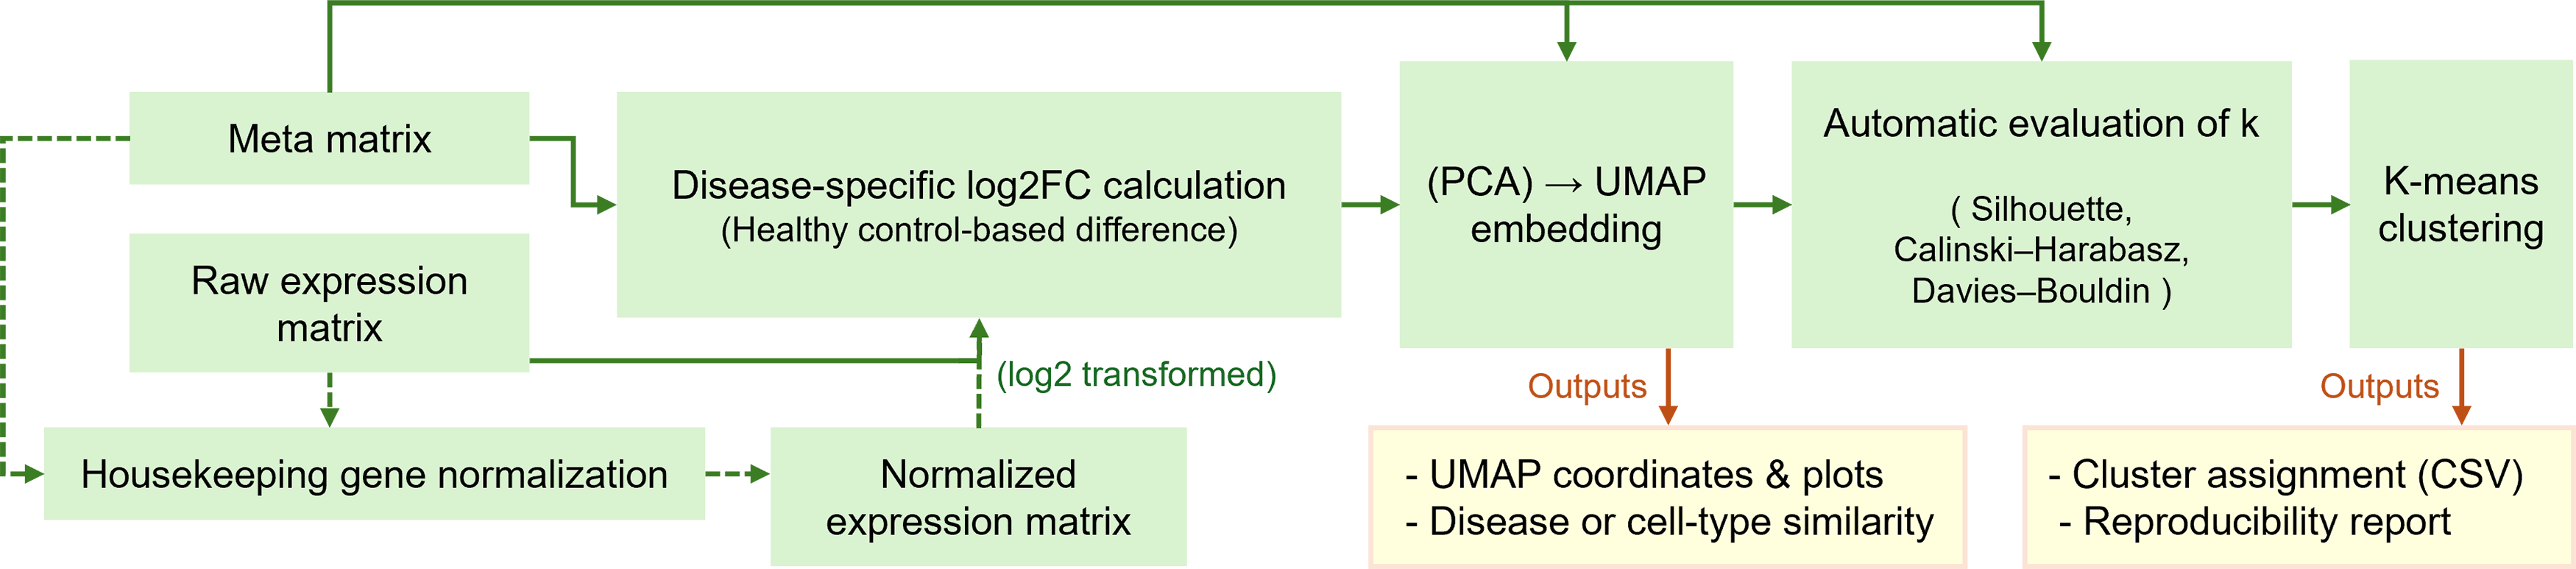
Overview of the disint pipeline for standardized transcriptomic integration and clustering. The workflow illustrates the main processing steps implemented in disint, including housekeeping-gene-based normalization, disease-specific log2 fold-change transformation, dimensionality reduction via PCA–UMAP, and optional downstream clustering. The pipeline supports both an embedding-only mode for visualization and a full-pipeline mode that includes automatic cluster number selection and K-means clustering, yielding integrated representations and clustering results.
The pipeline automates key analytical steps, including HKG-based normalization, disease-specific log2FC computation, dimensionality reduction, clustering, and result export. All modules are implemented as interoperable components, enabling flexible application to bulk transcriptomic datasets with a design that is compatible with single-cell transcriptomic data.
The input to disint consists of an expression matrix (genes × samples, accepting any count- or abundance-based values) and an optional metadata table describing sample-level attributes such as disease, condition, or cell type. The pipeline outputs a comprehensive set of results, including normalized and log2FC-transformed matrices, two-dimensional UMAP embeddings, automatically determined optimal cluster numbers (k), cluster assignment tables, and visualizations summarizing embedding and clustering quality. All outputs are automatically saved in standard formats (CSV, JSON, and PNG) to ensure reproducibility.
These two operating modes are supported. In the embedding-only mode, disint performs PCA-UMAP dimensionality reduction and directly visualizes the global similarity structure among diseases or biological conditions without subsequent clustering. This model is suitable for exploratory analyses of transcriptomic relationships.
In the full-pipeline mode, UMAP embedding is followed by automatic k selection and K-means clustering, producing cluster-level outputs such as membership tables and evaluation metrics. This dual-mode design allows disint to serve both as a general visualization tool and as a complete integration and clustering framework adaptable to a wide range of biological contexts.
Normalization with housekeeping genes
To minimize cross-dataset variability and establish a unified scale for expression quantification, disint adopts an HKG-based normalization strategy.
A panel of 20 candidate HKGs is predefined within the package based on the Housekeeping and Reference Transcript Atlas (HRT Atlas v1.0), which provides an official reference list of human housekeeping transcripts derived from large-scale RNA-seq meta-analysis across 52 human tissues (Hounkpe et al., 2021). These genes are included as fixed candidate sets in the current study.
For each dataset (termed “group”), disint evaluates the expression stability of each candidate HKG using three complementary indices: the maximum-to-minimum fold-change (MFC), the median absolute deviation (MAD), and the coefficient of variation (CV), all computed after optional trimming of extreme sample values to reduce the influence of technical or biological outliers. The resulting indices are normalized across genes and aggregated to produce a composite stability score reflecting the overall expression consistency across groups. By default, the three most stable HKGs are automatically selected as reference genes; however, the number of selected HKGs can be adjusted by the user, if desired.
For each sample, the geometric mean of the selected HKGs is used as the internal scaling factor. All expression values are subsequently rescaled such that the geometric mean of the selected HKGs matches a unified reference value shared across all groups. This scaling equalizes baseline expression magnitudes between datasets while preserving relative gene–gene relationships.
The resulting normalized matrix is used as input for downstream modules in disint, including log2FC computation, dimensionality reduction, and clustering. When combined with subsequent embedding and evaluation steps, this normalization ensures that disease- or group-specific signals primarily reflect biological variation rather than technical differences among the datasets.
Log2 fold-change computation
After normalization, disint computes per-sample log2FC profiles relative to disease-matched healthy controls. This procedure converts absolute expression values into relative expression signatures, thus enabling comparisons across heterogeneous groups.
For each disease D, all samples annotated with D in the metadata are identified. Each sample is associated with a subtype label (e.g., “RA/seropos+,” “RA/serop−”) stored in the label column. Control samples (e.g., “HC”) are then filtered to retain only those whose subtype tokens overlap with the disease samples, ensuring biologically appropriate matching. The mean expression of these matched controls is calculated per gene, and the log2FC for each disease sample is obtained as follows:

The resulting log2FC matrix (genes × disease samples) captures disease-specific expression shifts while minimizing intergroup bias. This matrix serves as the standardized input for subsequent embedding and clustering. Each column of the log2FC matrix represents an individual disease sample (e.g., a patient sample), thereby enabling manifold learning and disease similarity estimation at the disease level, with optional stratification by subtype when such labels are available.
Embedding and parameter optimization
To identify intrinsic similarity structures among disease-level expression profiles, disint performs a two-step dimensionality reduction consisting of PCA followed by UMAP, implemented using standard Python libraries (scikit-learn and umap-learn). PCA is first applied to reduce noise and computational complexity, retaining by default the top 50 components that capture most of the variance across samples. The resulting principal component scores are then subjected to UMAP for nonlinear manifold learning, generating a two-dimensional representation suitable for visualization and clustering.
All key UMAP hyperparameters, including the number of nearest neighbors (neighbors), minimum interpoint distance (min_dist), and distance metric (metric), are automatically optimized using Bayesian optimization implemented via Optuna, an open-source hyperparameter optimization framework based on the Tree-structured Parzen Estimator algorithm (Akiba et al., 2019; McInnes et al., 2018). Optuna provides an efficient, define-by-run Application Programming Interface (API) that adaptively explores the parameter space while pruning unpromising trials, thereby outperforming traditional grid search or random search strategies in terms of both speed and accuracy (Shekhar et al., 2021). This allows disint to perform dataset-specific tuning of UMAP parameters without manual intervention, achieving optimal low-dimensional representations for diverse transcriptomic data.
During the tuning process, disint supports two modes. When sample-level metadata contain a biological or clinical grouping column (e.g., “disease” or “cell_type”), the optimization proceeds in a
If no such label information is available, disint automatically switches to an
The search space of Optuna is defined over wide biologically relevant ranges: neighbors ∈ [5, 120], min_dist ∈ [0.01, 0.8], and metric ∈ {euclidean, manhattan, canberra, cosine}. These four metrics are among the most widely used distance measures in disease transcriptomic clustering studies, offering complementary sensitivity to local versus global expression variations.
For each distance metric, disint conducts independent optimization and retains the best solution, rather than forcing a single “winner.” This design enables users to evaluate how different metrics capture the complementary aspects of disease- or group-level similarity.
The final optimized UMAP embedding, together with its parameter set and provisional labels, is passed to the next stage for automatic k selection and clustering (see the next section).
Determining the number of clusters
Following UMAP embedding, disint automatically determines the optimal number of clusters (k) in a data-driven manner. For each embedding, a range of k values is explored and evaluated using three widely recognized internal validation indices: the
These indices are standard measures of clustering validity that quantify within-cluster cohesion, between-cluster separation, and intercluster similarity. The Silhouette coefficient assesses how well each sample is matched to its own cluster compared with the others (Rousseeuw, 1987). The CH index evaluates the ratio of between-cluster to within-cluster dispersion (Calinski and Harabasz, 1974), and the DB index measures the average similarity between each cluster and its most similar neighbor (Davies and Bouldin, 1979). Because each index captures a distinct aspect of clustering quality, disint integrates all three to achieve a consensus evaluation that balances compactness and separation.
When sample-level group labels (e.g., “disease” or “cell_type”) are provided, disint uses the number of unique groups (G) to set the search range for k between 2 and G (capped at 50 by default to avoid computational overload). In the absence of group labels, unsupervised fallback mode scans k values from 2 to K0 = 40, providing a moderate resolution suitable for exploratory datasets. However, unless the dataset is small or lacks meaningful biological grouping, relying on this internal default (K0 = 40) is
For each candidate k, the three indices are computed independently, and the consensus optimum across them is selected as the final kbest. To ensure comparability, all index values are first rescaled to a 0–1 range before integration. By default, disint employs a balanced criterion that simultaneously favors high Silhouette and CH scores and a low DB index. Alternatively, users may enforce the optimization of a single metric (e.g., silhouette only) to accommodate specific data characteristics or downstream conventions.
Because the three indices differ in sensitivity to sample size, cluster density, and noise, disint allows users to inspect all metric profiles and manually select the most appropriate k for their data if desired. This flexibility is particularly useful for transcriptomic datasets, where biological heterogeneity or sample imbalance can render certain indices less informative.
The chosen k value is then passed to the final K-means clustering step, which assigns the cluster membership to each sample and produces the final visualization.
K-means clustering and output
After the optimal number of clusters (kbest) is selected, disint performs the final clustering step using K-means on the optimized two-dimensional embedding (typically the UMAP coordinates). The K-means implementation follows the standard Lloyd algorithm as provided in scikit-learn, with multiple initializations (n_init=“auto”) and a fixed random seed to ensure reproducibility (Lloyd, 1982; Pedregosa et al., 2018). For a given embedding, each sample is assigned to one of kbest discrete clusters, and the fitted K-means model is returned together with the per-sample cluster labels.
In addition to computing the cluster membership, disint generates publication-ready summary outputs. First, it produces a two-dimensional scatter plot of the embedding in which each point (sample) is colored by its assigned cluster identity. This visualization is created using lightweight plotting utilities within the package and can be saved at a high resolution (300 dpi) for direct inclusion in the figures. The same plotting interface can alternatively color samples by any provided annotation (e.g., disease category or cell type) instead of K-means clusters, allowing users to compare unsupervised structures with known biological labels.
Second, disint exports the cluster assignments as a table (sample identifiers with their cluster labels and the chosen k) and records the final model state and parameters in a structured dictionary. These outputs can be written in standard formats, such as CSV (for membership tables) and JSON (for run metadata and parameter settings), enabling downstream interpretation, reproducibility, and integration with external analysis workflows.
Finally, because the same embedding can be used either (i) without clustering to visualize global similarity among diseases or cell types or (ii) with clustering to define discrete transcriptional subgroups, the clustering step in disint is intentionally optional. Users interested only in continuous disease similarity mapping (e.g., trajectory-such as structures across inflammatory conditions or separation among cell types) may stop at the embedding stage. Users aiming to derive discrete molecular subtypes can proceed through automatic k selection and final K-means clustering to obtain cluster definitions suitable for downstream tasks such as subtype characterization or candidate drug prioritization.
Implementation
The disint framework was implemented in Python (tested on versions 3.9–3.11) and packaged using the standard setuptools structure. Core dependencies include pandas, NumPy, numba, umap-learn, scikit-learn, matplotlib, and Optuna, as specified in the project’s pyproject.toml file. All analyses in this study were performed using these validated versions to ensure reproducibility and cross-platform consistency.
Prototype drug-repositioning workflow (demonstration)
To demonstrate the downstream applicability of disint, we implemented an automated prototype for DR analysis, extending the conceptual framework described in our previous study (Cong et al., 2022).
For diseases assigned to the same cluster by disint, differential expression analysis can be conducted using the limma package (accessible from Python via rpy2 if required) to identify significantly dysregulated genes between disease and control samples. These genes exhibiting substantial changes in expression are then compared across diseases within the same cluster to extract consensus disease signatures. Subsequently, these signatures are queried against the L1000CDS2 database to identify candidate compounds predicted to reverse observed transcriptional alterations (Duan et al., 2016).
This framework provides an automated and reproducible bridge from disint-based clustering to downstream DR inference, enabling the systematic exploration of therapeutic hypotheses across disease groups.
Results
The disint framework was systematically evaluated using an integrated collection of bulk disease transcriptomic datasets to assess the reproducibility, clustering quality, and sensitivity to distance metric selection. The pipeline produced stable low-dimensional embeddings and consistent clustering structures, supporting a robust comparison of disease-level expression profiles. In addition, the generated outputs enabled downstream biological interpretation and served as the basis for exploratory DR analysis.
Overview of datasets and experimental setup
To evaluate the performance of disint, we applied the pipeline to an integrated collection of bulk disease transcriptomic datasets.
The primary dataset collection consisted of 28 disease datasets covering 34 diseases and 386 samples (255 patients and 131 healthy controls). All datasets were downloaded from the National Center for Biotechnology Information (NCBI) Gene Expression Omnibus (GEO). The accession numbers of all bulk datasets and the corresponding sample identifiers are provided in a public repository, as described in the Data and Code Availability section. Raw Sequence Read Archive (SRA) files were retrieved using the SRA Toolkit, converted to FASTQ format, and quantified with Salmon using the Homo sapiens GRCh38 reference transcriptome (Ensembl release 110). The resulting transcript-level matrices were merged into a unified matrix containing 194,182 entries and normalized using the HKG strategy described earlier.
This dataset was used to benchmark the normalization effects, embedding reproducibility, and automatic clustering performance.
Normalization effects and batch alignment
We first evaluated the effect of the HKG-based normalization procedure implemented in disint. For each of the 28 bulk datasets, we selected a panel of candidate housekeeping transcripts and ranked them by cross-dataset stability using trimmed dispersion statistics (MFC, MAD, and CV), as described above and implemented in the normalization module of disint.
The top-ranked genes were then used to compute a per-sample geometric mean expression level, which served as an internal scaling reference. Each sample’s expression profile was multiplicatively rescaled so that its HKG geometric mean matched a common global reference, yielding the HKG-normalized expression matrix. To visualize the impact of this normalization step, we compared gene expression patterns before and after normalization using the 50 most variable transcripts across all samples (Supplementary Fig. S1).
In the raw expression matrix, some samples exhibited extremely high or low overall intensity, leading to vertical stripes with compressed dynamic range for subsets of genes. After HKG-based normalization, these global intensity differences were substantially reduced: highly saturated columns were compressed, and overly suppressed columns were lifted toward the common dynamic range. This indicates that large-scale amplitude differences between datasets are corrected without forcing all samples to become identical.
Importantly, this correction is not purely cosmetic in nature. When we propagated the normalized matrix into downstream analyses, two improvements were observed. First, the disease-specific log2FC profiles computed relative to matched healthy controls became more comparable across datasets, reducing spurious “disease effects” that were in fact driven by dataset-specific baseline shifts. Second, the subsequent PCA-UMAP embeddings and K-means clustering preserved disease-level structure while reducing separation driven purely by technical batch differences. These trends suggest that HKG-based scaling improves cross-dataset alignment while retaining biologically meaningful distinctions at the disease level. Together, these results support the use of lightweight, sample-wise scaling rather than aggressive batch correction: disint improves comparability across studies but does not erase disease-driven signals that are later exploited for embedding, cluster definition, and downstream interpretation.
For comparison, we evaluated representative batch-correction and data-integration approaches, including ComBat, BBKNN, and scVI, using the same multi-disease bulk transcriptomic dataset. Both the raw expression matrix and the outputs of each integration method were assessed with the scIB framework, which quantitatively evaluates integration performance by combining batch-mixing and biological conservation scores into a unified composite metric (final_score = 0.4 × batch_score + 0.6 × bio_score) (Luecken et al., 2022).
As summarized in Supplementary Table S1, none of the evaluated methods achieved a clear improvement over the raw representation in terms of composite score. While some approaches exhibited modest gains in batch-mixing performance, these improvements were consistently accompanied by pronounced reductions in biological conservation. As a result, no method provided a favorable trade-off between inter-dataset alignment and preservation of the disease-level biological structure in this setting.
Disease-specific expression shifts
To quantitatively evaluate disease-associated transcriptomic changes, we computed disease-specific log2FC values by comparing each disease group with its matched healthy controls within the same group. This measure reflects the direction and magnitude of transcriptional dysregulation and serves as a key feature for downstream DR analyses, where diseases are grouped based on the similarity of their gene expression alterations. Because the interpretation of log2FC patterns is sensitive to baseline intensity differences, we computed log2FC both before and after HKG-based normalization in order to assess how normalization affects the detectability of disease-specific signals. The full log2FC matrices before and after HKG-based normalization are publicly available as described in the Data and Code Availability section.
To visualize the global effect of normalization, we calculated group-mean log2FC matrices for all disease groups and extracted the 50 genes with the largest absolute change between the two conditions (Fig. 2).
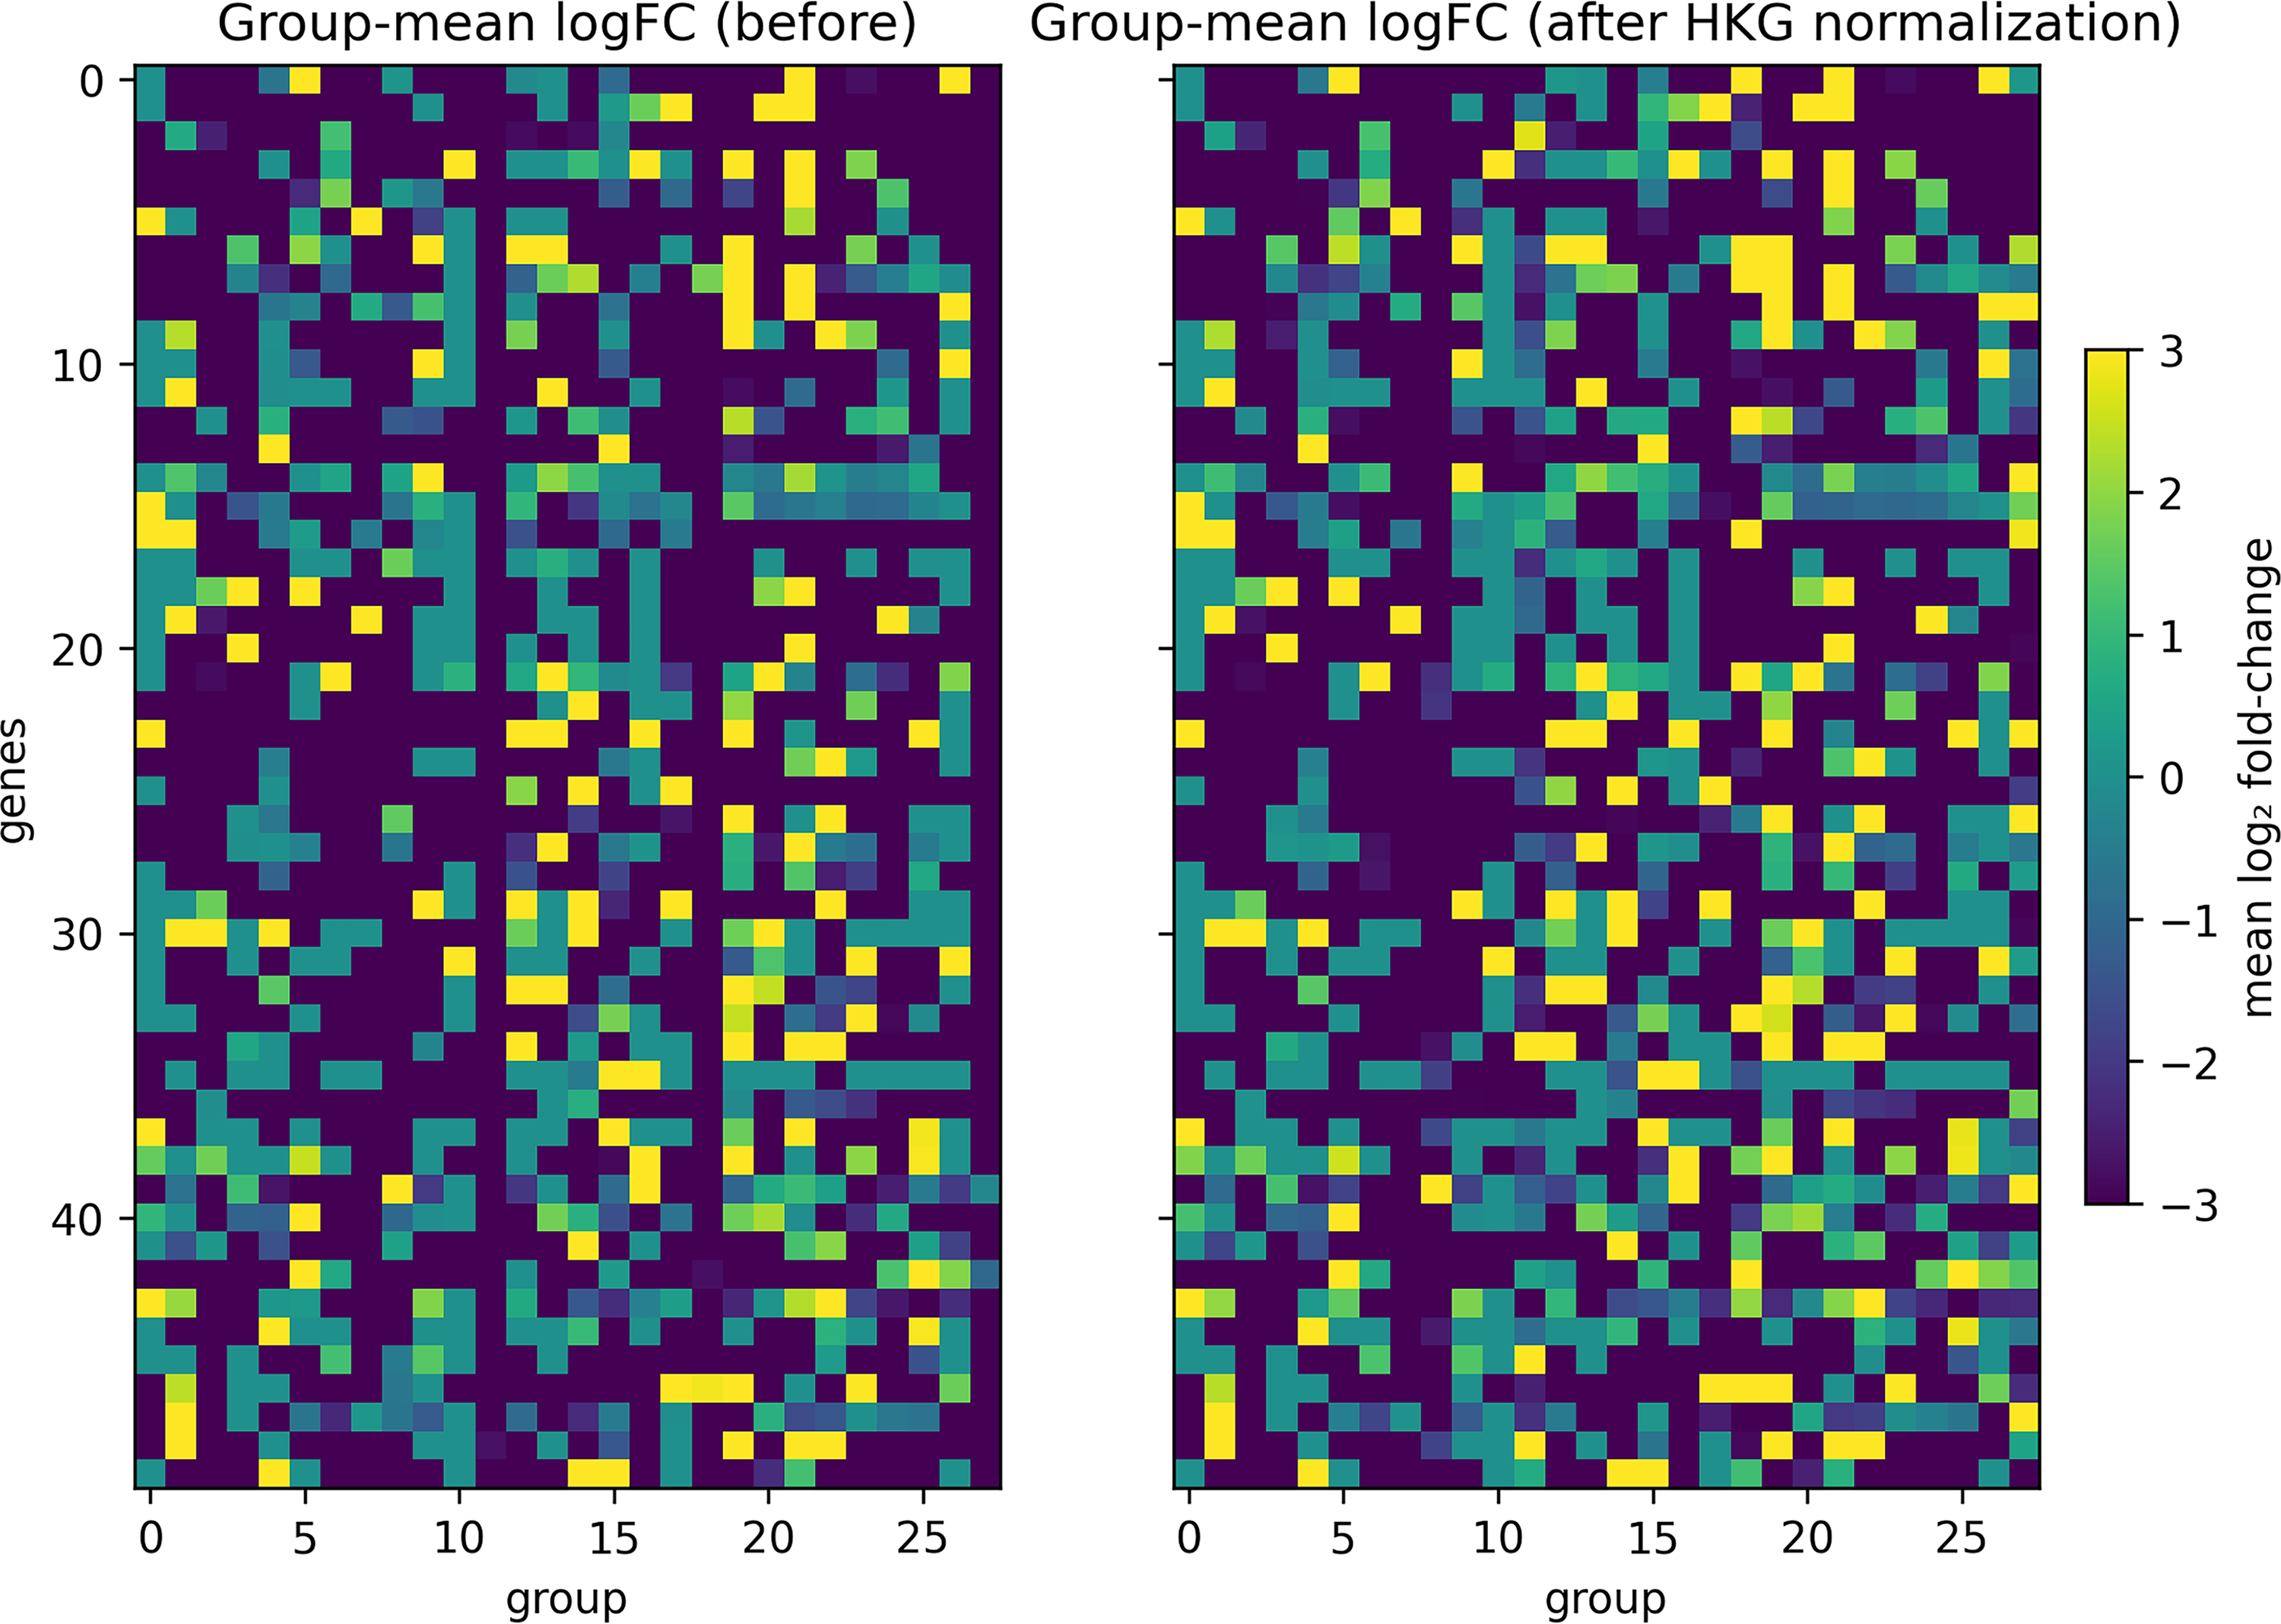
Group-mean log2FC patterns before and after HKG-based normalization. Heatmaps display group-mean log2 fold-change (log2FC) profiles for disease cohorts before (left) and after (right) HKG-based normalization. Each column represents a disease cohort and each row a transcript. The 50 transcripts showing the largest average absolute difference between pre- and post-normalized log2FC values are shown. The color scale indicates log2FC values ranging from −3 to 3.
Before normalization, the group-mean log2FC heatmap appeared mostly uniform with dark tones, indicating that technical amplitude differences across datasets suppressed the apparent fold-change variation. After normalization, clearer positive and negative deviations emerged across multiple groups, suggesting that HKG-based scaling recovered biologically meaningful up- and down-regulation patterns that had been masked by baseline bias. These results demonstrate that normalization improves the interpretability of log2FC profiles without introducing artificial signal amplification.
Notably, a few exceptional groups (e.g., Group 8) showed an opposite trend, where previously distinguishable signals became uniformly negative after normalization. This likely reflects instability of the selected HKGs within specific disease groups rather than a genuine loss of biological contrast. We revisit this issue and discuss its implications for HKG selection in the Discussion section of this article.
Embedding and clustering of disease profiles
We applied disint to the integrated multi-disease bulk transcriptomic dataset to evaluate the effects of normalization on disease-level embedding structure and clustering performance. Both raw and HKG-normalized log2FC matrices were analyzed using PCA-UMAP dimensionality reduction followed by automatic K-means clustering.
The optimized UMAP parameters and selected cluster numbers (kbest) for all four evaluated metrics (Euclidean, Manhattan, Canberra, and Cosine) are summarized in Supplementary Table S2. Representative results obtained using the Manhattan distance metric are shown in Figure 3, including UMAP embeddings and corresponding clustering outcomes before and after normalization. Results for the remaining metrics are shown in Supplementary Figures S2, S3 and S4.
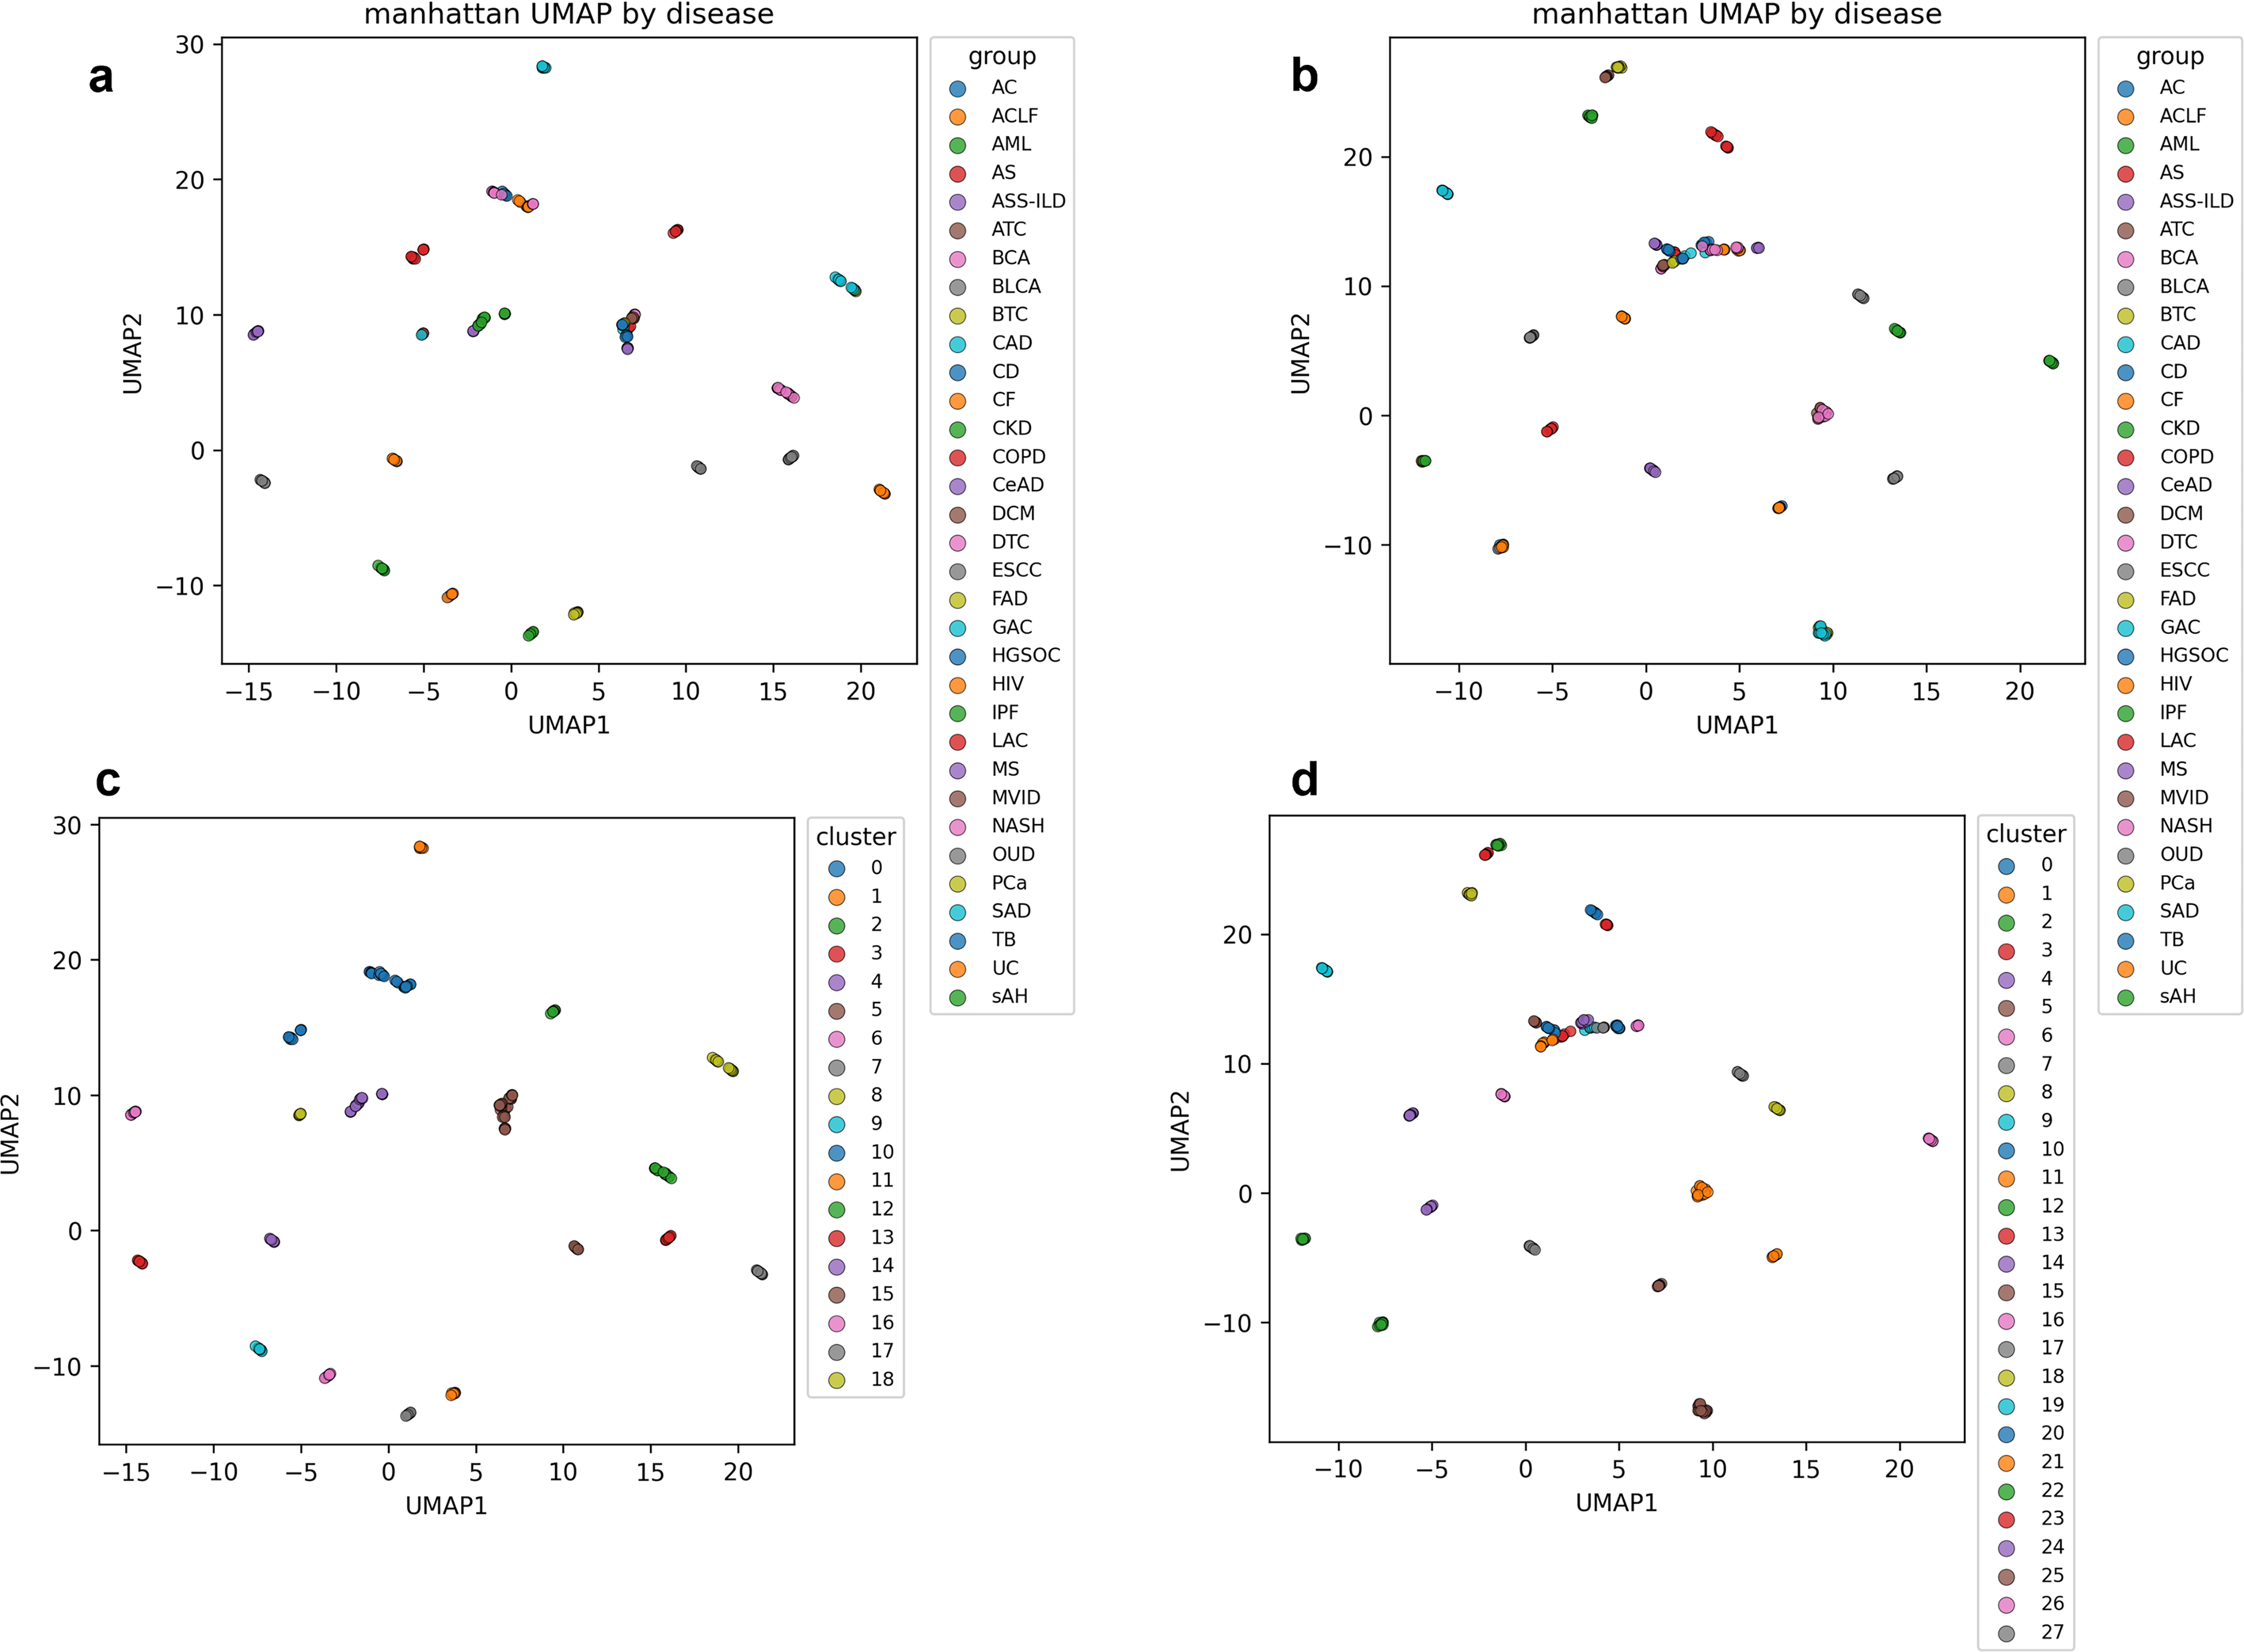
Effects of HKG normalization on disease-level embeddings and clustering (Manhattan distance). UMAP embeddings and K-means clustering results generated using the Manhattan distance metric are shown before and after HKG-based normalization.
In the normalized embeddings, diseases with similar transcriptional perturbation patterns formed compact and well-separated clusters, whereas in raw embeddings exhibited blurred boundaries and partial overlap among disease groups. These differences were consistently reflected in the clustering results, where samples with highly similar log2FC profiles were grouped together after normalization, indicating improved identification of shared molecular signatures.
Cluster number selection was primarily guided by the silhouette coefficient, which showed the most stable behavior across metrics following normalization. Representative k-selection curves for the Manhattan metric are shown in Figure 4, with corresponding results for other metrics provided in Supplementary Figures S5, S6 and S7.
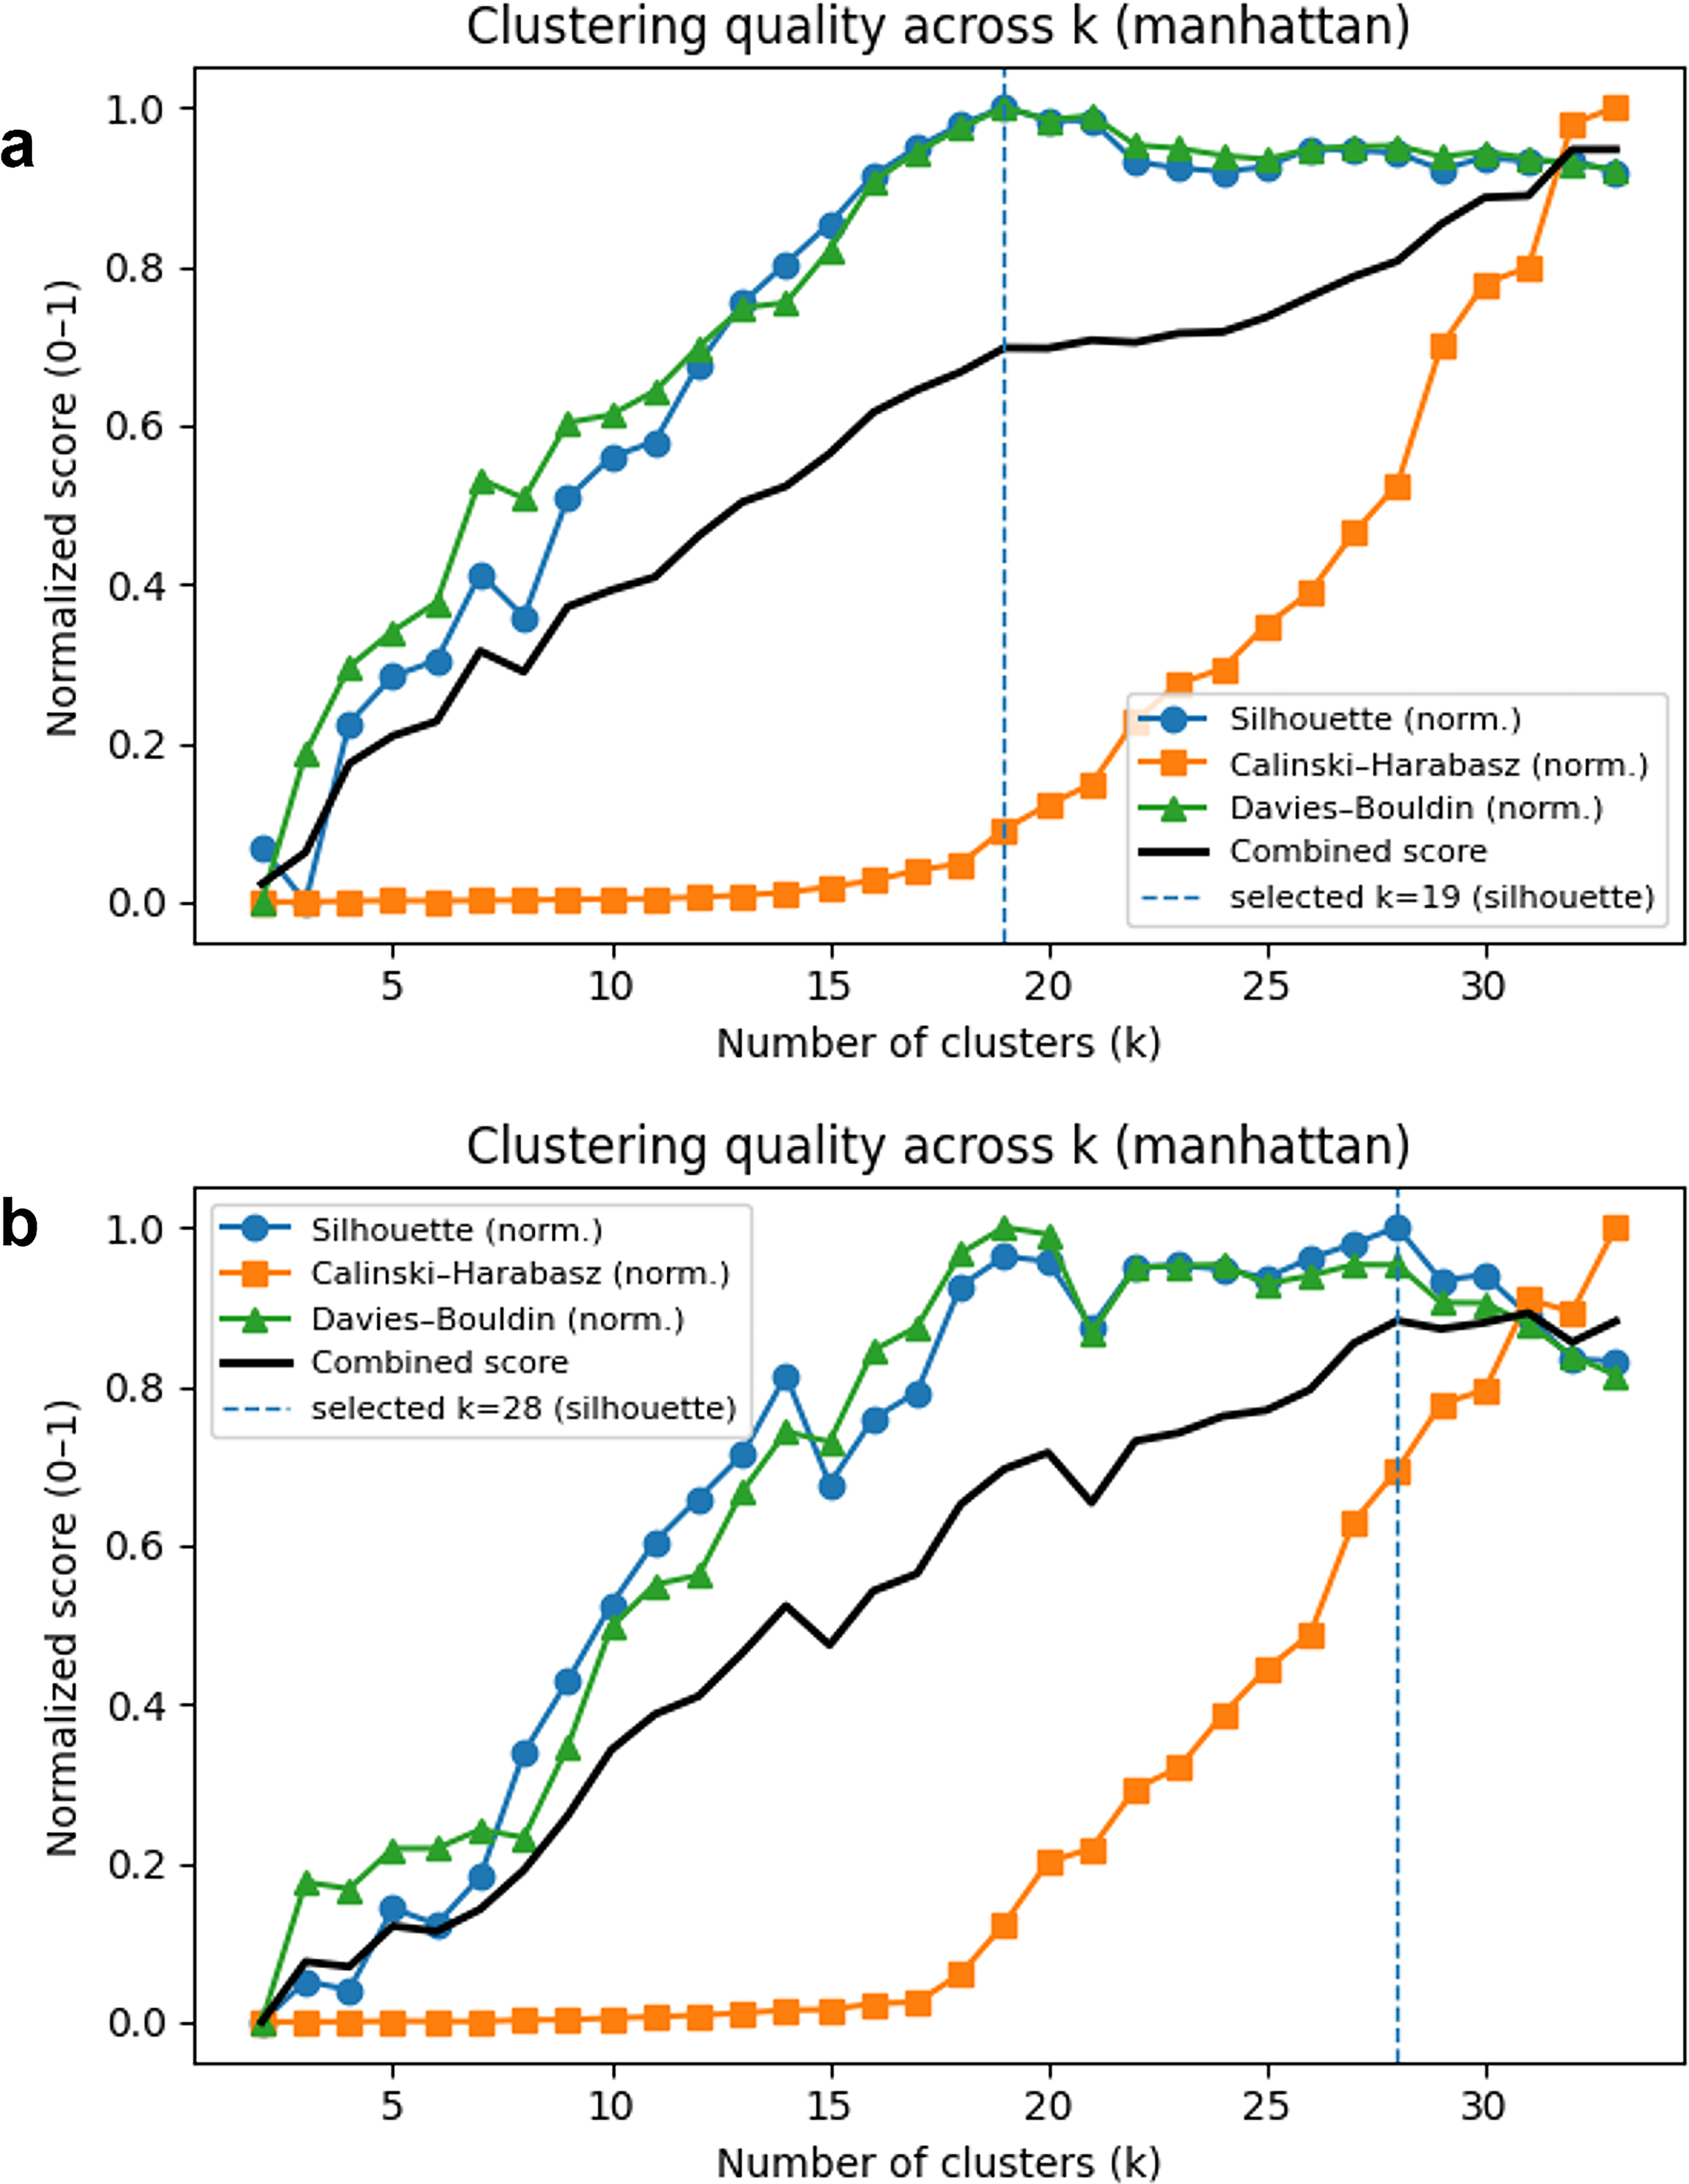
Determination of the optimal number of clusters (k) before and after HKG normalization (Manhattan distance). Cluster-number selection curves based on internal validation indices are shown for the Manhattan distance metric using
Asthma (AS) served as a representative example for evaluating inter-dataset harmonization. AS samples derived from two independent datasets were separated into distinct clusters in raw embedding, reflecting dataset-specific effects. After HKG-based normalization, these samples converged into a single coherent cluster under both Euclidean and Manhattan distance metrics, indicating effective mitigation of batch-related discrepancies while preserving disease-specific transcriptional structures.
Application to drug repositioning
As a proof-of-concept demonstration of downstream utility, we applied the disint-derived disease signatures to a transcriptome-guided DR analysis focusing on two liver-associated diseases: Severe Alcoholic Hepatitis (sAH) and Acute-on-Chronic Liver Failure (ACLF). These diseases were selected because they formed well-defined and distinct clusters in HKG-normalized embeddings, indicating coherent disease-level transcriptional signatures.
For each disease, a differential expression analysis was performed between disease and matched healthy control samples using the limma framework. Significantly up- and down-regulated genes were visualized using volcano plots (Fig. 5), highlighting characteristic expression patterns associated with each condition.
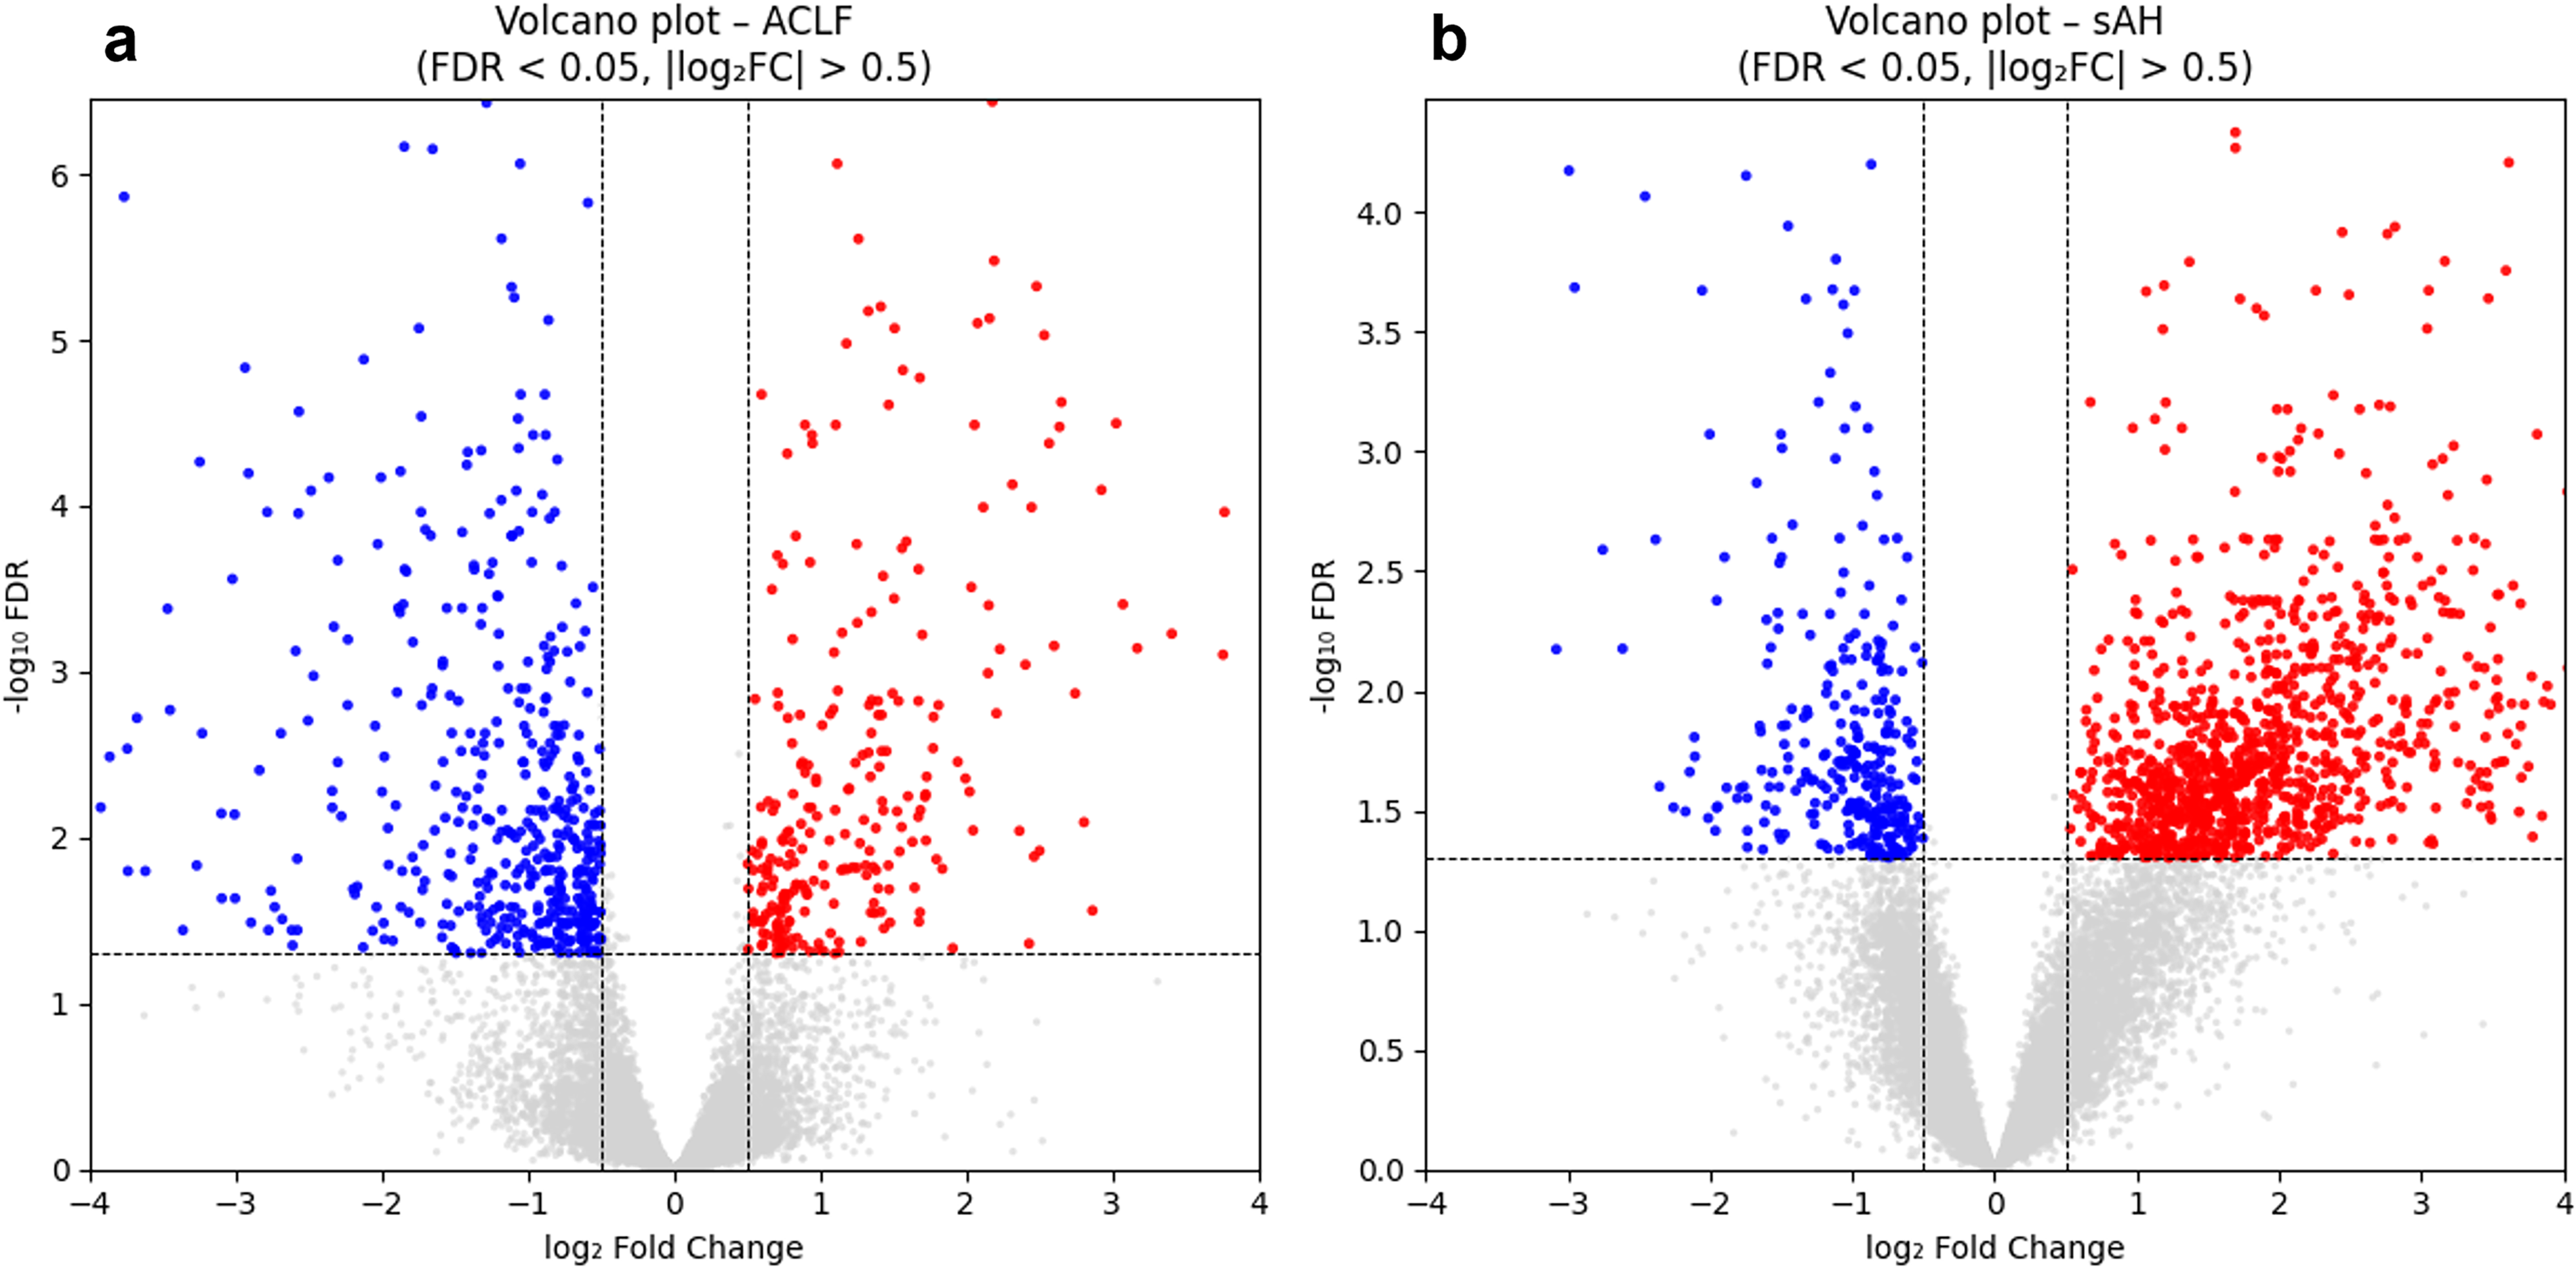
Volcano plots illustrating significantly up- and down-regulated genes identified in
Using thresholds of |log2FC| > 1 and padj < 0.05, ACLF and sAH exhibited 169 and 1000 up-regulated genes and 247 and 136 down-regulated genes, respectively. Among these, 92 up-regulated and 51 down-regulated genes were shared between the two diseases, suggesting partially overlapping transcriptional perturbations. Complete DEG lists are provided in Supplementary Table S3.
The resulting disease-specific gene signatures were subsequently submitted to the L1000CDS2 platform to identify compounds predicted to reverse observed expression changes (Duan et al., 2016). The ranked compound lists are summarized in Supplementary Table S4. Several top-ranked compounds were associated with known hepatoprotective or anti-inflammatory functional annotations, suggesting a qualitative consistency between the inferred transcriptional signatures and relevant biological contexts.
The compounds shared between ACLF and sAH (highlighted orange in Supplementary Table S4) suggest similarities in transcriptional alterations between the two diseases and illustrate how disint outputs can be used to identify cross-disease patterns in compound prioritization, whereas disease-specific compounds may represent condition-specific transcriptional responses and provide additional hypotheses for targeted DR.
Taken together, this analysis illustrates how disint-derived disease clusters can be coupled with external perturbation databases to generate reproducible, transcriptome-based hypotheses for DR. Further biological and clinical validation is required to assess the therapeutic relevance of individual compounds.
Discussion
The results presented in this study highlight several methodological considerations that are particularly relevant for disease-level integration of heterogeneous transcriptomic datasets. Rather than relying on explicit modeling of batch structure, the disint framework emphasizes lightweight normalization and data-driven evaluation, which proved effective under the data characteristics examined here.
A key factor influencing integration performance in this setting is the nature of the upstream expression matrix. To minimize bias arising from heterogeneous processing pipelines, all datasets were uniformly quantified at the transcript level using Salmon, which performs quasi-mapping directly to transcript sequences (Patro et al., 2017). While this strategy ensures methodological consistency across studies, it also produces extremely high-dimensional expression matrices with a large proportion of low- or zero-valued entries, reflecting transcripts that are unexpressed or only weakly expressed in the sampled tissues. Under such conditions, preserving dataset-specific technical structure becomes challenging, and methods that depend on explicit estimation of batch effects may struggle to distinguish technical variation from genuine biological heterogeneity.
In this context, the HKG-based normalization strategy implemented in disint provides an effective alternative. By rescaling samples using a small set of highly stable reference genes, this approach reduces large-scale amplitude differences between datasets without enforcing a global transformation that homogenizes all samples. As a result, disease-specific log2FC patterns become more comparable across studies, and downstream dimensionality reduction and clustering analyses yield more coherent disease-level structures. Importantly, this strategy corrects global intensity shifts while preserving relative gene-to-gene relationships, enabling biologically meaningful variations to be retained for subsequent interpretation.
The observed interaction between normalization strategy and distance metric further underscores the importance of considering preprocessing and similarity definition jointly. Magnitude-sensitive metrics such as Euclidean and Manhattan distances benefited most from HKG-based scaling, producing stable and interpretable disease groupings across datasets. In contrast, cosine distance, which emphasizes vector orientation rather than absolute magnitude, exhibited reduced coherence after normalization. Removing global intensity differences in this case may amplify subtle cohort-specific fluctuations, leading to fragmented cluster structures with limited biological interpretability. These findings indicate that magnitude-aware distance metrics represent more robust default options for cross-dataset disease-level transcriptomic analysis within this framework, although optimal choices may depend on dataset-specific characteristics.
A potential limitation of the HKG-based normalization strategy is that HKG expression may not be strictly invariant across all disease contexts. Diseases involving global transcriptional dysregulation, metabolic reprogramming, or widespread cellular stress may partially affect the stability of canonical HKGs. In such cases, ratio-based normalization using a small set of reference genes can introduce bias or attenuate disease-specific signals. Users of disint should therefore interpret results with caution when analyzing conditions known to perturb core cellular functions and consider alternative normalization strategies or sensitivity analyses when appropriate. Importantly, the HKG selection procedure in disint is data-driven and adaptive, which partially mitigates this risk by prioritizing genes with the highest observed stability within each dataset rather than relying on a fixed reference set.
Finally, the application of disint-derived disease clusters to downstream DR analysis illustrates how reproducible disease-level integration can support translational hypothesis generation. Diseases grouped within the same cluster exhibited highly similar transcriptional perturbation patterns, enabling the identification of compounds predicted to reverse shared expression signatures using LINCS L1000 reference data. This clustering-based strategy provides a natural extension from disease similarity mapping to cross-disease therapeutic prioritization. However, these findings should be interpreted as proof-of-concept results. The predicted compounds represent preliminary hypotheses rather than validated therapeutic candidates, and further biological and clinical validation is required to establish mechanistic relevance and therapeutic efficacy. Future work should focus on integrating more robust validation strategies and extending disint toward a fully end-to-end framework for transcriptome-guided drug discovery.
Data and code availability
The full source code of disint, including preprocessing, HKG-based normalization, dimensionality reduction, and clustering modules, is openly available at: https://github.com/Soui816/disint/.
The package can be installed via pip:
The repository provides complete implementation, documentation, and an example workflow to reproduce all the analyses in this study. The software is released under CC BY-NC-SA 4.0 license, and commercial use requires explicit permission from the authors.
Large supplementary matrices, including the full log2FC matrices before and after HKG-based normalization and a complete dataset manifest, are publicly available at a dedicated GitHub repository: https://github.com/Soui816/disint-supplementary-data.
These data are provided to ensure transparency and reproducibility of the computational analyses presented in this study.
Authors’ Contributions
Y.C. led the study and was responsible for methodology development, software implementation, formal analysis, visualization, and preparation of the original article draft. N.O. contributed to the research process by providing discussions and analytical suggestions that supported the refinement of several methodological components. T.E. provided overall supervision, contributed to conceptual development, offered technical guidance throughout the project, and participated in critical review and editing of the article.
Footnotes
Acknowledgments
The authors thank the editor and the anonymous reviewers for their constructive and insightful comments, which substantially improved the clarity and presentation of this article. The authors also acknowledge helpful scientific discussions and general advice provided by the NB Health Laboratory Co. Ltd., which contributed to the conceptual refinement of this study.
Author Disclosure Statement
The authors declare that they have no conflict of interest.
Funding Information
Y.C. is supported by JST SPRING, Grant Number JPMJSP2119.
Supplemental Material
Supplemental Material
Abbreviations
References
Supplementary Material
Please find the following supplemental material available below.
For Open Access articles published under a Creative Commons License, all supplemental material carries the same license as the article it is associated with.
For non-Open Access articles published, all supplemental material carries a non-exclusive license, and permission requests for re-use of supplemental material or any part of supplemental material shall be sent directly to the copyright owner as specified in the copyright notice associated with the article.