
Abstract
Diabetic peripheral neuropathy (DPN) is a prevalent complication of type 2 diabetes that is typically diagnosed after irreversible nerve damage, largely due to the lack of molecular biomarkers that distinguish neuropathy-specific changes from general diabetic pathology. From an integrative biology perspective, the network-level molecular mechanisms underlying DPN remain incompletely defined. In this study, transcriptomic profiles from peripheral blood mononuclear cells of healthy controls, patients with type 2 diabetes, and patients with DPN were analyzed using a systems-level, network-based bioinformatics framework. Comparative analysis identified genes specifically associated with DPN, distinct from broader diabetic alterations. Protein–protein interaction and network topology analyses prioritized key hub genes enriched in immune signaling, calcium transport, lipid metabolism, and inflammatory pathways implicated in neuronal dysfunction. Among these, Toll-like receptor 9 (TLR9) emerged as a prominent biomarker candidate, demonstrating high network centrality and strong diagnostic performance (area under the curve = 1.0). TLR9 was significantly upregulated in DPN and functionally linked to mitogen-activated protein kinase and nuclear factor kappa-light-chain-enhancer of activated B-cell signaling pathways, consistent with immune-mediated mechanisms of neuropathic injury. Collectively, these findings define a DPN-specific molecular network and support TLR9 as a biomarker candidate, providing a systems-level foundation for future experimental validation and translational research in diabetic neuropathy.
Introduction
Diabetes mellitus, a pervasive chronic metabolic disorder, affects millions worldwide, imposing a significant burden on global health through its wide-ranging complications that impair quality of life and escalate health care costs (Tavakoli et al., 2023). While diabetes itself can often be managed with lifestyle modifications and medication, its complications are frequently underestimated or neglected. Many patients focus primarily on controlling daily blood glucose levels but fail to recognize that long-term, poorly managed diabetes silently damages multiple organs. Consequently, complications are often detected only at advanced stages, when treatment options are limited and outcomes are poor. This delayed recognition magnifies the burden of the disease, transforming a controllable metabolic condition into a source of chronic pain, disability, and even premature death. Hence, addressing the complications of diabetes is not only a clinical imperative but also an urgent public health priority.
Among these complications, diabetic peripheral neuropathy (DPN) is prevalent, affecting approximately 50% of diabetic patients and leading to sensory impairments, chronic pain, and severe outcomes such as foot ulcers and amputations (Savelieff et al., 2025) (Figure 1). The development of DPN and other diabetes-related complications is closely linked to inadequate glycemic control. Poor regulation of blood glucose levels drives a cascade of pathogenic mechanisms, including activation of the polyol pathway, accumulation of advanced glycation end products, increased mitochondrial dysfunction, oxidative stress, and sustained low-grade inflammation. These processes impair vascular integrity, damage nerves, and compromise tissue repair, collectively fueling the progression of neuropathy as well as other complications such as retinopathy, nephropathy, and cardiovascular disease (Giri et al., 2018).
The strong association between chronic hyperglycemia and complication severity underscores the necessity of timely detection and intervention. Yet, despite extensive clinical recognition of DPN, its molecular underpinnings remain incompletely elucidated. This knowledge gap hampers the ability to intervene early, when complications may still be reversible or manageable. As a result, there is an increasing demand for precise and reliable biomarkers that can provide early warning, predict disease trajectory, and guide personalized treatment strategies.
Biomarkers are central to precision medicine, providing measurable indicators of biological states that support disease prediction, diagnosis, and monitoring, thereby linking molecular mechanisms with clinical application (Paver et al., 2024). Their increasing success in guiding disease management underscores the potential of biomarker-driven strategies for complex disorders such as DPN.
In diabetes and its complications, established biomarkers including nerve conduction velocity for neuropathy and urinary albumin excretion for nephropathy have offered clinical utility (Callaghan et al., 2012), but their effectiveness is limited by poor sensitivity in early disease stages and insufficient specificity across heterogeneous patient populations (Thomas et al., 2015). Advances in omics technologies and bioinformatics approaches have transformed biomarker discovery by enabling the identification of differentially expressed genes (DEGs), regulatory networks, and molecular signatures that better reflect disease heterogeneity and progression (Pusztai et al., 2008). These strategies are particularly relevant given that the molecular mechanisms underlying diabetic complications remain incompletely characterized (Carrasco-Zanini et al., 2024).
Delayed recognition and suboptimal management of diabetes often lead to the late detection of complications, contributing to an increasing burden of neuropathy, nephropathy, and associated morbidity (Zhu et al., 2022). In this context, the development and validation of specific molecular biomarkers could facilitate earlier diagnosis, personalized risk stratification, and timely intervention, thereby improving patient outcomes and reducing health care costs.
Accordingly, this study aims to identify DPN-specific genetic biomarker candidates using an integrative bioinformatics framework combining transcriptomic analysis, protein–protein interaction (PPI) network construction, and functional enrichment analysis of publicly available datasets. This approach seeks to elucidate key molecular pathways driving DPN and to highlight candidate targets associated with inflammatory and metabolic dysregulation, with potential translational relevance for improved diagnosis and management of diabetic neuropathy.
Materials and Methods
This study was based exclusively on publicly available, de-identified transcriptomic data obtained from the Gene Expression Omnibus (GEO) database. No new human or animal subjects were recruited, and no additional ethical approval was required for this study.
Dataset selection
Transcriptomic data were retrieved from the GEO database (Edgar et al., 2002) using the search keywords “type 2 diabetes” and “diabetic complications.” Among the identified datasets, GSE185011 was selected based on its relevance to DPN, a high-throughput RNA sequencing platform. This dataset includes peripheral blood mononuclear cell samples from five clinical groups: healthy controls (HCs), type 2 diabetes mellitus (T2DM), DPN, diabetic retinopathy (DR), and diabetic nephropathy (DN), with five samples per group (total n = 25). A detailed description of the dataset, details of sample ID, clinical group, age, and sample type is presented in Supplementary Table S1. For the present study, only HC, T2DM, and DPN samples were included, while DR and DN samples were excluded to enable a focused analysis of transcriptomic alterations specific to DPN rather than those shared across other diabetic complications. The selection of equal sample numbers per group ensured a balanced study design and minimized bias in differential expression and downstream network analyses.
Differential expression analysis
Data preprocessing and differential expression analysis were conducted using GEO2R (Edgar et al., 2002), along with the limma (version 3.26.8) and DESeq2 packages in R/Bioconductor (Love et al., 2014) to ensure robust statistical modeling and normalization of gene expression data. DEGs were identified with an adjusted p value <0.05 and log2 fold change (log2FC) >1. The p value threshold reflects the conventional 5% significance level widely accepted in genomics to minimize false positives. The log2FC threshold of 1 corresponds to a twofold change in expression, ensuring that only biologically meaningful differences are retained for downstream analyses. The Benjamini–Hochberg procedure (Benjamini et al., 2001) was further applied to control the false discovery rate (FDR) and enhance reliability. Visualization tools, including volcano plots (Li, 2012) and heatmaps (Gu et al., 2016), were generated using RStudio and the pheatmap library to illustrate expression patterns, providing a clear depiction of upregulated and downregulated genes across HC, T2DM, and DPN samples.
PPI network analysis
A PPI network was constructed for the DEGs using the STRING database (Szklarczyk et al., 2015), with a minimum confidence score threshold of 0.4, to ensure biologically meaningful and moderately confident interactions. The resulting network was imported into Cytoscape (version 3.10.3) (Shannon et al., 2003) to map the complex interplay among DEGs for visual representation of their biological relationships. To identify key regulatory components, the CytoHubba plugin (Chin et al., 2014) in Cytoscape was used. Maximal clique centrality (MCC), a robust topological analysis method, was used to rank genes based on their network connectivity and importance. This analysis led to the identification of hub genes, based on their topological importance within the network. Additional network parameters, including degree centrality and betweenness centrality, were assessed to support the robustness and biological relevance of the selected hub genes.
Functional enrichment analysis
To elucidate the biological significance of the DEGs, functional enrichment analysis was conducted using DAVID (Database for Annotation, Visualization, and Integrated Discovery; version 6.8) (Sherman et al., 2022) and ClueGO (Bindea et al., 2009), a Cytoscape plugin. These tools enabled the identification of significantly enriched gene ontology terms (Ashburner et al., 2000), including biological processes, molecular functions, and Kyoto Encyclopedia of Genes and Genomes (KEGG) pathways (Kanehisa and Goto, 2000), providing a comprehensive functional landscape of the gene set. To further explore the functional relevance of the top-ranked genes, GeneMANIA (Mostafavi et al., 2008) was employed to analyze the hub genes identified from the PPI network. This analysis provided co-expression, physical interactions, and shared pathways.
Biomarker validation
To evaluate the diagnostic potential of the identified hub genes, receiver operating characteristic (ROC) curve analysis (Nahm, 2022) was performed. The area under the curve (AUC) values were calculated to evaluate the ability of each gene to discriminate between DPN patients, diabetic patients without neuropathy (T2DM), and HCs, thereby providing a quantitative measure of biomarker performance. To further validate, the diagnostic efficiency, sensitivity, and specificity were calculated for each gene, and cross-validation techniques were employed to ensure the robustness and reproducibility of the ROC outcomes across different subsets of the data. A targeted literature review was conducted to align the computational findings with existing experimental evidence, thereby reinforcing the biological significance of the prioritized hub genes.
Statistical analysis
All statistical analyses were performed using R and Bioconductor-based tools. RNA-seq data were analyzed using limma and DESeq2, which employ model-based statistical frameworks and therefore do not require normally distributed data. These methods incorporate internal normalization to correct for differences in sequencing depth and library size, ensuring accurate comparison of gene expression levels across samples. DEGs were identified using moderated statistical testing, with significance defined by an adjusted p value <0.05 after Benjamini–Hochberg FDR correction and a |log2FC| >1 threshold to retain biologically meaningful differences (Benjamini et al., 2001).
Functional enrichment results were considered significant at FDR <0.05 with multiple testing corrections applied. Diagnostic performance of candidate biomarkers was evaluated using ROC curve analysis, with the AUC, sensitivity, and specificity used as quantitative measures. Cross-validation was applied to assess robustness and reproducibility across sample subsets. The workflow presented in this study (Fig. 2) provides a reproducible framework applicable to other diabetes-related complications, supporting personalized medicine approaches.
Results
Identification of DEGs in DPN
Differential gene expression analysis of the GSE185011 dataset revealed substantial expression changes associated with DPN. Comparative analysis between HC and DPN patients identified a total of 19,117 DEGs. Among the top 250 DEGs (adjusted p value <0.05 and |log2FC| >1), 203 genes were significantly upregulated, while 47 genes were downregulated.
Similarly, the comparison between the HC and T2DM groups yielded 18,995 DEGs. Among the top 250 DEGs (adjusted p value <0.05 and |log2FC| >1), 120 genes were upregulated and 130 genes were downregulated. The distribution of significantly upregulated and downregulated genes in both comparisons is visualized in the volcano plots (Supplementary Fig. S1).
In the comparison between HC and DPN samples, the x-axis represents the log2FC, and the y-axis shows the –log10 of the adjusted p value. From a total of 19,117 genes, 494 were differentially expressed between HC and DPN samples, with 203 upregulated and 47 downregulated genes among the top 250 DEGs (adjusted p < 0.05 and |log2FC| >1), as indicated by the red and blue dots in Supplementary Figure S1a. This reflects pronounced transcriptional dysregulation associated with DPN. In contrast, the HC versus T2DM comparison identified 681 DEGs from a total of 18,995 genes, with 120 upregulated and 130 downregulated genes among the top 250 DEGs (Supplementary Fig. S1b), indicating a comparatively less distinct transcriptomic shift in diabetes without neuropathy.
Distinct expression patterns of the top 250 DEGs were visualized using heatmaps generated with the pheatmap library. The HC versus DPN heatmap showed clear clustering and strong group separation, demonstrating substantial molecular alterations specific to DPN (Supplementary Fig. S2a). In contrast, the HC versus T2DM heatmap displayed weaker separation between groups, indicating a more moderate shift in gene expression in diabetes without neuropathy (Supplementary Fig. S2b).
Filtering and selection of DPN-specific gene signatures
To identify gene signatures uniquely associated with DPN, a comparative analysis was conducted using the top 250 DEGs from the HC versus DPN and HC versus T2DM datasets, selected based on adjusted p value and fold-change thresholds. This analysis was conducted using a Venn diagram that identified 158 DPN-specific DEGs (Supplementary Fig. S3), comprising 15 upregulated and 143 downregulated genes, based on stringent criteria (adjusted p < 0.05 and |log2FC| >1). The Venn diagram illustrated the intersection of DEGs across both comparisons, revealing 92 genes (22.5%) shared between the DPN and T2DM groups, likely reflecting general diabetic pathology. By excluding these overlapping genes and those exclusive to the T2DM group, the analysis focused on transcriptional changes specific to DPN.
Construction and analysis of the PPI network
To explore functional relationships among the 158 DPN-specific DEGs, a PPI network was constructed using the STRING database and visualized in Cytoscape. The resulting network comprised 158 nodes (Supplementary Fig. S4), each representing a DEG, with edges indicating predicted or experimentally validated protein interactions. The network displayed dense connectivity, suggesting extensive functional interactions, with variation in node connectivity indicating the presence of key hub proteins involved in DPN-associated biological processes.
Quantitative network analysis using degree centrality and betweenness centrality was performed to assess node importance. The CytoHubba plugin was then applied, and the MCC algorithm identified 20 hub genes as core regulatory components.
Visualization of these hub genes highlighted highly connected nodes within the DPN-specific PPI network, comprising 5 upregulated and 15 downregulated genes (Fig. 3b). In addition, a gene–gene interaction network generated using GeneMANIA (Supplementary Fig. S5) revealed dense functional associations among hub genes such as MYLPF, HSPA2, LTF, FCGR1A, Toll-like receptor 9 (TLR9), CCL3, NEURL1B, ABCA1, ATP2A1, and CKB, indicating coordinated regulation relevant to DPN pathophysiology.
Illustration of various complications associated with diabetes mellitus.
Schematic overview of the integrative bioinformatics workflow used to identify candidate biomarkers for DPN. Transcriptomic data obtained from the GEO database were analyzed using GEO2R together with the limma and DESeq2 packages in R to identify DEGs, followed by comparative filtering of HC versus DPN and HC versus T2DM gene sets using Venny to extract DPN-specific signatures. These genes were mapped to protein–protein interaction networks using STRING and visualized in Cytoscape, and hub genes were prioritized using the CytoHubba plugin based on the MCC algorithm. Functional annotation and pathway enrichment were performed using DAVID, ClueGO, and GeneMANIA to characterize the biological roles and interaction patterns of the selected genes. Finally, diagnostic relevance was evaluated using ROC curve analysis and literature-based biological validation. This integrated workflow provides a reproducible computational framework for biomarker discovery and supports the translational potential of the identified candidates, while positioning experimental validation in patient samples or cell-line models as a future step. DAVID, Database for Annotation, Visualization, and Integrated Discovery; DEGs, differentially expressed genes; DPN, diabetic peripheral neuropathy; GEO, Gene Expression Omnibus; MCC, maximal clique centrality; ROC, receiver operating characteristic; T2DM, type 2 diabetes mellitus.
Identification of hub genes from the DPN-specific PPI network constructed in Cytoscape using the CytoHubba plugin. From 158 DPN-specific genes, 20 hub genes were selected based on the MCC algorithm. Panel
Functional annotation and pathway enrichment analysis
Functional enrichment
Functional enrichment analysis of the 20 hub genes associated with DPN was performed using DAVID and ClueGO to identify significantly overrepresented biological processes and signaling pathways (Supplementary Table S3). Enrichment analysis revealed strong involvement of immune and inflammatory responses, including positive regulation of tumor necrosis factor alpha (TNF-α) production and cellular response to lipopolysaccharide, processes closely linked to neuroinflammation and neuronal dysfunction. KEGG pathway (Kanehisa and Goto, 2000) analysis further identified significant enrichment in lipid and atherosclerosis and PI3K–Akt signaling pathways, both of which are implicated in metabolic stress, vascular dysfunction, insulin signaling, neuronal survival, and endothelial regulation, hallmark features of DPN pathophysiology (Liang et al., 2024). A detailed list of the 20 hub genes and their functional roles is provided in Supplementary Table S3.
Functional annotation
Molecular function annotation of the hub genes revealed a strong enrichment in calcium- and adenosine triphosphate (ATP)-dependent activities, reflecting their involvement in intracellular signaling and neuronal function. P-type calcium transporter activity represented the largest fraction of the enriched molecular functions (50%), highlighting a dominant role for calcium ion transport and homeostasis in DPN (Supplementary Fig. S7). Calcium-dependent protein kinase C activity accounted for 33.33% of the enriched functions, indicating a major contribution of calcium-regulated signaling pathways. Additional functions included translation initiation factor binding (8.33%) and negative regulation of ATP-dependent activity (8.33%), suggesting that alterations in protein synthesis and energy-dependent cellular processes also contribute to DPN pathophysiology.
Biological process analysis
Biological process analysis revealed significant enrichment in pathways related to transmembrane transport and calcium regulation. The hub genes were associated with ATPase-coupled cation transmembrane transporter activity, P-type calcium transporter activity, regulation of ATP-dependent activity, and export across the plasma membrane (Fig. 4). Notably, P-type calcium transporter activity accounted for approximately 80% of the enriched biological processes, indicating a predominant role of calcium ion transport and signaling in DPN. Other enriched processes included regulation of fatty acid oxidation (3.33%), organic cation transport (3.33%), and export across the plasma membrane (3.33%), highlighting the multifactorial molecular mechanisms underlying disease progression (Supplementary Fig. S6).
Network-based visualization of enriched biological processes associated with the 20 hub genes in DPN, generated using the ClueGO plugin in Cytoscape based on DAVID-derived Gene Ontology annotations. Each node represents a significantly enriched biological process, and edges indicate functional relationships and shared genes between categories. The size of each node reflects the number of genes involved, while node color intensity represents statistical significance (FDR < 0.05). Prominent clusters highlight key functional themes including P-type calcium transporter activity, ATP-dependent transmembrane transport, and regulation of cellular signaling, illustrating the central role of calcium homeostasis and membrane transport in DPN pathophysiology. ATP, adenosine triphosphate; FDR, false discovery rate.
Identification of key genetic biomarkers for DPN
Based on hub gene prioritization using MCC scores and diagnostic performance assessed by ROC curve analysis, TLR9, FCGR1A, ABCA1, CCL3, and LTF were identified as potential biomarkers for DPN (Fig. 5). TLR9 and FCGR1A showed perfect diagnostic accuracy with AUC values of 1.0, while ABCA1 and CCL3 demonstrated strong performance with AUCs of 0.96 and 0.92, respectively. LTF exhibited moderate diagnostic value with an AUC of 0.80.
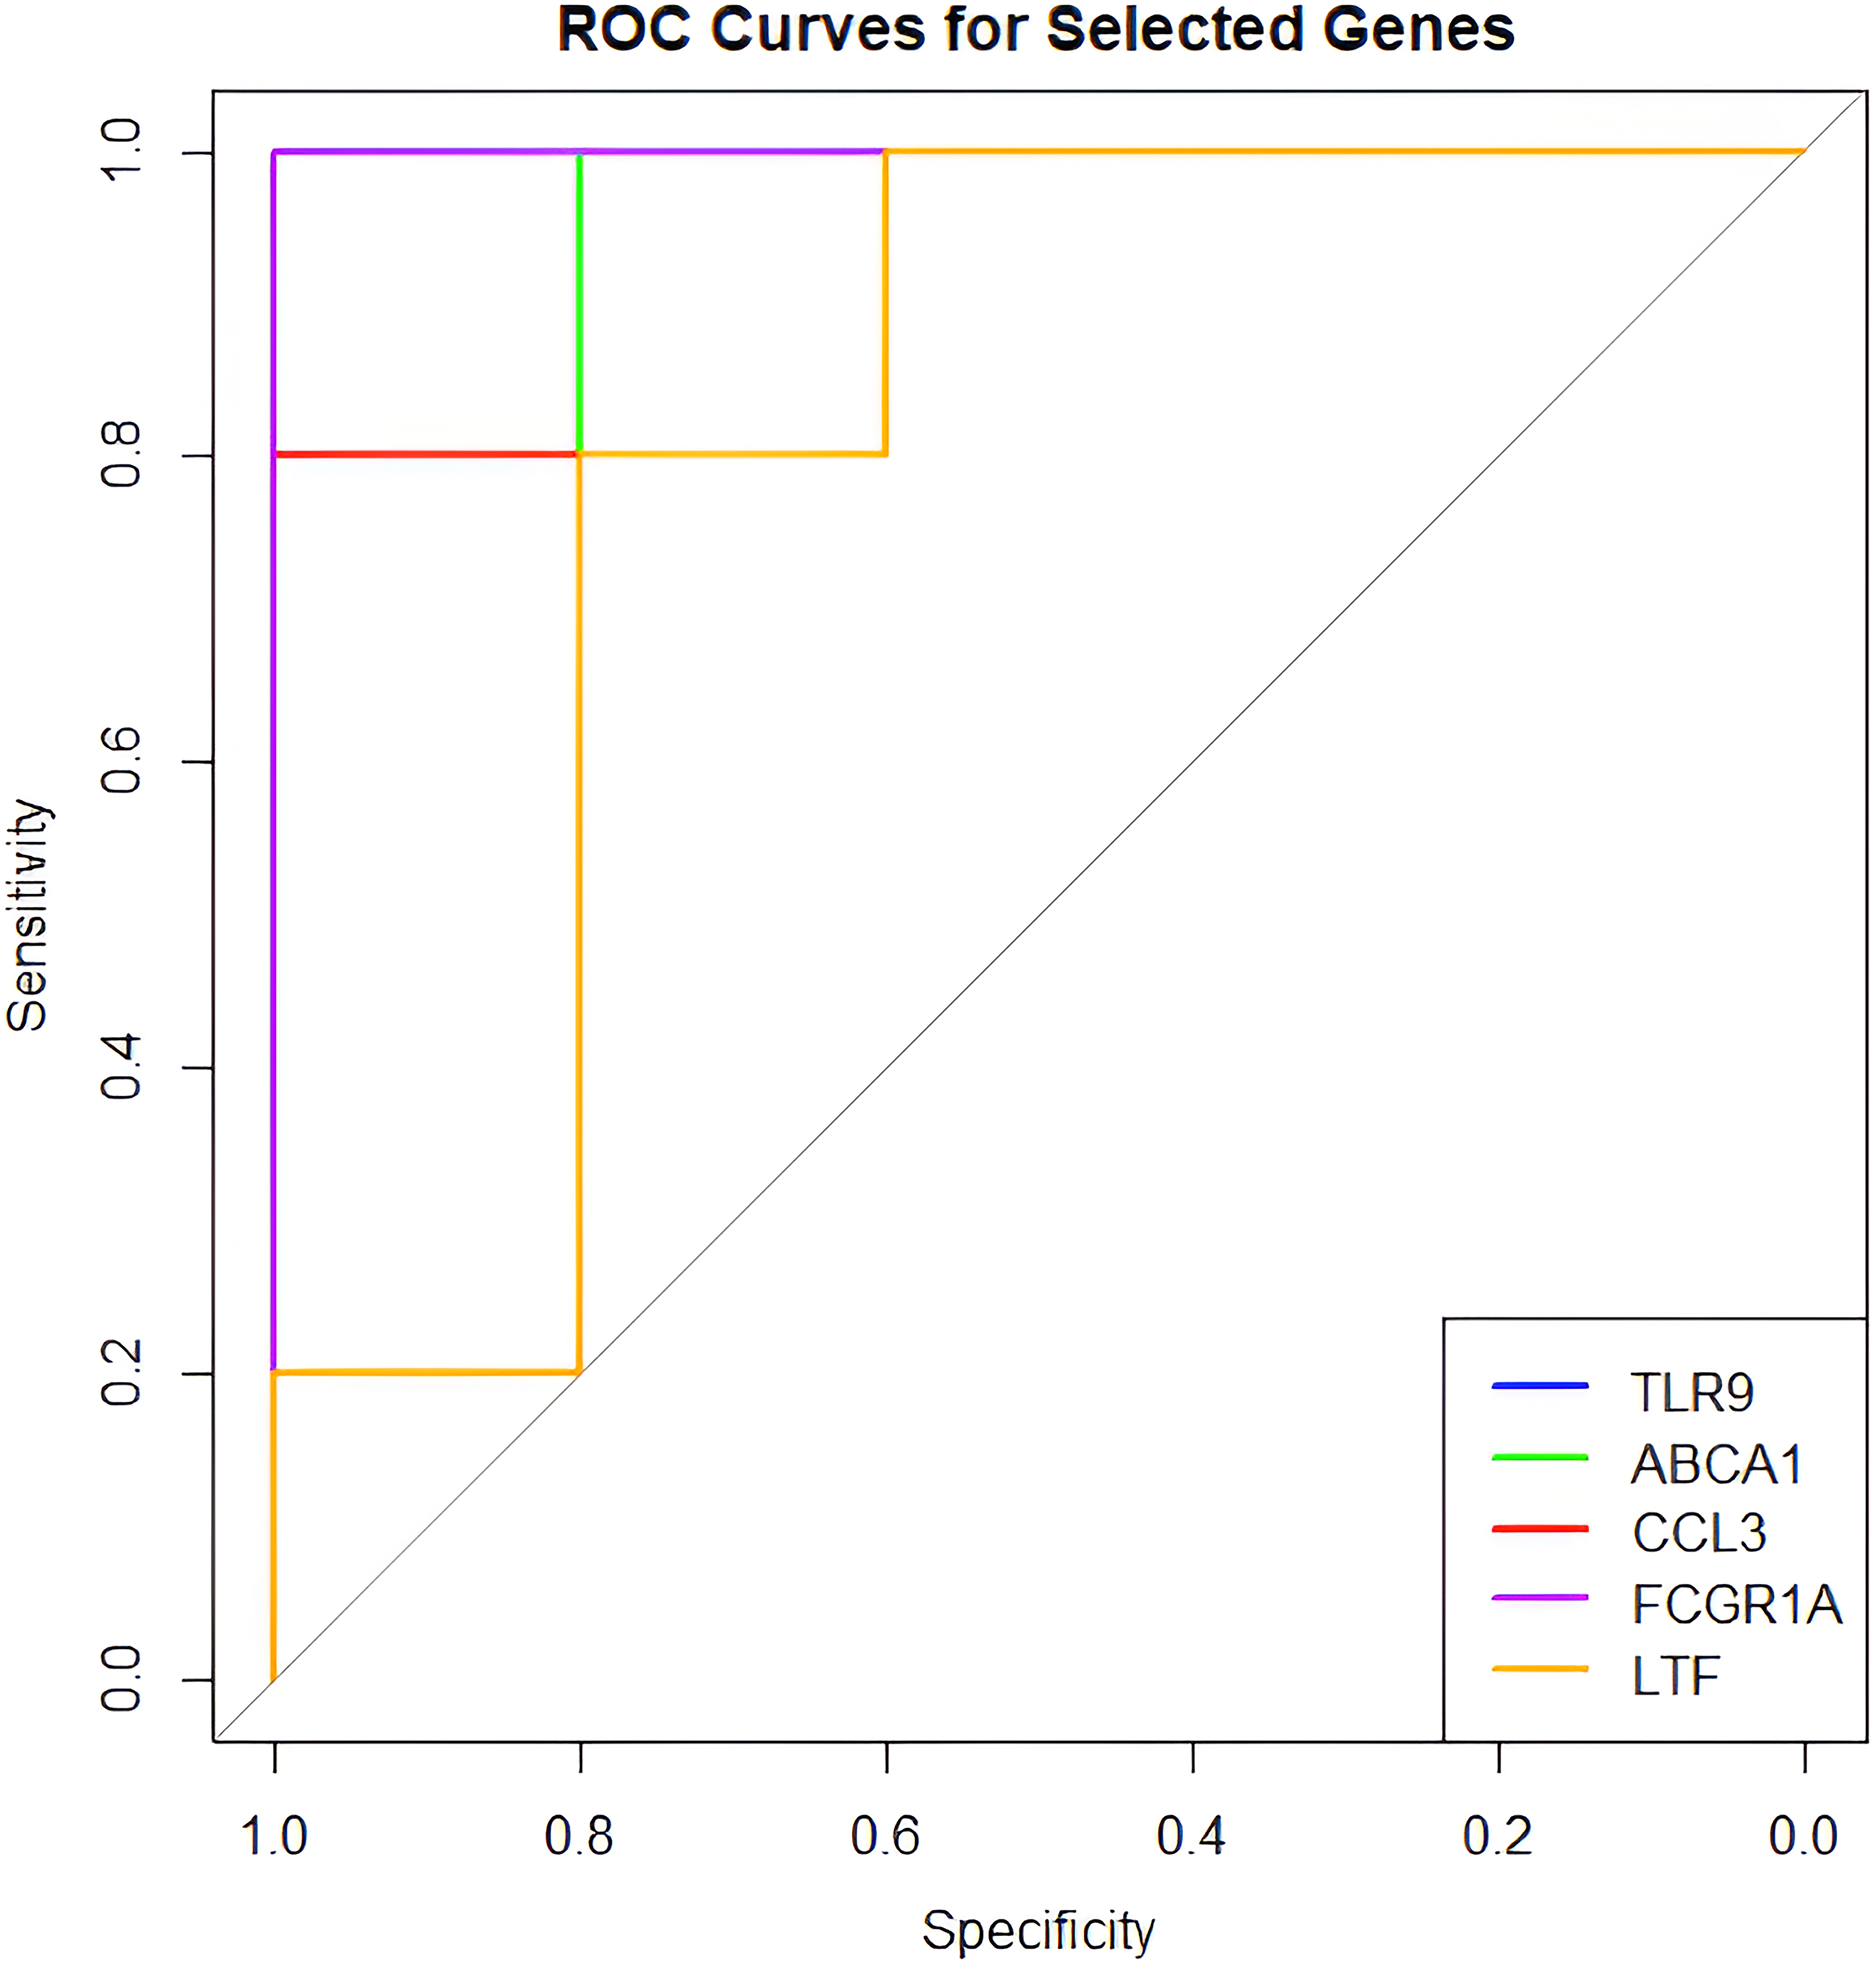
Receiver operating characteristic (ROC) curves illustrating the diagnostic performance of the top five hub genes in distinguishing DPN from control samples.
Literature evidence supports TLR9 as a strong biomarker candidate in DPN, with multiple studies linking its upregulation to microglial activation, β-amyloid deposition, and pain hypersensitivity, which are central features of DPN pathophysiology (Acioglu et al., 2022; Fiebich et al., 2018; Liu et al., 2022; Zhang et al., 2024). FCGR1A has also been implicated in immune amplification and neuroinflammatory responses associated with neuropathic pain (Liang et al., 2019). In contrast, ABCA1 and CCL3, although involved in lipid metabolism and chemokine-mediated signaling, appear to have less direct roles in DPN and may represent secondary biomarker candidates (Nashtahosseini et al., 2025). LTF lacked strong mechanistic evidence supporting a direct role in DPN pathology.
Among these candidates, TLR9 emerged as the most promising diagnostic and therapeutic biomarker candidate due to its consistent upregulation and central role in neuroinflammation. Importantly, inhibition of TLR9 has been shown to attenuate neuropathic pain and neuroinflammation in diabetic and neuropathic rodent models (Acioglu et al., 2022; Chen et al., 2022; Liu et al., 2022; Niu et al., 2022; Singh et al., 2016; Luo et al., 2019). Although these findings derive from preclinical studies, they demonstrate TLR9-driven activation of mitogen-activated protein kinase (MAPK) and nuclear factor kappa-light-chain-enhancer of activated B cell (NF-κB) signaling and cytokine release (Jiang et al., 2017; Pahwa and Jialal, 2016), consistent with the immune-inflammatory signature observed in the present transcriptomic analysis.
Clinical correlation and translational potential
However, this study is not without limitations. The analysis relies on a single transcriptomic dataset (GSE185011), which may limit the generalizability of the findings across broader populations. In addition, the study is entirely in silico, highlighting the need for experimental validation of the identified biomarkers and mechanisms. The predominance of downregulated DEGs also points to possible disruptions in neuroprotective pathways, warranting further investigation.
In addition to experimental validation, future computational studies could incorporate machine learning (ML) approaches to further refine and validate the identified gene signatures. The ML techniques include models such as LASSO regression, random forests, and SVM, which are trained to classify the cases of DPN against diabetic and HCs from datasets of gene expression, to identify the most predictive subset of genes. This, in turn, would enable the integration of selection of features based on ML with the current bioinformatics framework for the extraction of minimal diagnostic signatures with high discriminative power. Complex nonlinear relationships that are usually poorly captured through conventional analyses could also be accounted for. In this way, the robustness, sensitivity, and translational potential of these proposed biomarkers can be enhanced with an independent, computational layer of validation in support of future clinical implementation.
Future directions include validating TLR9 and other hub genes in diverse clinical cohorts using multi-omics approaches (e.g., proteomics, metabolomics) and testing TLR9 inhibitors in clinical trials. Longitudinal studies assessing these biomarkers’ prognostic value could enhance their utility in risk stratification and personalized medicine for DPN.
Discussion
DPN is a complex complication of type 2 diabetes characterized by progressive neuronal dysfunction, neuroinflammation, and vascular impairment. Although inflammatory and immune-mediated mechanisms have been implicated in DPN pathogenesis, the molecular pathways that specifically distinguish neuropathy from diabetes itself remain incompletely understood. In this context, the present study reveals significant enrichment of pathways related to inflammatory signaling, neuronal excitability, and vascular dysfunction, including MAPK and NF-κB signaling associated with TNF-α production and immune activation (FDR = 0.0102) (Cheng et al., 2024; Nashtahosseini et al., 2025).
This comparative approach is critical for identifying biomarkers specific to DPN rather than broader diabetic complications. The predominance of downregulated genes (143 out of 158) reflects suppression of key neuroprotective pathways, including neuronal repair and axon maintenance, as evidenced by reduced expression of genes such as NEURL1B and ATP2A1, which are involved in neurotrophin signaling and calcium-dependent neuronal function, respectively (Supplementary Table S3). In addition, downregulation of ABCA1 and ATP2B1 suggests impaired lipid homeostasis and calcium extrusion, processes important for neuronal membrane integrity and excitability. Conversely, the relatively fewer upregulated genes, including TLR9, CCL3, and FCGR1A, are enriched in immune and inflammatory pathways (Cheng et al., 2024; Liu et al., 2022) such as Toll-like receptor and chemokine signaling, underscoring neuroinflammation as a key driver of DPN pathogenesis. These findings are presented in Supplementary Table S2. This pattern is consistent with previous reports highlighting immune-mediated neuronal injury in diabetic neuropathy (Hall et al., 2022).
Consistent with these observations, the expression profiles of the identified hub genes indicate coordinated dysregulation of critical molecular pathways implicated in DPN pathogenesis. These findings support the central role of immune activation and metabolic dysregulation in diabetic complications.
Among the prioritized biomarkers, the superior performance of TLR9 and FCGR1A highlights their potential clinical utility. The identified DEGs and hub genes, particularly TLR9, show strong alignment with key clinical features of DPN, including neuropathic pain, sensory loss, and nerve degeneration, all of which are driven by hyperglycemia-induced inflammation. Through activation of MAPK and NF-κB pathways, TLR9 promotes the release of pro-inflammatory cytokines such as TNF-α, interleukin (IL)-1β, and IL-6, which directly contribute to DPN pathophysiology (Niu et al., 2022). The high AUC values observed for TLR9 and FCGR1A further underscore their potential as early diagnostic biomarkers, enabling timely identification and intervention to slow or prevent disease progression. From a therapeutic perspective, TLR9 inhibitors have shown efficacy in reducing neuroinflammation and pain in rodent models of neuropathy, suggesting a promising direction for targeted drug development (Singh et al., 2016). Collectively, these findings position TLR9 as not only a diagnostic candidate but also a potential therapeutic target with strong translational relevance.
Conclusion
This study provides a gene expression analysis of DPN using high-throughput RNA-seq data from peripheral blood samples (GSE185011), identifying key molecular signatures associated with disease progression. Differential expression analysis revealed significant transcriptional alterations in DPN compared with both HC and T2DM samples, with 158 genes uniquely dysregulated in DPN. The integration of PPI network analysis and centrality scoring identified 20 hub genes, several of which, notably TLR9, FCGR1A, ABCA1, CCL3, and LTF, demonstrated high diagnostic value.
Functional enrichment analysis underscored the involvement of immune activation, calcium ion transport, and metabolic dysregulation pathways in DPN pathophysiology. Specifically, the MAPK and NF-κB signaling cascades were implicated in driving the production of pro-inflammatory cytokines. At the same time, the dominance of calcium transporter activity among hub genes revealed potential disruptions in neuronal excitability and ion homeostasis.
Among the five prioritized hub genes, TLR9 emerged as the most clinically significant biomarker candidate, with perfect diagnostic performance within this dataset (AUC = 1.0) and strong literature supporting its role in neuroinflammation, pain hypersensitivity, and microglial activation in DPN. FCGR1A also demonstrated excellent diagnostic capability and mechanistic relevance. These genes may serve as candidate diagnostic markers and potential therapeutic targets.
While the findings offer promising translational insights, this study is limited by its reliance on a single transcriptomic dataset and in silico analyses. The identification of TLR9 and other biomarker candidates is based on statistically robust differential expression, network topology, pathway enrichment, and ROC analyses. Experimental validation of TLR9 expression in independent patient cohorts or cellular models will be required in future studies to confirm these computational predictions. Additional in vivo and longitudinal investigations may further elucidate the mechanistic role and clinical utility of TLR9 in the progression and management of DPN. Overall, this study provides a reproducible bioinformatics framework for biomarker discovery, laying the foundation for subsequent experimental and clinical validation.
Authors’ Contributions
A.B.: Conducted the study, generated and analysed data, and contributed to manuscript writing. K.V.M.: Conducted the study, generated and analysed data, and contributed to manuscript writing. S.Sunkara: Conducted the study, generated and analysed data, and contributed to manuscript writing, S.Srikanth: Assisted in data analysis and manuscript writing, V.U.: Provided supervision, project guidance, and critical review of the manuscript.
Footnotes
Author Disclosure Statement
The authors declare that no conflicting financial interests exist.
Funding Information
No funding was received for this article.