
Abstract
Ectonucleoside triphosphate diphosphohydrolase 2 (ENTPD2), an enzyme involved in extracellular nucleotide metabolism and purinergic signaling, has been linked to tumor–immune interactions, although its role in colorectal cancer (CRC) remains unclear. This study examined the expression pattern and regulatory context of ENTPD2 through integrative analysis of transcriptomic, proteomic, microRNA (miRNA), and single-cell transcriptomic datasets. Transcriptomic analyses showed that ENTPD2 mRNA levels are elevated in colorectal tumors compared with normal tissues and that higher expression is associated with shorter relapse-free survival. In contrast, proteomic analyses indicated reduced ENTPD2 protein abundance in tumor samples, suggesting a divergence between transcript and protein expression. Analysis of candidate miRNAs identified miR-708-5p as a potential post-transcriptional regulator, supported by its increased expression in CRC and a predicted binding site within the ENTPD2 3′-untranslated region (UTR). Single-cell transcriptomic datasets further indicated that ENTPD2 transcripts are mainly detected in malignant epithelial cells. We performed a functional validation using dual-luciferase reporter assays, qRT-PCR, and Western blot analysis in CRC cell lines. Experimental analyses demonstrated that miR-708-5p directly targets the ENTPD2 3′UTR in HCT116 cells and suppresses ENTPD2 expression in both HCT116 and HT-29 cells. These findings support a potential contribution of miR-708-5p to ENTPD2 regulation in CRC.
Introduction
Colorectal cancer (CRC) constitutes a major global health burden. It demonstrates high prevalence rates across diverse populations and is a leading cause of cancer-related mortality (Abedizadeh et al., 2024; Dang et al., 2024; Dunne and Arends, 2024). Despite advances in diagnosis and treatment, patient outcomes vary considerably, reflecting the molecular heterogeneity of the disease (Ahlawat and Das, 2026; Dang et al., 2024). Increasing evidence indicates that tumor progression in CRC is influenced not only by genetic alterations in cancer cells but also by regulatory mechanisms operating within the tumor microenvironment, including metabolic signaling and immune-related processes (Bai et al., 2020; Liu et al., 2025; Zhong et al., 2022).
Purinergic signaling represents one of the molecular systems involved in tumor–immune interactions (Aria et al., 2022; Di Virgilio and Adinolfi, 2017). Members of the ectonucleoside triphosphate diphosphohydrolase (ENTPD) family hydrolyze extracellular nucleotides and regulate the balance between ATP and its metabolites, thereby influencing inflammatory signaling and immune responses (Aria et al., 2022; Carracedo et al., 2024; Feldbrugge et al., 2020). Among these enzymes, ENTPD2 has been implicated in immune regulation and cellular communication (Feldbrugge et al., 2020). However, its biological and clinical relevance in CRC has not been clearly defined.
Differences between mRNA and protein expression patterns are often explained by post-transcriptional regulatory mechanisms (Franks et al., 2017). MicroRNAs (miRNAs) represent a major class of such regulators and control gene expression by binding to complementary sequences in the 3′ untranslated regions (UTRs) of target transcripts (Hernandez et al., 2018). Dysregulation of miRNAs is frequently observed in CRC and contributes to multiple aspects of tumor biology (Dong et al., 2011; Hernandez et al., 2018).
Here, we investigated the expression pattern and regulatory context of ENTPD2 in CRC using multiple publicly available datasets. Transcriptomic analyses were performed to determine differential expression and clinical associations, while proteomic data were used to explore protein abundance. Potential post-transcriptional regulation was explored by analyzing candidate miRNAs predicted to target ENTPD2, including miR-708-5p. We evaluated miR-708-5p as a candidate post-transcriptional regulator of ENTPD2 gene. Single-cell transcriptomic data were further analyzed to resolve the cell-type-specific distribution of ENTPD2. To provide experimental evidence for this regulatory relationship, dual-luciferase reporter assays using wild-type (WT) and mutant ENTPD2 3′-UTR constructs, together with miR-708-5p mimic transfection and quantitative RT-PCR and Western blot analyses (WB), were performed in HCT116 and HT-29 CRC cell lines to functionally validate the predicted miR-708-5p-ENTPD2 interaction and to confirm the transcript-protein divergence of ENTPD2 at the cellular level.
Materials and Methods
Gene expression analysis
The transcriptional expression of ENTPD2 in CRC was examined using RNA sequencing data from The Cancer Genome Atlas (TCGA) (Tomczak et al., 2015). We performed a differential expression analysis between tumor and normal tissues using UALCAN (University of Alabama at Birmingham Cancer Data Analysis Portal; https://ualcan.path.uab.edu), an interactive platform for exploring cancer transcriptome datasets (Chandrashekar et al., 2017). Expression levels of ENTPD2 were evaluated in the colon adenocarcinoma (COAD)—TCGA and rectum adenocarcinoma (READ)—TCGA cohorts (Tomczak et al., 2015). Stage-specific analyses were also conducted through the same platform to assess variation in ENTPD2 expression across pathological stages. Expression values were reported as transcripts per million (TPM) normalized against β-actin, according to the normalization implemented in the TCGA dataset. Differential expression between tumor and normal tissues was evaluated using Student’s t-test (Tomczak et al., 2015). Physicochemical properties and predicted stability of the ENTPD2 protein were evaluated using the ProtParam tool available through the ExPASy server (https://web.expasy.org/protparam) (Milacic et al., 2024). Parameters including predicted half-life, instability index, aliphatic index, and GRAVY score were calculated based on the ENTPD2 amino acid sequence (Milacic et al., 2024). All datasets and online resources were accessed between January and February 2026.
Protein expression analysis
Protein abundance of ENTPD2 in CRC was investigated using proteomic data from the Clinical Proteomic Tumor Analysis Consortium (CPTAC). CPTAC provides mass spectrometry-based proteomic profiling of tumor and normal tissues (Chandrashekar et al., 2017). Comparisons of ENTPD2 protein levels between normal colorectal tissues and tumor samples were performed using the CPTAC analysis module available within the UALCAN platform. Protein expression values are presented as log2-transformed iTRAQ ratios (Chandrashekar et al., 2017). When available, protein expression levels were also examined according to pathological stage.
miRNA expression and target prediction
miRNAs potentially regulating ENTPD2 were investigated using ENCORI (Encyclopedia of RNA Interactomes; https://rnasysu.com/encori), previously known as starBase, which integrates RNA interaction data supported by CLIP-seq (Cross-Linking Immunoprecipitation sequencing) experiments (Li et al., 2014). Expression levels of candidate miRNAs were examined in COAD datasets within the ENCORI platform (Agarwal et al., 2015; Li et al., 2014). Correlation analyses between miRNA and ENTPD2 transcript levels were performed using Spearman’s rank correlation coefficient. The COAD cohort comprised n = 450 tumor samples and the READ cohort comprised n = 161 tumor samples. We performed a survival analysis for selected miRNA using the Kaplan–Meier (KM; https://kmplot.com) module implemented in the same resource. The auto-select best cutoff method was applied to stratify patients into high- and low-expression groups, and survival differences were evaluated using the log-rank test (Posta and Gyorffy, 2025). Predicted interactions between miRNA and the ENTPD2 3′UTR were evaluated using TargetScan (https://www.targetscan.org) (Agarwal et al., 2015).
Single-cell expression analysis
The cellular distribution of ENTPD2 expression in the colorectal tumor microenvironment was evaluated using TISCH2 (Tumor Immune Single-cell Hub 2; http://tisch.comp-genomics.org), a database that compiles single-cell RNA sequencing datasets derived from tumor tissues (Han et al., 2023). Multiple CRC datasets available within the platform were analyzed to determine the expression pattern of ENTPD2 across malignant epithelial cells, immune cell populations, and stromal cell types (Han et al., 2023).
Immune checkpoint correlation analysis
The relationship between ENTPD2 expression and immune checkpoint genes was examined using GEPIA2 (Gene Expression Profiling Interactive Analysis 2; http://gepia2.cancer-pku.cn), a web server integrating RNA sequencing data from TCGA and the Genotype-Tissue Expression (GTEx) project (Consortium GT Human Genomics, 2015; Tang et al., 2019). Immune checkpoint genes for correlation analysis (PDCD1LG2, HAVCR2, CD274, CTLA4, and TIGIT) were selected based on their established roles as coinhibitory immune regulators with documented clinical relevance in CRC immunotherapy. Correlation analyses between ENTPD2 and these immune checkpoint genes were calculated across COAD samples using GEPIA2.
Functional enrichment analysis
For Reactome pathway enrichment, genes positively correlated with ENTPD2 expression in TCGA-COAD (Spearman’s r > 0.30, p < 0.05), as retrieved from GEPIA2, were submitted to Enrichr (https://maayanlab.cloud/Enrichr). Pathways with an adjusted p-value <0.05 were considered significantly enriched.
Cell culture and transfection
Human CRC cell lines HCT116 and HT-29 (ATCC) were cultured in Dulbecco’s Modified Eagle Medium (Gibco) supplemented with 10% fetal bovine serum, 1% L-glutamine, 1% HEPES, and 1% penicillin–streptomycin at 37°C in a humidified 5% CO2 atmosphere. Cells were passaged at 80–90% confluence using 0.25% trypsin–EDTA. For transfection experiments, cells were seeded 24 h prior to transfection at 2 × 10⁴ cells/well (96-well plates) or 3 × 10⁵ cells/well (24-well plates), depending on downstream assays. Transient transfections were performed using Lipofectamine 3000 (Invitrogen) according to the manufacturer’s protocol. miR-708-5p mimic or scrambled negative control (50 nM; Sigma-Aldrich) was complexed with the reagent in Opti-MEM and added to cells. Culture medium was replaced after incubation, and cells were harvested 48 h post-transfection.
Plasmid construction and Dual-Luciferase reporter assay
The ENTPD2 3′-UTR fragment containing the predicted miR-708-5p binding site was amplified by PCR and cloned downstream of the firefly luciferase gene in the pGL3-Control vector (Promega). We performed a site-directed mutagenesis of the seed-match region using the QuikChange Lightning Kit (Agilent Technologies) to generate the mutant (MUT) construct. The predicted miR-708-5p 7mer-m8 site spans nucleotides 316–322 of the ENTPD2 3′UTR (5′-AGAGAAU-3′). For the MUT construct, we introduced three point mutations within this seed region (A318C, G319C, A320C) to yield 5′-AGCGCAU-3′. All constructs were verified by Sanger sequencing and purified using endotoxin-free plasmid preparation kits prior to transfection. For reporter assays, HCT116 cells were co-transfected with WT or MUT ENTPD2 3′UTR constructs, a Renilla luciferase normalization plasmid (pRL-TK), and miR-708-5p mimic or scramble control using Lipofectamine 3000. Luciferase activity was measured at 48 h post-transfection using the Dual-Luciferase Reporter Assay System (Promega). Firefly luciferase values were normalized to Renilla activity and expressed relative to the WT + scramble control. Each condition was performed with ≥3 independent biological replicates in technical triplicate.
RNA isolation and quantitative real-time PCR
Total RNA was extracted using TRIzol reagent (Invitrogen). RNA quality was assessed spectrophotometrically. For miRNA analysis, reverse transcription was performed using miRNA-specific primers; for mRNA, cDNA synthesis was performed using standard reverse transcription protocols. Quantitative PCR was conducted using TaqMan assays (Applied Biosystems) for miR-708-5p, ENTPD2, and corresponding endogenous controls (U6 for miRNA, GAPDH for mRNA). Relative expression levels were calculated using the 2-ΔΔCt method.
Western blot analysis
Cells were lysed in RIPA (Radioimmunoprecipitation Assay Buffer) buffer supplemented with protease inhibitors. Protein concentrations were determined using a BCA (Bicinchoninic Acid) assay. Equal amounts of protein were resolved by SDS-PAGE and transferred to PVDF (Polyvinylidene Difluoride) membranes. Membranes were blocked in 5% non-fat milk in TBS-T (Tris-Buffered Saline with Tween 20) for 1 h and then incubated overnight at 4°C with primary antibodies against ENTPD2 (rabbit polyclonal, PA5-110829, Invitrogen; 1:1000 dilution) and β-actin (mouse monoclonal, sc-47778, Santa Cruz; 1:5000 dilution). After washing, membranes were incubated with HRP (Horseradish Peroxidase)-conjugated anti-rabbit or anti-mouse secondary antibodies (1:10,000) for 1 h at room temperature. Signals were detected using enhanced chemiluminescence and quantified by densitometry. ENTPD2 expression was normalized to β-actin.
Statistical analysis
Statistical analyses were performed using the analytical modules implemented within the respective web platforms. Differences in gene and protein expression between tumor and normal tissues were evaluated using Student’s t-test. Correlation analyses were performed using Spearman’s rank correlation coefficient. Survival analyses were conducted using the KM method with the log-rank test (Posta and Győrffy, 2025). qRT-PCR and Western blot analyses are presented as mean ± standard deviation (SD) from at least three independent biological replicates. Between-group comparisons were performed using a two-tailed Student’s t-test; multiple group comparisons were analyzed by one-way ANOVA followed by Tukey’s post hoc test. The number of samples analyzed in each comparison (n) corresponds to the sample sizes provided in the respective datasets. A p-value <0.05 was considered statistically significant.
Results
Transcriptional expression of ENTPD2 in CRC
The transcriptional expression of ENTPD2 in CRC was examined using RNA sequencing data obtained from TCGA and analyzed through the UALCAN platform. In COAD samples, transcript levels of ENTPD2 were significantly higher in tumor tissues than in normal colon tissues (p < 0.0001; Fig. 1A). A similar pattern was observed in READ, where tumor samples also displayed elevated ENTPD2 transcript levels compared with normal rectal tissues (p = 0.00076; Fig. 1B).
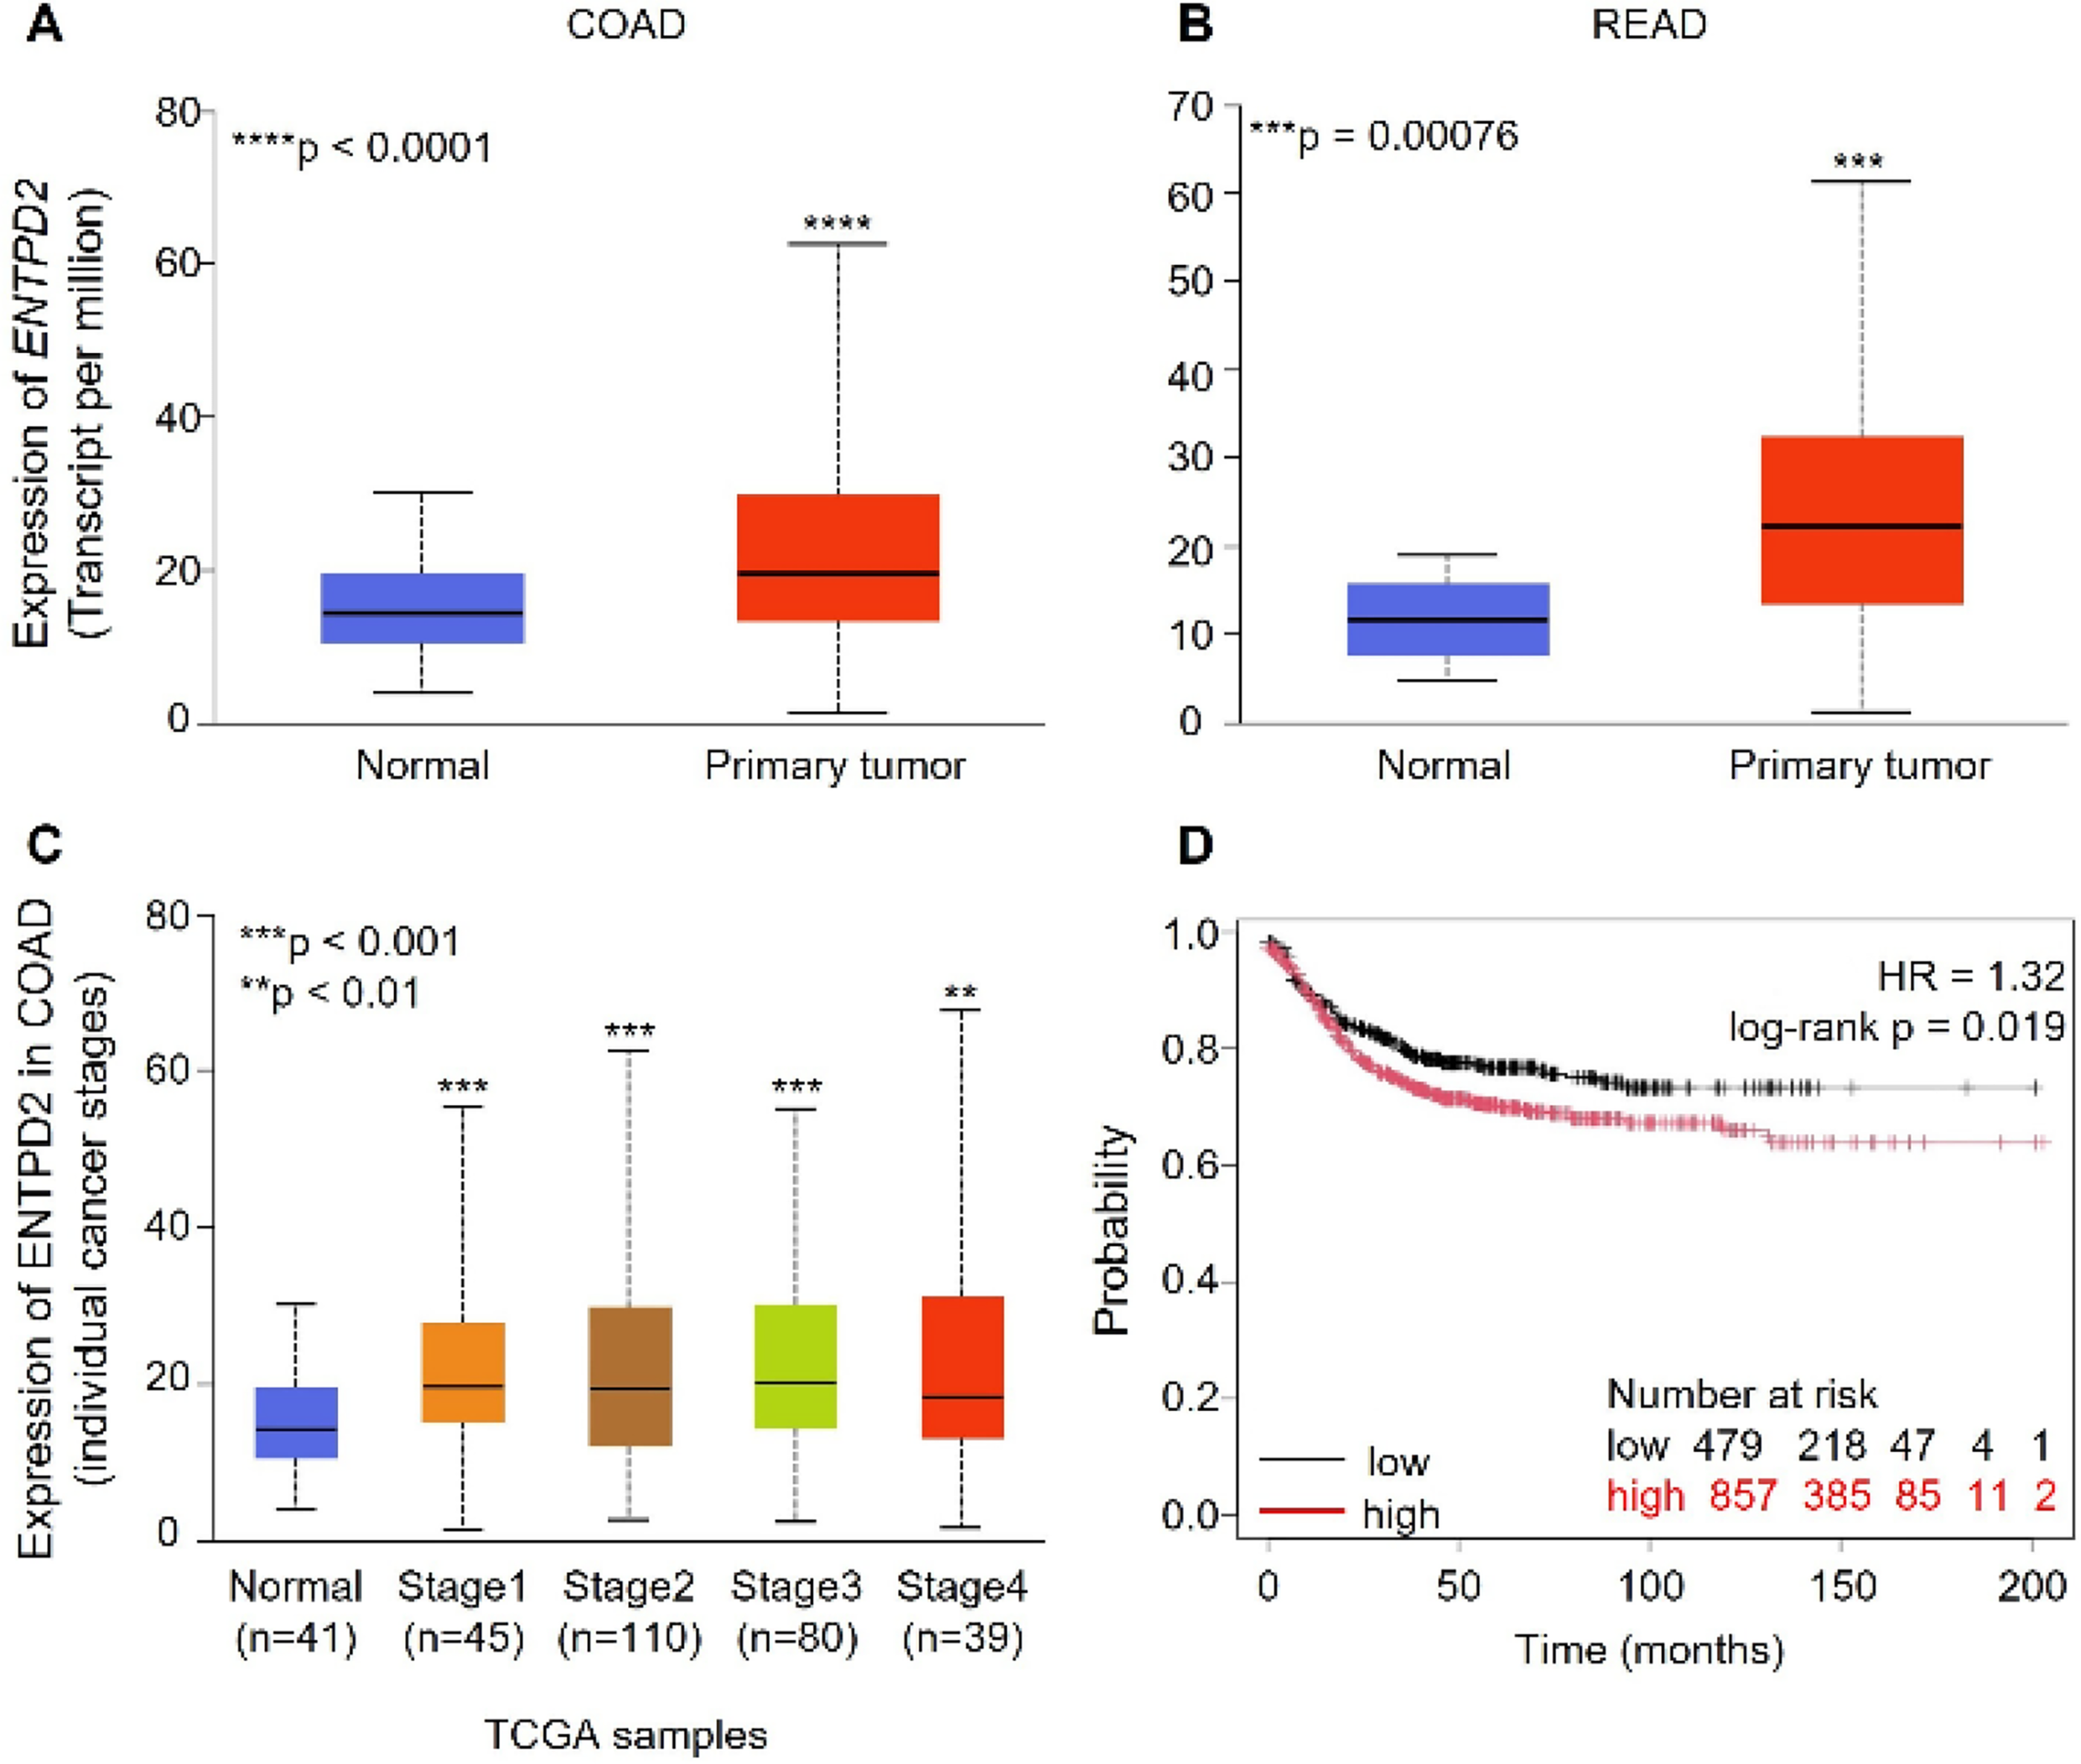
Transcriptional upregulation and prognostic significance of ENTPD2 in colorectal cancer.
Expression was further examined across pathological stages in COAD samples. Compared with normal tissues, ENTPD2 transcript levels were higher in Stage I (p < 0.001), Stage II (p < 0.001), Stage III (p < 0.001), and Stage IV tumors (p < 0.01) (Fig. 1C). However, no statistically significant differences in ENTPD2 expression were observed among individual tumor stages (Stage I–IV).
The relationship between ENTPD2 expression and lymph node involvement was also evaluated. Transcripts of ENTPD2 were significantly higher in tumors classified as N0 (no regional lymph node metastasis), N1 (metastasis in 1–3 regional lymph nodes), and N2 (metastasis in ≥4 regional lymph nodes) compared with normal tissues (p < 0.001) (Supplementary Fig. S1). No statistically significant differences in ENTPD2 expression were observed among the N0, N1, and N2 subgroups.
To assess clinical relevance, relapse-free survival analysis was performed using the KM Plotter database. Patients with higher ENTPD2 expression showed shorter RFS compared with those with lower expression (hazard ratio [HR] = 1.32, log-rank p = 0.019; Fig. 1D). Overall survival (OS) analysis did not reveal a statistically significant association between ENTPD2 expression and patient outcome (HR = 1.04, 95% CI: 0.82–1.31, log-rank p = 0.770).
Discrepancy between ENTPD2 transcript and protein levels in CRC
Protein expression of ENTPD2 was evaluated using proteomic datasets generated by the CPTAC. In contrast to the transcriptional results, protein abundance of ENTPD2 was significantly lower in COAD tissues than in normal colorectal tissues (p < 0.001; Fig. 2A).
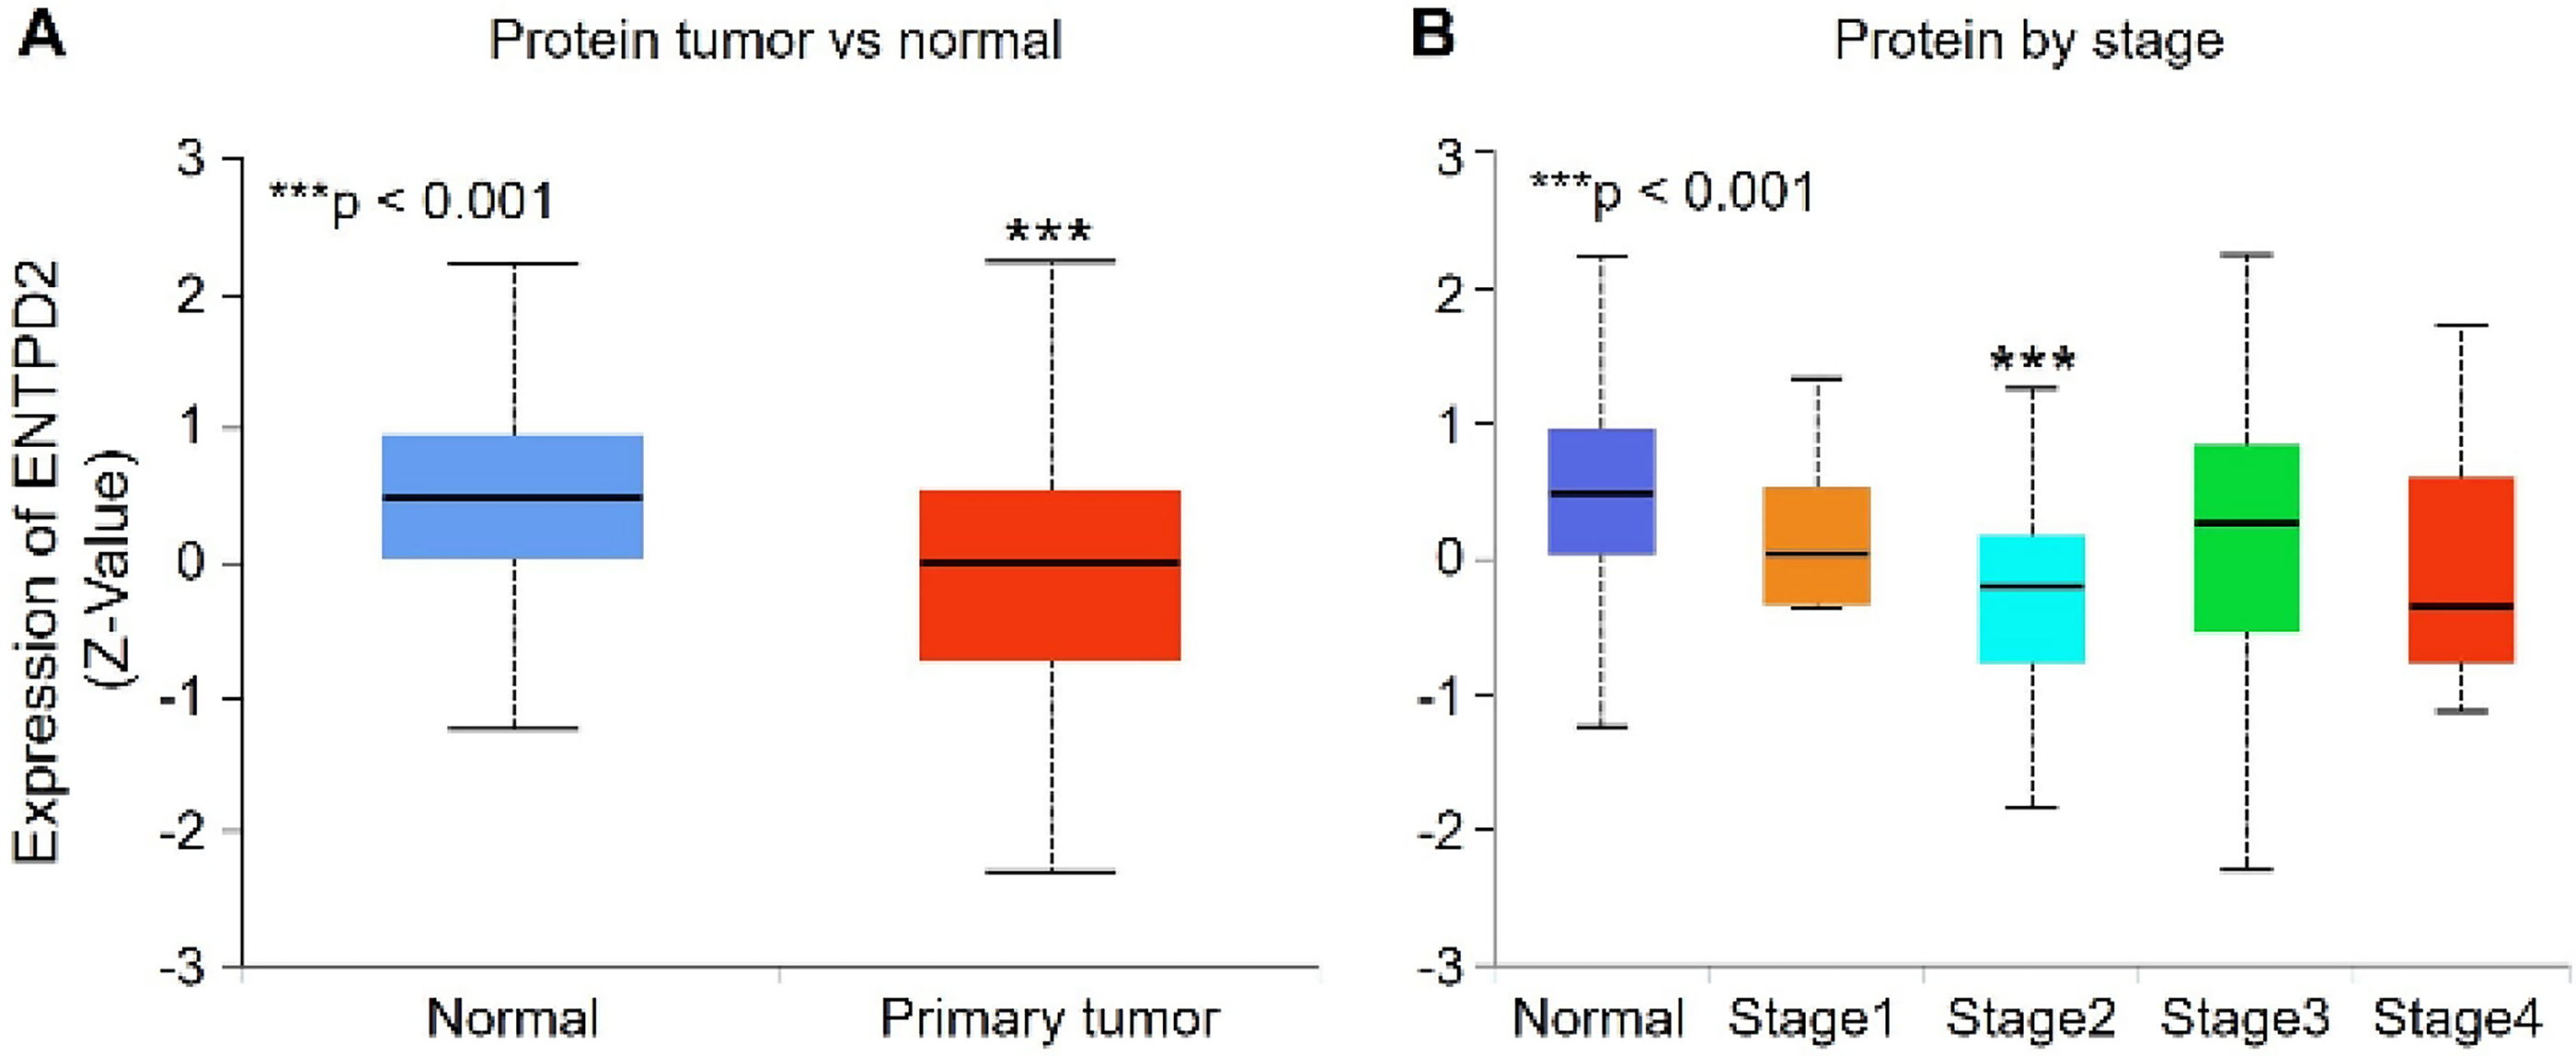
Protein expression profile of ENTPD2 in colorectal cancer.
When the transcriptomic and proteomic datasets were considered together, opposite expression patterns were observed. Tumor tissues displayed elevated transcript levels of ENTPD2, while the corresponding protein abundance was reduced relative to normal tissues. This divergence between transcriptional and proteomic measurements indicates that increased transcription of ENTPD2 in colorectal tumors is not accompanied by a parallel increase in protein abundance.
Protein expression was also examined according to pathological stage. A reduction in ENTPD2 protein levels was observed in Stage II tumors compared with normal tissues (p < 0.001), whereas the remaining stages showed variable levels without a consistent increase relative to normal tissues (Fig. 2B). No statistically significant differences in ENTPD2 protein expression were observed among individual tumor stages (Stage I–IV).
miR-708-5p as a candidate post-transcriptional regulator of ENTPD2 in CRC
Because differences between transcript and protein levels may reflect post-transcriptional regulation, candidate miRNAs predicted to target ENTPD2 were identified using ENCORI and are listed in Supplementary Table S1. The expression analysis using ENCORI datasets showed that miR-708-5p levels were significantly higher in COAD tumor tissues than in normal tissues (p < 0.000001; Fig. 3A). Notably, however, that the normal tissue group comprised a limited number of samples (n = 8) relative to the tumor group (n = 450); therefore, this result should be interpreted with caution, as the highly significant p-value may partially reflect the disparity in group sizes rather than the magnitude of differential expression alone.
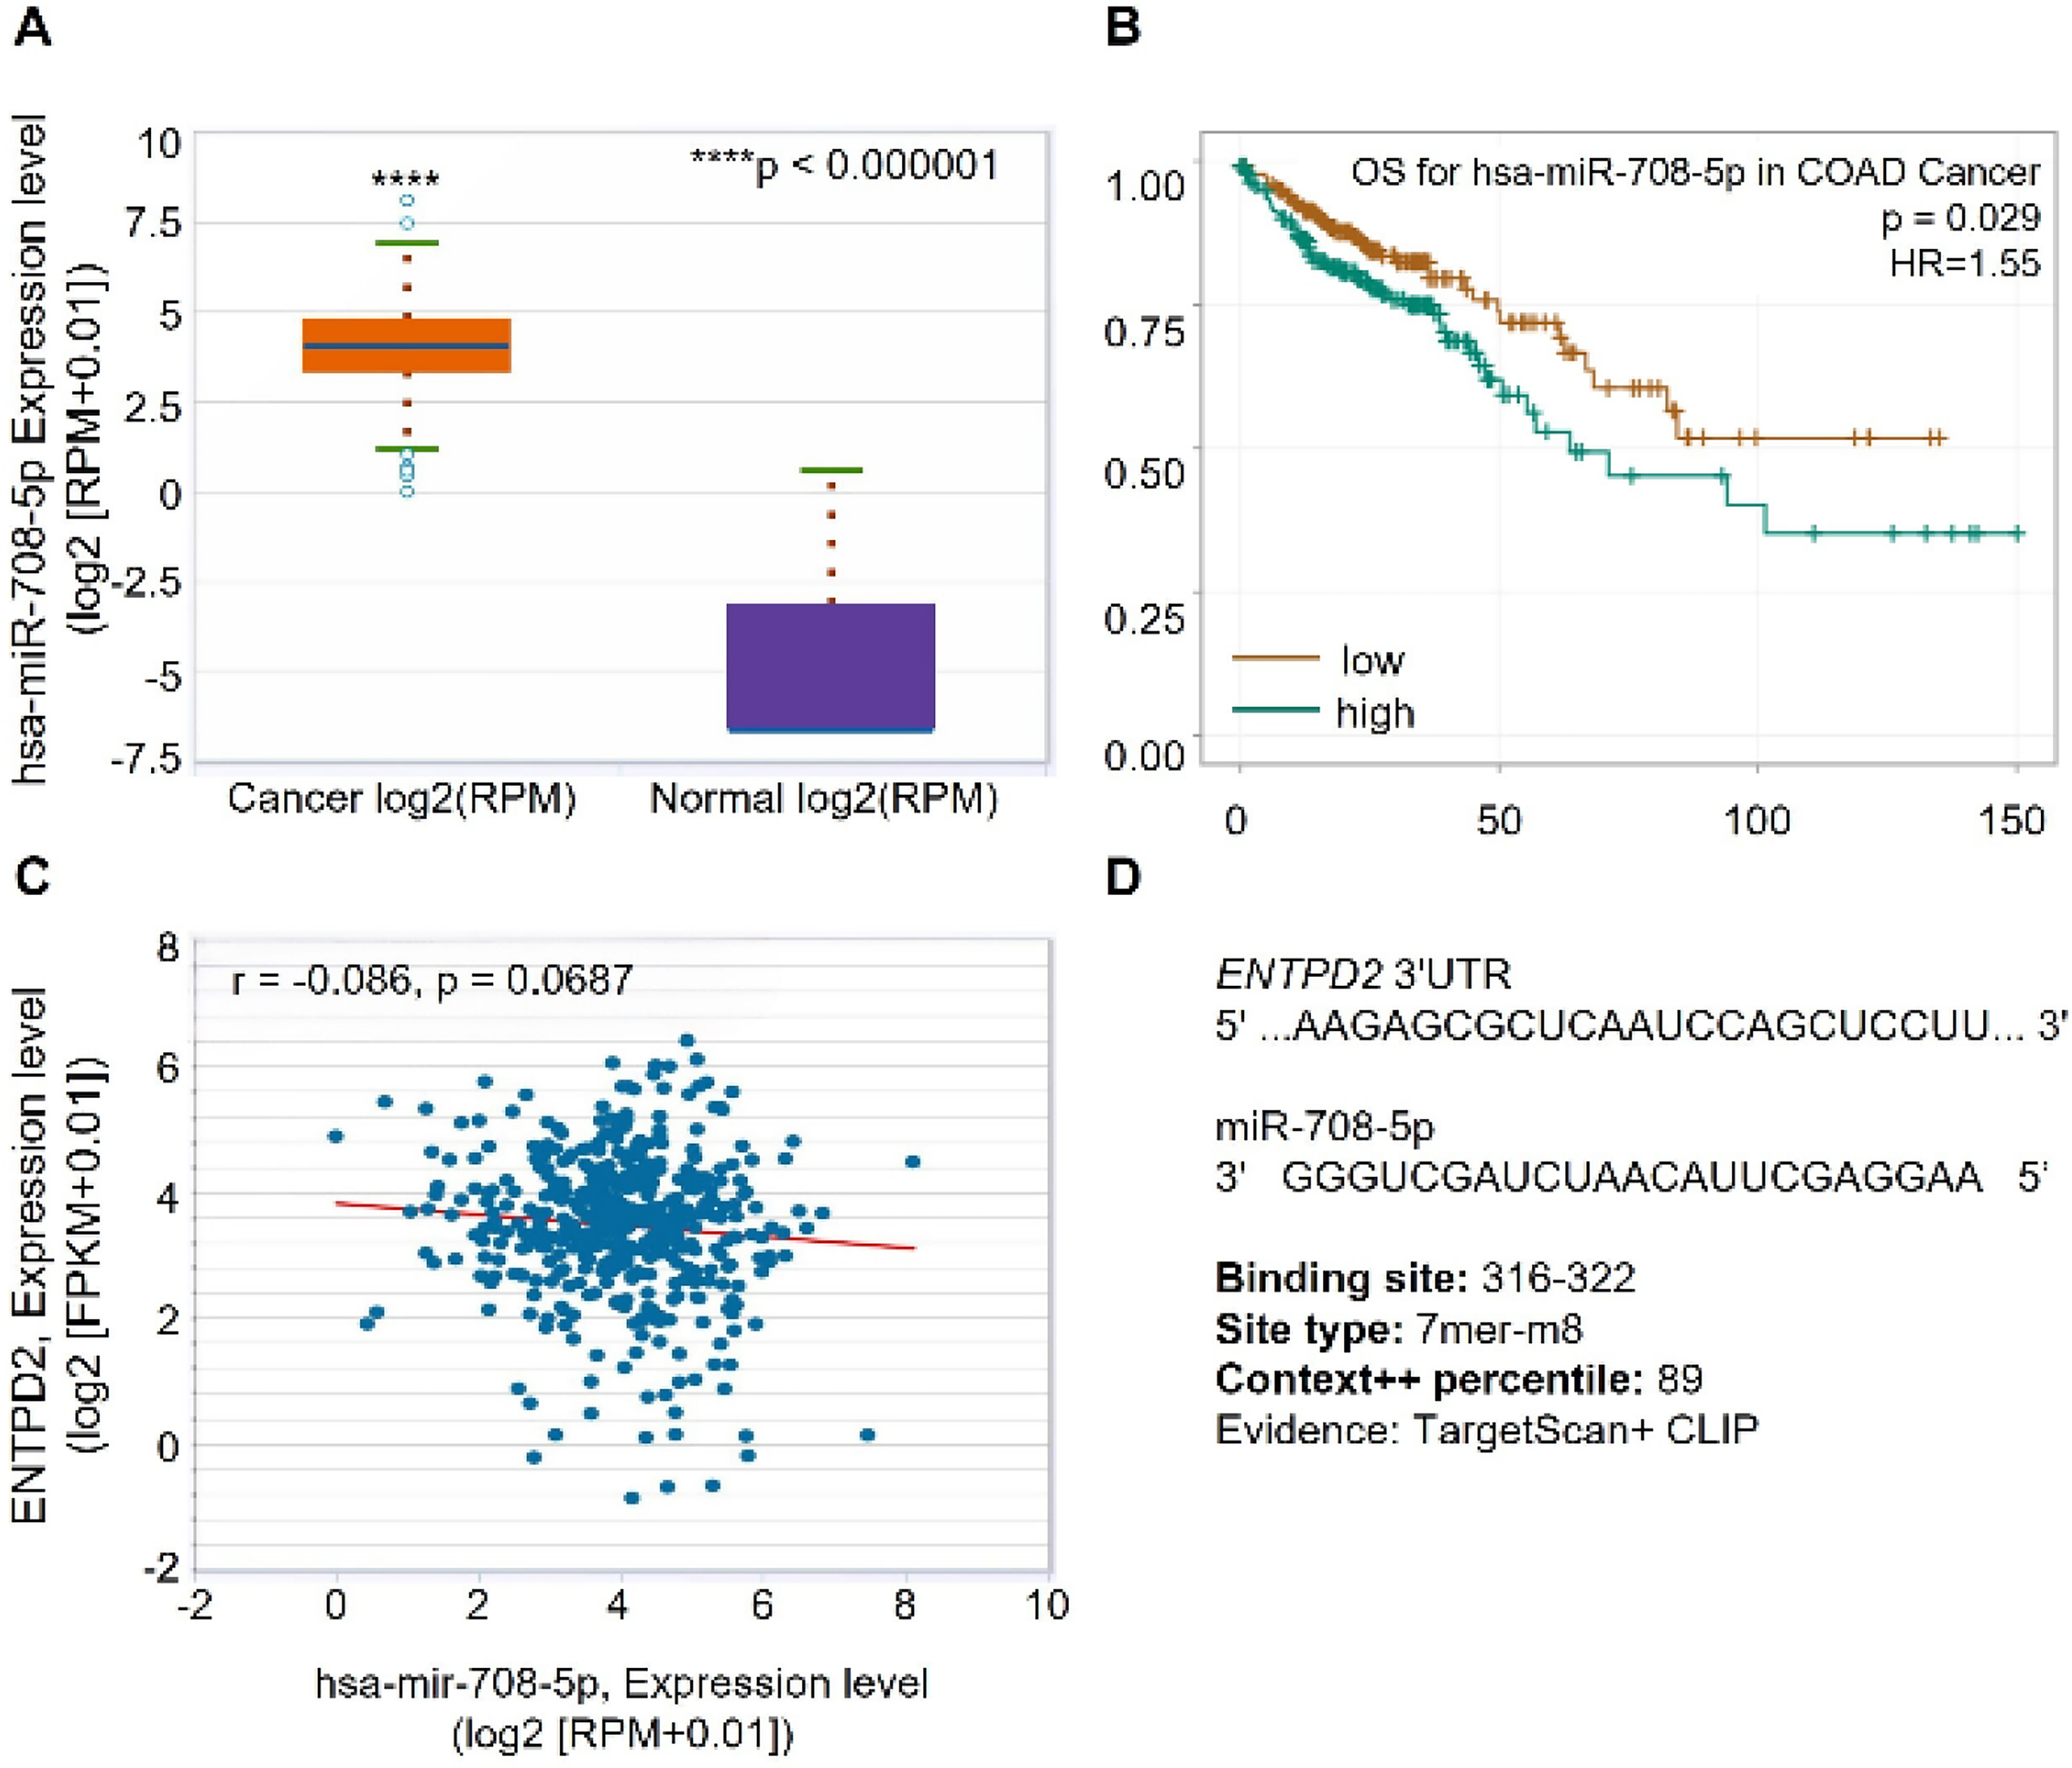
Expression, prognostic significance, and predicted targeting relationship between miR-708-5p and ENTPD2 in COAD.
The clinical association of miR-708-5p expression was evaluated using the KM survival analysis. Patients with higher expression of miR-708-5p had shorter OS compared with those with lower expression (HR = 1.55, p = 0.029; Fig. 3B).
Correlation analysis between miR-708-5p and ENTPD2 transcript levels showed a weak negative association (r = −0.086, p = 0.0687; Fig. 3C). Target prediction analysis identified a binding site for miR-708-5p within the 3′UTR region of ENTPD2. The predicted interaction corresponds to a 7mer-m8 site located at nucleotides 316–322 and is supported by TargetScan and cross-linking immunoprecipitation datasets (Fig. 3D).
Cellular distribution of ENTPD2 expression
Single-cell transcriptomic datasets were analyzed to examine the cellular distribution of ENTPD2 expression in colorectal tumors. Across several independent datasets, including CRC_EMTAB8107, CRC_GSE108989, CRC_GSE146771, CRC_GSE166555, and CRC_GSE179784, the highest transcript levels were observed in malignant epithelial cells (Fig. 4).
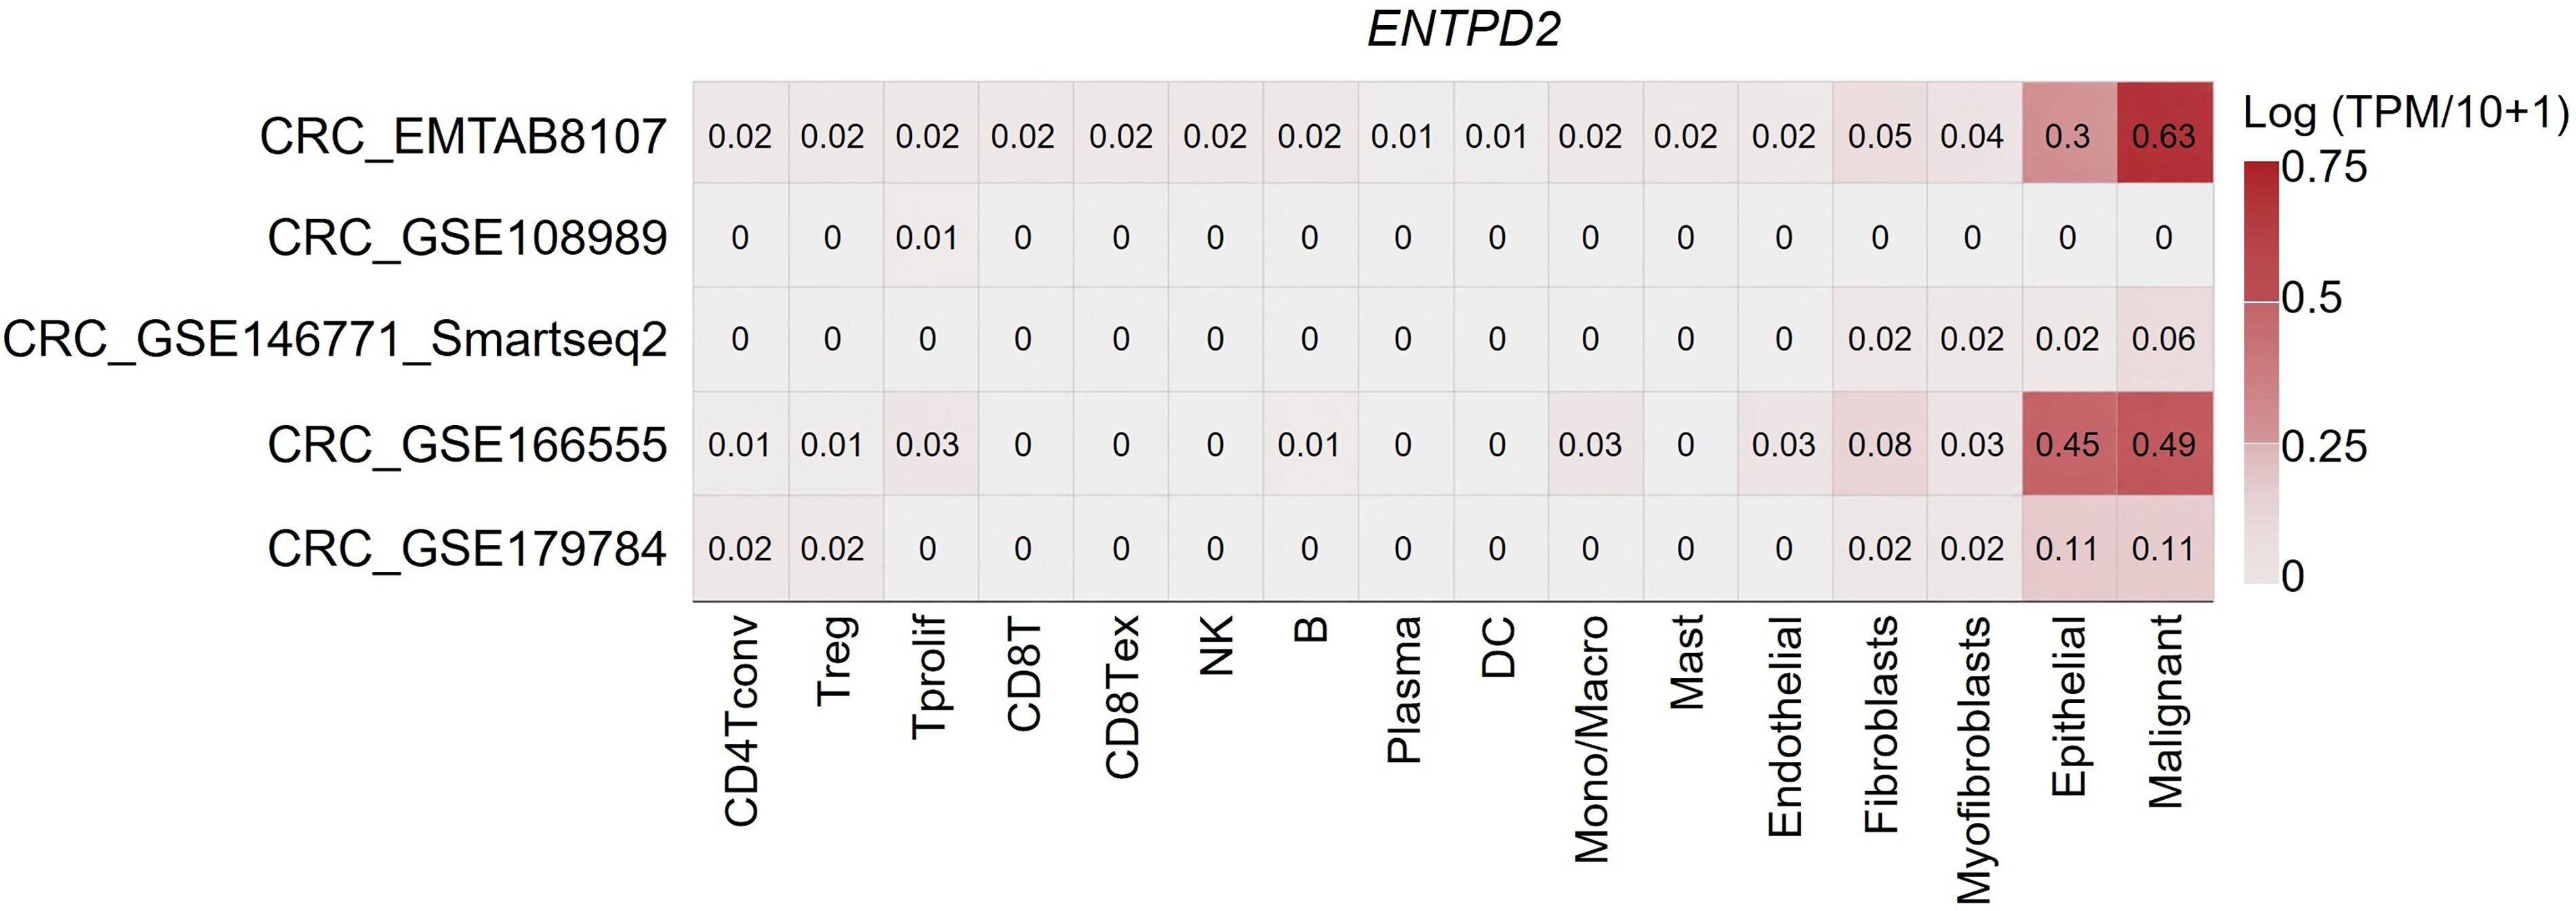
Cell-type specific expression of ENTPD2 in colorectal cancer single-cell datasets. Heatmap showing the distribution of ENTPD2 expression across different cell populations in multiple CRC single-cell RNA sequencing datasets (CRC_EMTAB8107, CRC_GSE108989, CRC_GSE146771, CRC_GSE166555, and CRC_GSE179784). Expression values are represented as log (TPM + 1). Across datasets, ENTPD2 expression is predominantly enriched in malignant epithelial cells, whereas immune cell populations—including CD4+ T cells, Treg cells, CD8+ T cells, NK cells, B cells, dendritic cells, monocytes/macrophages, and mast cells—display minimal transcript levels. Stromal populations such as fibroblasts, myofibroblasts, and endothelial cells show limited expression compared with malignant cells.
Immune cell populations, including CD4-positive T lymphocytes, regulatory T lymphocytes, cytotoxic T lymphocytes, natural killer cells, B lymphocytes, dendritic cells, and macrophages, showed minimal expression. Stromal cell populations such as fibroblasts and endothelial cells displayed comparatively lower transcript levels.
Associations with immune-related molecular features
Correlations between ENTPD2 expression and immune-related molecular features were examined to explore potential immunological associations. Weak negative correlations were observed between ENTPD2 expression and selected immune checkpoint molecules, while immune cell infiltration analyses indicated limited associations across multiple immune cell populations (Supplementary Fig. S2). Functional enrichment analysis using Reactome pathway datasets showed that genes associated with ENTPD2 expression participate in biological processes related to antigen processing and cross-presentation, major histocompatibility complex class I-mediated antigen presentation, and toll-like receptor signaling pathways (Supplementary Fig. S2). Given the modest effect sizes observed, these findings should be interpreted cautiously and considered exploratory.
miR-708-5p directly targets the ENTPD2 3′UTR and suppresses ENTPD2 expression in vitro
To provide direct experimental evidence for the proposed regulatory relationship between miR-708-5p and ENTPD2 identified through in silico analyses, a series of functional, transcriptional, and translational assays were performed in the HCT116 CRC cell line.
To determine whether miR-708-5p directly interacts with the predicted binding site within the ENTPD2 3′UTR, a dual-luciferase reporter system was employed. HCT116 cells were co-transfected with either a WT or a seed-sequence MUT ENTPD2 3′UTR reporter construct, together with miR-708-5p mimic or scramble control. Co-transfection of the WT 3′UTR construct with the miR-708-5p mimic resulted in a notable reduction in relative luciferase activity compared with the WT 3′UTR plus scramble control (approximately 50% reduction; p < 0.0001; n = 4; Fig. 5A). In contrast, co-transfection of the MUT 3′UTR construct with the miR-708-5p mimic did not produce a significant change in luciferase activity relative to the MUT 3′UTR plus scramble control, confirming that the suppressive effect is strictly dependent on the integrity of the predicted seed-match sequence at nucleotides 316–322 of the ENTPD2 3′UTR.
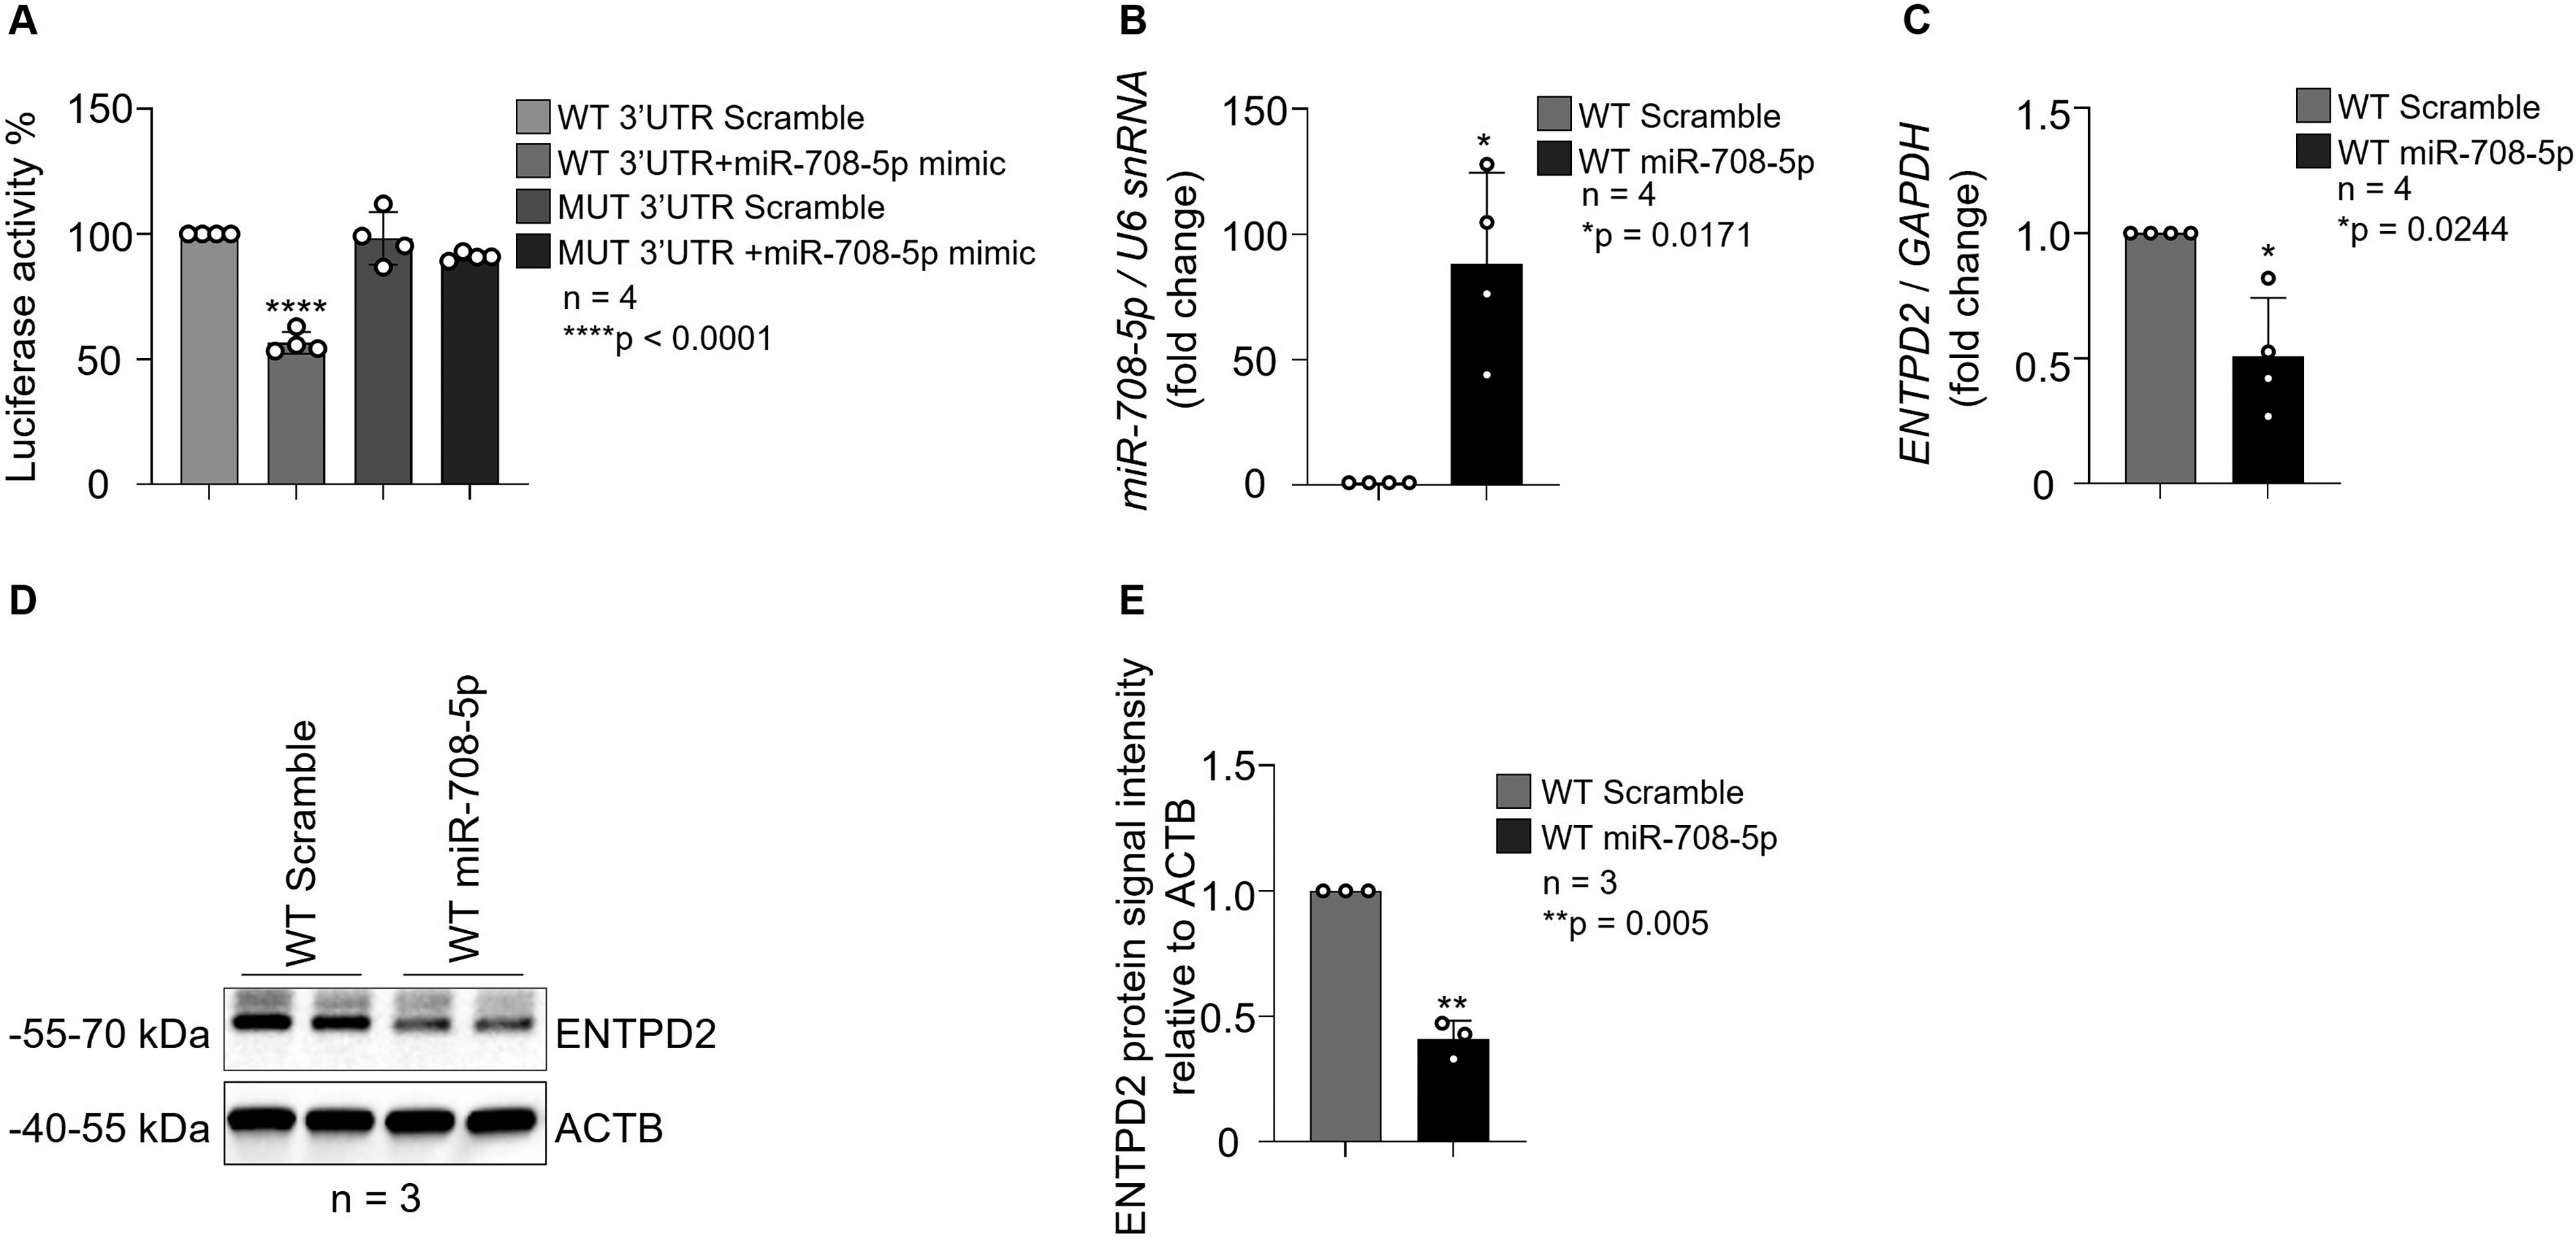
miR-708-5p directly targets the ENTPD2 3′UTR and suppresses ENTPD2 expression in HCT116 colorectal cancer cells
To confirm successful transfection and functional overexpression of miR-708-5p, intracellular miR-708-5p levels were quantified by TaqMan qRT-PCR and normalized to U6 snRNA. Cells transfected with the miR-708-5p mimic showed an approximately 85-fold increase in miR-708-5p levels relative to scramble control (p = 0.0171; n = 4; Fig. 5B), confirming efficient delivery of the mimic.
Assessment of the effect of miR-708-5p overexpression on endogenous ENTPD2 transcript levels revealed a significant reduction in ENTPD2 mRNA abundance in miR-708-5p mimic-transfected cells compared with scramble control (approximately 50% decrease; p < 0.0244; n = 4; Fig. 5C), consistent with miRNA-mediated destabilization of the target transcript.
We performed Western blot analysis to examine the effect of miR-708-5p overexpression on ENTPD2 protein abundance (Fig. 5D–E). Densitometric quantification of ENTPD2 signal intensity, normalized to β-actin (ACTB) loading control, demonstrated a substantial reduction in ENTPD2 protein levels in miR-708-5p mimic-transfected cells relative to scramble control (approximately 59% decrease; p = 0.005; n = 3; Fig. 5D–E). Together, our findings demonstrate that miR-708-5p directly targets the ENTPD2 3′UTR through its predicted seed-match binding site and suppresses ENTPD2 expression at both the mRNA and protein levels in HCT116 cells. These results provide mechanistic in vitro validation for the in silico-derived hypothesis that miR-708-5p contributes to the post-transcriptional downregulation of ENTPD2 protein abundance in CRC.
Validation of miR-708-5p-mediated suppression of ENTPD2 in HT-29 CRC cells
To determine whether the regulatory effect of miR-708-5p on ENTPD2 expression is conserved across CRC cell lines with distinct molecular backgrounds, complementary experiments were performed in the HT-29 cell line. Efficient overexpression of miR-708-5p following mimic transfection was confirmed by TaqMan qRT-PCR analysis, which demonstrated an approximately 35-fold increase in miR-708-5p levels compared with scramble control (p = 0.0310; n = 3; Fig. 6A). Subsequent analysis of ENTPD2 transcript levels revealed a significant reduction in mRNA abundance in miR-708-5p-overexpressing cells relative to controls (approximately 50% decrease; p = 0.0124; n = 3; Fig. 6B), consistent with miRNA-mediated transcript destabilization. At the protein level, Western blot analysis showed a marked decrease in ENTPD2 signal intensity in miR-708-5p mimic-transfected cells compared with scramble controls (Fig. 6C). Densitometric quantification confirmed a significant reduction in ENTPD2 protein abundance following miR-708-5p overexpression (approximately 47% decrease; p = 0.0158; n = 3; Fig. 6D). In HT-29 cells, miR-708-5p suppresses ENTPD2 expression at both the transcript and protein levels. These results are consistent with the observations obtained in HCT116 cells (Fig. 5), indicating that the regulatory interaction between miR-708-5p and ENTPD2 is not cell line-specific but is reproducible across distinct CRC models.
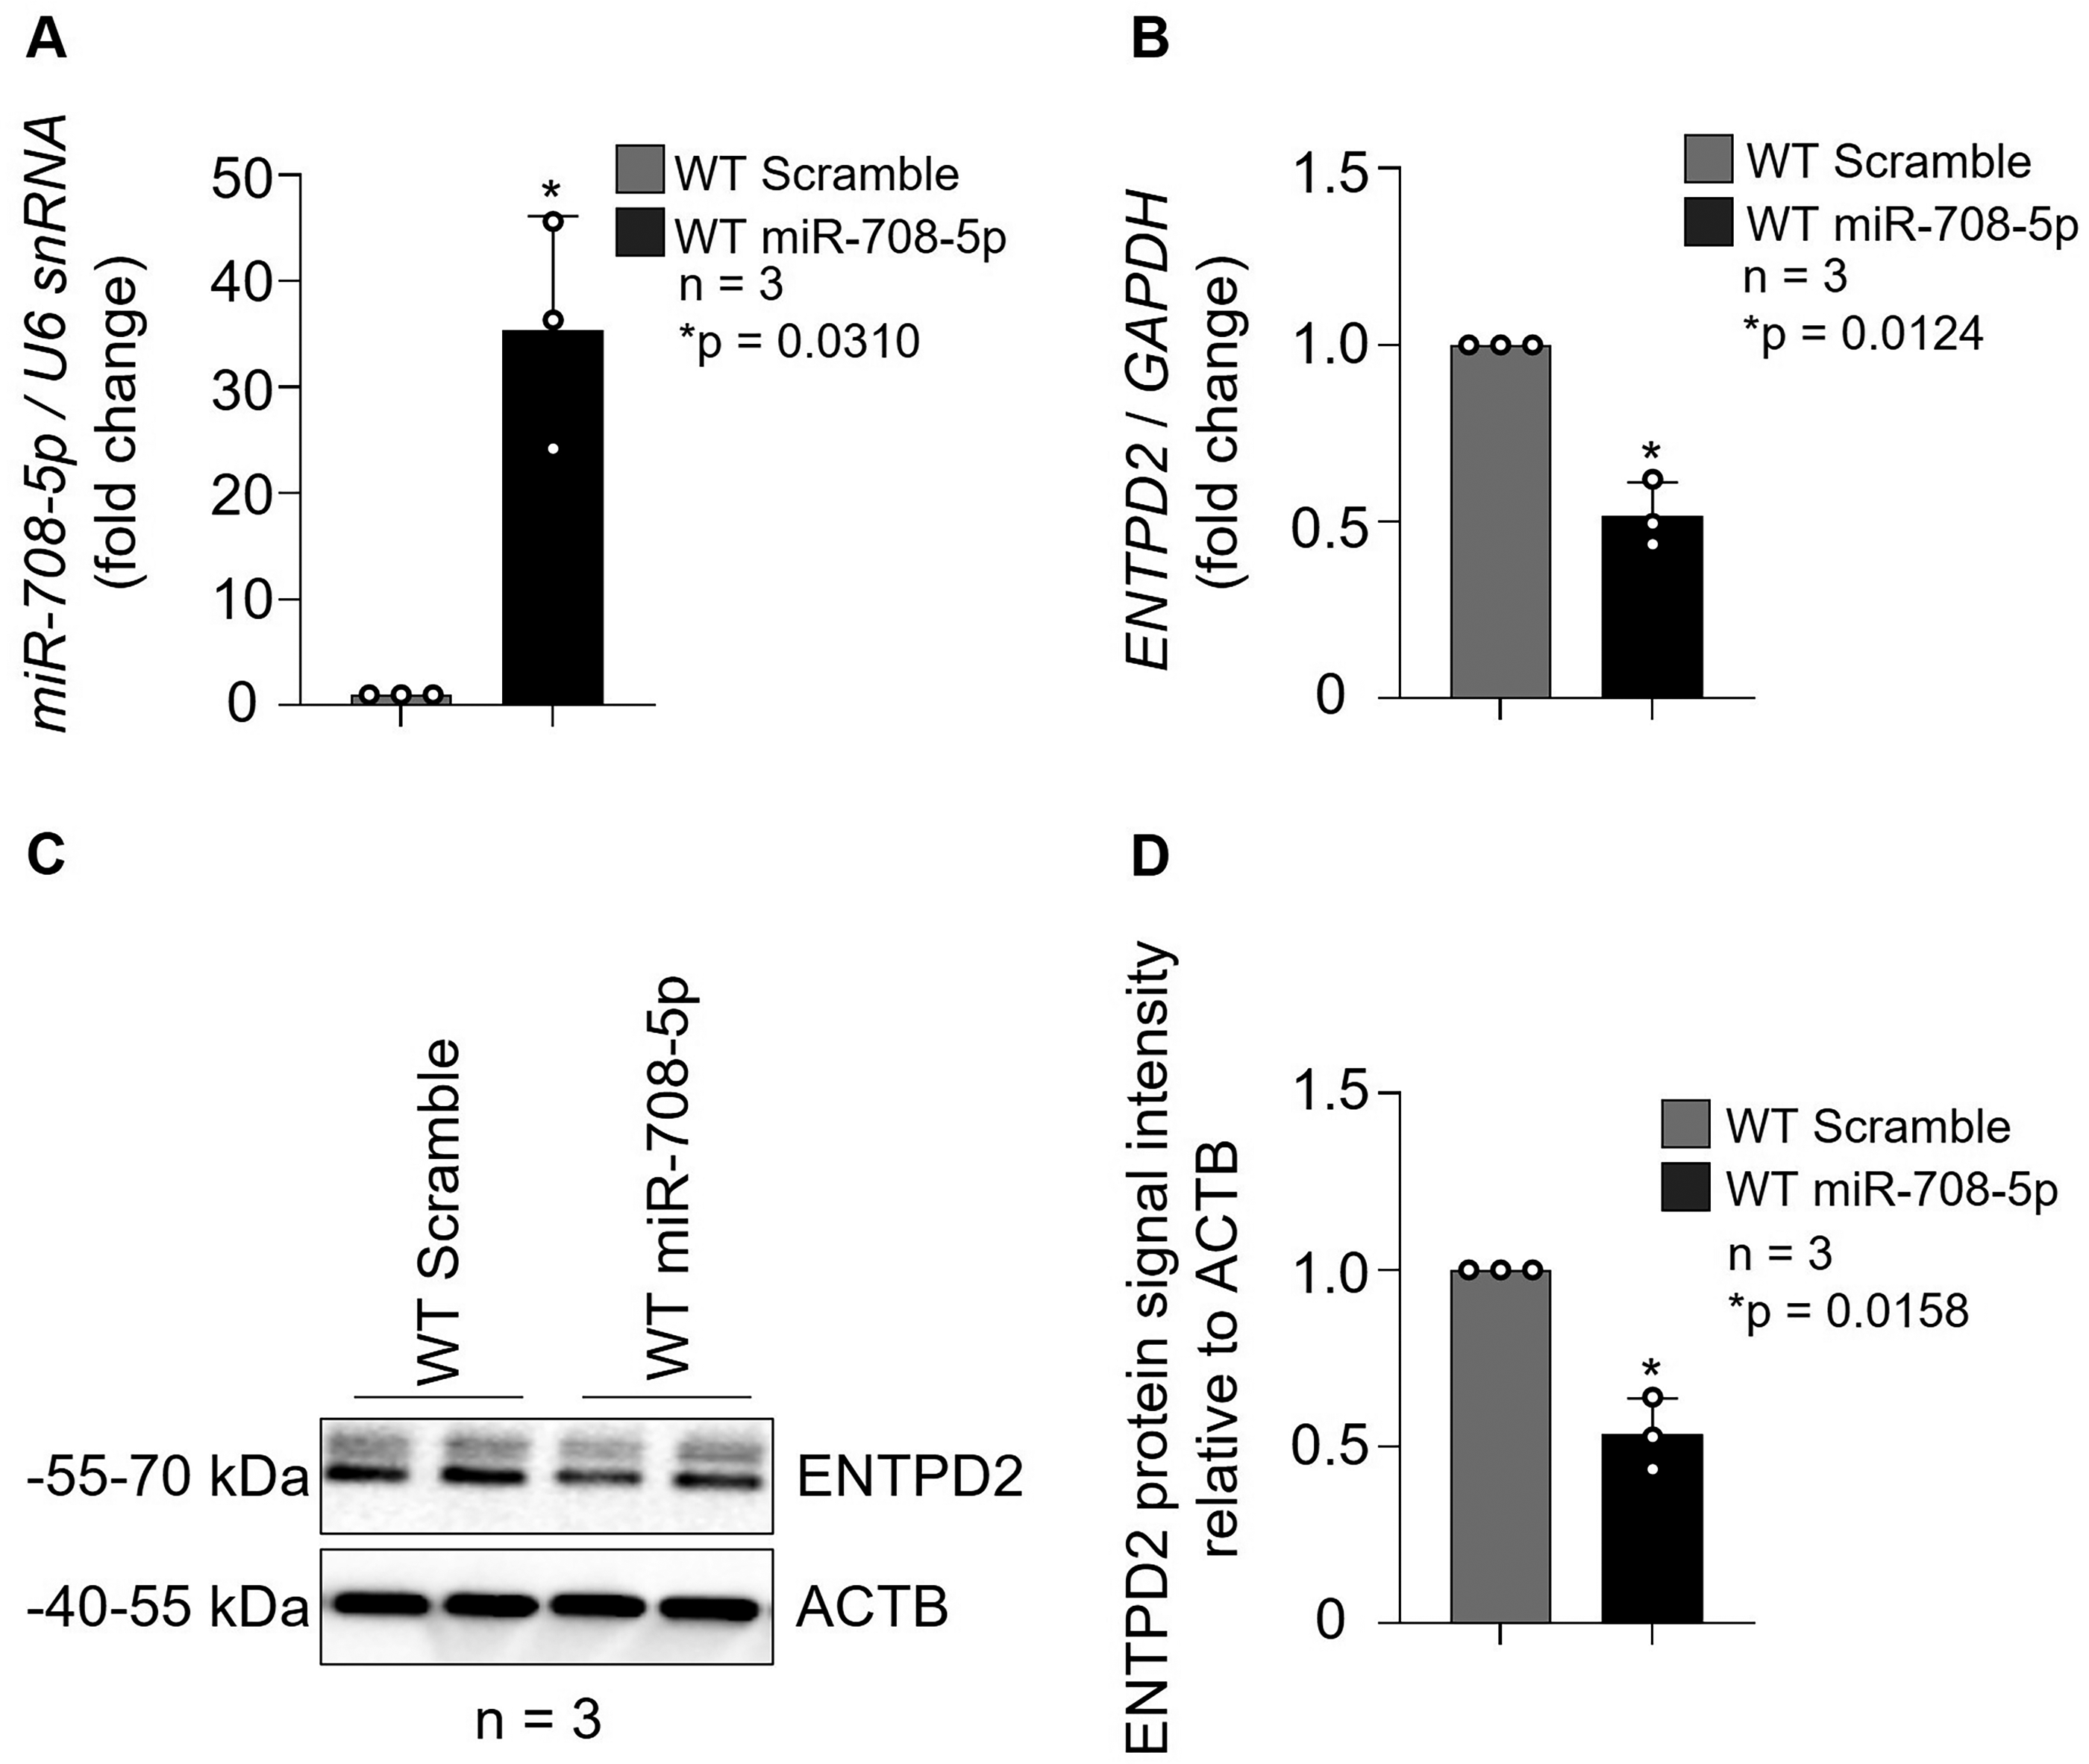
miR-708-5p suppresses ENTPD2 expression in HT-29 colorectal cancer cells
Discussion
Our study provides an integrative characterization of ENTPD2 in CRC by combining transcriptomic, proteomic, miRNA, and single-cell RNA sequencing analyses with functional experimental validation. The results indicate that transcription of ENTPD2 is significantly increased in colorectal tumors and that higher transcript levels are associated with shorter relapse-free survival. In contrast, proteomic analyses indicate that the abundance of the corresponding protein is reduced in tumor tissues compared with normal colorectal tissues. Single-cell transcriptomic datasets further show that ENTPD2 transcripts are predominantly detected in malignant epithelial cells, whereas immune cell populations display minimal expression. Thus, the increased transcription of ENTPD2 in colorectal tumors does not translate into increased protein abundance (Li et al., 2022).
Transcriptomic analyses demonstrate that ENTPD2 transcript levels are consistently elevated in tumors derived from both the colon and rectum compared with normal tissues. Elevated transcription is observed across pathological stages and is also present in tumors with lymph node involvement. The presence of increased transcription in early as well as advanced disease stages suggests that activation of ENTPD2 transcription is not restricted to late tumor progression. Survival analyses further indicate that patients with tumors exhibiting higher ENTPD2 expression tend to have shorter relapse-free survival, although the magnitude of this association is moderate. Of note, no significant association was observed for overall survival (p = 0.770), suggesting that the prognostic impact of ENTPD2 expression may be more relevant to disease recurrence than to overall mortality.
A central observation emerging from this analysis is the divergence between ENTPD2 transcript abundance and protein expression. While transcript levels increase in colorectal tumors, proteomic datasets indicate that the corresponding protein abundance is reduced. Differences between transcript and protein levels are commonly observed in biological systems and may arise from multiple post-transcriptional regulatory mechanisms affecting translation efficiency, transcript stability, or protein turnover (Cheng et al., 2018; de Sousa Abreu et al., 2009). The pattern identified for ENTPD2 therefore, suggests that transcriptional activation alone does not determine the final abundance of the protein in colorectal tumors. The convergence of transcriptomic, proteomic, and single-cell datasets further reduces the likelihood that this observation reflects dataset-specific bias. Protein stability predictions further indicate that ENTPD2 is not intrinsically unstable. ProtParam analysis estimated a half-life of approximately 30 h in mammalian systems and an instability index below the threshold for unstable proteins (Supplementary Table S2). Because ENTPD2 is predicted to be stable, the reduced protein levels in tumors probably reflect translational or post-translational regulation rather than rapid turnover. However, the underlying mechanisms responsible for this divergence cannot be directly determined from the current data.
Because post-transcriptional regulation is frequently mediated by miRNAs, candidate miRNAs predicted to target ENTPD2 were evaluated (Fujiwara and Yada, 2013; Guo et al., 2009). Selection of candidate regulators required consideration not only of statistical correlation but also of biological compatibility with the observed phenotype. Among the predicted miRNAs, miR-1287-5p displayed the strongest negative correlation with ENTPD2 but was downregulated in colorectal tumors, making it incompatible with a role in suppressing ENTPD2 protein abundance. In contrast, miR-708-5p exhibited tumor-associated upregulation and directionally consistent negative correlations with ENTPD2 transcripts in both colon and rectal cancer cohorts, although the correlation magnitude was modest. This pattern points to consideration of miR-708-5p as a potential regulator of ENTPD2 rather than a confirmed mechanism.
The selection of miR-708-5p as the primary candidate post-transcriptional regulator of ENTPD2 was grounded in biologically stringent criteria: concurrent tumor-associated upregulation in CRC, directional compatibility with the observed protein reduction, and the presence of a high-confidence 7mer-m8 binding site in the ENTPD2 3′UTR (nucleotides 316–322; TargetScan Context++ percentile score: 89) supported by CLIP-seq interaction data. The weak but directionally consistent negative correlation between miR-708-5p and ENTPD2 transcript levels in clinical datasets (r = −0.086, p = 0.069) is interpretable in light of the mechanistic complexity of miRNA-mediated regulation. Transcript-level correlations alone may not fully capture functional miRNA-target interactions, particularly when translational repression contributes substantially to the regulatory effect. Canonical miRNA activity involves both translational repression and mRNA destabilization, with the relative contribution of each pathway varying by target and cellular context (Guo et al., 2009). When translational repression predominates, the effect on steady-state mRNA levels may be modest, while protein suppression can be substantial. The experimental data presented here are fully consistent with this interpretation: in HCT116 cells, miR-708-5p overexpression reduced ENTPD2 mRNA by approximately 50% and protein by approximately 59%. In HT-29 cells, protein abundance decreased by approximately 47%, indicating a comparable degree of suppression across both cell lines. The larger reduction at the protein level relative to the mRNA level further supports a contribution of translational repression in addition to transcript destabilization.
Functional validation through dual-luciferase reporter assays yields direct mechanistic evidence for the miR-708-5p-ENTPD2 interaction. The ∼50% reduction in luciferase activity conferred by the WT ENTPD2 3′UTR construct upon miR-708-5p mimic transfection, and the complete abrogation of this effect upon seed-sequence mutation, fulfills the canonical criteria for a direct and sequence-specific miRNA-target interaction (Agarwal et al., 2015). In HCT116 cells, miR-708-5p overexpression reduced ENTPD2 protein by ∼59%. This directionally matches the lower ENTPD2 protein abundance observed in CPTAC tumor tissues relative to normal tissues (Fig. 2A), although exact fold-change comparison is limited because the CPTAC and cell-line datasets represent independent experimental systems. The concordant findings across HCT116 and HT-29 cells—two cell lines representing distinct molecular backgrounds (microsatellite instable vs. microsatellite stable CRC)—reduce the likelihood of cell line-specific artifacts and strengthen the biological relevance of this regulatory interaction across different CRC molecular contexts. The biological context of miR-708-5p in CRC merits careful consideration. While miR-708-5p has been characterized as a tumor suppressor in certain malignancies through targeting of oncogenic pathways, its role in CRC is context-dependent and has been reported as both tumor-suppressive and oncogenic depending on the target gene examined. Specifically, in CRC, miR-708 has been shown to target ZEB1, thereby inhibiting epithelial-to-mesenchymal transition (EMT) through the Akt/mTOR pathway (Sun et al., 2019). Moreover, long non-coding RNA MEG3 has been reported to sponge miR-708 to regulate cancer stem cell properties in intestinal tumorigenesis (Zhang et al., 2021). The upregulation of miR-708-5p observed in the present clinical datasets—which is associated with poorer survival outcomes (HR = 1.55, p = 0.029)—suggests that in the specific context of ENTPD2 regulation, miR-708-5p may function within a broader oncogenic network, potentially through modulation of ENTPD2-associated extracellular nucleotide signaling pathways. This interpretation merits investigation in future functional studies.
The functional consequences of the observed ENTPD2 transcript-protein divergence have potential implications for tumor–immune interactions in CRC. In HCC, Chiu et al. demonstrated that ENTPD2 overexpression on cancer cells converts extracellular ATP to 5′-AMP, which sustains the immunosuppressive myeloid-derived suppressor cell (MDSC) pool by blocking MDSC differentiation, and that ENTPD2 inhibition restored sensitivity to immune checkpoint blockade (Chiu et al., 2017). More recently, Shi et al. reported that tumor-derived exosomal ENTPD2 impairs CD8+ T cell cytotoxic function in colon cancer through ATP-adenosine metabolic reprogramming, and that serum exosomal ENTPD2 levels correlate positively with advanced TNM stage and negatively with tumor-infiltrating CD8+ T cell abundance (Shi et al., 2024). Together, our findings from related cancer contexts suggest that in CRC, the elevated transcription of ENTPD2 in malignant epithelial cells, as confirmed by single-cell transcriptomic data in our study, may represent a transcriptional activation that is largely counteracted at the protein level by miR-708-5p and potentially other post-transcriptional mechanisms. Reduced intracellular ENTPD2 protein in tumor tissues does not necessarily mean lower extracellular activity. A secreted or exosomal fraction may still contribute to the functional pool, as reported (Shi et al., 2024). This distinction has important implications for biomarker development and therapeutic targeting: tissue proteomic measurements may underestimate the functional ENTPD2 activity in the extracellular compartment.
Other mechanisms may also contribute to the observed divergence between transcript and protein levels. Protein abundance is influenced not only by translational regulation but also by post-translational processes such as ubiquitin-mediated degradation (Dougherty et al., 2020). Recent studies indicate that ENTPD2 can be released through exosomal pathways (Shi et al., 2024). Because proteomic datasets derived from bulk tumor tissues primarily detect intracellular protein content, secretion of ENTPD2 could partially contribute to the reduced protein abundance observed in these datasets (Dragic et al., 2022; Shi et al., 2024).
Single-cell transcriptomic datasets provide additional insight into the cellular origin of ENTPD2 expression within colorectal tumors. Across multiple independent datasets, the highest transcript levels are consistently detected in malignant epithelial cells, whereas immune and stromal cell populations display minimal expression. This suggests that the elevated transcription of ENTPD2 identified in bulk tumor analyses primarily reflects expression originating from tumor cells rather than from infiltrating immune populations.
Associations between ENTPD2 expression and immune-related molecular features were also observed. Weak negative correlations were identified between ENTPD2 and selected immune checkpoint molecules, and functional enrichment suggested associations with antigen processing and TLR (Toll-Like Receptor) signaling pathways. Tumors with higher ENTPD2 expression tended to exhibit lower expression of several immune checkpoint molecules, although the observed correlations were moderate. Pathway enrichment analyses further suggested associations with antigen processing and presentation pathways as well as signaling pathways related to toll-like receptor activation (Supplementary Fig. S2).
The divergence between transcript abundance and protein expression also has implications for biomarker development. The association between higher ENTPD2 transcript levels and shorter relapse-free survival indicates that transcriptional measurements capture clinically relevant information despite reduced protein abundance in tumor tissues. These observations highlight the importance of evaluating multiple molecular layers when assessing candidate biomarkers in cancer (Catalano et al., 2025; Demir Karaman and Işık, 2023).
Several limitations of our study warrant acknowledgment. Transcriptomic and proteomic analyses were derived from independent but clinically comparable datasets and therefore do not represent fully matched patient samples. We validated the miR-708-5p-ENTPD2 interaction in two CRC cell lines with different molecular backgrounds, but extending this work to additional models (especially MSI-H tumors and CMS (Consensus Molecular Subtypes)-defined subtypes) would help determine how broadly these findings apply across the molecular spectrum of CRC. CMS subtype-stratified analysis of ENTPD2 expression was not performed in this study and represents a direction for future investigation. The present study employed gain-of-function transfection of synthetic miR-708-5p mimic; complementary loss-of-function experiments using inhibitors in cell lines with endogenous miR-708-5p expression would strengthen causal inference and better approximate the regulatory dynamics in clinical tissues. Additionally, while proteomic data from CPTAC provide evidence of reduced intracellular ENTPD2 protein abundance in bulk tumor tissue, these measurements do not capture potential contributions of extracellular or exosomal ENTPD2 to the functional pool of the enzyme in the tumor microenvironment (Shi et al., 2024); future studies incorporating secretome analysis and measurement of ectoenzyme activity in conditioned media would address this limitation. Finally, the moderate correlation between miR-708-5p and ENTPD2 transcript levels in clinical datasets, together with the incomplete suppression of luciferase activity (∼50% reduction) observed in reporter assays, suggests that additional post-transcriptional regulators—including other miRNAs, RNA-binding proteins, and epitranscriptomic modifications such as m6A—likely contribute to the overall transcript-protein divergence of ENTPD2 in CRC and represent important avenues for future investigation. Future studies could also incorporate protein-protein interaction network analyses (e.g., STRING) to further contextualize the role of ENTPD2 within broader regulatory networks in CRC.
In conclusion, our findings indicate that ENTPD2 is transcriptionally upregulated in CRC despite reduced protein abundance and support a contribution of miR-708-5p to post-transcriptional regulation of ENTPD2 through a direct 3′-UTR interaction. These results expand current understanding of ENTPD2 regulation in CRC and highlight the importance of integrating multiple molecular layers for accurate characterization of tumor biology. The clinical relevance of the ENTPD2 transcript-protein axis in CRC warrants further investigation in prospective and mechanistic studies.
Author’s Contributions
L.A.D.: Conceptualization, data curation, formal analysis, investigation, methodology, software, validation, visualization, writing—original draft, writing—review & editing.
Data Availability
All datasets analyzed in this study are publicly available from established online resources. Transcriptomic and clinical data were obtained from The Cancer Genome Atlas (TCGA) and GTEx projects through the UALCAN and GEPIA2 platforms. Proteomic data were retrieved from the Clinical Proteomic Tumor Analysis Consortium (CPTAC) via UALCAN. miRNA expression and interaction data were obtained from the ENCORI (starBase) database, and miRNA target predictions were evaluated using TargetScan. Single-cell transcriptomic datasets were analyzed using the TISCH2 database. We performed the functional pathway enrichment analysis using Enrichr with the Reactome pathway database. Processed data supporting the findings of this study are available from the corresponding author upon reasonable request.
Ethics Approval and Consent to Participate
This study was conducted using only publicly available datasets obtained from TCGA, GTEx, CPTAC, ENCORI, GEPIA2, and TISCH2 databases and commercial cell lines (HCT116 and HT-29). No new human participants, patient samples, or animal experiments were involved. Therefore, according to institutional and international research guidelines, ethical approval, and informed consent were not required.
Footnotes
Author Disclosure Statement
The author declares no competing interests.
Funding Information
This research received no external funding.
Supplemental Material
Abbreviations Used
References
Supplementary Material
Please find the following supplemental material available below.
For Open Access articles published under a Creative Commons License, all supplemental material carries the same license as the article it is associated with.
For non-Open Access articles published, all supplemental material carries a non-exclusive license, and permission requests for re-use of supplemental material or any part of supplemental material shall be sent directly to the copyright owner as specified in the copyright notice associated with the article.