
Abstract
Background:
Sarcopenic obesity (SO), defined as the coexistence of low muscle mass and function and excessive fat mass, is increasingly recognized as a health concern in older individuals with diabetes. Despite its clinical importance, SO often remains undiagnosed in outpatient settings due to complex diagnostic requirements.
Objective:
This study aimed to investigate the risk of SO using simple screening tools, namely the SARC-F questionnaire and handgrip strength (HGS), and to identify associated clinical, functional, and metabolic factors in diabetic patients aged 50 and older.
Methods:
A cross-sectional analysis was conducted with 276 diabetic outpatients. Risk of SO was defined based on a body mass index of 30 kg/m² or more, combined with either a SARC-F score of 4 or above or low HGS values (below 35 kg for men and 20 kg for women). Data on comorbidities, functionality, falls, depression, and metabolic control were collected.
Results:
The prevalence of SO risk was 16.2% with HGS and 8.7% with SARC-F. Falls, depressive symptoms, and reduced quality of life were associated with SARC-F-based SO, while hypertension, elevated HbA1c, and lower quality of life were linked to HGS-based SO.
Conclusion:
Simple screening methods can help identify SO risk in diabetic outpatients and support timely clinical decision-making.
Keywords
Introduction
Diabetes is a chronic disease that can be accompanied with geriatric syndromes such as frailty, depression, malnutrition, sarcopenia, and polypharmacy. Moreover, in the case of diabetic complications, these conditions impair the functionality of patients and may lead to disabilities. 1 Given the progressively increasing prevalence of diabetes, it is important to recognize the factors that can inappropriately affect the duration and quality of life of these individuals with diabetes.
Sarcopenia is a clinical entity characterized by decreased muscle strength and mass and is associated with increased morbidity and mortality. Sarcopenia is frequently encountered as a risk factor for geriatric syndromes, such as functional deterioration and frailty in patients with diabetes. A decline in muscle strength is considered the earliest and most important indicator of sarcopenia. 2 According to the European Working Group on Sarcopenia in Older People (EWGSOP2) diagnostic consensus, the first step involves identifying at-risk individuals using the simple screening tool, the SARC-F questionnaire. This tool can be administered in outpatient settings without the need for clinical examination or specialized equipment. A positive result indicates a high risk of sarcopenia and necessitates further assessment of muscle strength. Handgrip strength (HGS) is the first objective measurement step in the diagnostic algorithm following risk identification. If low muscle strength is detected through this test, a diagnosis of probable sarcopenia’ is established.
According to the WHO, obesity is defined as “excessive or abnormal fat accumulation that poses a health risk.” 3 Obesity is known to be a cause of increased morbidity and mortality. Sarcopenia and obesity share many pathophysiological mechanisms and can exacerbate each other’s effects. Therefore, in recent years, a new concept, sarcopenic obesity (SO), reflecting the coexistence of sarcopenia and obesity, has been introduced in the literature. 4 SO causes a double metabolic burden resulting from low muscle mass and function (sarcopenia) with increased fat (obesity), which becomes more pronounced with aging. SO is often associated with chronic conditions such as cardiovascular disease and diabetes.4–6
Donini et al. describe a three-step process for diagnosing SO in their consensus report. 7 In accordance with the European Society for Clinical Nutrition and Metabolism (ESPEN) and European Association for the Study of Obesity (EASO) consensus (Donini et al., 2022 7 ), the diagnostic process for SO requires a sequential approach of screening, muscle strength assessment, and confirmation with body composition analysis. In this study, only the initial screening and muscle strength assessment steps were applied; therefore, our findings reflect SO risk screening rather than a confirmed diagnosis. The first step focuses on identifying individuals who may be at risk. This includes checking for signs of obesity, such as a high body mass index (BMI) or large waist circumference, along with symptoms commonly linked to sarcopenia. People might experience slower walking, trouble climbing stairs, or difficulty managing daily tasks. These functional issues are often supported by measurable declines, such as weaker HGS or reduced walking speed. Once individuals are flagged in this way, body composition is assessed to confirm both excessive fat and low muscle mass and function. The final step involves determining whether complications are present and using that to guide staging.
With rapidly increasing prevalence and its serious consequences, SO is being recognized as one of the potential serious health risks in the aging society. Even though SO is becoming more recognized, it is often overlooked in outpatient clinics. This can be due to the demanding nature of clinical practice or the complicated diagnostic procedures involved. Evaluating the risk of SO using simple parameters from the initial step of the diagnostic algorithm may help increase awareness and guide clinicians toward further assessment when appropriate. 7 In this study, we emphasize that these practical measures represent screening for SO risk only, and do not replace confirmatory diagnosis, which requires body composition assessment in addition to muscle function evaluation. 7
SO becomes increasingly prevalent after the age of 50. 8 While many studies have focused on the adverse clinical outcomes of this condition, there is still a lack of research exploring SO risk and its related factors using simple and practical methods in individuals with diabetes. According to current diagnostic consensus, BMI, used as an obesity screening measure, along with low HGS indicating probable sarcopenia, may serve as accessible tools to screen for SO risk. In addition, a positive result on the SARC-F questionnaire among individuals with high BMI could also help identify those who may be at increased risk. In this study, we aimed to investigate first-step screening methods for SO risk and associated factors in diabetic patients over the age of 50, a group in which SO is notably common, within outpatient clinical settings.
Materials and Methods
Study design
This cross-sectional study was conducted between October 2019 and March 2020 with patients aged ≥50 years who applied to the Diabetes Outpatient Clinic of Endocrinology and Metabolism Division of Istanbul University, Istanbul Faculty of Medicine. Ethical approval was obtained from the Istanbul Faculty of Medicine, Clinical Research Ethics Committee (no. 27.09.2019/1184). Written voluntary consent was obtained from all patients after they were informed about the study before participation. Patients were excluded from the study if they did not provide consent, had cooperation issues or advanced-stage dementia, or had a physical condition that prevented the measurement of HGS. Additionally, individuals with malignancy, end-stage kidney disease, advanced hepatic failure, who required protein or nutritional support within the past 3 months, or those unable to visit the clinic independently or walk were also excluded. Subjects who agreed to participate in the study were included consecutively. The study was conducted in accordance with the ethical criteria of the Helsinki Declaration. 9 We included patients in the study in 2019–2020. We recruited patients in accordance with the previous version of the 2024 criteria.
Patients data collection
A survey was applied to all participants via face-to-face interviews. Demographic data included gender, age, education, marital status, smoking and alcohol habits, history and falls history, urinary incontinence, and weight loss during the last 3 months. Concomitant diseases and medications were noted on a patient record form. Using five or more types of medications was accepted as polypharmacy. Glycosylated hemoglobin A1c (HbA1c) and serum creatinine levels as well as diabetes duration, insulin treatment were recorded from the patient files. The participants with an HbA1c value was ≤7.5% (58 mmol/mol) were considered to have an acceptable diabetes control.
Anthropometric measurements
All anthropometric measurements were performed by the same researcher. After measuring body weight in kilograms and height in meters, BMI (kg/m2) was calculated.
Sarcopenia screening and measurement of muscle strength
The SARC-F questionnaire is used for the screening of sarcopenia. 2 SARC-F is a five-item questionnaire reported by patients. Responses are based on the patient’s perception of limitations regarding strength, walking ability, getting up from a chair, climbing stairs, and falling. A score of ≥4 is considered significant for sarcopenia screening. 10 HGS is quick, simple, and cheap to perform in outpatient clinic conditions. A low HGS is considered probable sarcopenia. In this study, in light of the EWGSOP-2 Sarcopenia Consensus Report and the Turkish population study, values of <35 kg in men and <20 kg in women were recorded as low HGS.2,11 The participant was asked to perform the most vigorous squeeze with a hydraulic hand dynamometer (Jamar® hand dynamometer, Sammons Preston) while sitting on a chair, the arm next to the body, the elbow in 90° flexion, and the wrist in a neutral position. Three measurements were taken from the dominant hand while resting, and the highest value was recorded.
Screening risk of sarcopenic obesity
HGS-based SO risk was defined as the coexistence of probable sarcopenia (determined by HGS below the lower cutoff point according to EWGSOP-2) and obesity (BMI ≥ 30 kg/m²). Individuals with a high BMI and a positive SARC-F score (≥4 points) were considered to have SARC-F-based SO risk.1,12,13
Frailty, functionality, nutritional status, depressive mood assessment, and health-related quality of life
Frailty was assessed using the FRAIL questionnaire, with scores of 0 indicating normal, 1–2 prefrailty, and 3–5 frailty. 14 Functional status was evaluated using Katz’s Activities of Daily Living (ADL) and Lawton and Brody’s Instrumental Activities of Daily Living (IADL) questionnaires, where the ADL total score ranges from 0 to 6, and the IADL total score ranges from 0 to 8, with higher scores indicating greater independence.15,16 Nutritional status was evaluated using the Mini Nutritional Assessment-Short Form (MNA-SF), with scores below 12 indicating nutritional problems. 17 Depressive mood was measured using the Geriatric Depression Scale-Short Form (GDS-SF), where scores of 5 or higher indicating significant depressive symptoms. 18 We utilized the EuroQoL 5-Dimension Questionnaire (EQ-5D) to assess participants’ health-related quality of life. The EuroQoL 5-Dimension Questionnaire (EQ-5D) is a questionnaire that assesses health-related quality of life, typically scored with 3 or 5-level responses on five dimensions. Higher scores indicate better health status. 19
Statistical analysis
Min-max control was performed on the data. Continuous variables were expressed as mean ± standard deviation (SD) and categorical variables as n and percentage (%). We used Student t test or its nonparametric equivalent Mann–Whitney U test to determine the differences between continuous variables. The chi-square (χ2) statistics or Fisher exact test was used for differences between categorical variables. We constructed two logistic regression models to identify variables associated with the probability of SO based on SARC-F and HGS. We reported the results as odds ratios (ORs), 95% confidence intervals (CIs), and significance levels (P < 0.05). The sample size was not powered to estimate population-level prevalence of SO; prevalence data are descriptive and should be interpreted with caution. Analyses were performed using IBM Statistical Packages of Social Sciences software (version IBM SPSS 21.0, SPSS Inc., Chicago, IL). We determined the sample size pragmatically based on the number of eligible patients during the study period and did not perform a formal a priori power analysis. This decision may slightly limit the strength of some conclusions, especially in subgroup comparisons.
Results
The demographic and clinical characteristics of participants by gender are presented in Table 1. Compared with women, men had significantly lower mean BMI; a higher rate of high school or university graduation; a higher likelihood of being married, smoking, and alcohol consumption; and a lower prevalence of osteoporosis. In addition, male participants had higher mean HGS and MNA-SF scores, whereas they had lower mean FRAIL, SARC-F, GDS-SF, and EQ5-D scores. Urinary incontinence, probable sarcopenia, and obesity were significantly more common in women.
Demographic and Clinical Characteristics of Study Participants by Genders
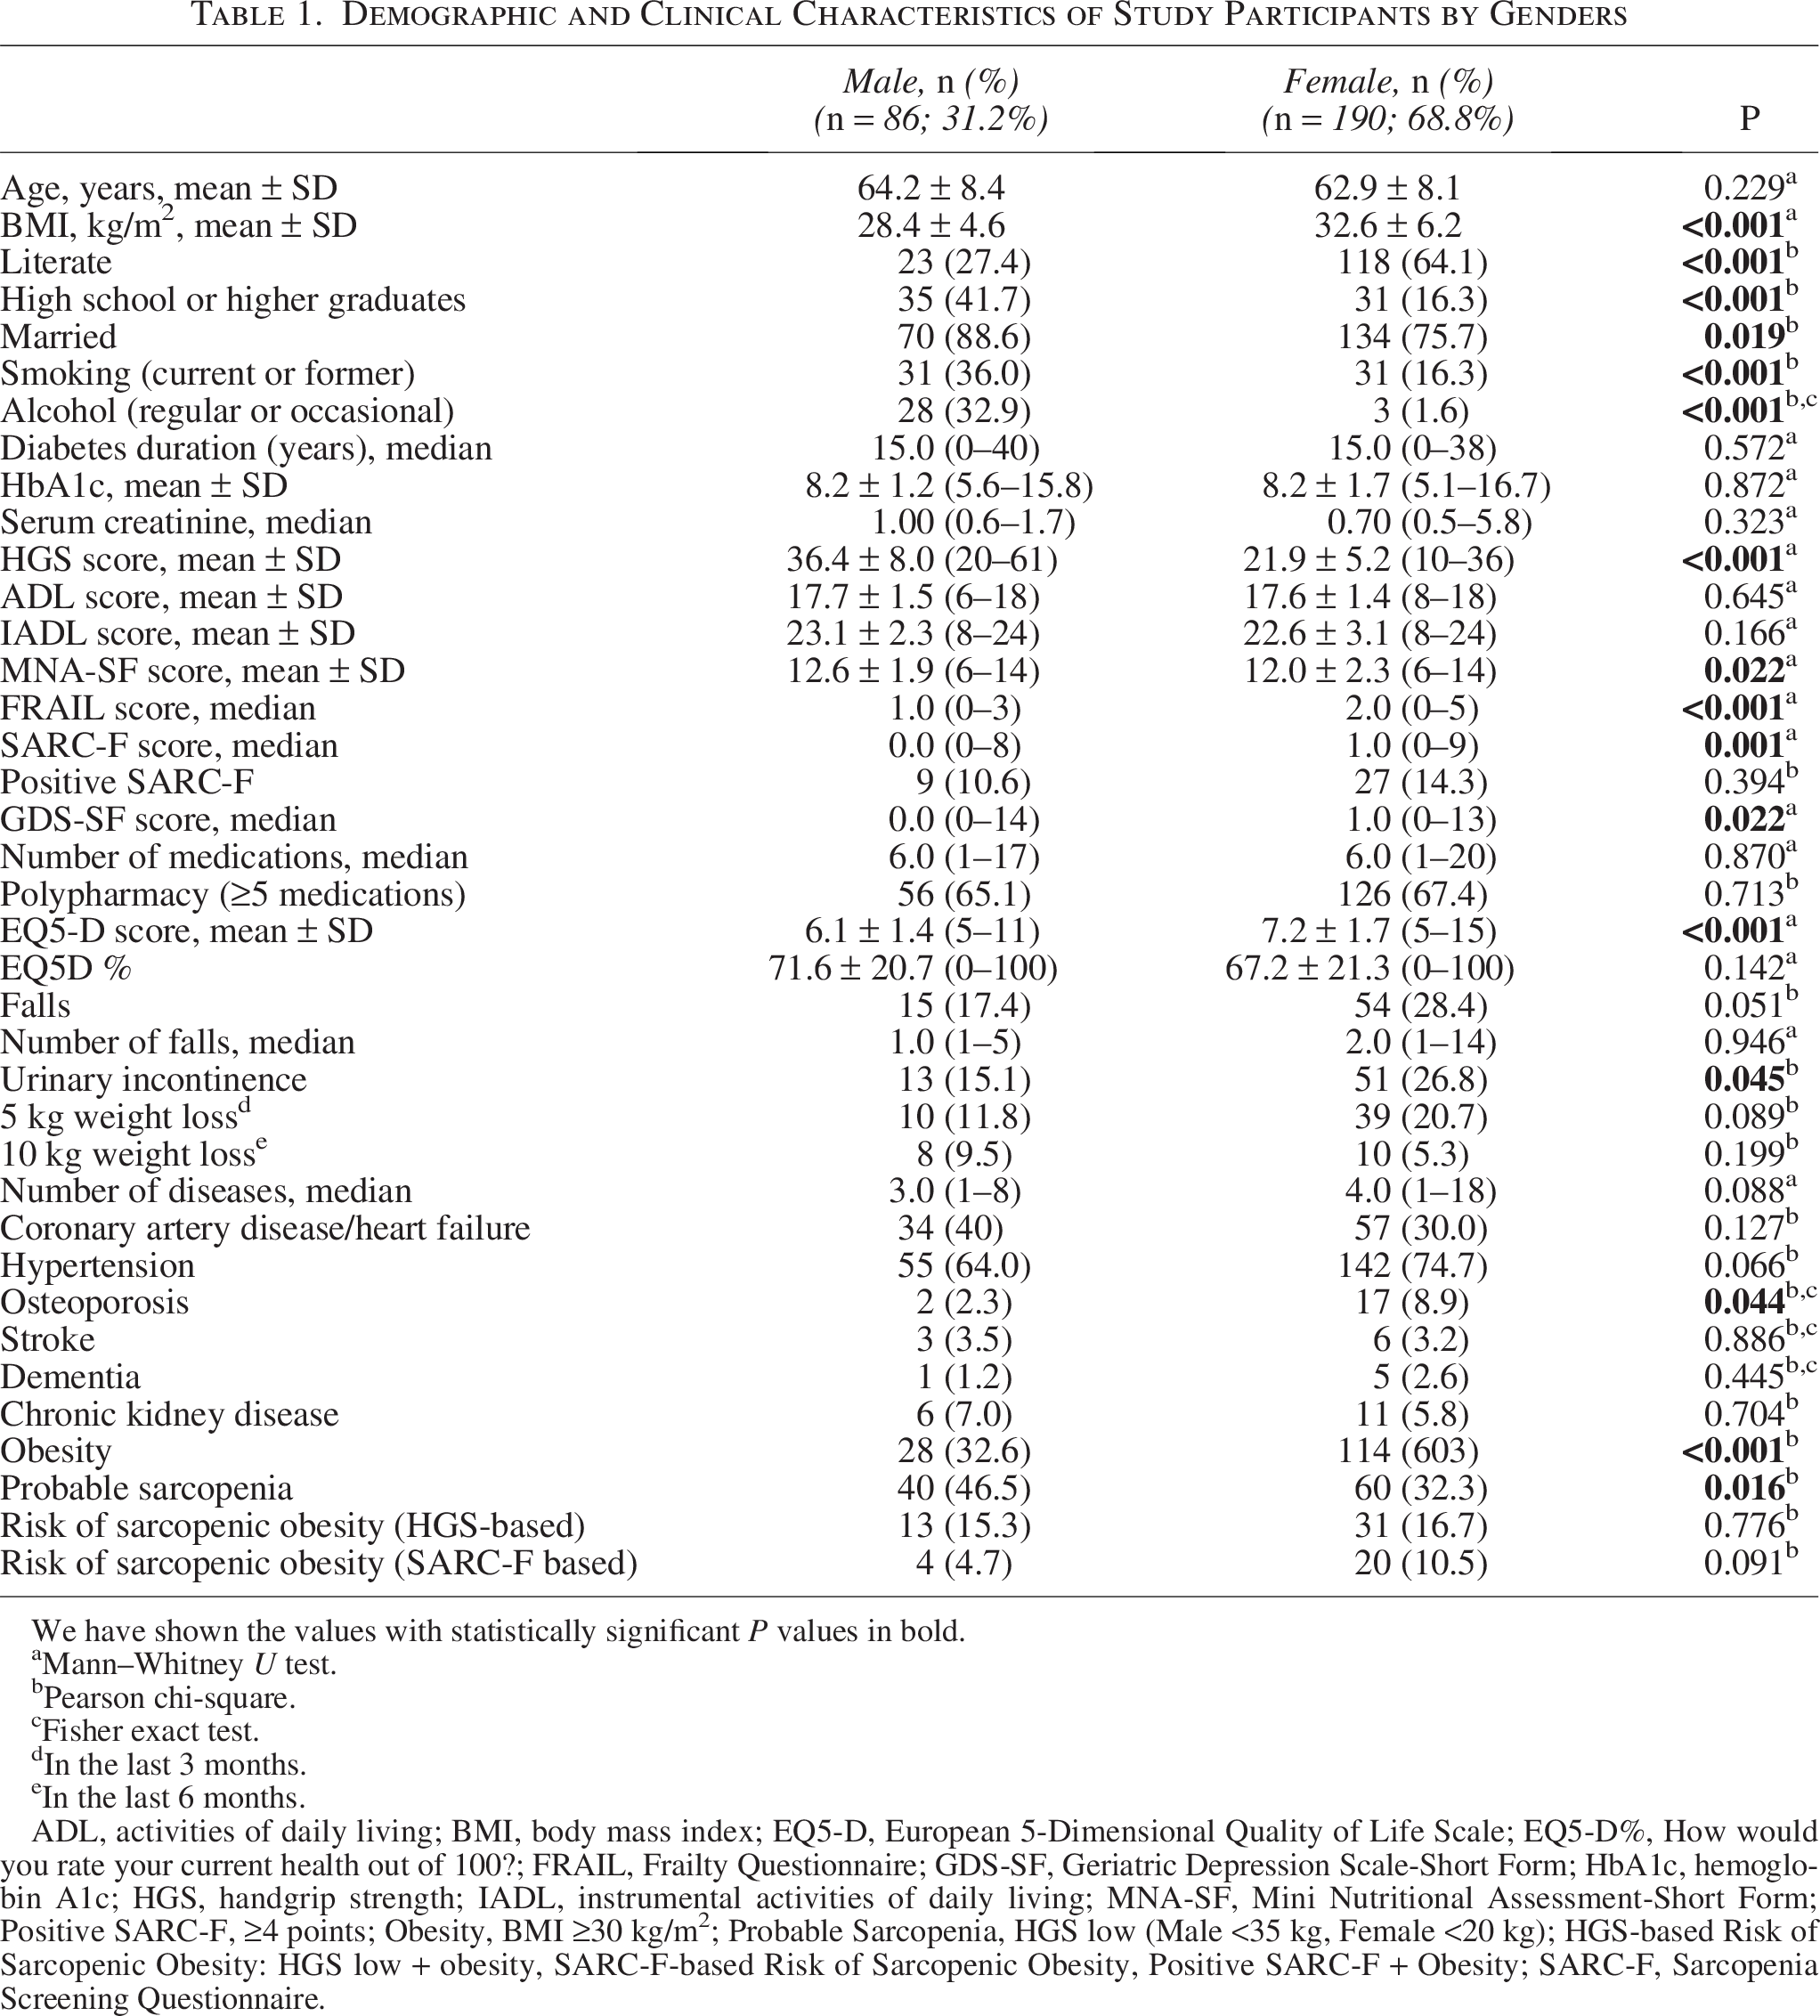
We have shown the values with statistically significant P values in bold.
Mann–Whitney U test.
Pearson chi-square.
Fisher exact test.
In the last 3 months.
In the last 6 months.
ADL, activities of daily living; BMI, body mass index; EQ5-D, European 5-Dimensional Quality of Life Scale; EQ5-D%, How would you rate your current health out of 100?; FRAIL, Frailty Questionnaire; GDS-SF, Geriatric Depression Scale-Short Form; HbA1c, hemoglobin A1c; HGS, handgrip strength; IADL, instrumental activities of daily living; MNA-SF, Mini Nutritional Assessment-Short Form; Positive SARC-F, ≥4 points; Obesity, BMI ≥30 kg/m²; Probable Sarcopenia, HGS low (Male <35 kg, Female <20 kg); HGS-based Risk of Sarcopenic Obesity: HGS low + obesity, SARC-F-based Risk of Sarcopenic Obesity, Positive SARC-F + Obesity; SARC-F, Sarcopenia Screening Questionnaire.
Risk of SO, defined by the SARC-F questionnaire, was present in 8.7% of participants (Table 2). Individuals with risk of SO assessed by SARC-F had significantly lower mean HGS (P < 0.001) and MNA-SF (P = 0.001) scores compared to those without risk of SO. While mean functional measures including ADL and IADL (P < 0.001 for both) were significantly lower, the mean FRAIL and GDS-SF scores were markedly higher (P < 0.001 for both) in participants with risk of SO based on SARC-F. They also had higher rates of hypertension (P = 0.006), urinary incontinence (P = 0.025), and polypharmacy (P = 0.005). In addition, the EQ5-D scores were significantly worse among individuals with risk of SO evaluated with SARC-F (P < 0.001).
Comparison of Participants With and Without Risk of Sarcopenic Obesity According to SARC-F Questionnaire
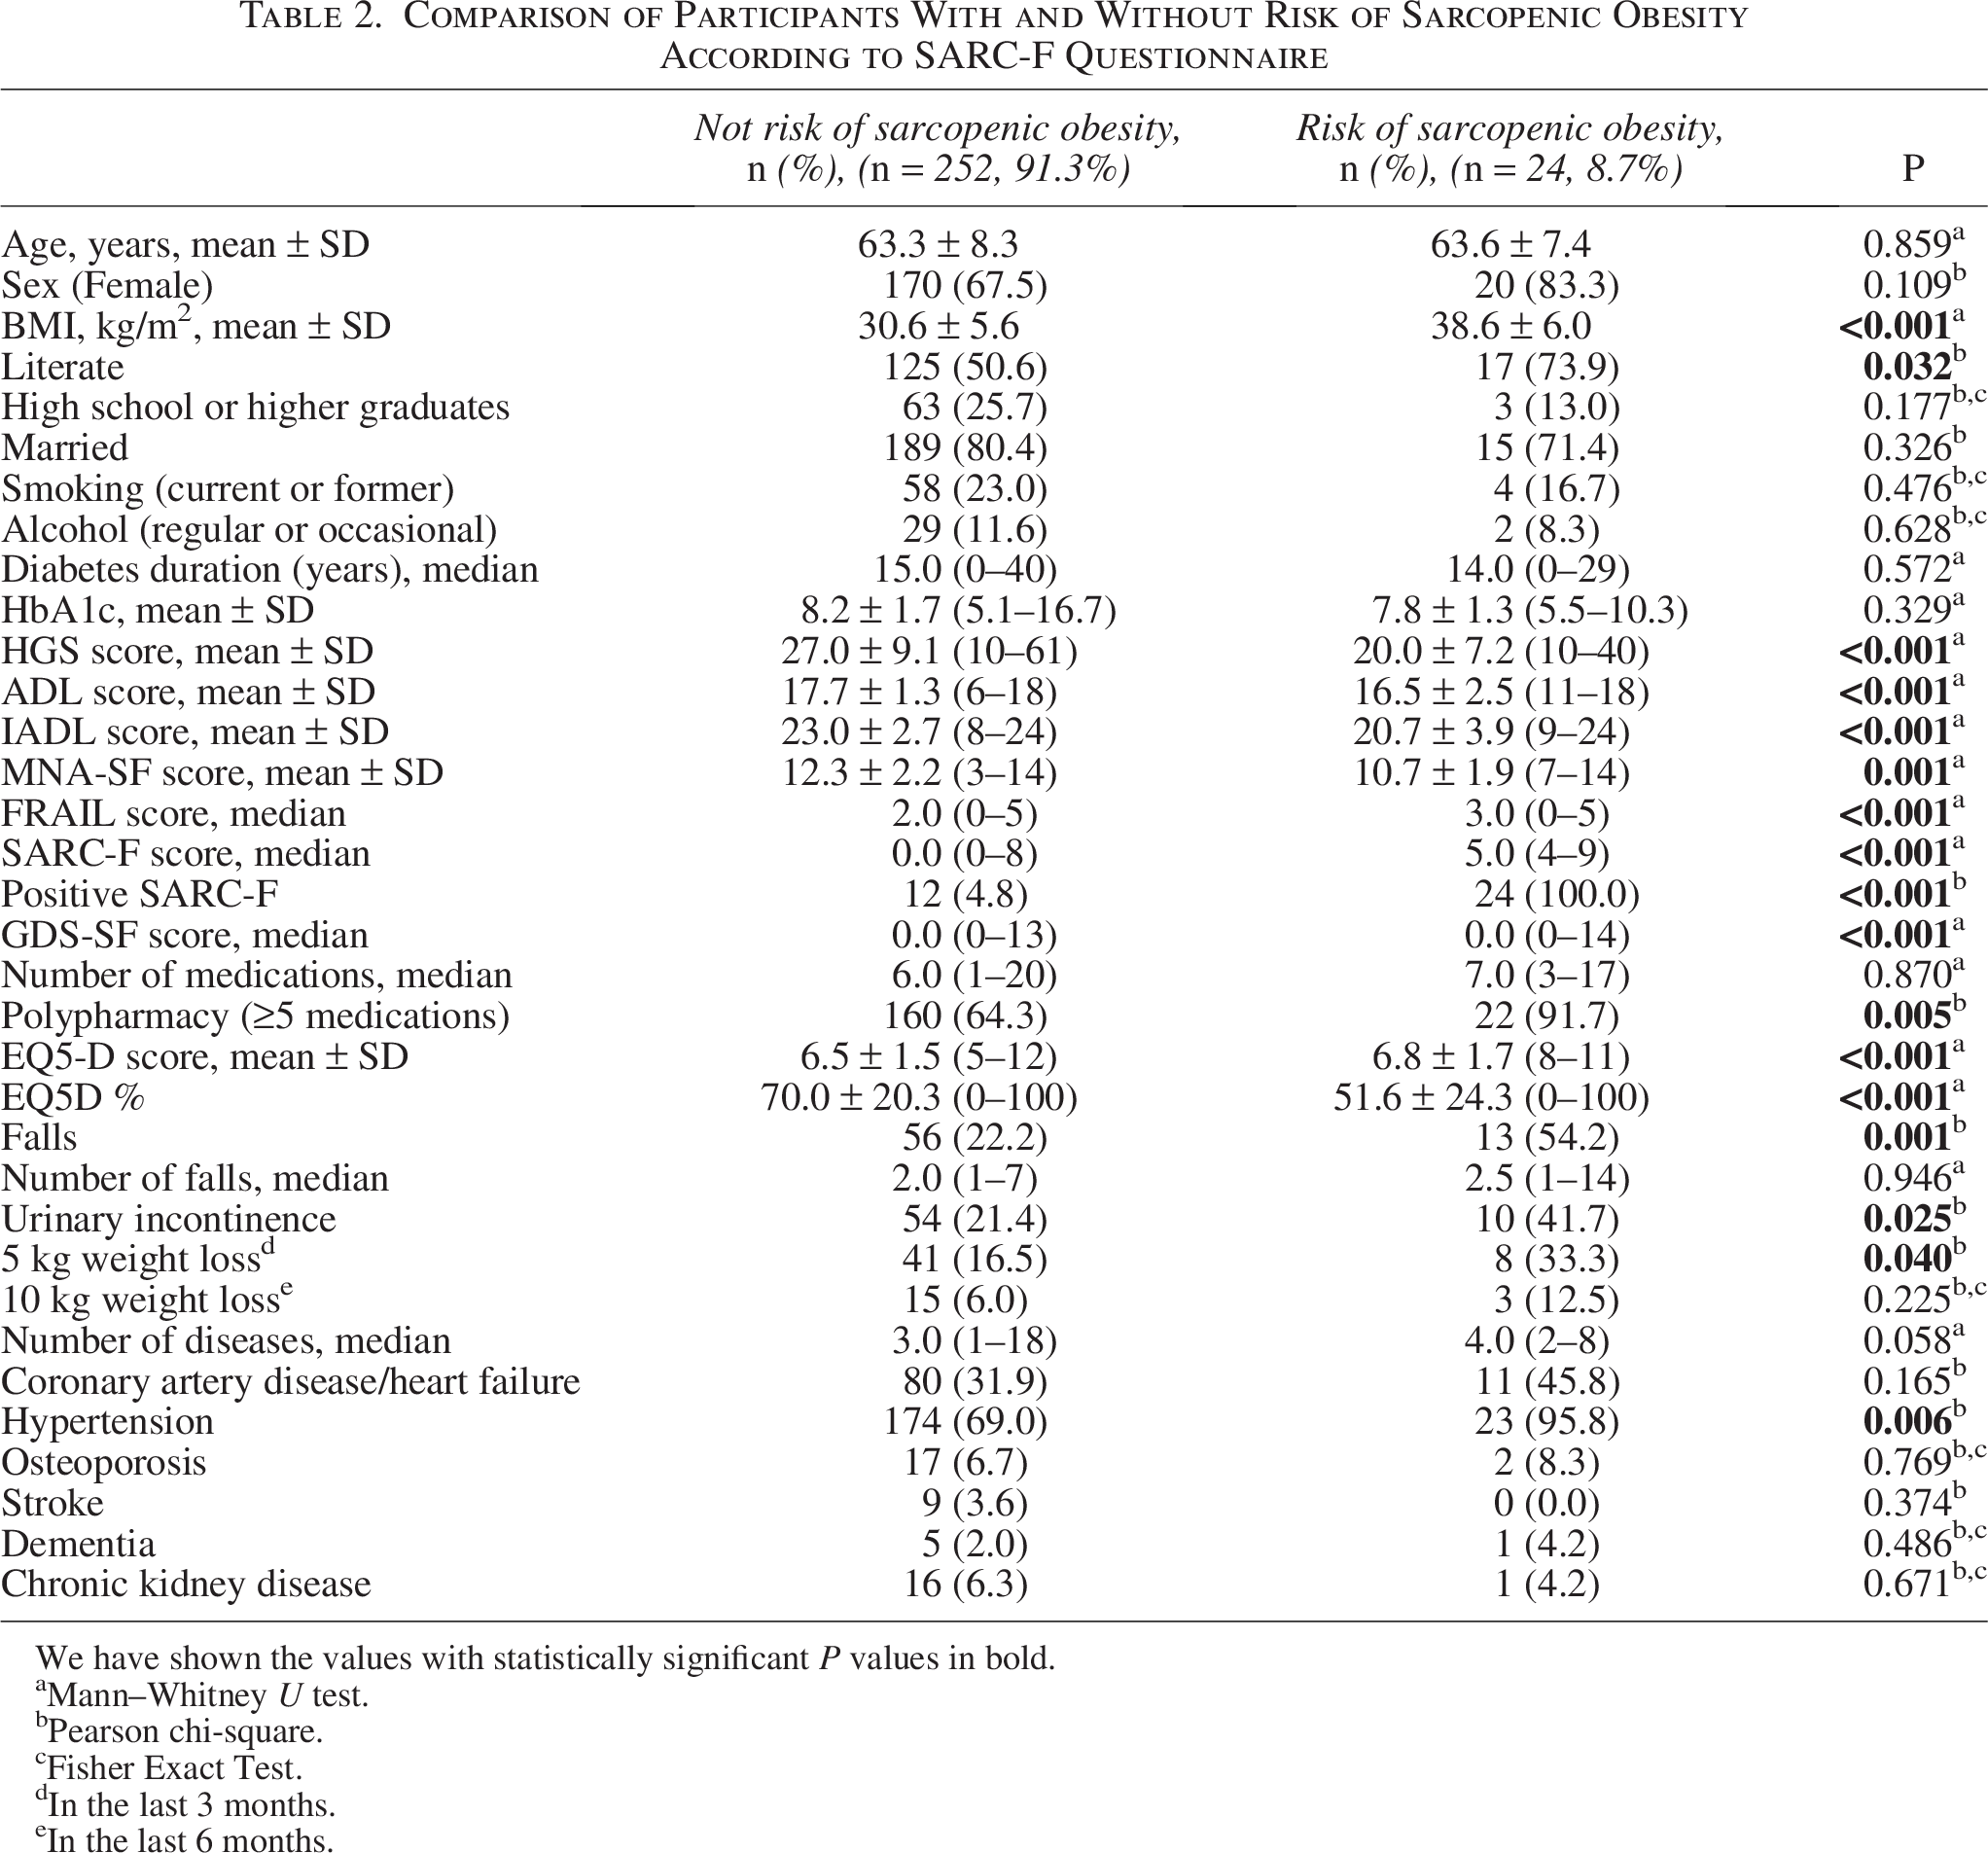
We have shown the values with statistically significant P values in bold.
Mann–Whitney U test.
Pearson chi-square.
Fisher Exact Test.
In the last 3 months.
In the last 6 months.
We built a multivariate logistic regression model to identify significant factors for risk of SO as defined by SARC-F. We found that the probability of SO risk and falls were associated with a 17.1-fold increase (P = 0.003). It was revealed that each unit of deterioration in the EQ5-D score increased the probability of SO risk identified by SARC-F by 2.9 times (P = 0.004). Additionally, higher GDS-SF scores were significantly associated with increased risk of SO based on SARC-F (P = 0.032) (Table 3).
Multivariate Logistic Regression Model for Clinical Characteristics Associated with Sarcopenic Obesity Risk According to the SARC-F Questionnaire
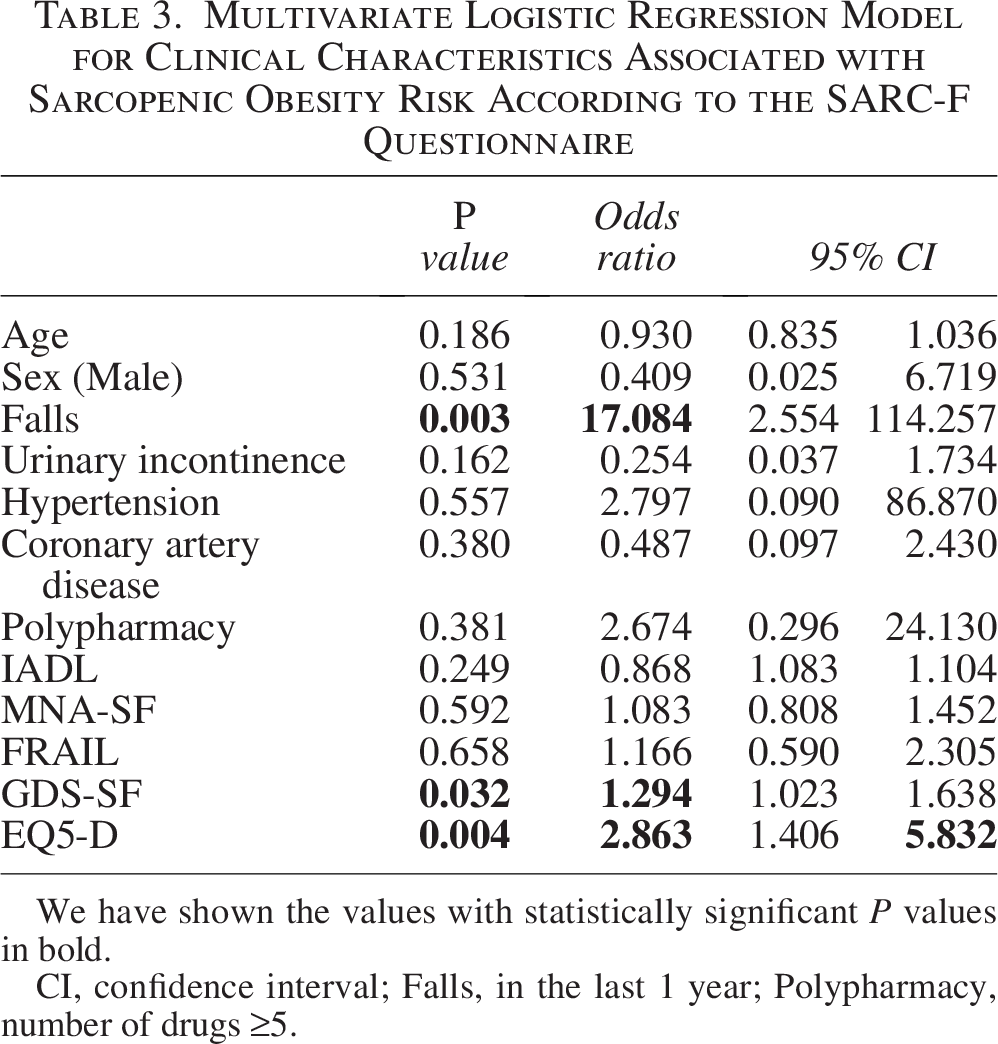
We have shown the values with statistically significant P values in bold.
CI, confidence interval; Falls, in the last 1 year; Polypharmacy, number of drugs ≥5.
HGS-based risk of SO analyses revealed that 16.2% of participants had a risk of SO. Patients with risk of SO via HGS were significantly older (65.8 ± 7.7 vs. 62.8 ± 8.1 years, P = 0.029) and had lower mean HGS scores (20.2 ± 7.6 vs. 27.6 ± 9.0, P < 0.001). Risk of SO classified by HGS patients also had significantly worse EQ5-D scores (P < 0.001). Hypertension (P < 0.001), falls (P = 0.043), and polypharmacy (P = 0.002) were also more prevalent in the risk of SO by HGS (Table 4).
Comparison of Participants With and Without Sarcopenic Obesity Risk According to HGS
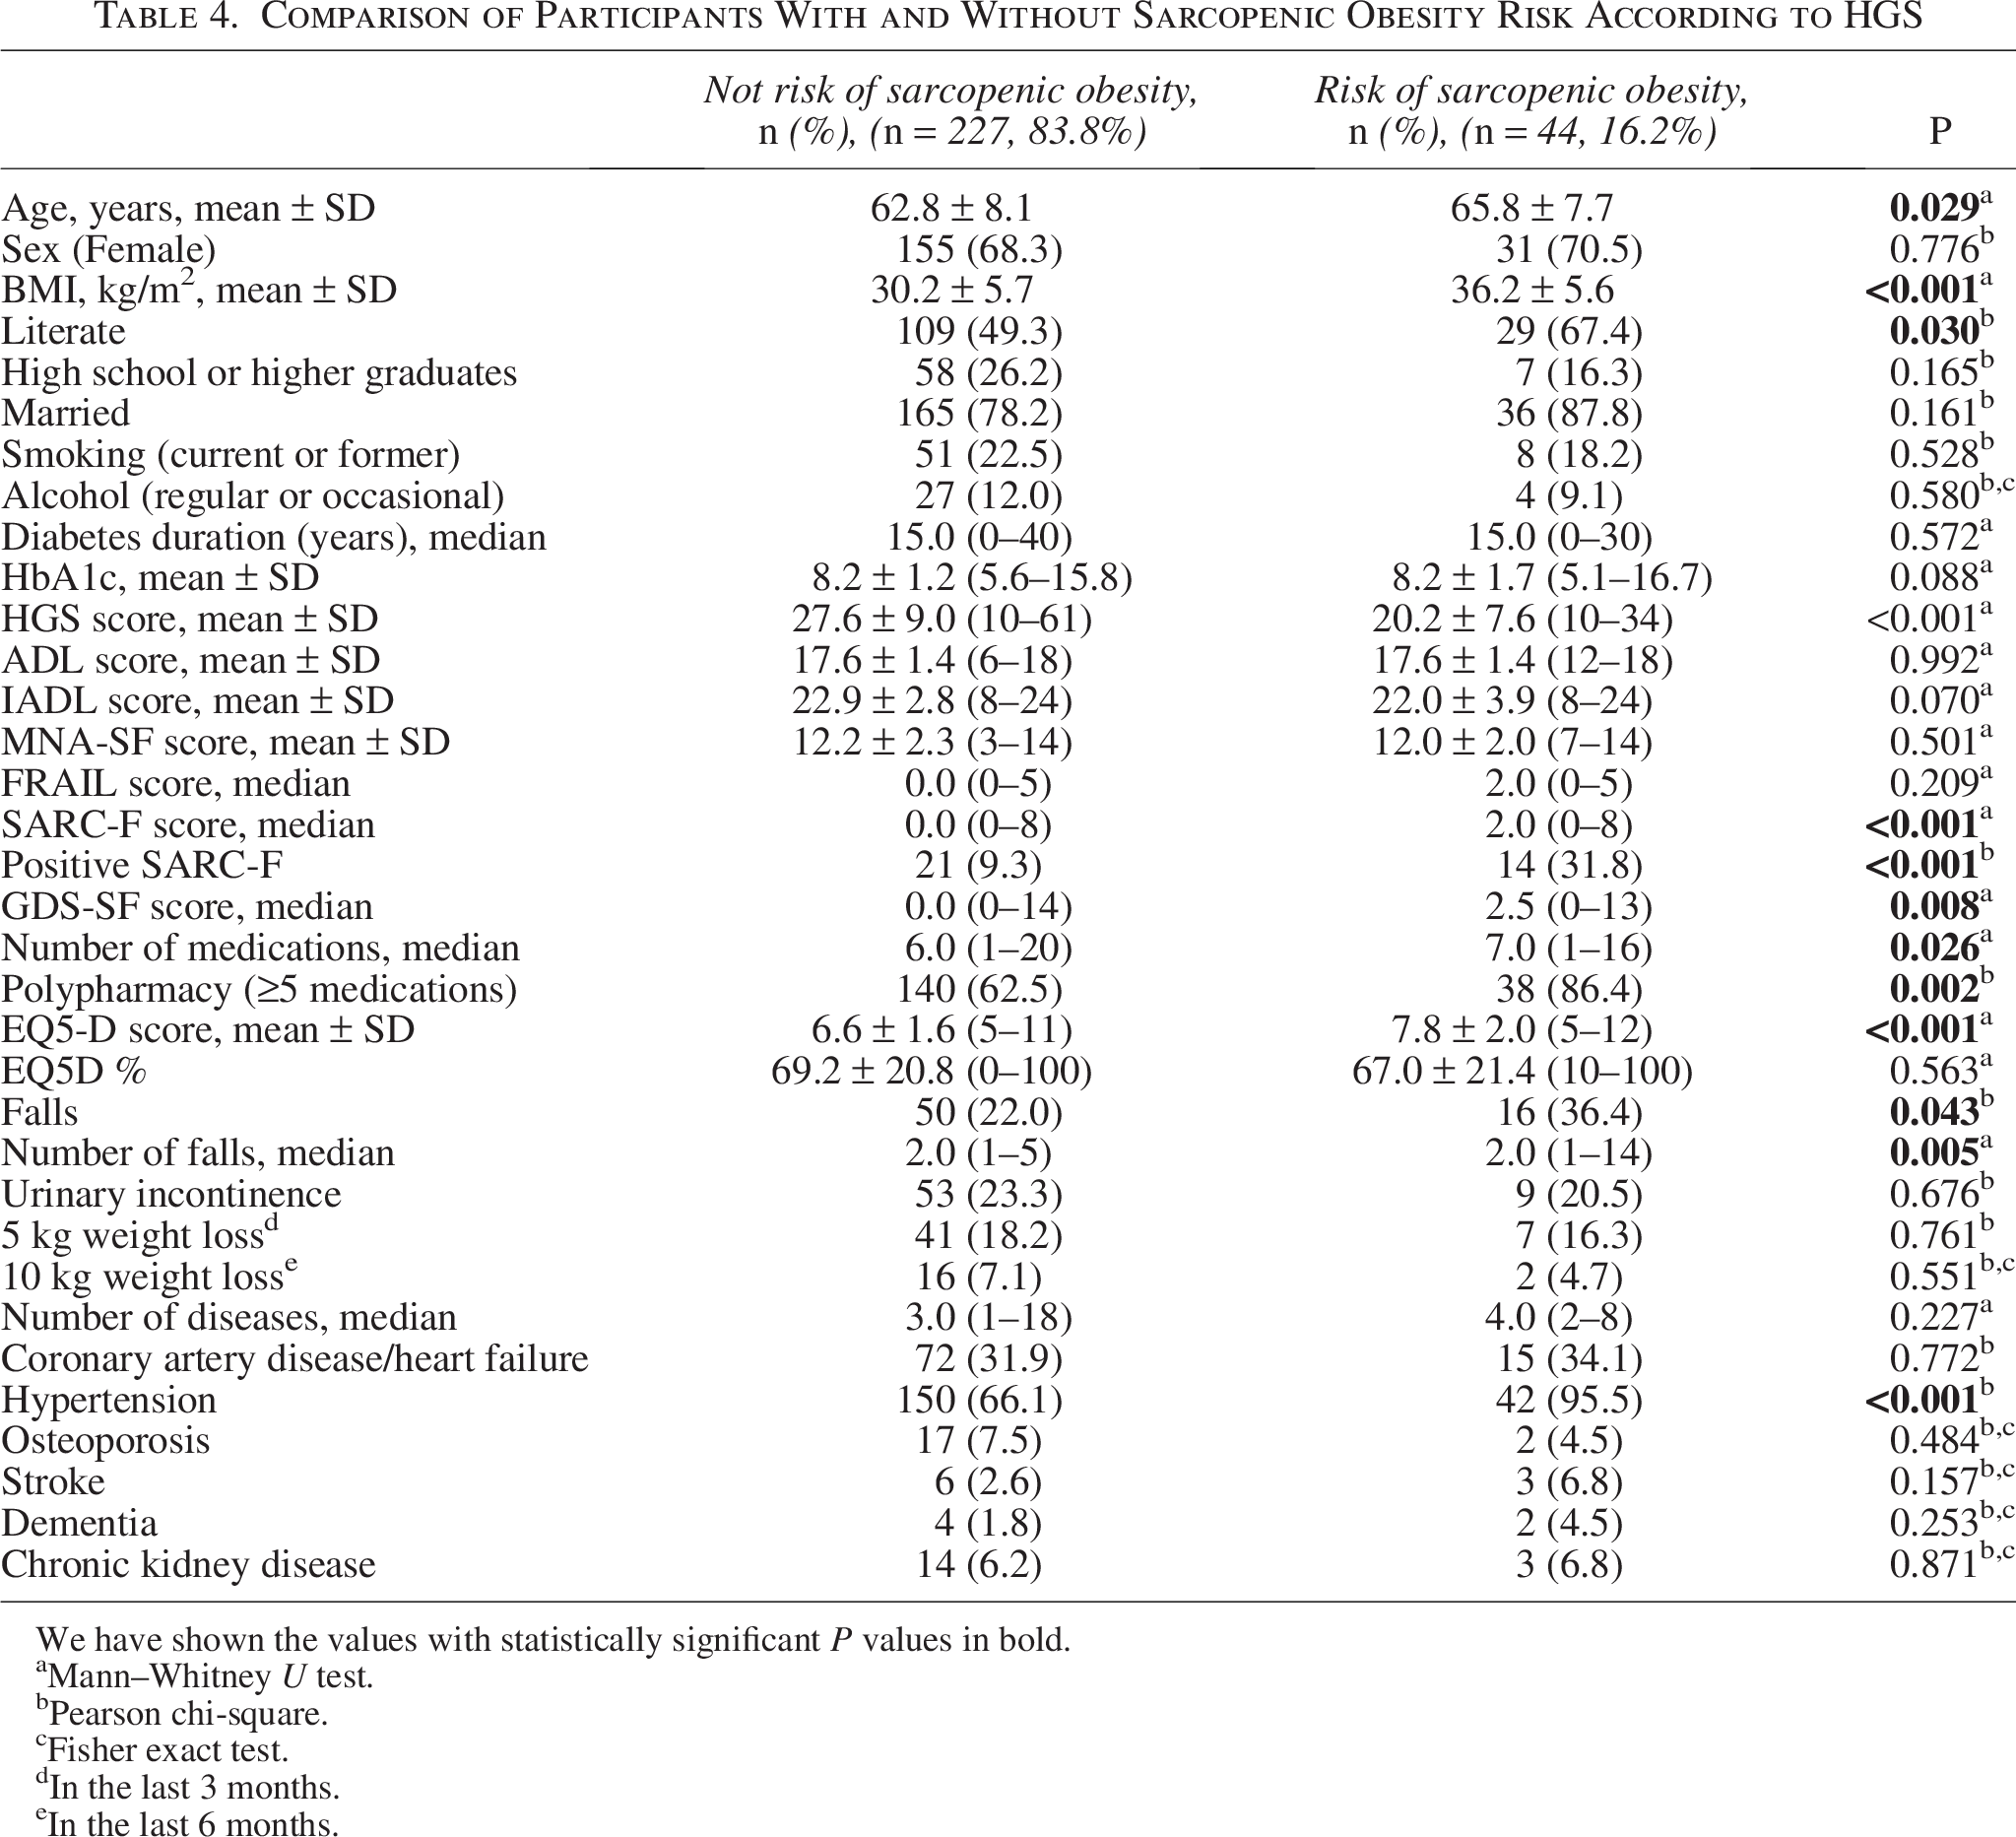
We have shown the values with statistically significant P values in bold.
Mann–Whitney U test.
Pearson chi-square.
Fisher exact test.
In the last 3 months.
In the last 6 months.
A multivariate logistic regression model constructed to identify significant variables of SO risk based on HGS showed that each one-unit increase in HbA1c % was associated with a 1.3-fold increase in the likelihood of SO risk (P = 0.021). The presence of hypertension was associated with a 6.3-fold increase (P = 0.022), while each one-unit worse EQ5-D score was linked to a 1.3-fold increase (P = 0.044) (Table 5).
Multivariate Logistic Regression Model for Clinical Characteristics Associated With Sarcopenic Obesity Risk According to Handgrip Strength
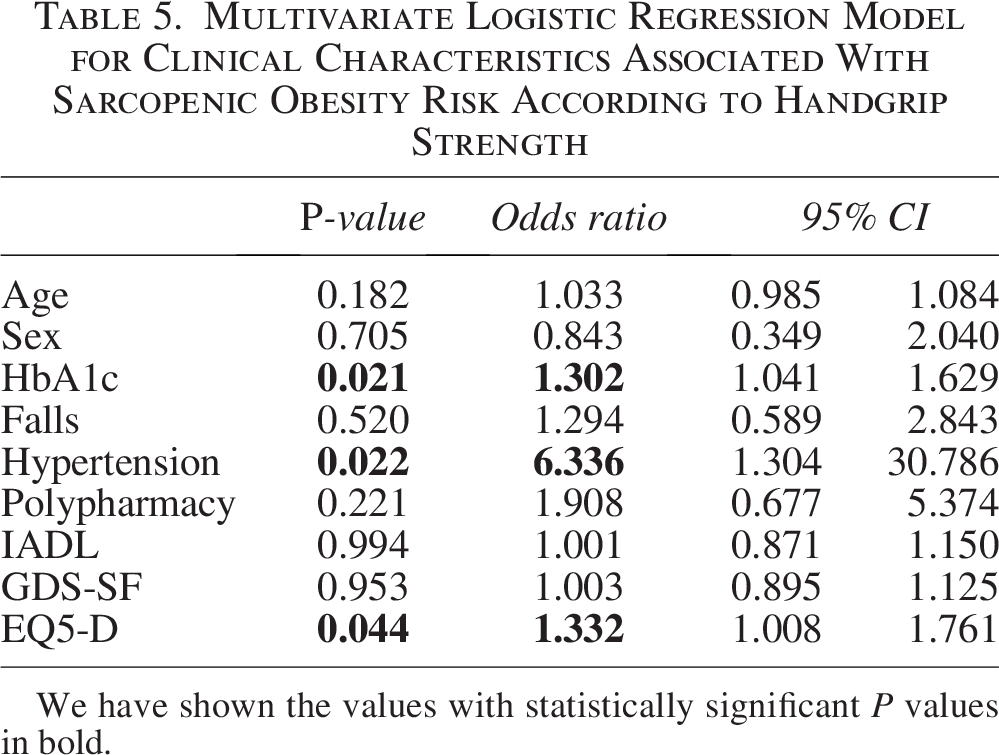
We have shown the values with statistically significant P values in bold.
Discussion
This study investigated the prevalence of SO risk and its associated factors in patients with diabetes aged 50 years and older, by screening for SO risk using the SARC-F questionnaire and HGS measurements in an outpatient setting. In individuals with diabetes, the risk of SO has more severe consequences for functional status and comorbidities than either sarcopenia or obesity alone. Therefore, the significant burden of SO risk on public health also appears to be represented in the risk of SO.1,3,20 Practical approaches of SO risk are not frequently included in the literature.
When direct assessment of muscle mass is not feasible, it is commonly preferred in clinical settings as a fast and practical measurement tool. Although bioelectrical impedance analysis (BIA) or more comprehensive methods are generally used in the literature, such advanced measurements may not be applicable in every outpatient clinic. Researchers chose the SARC-F tool and HGS for practical and rapid evaluation of SO risk in outpatient clinic settings; however, only a few studies have used these tools. 13 Our study contributes to research evaluating the risk of SO based on HGS and SARC-F screening.14,15 In previous reports, findings based on qualitative measurements of muscle mass, such as BIA or dual-energy X-ray absorptiometry (DXA), reported the prevalence of SO risk ranging from 4% to 12% in men and 8% to 18% in women.5,21,22 Although not a prevalence study, the HGS-based risk of SO rate in our participants was similar to that reported in the literature, likely because HGS provides an objective measure and indirectly reflects muscle mass, as seen with BIA or DXA. In contrast, the SARC-F-based risk of SO rate was slightly higher, likely due to its subjective, self-reported nature.
In our findings, the prevalence of SO risk via HGS and SARC-F was higher in women, as determined. One of the possible explanations for the high risk of SO in women in our publication data may be the high prevalence of obesity among women in our country. The obesity rate in women aged 35–60 in Turkey was found to be 35%. 23 It is also stated that obesity rates are higher in women in the perimenopausal period and may be associated with negative health outcomes. 24 Consistent with the literature, more significant age-related muscle loss in women, attributed to hormonal, biological, and lifestyle factors, has likely played a role in the higher prevalence of SO risk.5,12,22 Men generally have higher muscle mass and better muscle function, contributing to a lower risk of SO rates.
According to our results, individuals at risk of SO using the SARC-F questionnaire showed significantly higher rates of falls, urinary incontinence, hypertension, polypharmacy, and depressive symptoms. Among these factors, falls, poorer quality of life (EQ5-D) and increased GDS scores were identified as independent associates of SO risk by SARC-F. The present results emphasize the multifaceted relationship between SO risk and health outcomes in the literature. 2 The strong association between risk of SO and falls is consistent with existing literature, as decreased muscle strength and excess fat mass contribute to impaired balance and mobility limitations. 5 In the current study, the probability of SO risk via SARC-F was 17 times higher in patients with a history of falls (OR = 17.084, P = 0.003). These findings highlight the presence of an underlying risk of SO when planning fall prevention strategies.25–27 Furthermore, fall-related injuries in risk of SO patients may lead to functional decline and increased health care utilization, highlighting the need for early intervention. 26 Depressive symptoms were significantly more prevalent in risk of SO by SARC-F patients, with GDS-SF scores being notably higher (P < 0.001). In our multivariate analysis, GDS-SF was identified as an independent factor of SO risk (OR = 1.294, P = 0.032). This finding suggests that the risk of SO not only affects physical health but also has a profound adverse association on mental well-being, emphasizing the need for a holistic approach to risk of SO management. 28 Health-related quality of life, measured by EQ5-D, was significantly worse in the risk of SO via SARC-F and HGS groups and was found to be a strong independent factor of SO risk. 29 There is growing clinical evidence that SO has a detrimental association with both physical and mental well-being, often contributing to greater disability and lower satisfaction with life. 6 Our findings align with this trend, indicating a similar pattern among individuals at risk for SO. This relationship points to the potential benefit of addressing both functional limitations and psychological challenges when designing interventions for this group.
According to our data analysis, hypertension was highly prevalent in risk of SO-based HGS individuals (95.5% vs. 66.1%, P < 0.001), and it was identified as a strong independent risk factor (OR = 6.336, P = 0.022), reinforcing its role in the pathophysiology of SO risk.12,13 Higher HbA1c levels were significantly associated with an increased odds SO risk by HGS (P = 0.021, OR = 1.302), suggesting a potential link with diabetes-related metabolic dysfunction.6,22 Furthermore, lower health-related quality of life, measured by the EQ-5D score, was significantly associated with the risk of HGS-based SO (P = 0.044). 29 These findings highlight the multifactorial nature of SO risk, in which aging, metabolic factors, polypharmacy, and physical frailty contribute to increased vulnerability. 30 Targeted interventions for hypertension, glycemic control, and fall prevention may help reduce adverse health outcomes associated with the risk of SO. 31
The differences between SARC-F and HGS-based SO risk assessments arise from the difference in measurement approaches. While HGS-based risk of SO was linked to metabolic markers such as HbA1c and hypertension, SARC-F-based SO risk was more closely associated with functional limitations and depressive symptoms. SARC-F is subjective and based on self-reported functional limitations.2,10 Therefore, SARC-F is more sensitive to functional decline, depressive symptoms and risk of falls in multivariate analysis. 6 HGS is an objective measure of muscle strength and is strongly associated with quantitative entities such as metabolic dysfunction (HbA1c) and hypertension.2,10 Additionally, polypharmacy was more common in HGS-based SO risk individuals, but polypharmacy was not an independent factor in our regression analysis. So it suggests that it could be a secondary consequence. 29 We found that both SARC-F-based and HGS-based risk of SO were independently associated with poorer health-related quality of life, despite different underlying risk factors. Regardless of the assessment method, the presence of SO risk had a significant negative association on overall well-being. 29 These differences in measurement suggest why SARC-F is better at detecting disability and fall risk, whereas HGS identifies early muscle loss and metabolic risks.2,10 Although we suggested the combined use of HGS and SARC-F as a practical approach, we did not perform a combined analysis in this study. Future studies should investigate whether integrating both tools improves diagnostic accuracy or risk stratification for the risk of SO. 10
Our research has some limitations. The study’s cross-sectional design precludes evaluation of changes in risk of SO over time and the cause–effect relationships. This design also precludes any causal inference, particularly regarding the observed associations between SO risk, fall history, and metabolic parameters; prospective longitudinal studies are required to clarify these temporal relationships. In our study, we only used practical measurements that are easy to apply in the outpatient setting. This method provides great convenience for risk of SO awareness. However, advanced assessment methods such as BIA can be recommended for the verification of SO risk in clinical necessity. 27 This study assessed SO risk through screening tools (SARC-F and HGS) without body composition measurements; therefore, a definitive diagnosis could not be established, and the possibility of misclassification should be considered. In this study, practical screening tools such as HGS and the SARC-F questionnaire were used to assess the risk of SO, rather than diagnosing SO itself. However, the use of gold-standard diagnostic methods is necessary to validate the presence of SO in such cases. Future research should be designed to evaluate the validity of these SO risk screening tools. It should be emphasized that both SARC-F and HGS are screening tools and cannot be used as stand-alone diagnostic methods for sarcopenic obesity. Without body composition assessment, the diagnosis cannot be established; hence, our results represent risk screening outcomes rather than confirmed SO prevalence. In addition, using one of these tools alone may lead to fewer or more cases of SO risk being diagnosed. We recognize that the small sample size and single-center design, along with the absence of a formal power analysis, reduce the strength and generalizability of our results. Future studies should include larger, adequately powered samples to validate these findings.
According to SARC-F and HGS-based screening methods, different clinical factors were significantly associated with SO risk. While SARC-F-based risk of SO was independently related to falls, depressive symptoms, and poorer quality of life, HGS-based SO risk was associated with metabolic parameters such as hypertension and HbA1c, in addition to quality of life impairment. This differentiation highlights the multifactorial nature of SO risk and the importance of using context-appropriate assessment methods in clinical practice. Although the combined use of HGS and SARC-F may theoretically offer a comprehensive evaluation of SO risk, no combined analysis was performed in this study. The practical clinical approach in this study can help health care professionals personalize treatment plans and enable early screening of SO risk. This study offers a practical screening framework for SO risk in patient with diabetes outpatients, despite its limitations. Researchers should conduct further multicenter and longitudinal studies to validate and expand these findings. Validating the practical SO risk screening tools used in our study through comparison with gold-standard diagnostic criteria is essential to support their use in clinical settings.
Authors’ Contributions
O.Y. contributed to study conceptualization, data collection, and article drafting. C.I. conducted statistical analyses, interpreted the data, and contributed to article editing. C.K. performed the literature review, wrote the discussion section, and approved the final article. S.G. was involved in data acquisition, quality control, and article revision. P.K. conducted clinical assessments and contributed to methodology refinement. N.D.S. was responsible for supervision and article review and editing. H.U.A. contributed to data interpretation and article finalization. G.B. provided senior supervision and validated the study methodology. Ilhan Satman provided conceptual guidance and revised the article. M.A.K. supervised the overall study design and approved the final version of the article.
Footnotes
Author Disclosure Statement
No conflict of interest was declared by the authors.
Funding Information
The authors declared that this study received no financial support.
Data Availability Statement
The datasets used and/or analyzed during the current study are available from the corresponding author on reasonable request.