
Abstract
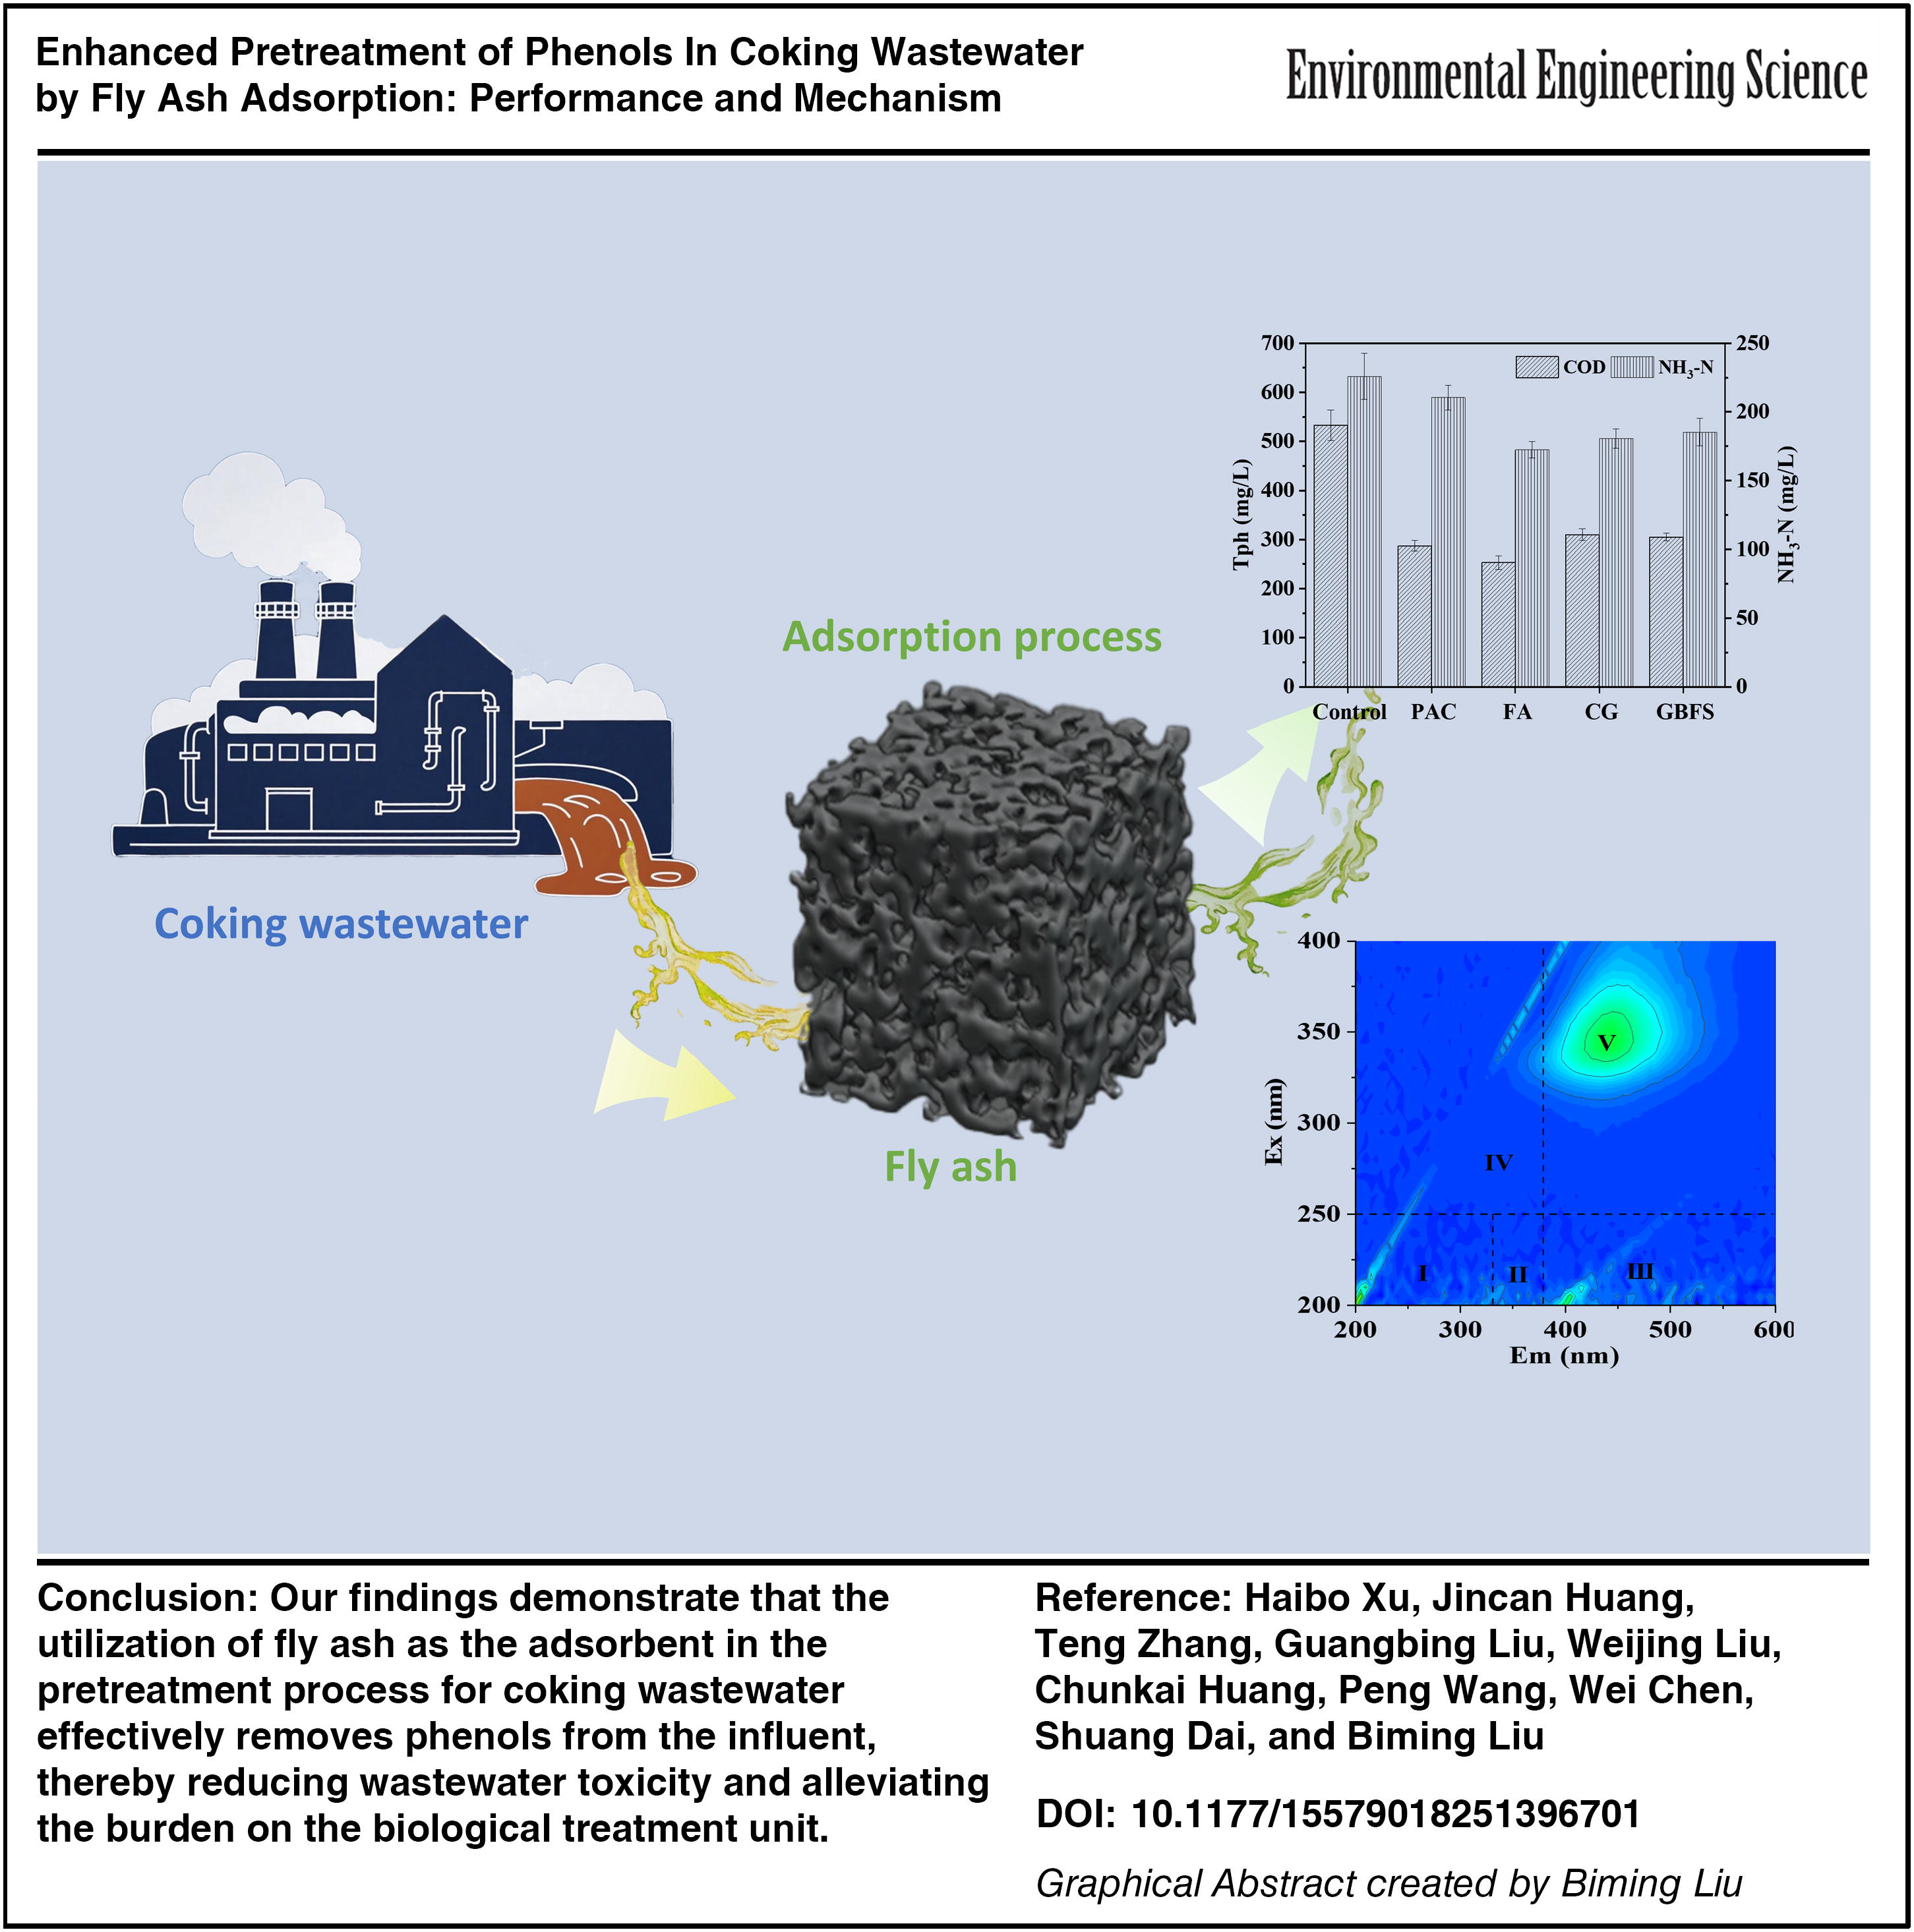
The effective removal of phenols from coking wastewater) in the pretreatment process is crucial for reducing the burden on biological unit and enhancing biodegradability. Although adsorption strategy has attracted widespread attention, the high-efficiency and low-cost adsorbents must be developed and proposed in order for the strategy to be competitive. Herein, powdery activated carbon (PAC) and various industrial residues [coal gangue (CG), granulated blast furnace slag (GBFS), and fly ash (FA)] were selected as adsorbents, and results showed that chemical oxygen demand (COD) removal efficiencies of PAC, CG, GBFS, and FA were 47.9%, 30.84%, 27.83%, and 44.15%, respectively. In comparison, FA and PAC had high adsorption capacity for high concentrations of organics, and FA exhibited higher adsorption efficiency for total phenols (52.53%). Moreover, the biodegradability of the wastewater was significantly improved (B/C ratio: 0.35), and the acute toxicity was greatly reduced to 8.3 after FA adsorption. The pseudo-second-order kinetic model and the Sips model could better describe the adsorption process of FA for COD removal. The adsorption mechanism of organics involved hydrogen bonding adsorption and surface complexation. During this adsorption process, FA exhibited a significant effect on the adsorption of organic substances, especially phenols, and the humification degree of wastewater was considerably diminished. Finally, the cost of removing COD per kilogram of FA is only 0.6 ¥. This work presents new idea and strategy for resource recycling and environmental protection, with the aim of providing theoretical support for the effective utilization of FA.
Introduction
With the prosperous development of chemical industries (e.g., iron and steel, the coal chemical industry, and coking), it has become a challenging issue to deal with industrial wastewater with complex substances, especially the wastewater generated in the coking process (Hu et al., 2024). In China’s coal chemical industry, which accounts for 16% of the national economic aggregate, coking and coal chemical enterprises collectively discharge 300 million tons of coking wastewater (CW) annually. This represents 1.6% of total industrial chemical oxygen demand (COD) emissions, rendering CW treatment a critical and challenging area within industrial wastewater pollution control (Wang et al., 2024). The wastewater contains high-concentration harmful and refractory organic substances [e.g., phenols, cyanide, sulfide, and ammonia nitrogen (NH3-N)] (Wu et al., 2021). These contaminants are hazardous to the environment and ecosystem and pose a serious threat to human health; thus; the efficient treatment of CW has become a hot topic in current research on water pollution control (Tamang and Paul, 2022).
In view of the characteristics of high-concentration pollutants, large differences in water quality, and complex composition in CW, pretreatment (coagulation and sedimentation, air flotation, anaerobic acidification, ozone catalytic oxidation, etc.), biochemical treatment (A/O, A/A/O, A/O/O, O/H/O), and advanced treatment [advanced oxidation processes, membrane separation, etc.] after oil removal and phenol/ammonia recovery to realize the discharge standard (Liu et al., 2023). Biochemical treatment is focused on creating the favorable living environment for microbes to decompose and remove organics and NH3-N from wastewater (Hou et al., 2022). A/O treatment technology, as a common biological treatment, is based on the principle of nitrification-denitrification and achieves predenitrification, which contributes significantly to the degradation of organics and the realization of biological nitrogen removal (Joshi et al., 2018; Li et al., 2010). However, owing to its weak shock resistance, there is a challenge when facing high-concentration CW, and the conventional approach is to dilute the wastewater to alleviate the inhibition of nitrifying bacterial flora by toxic components (Li et al., 2017; Yin and Li, 2022). In addition, high organic loads result in insufficient sludge quantity in aerobic tanks, and extensive sludge return is required to maintain normal system operation (Yang et al., 2025). Therefore, it is critical to improve the pretreatment efficiency before biochemical influent in response to the problem of recalcitrant organic and inorganic pollutants from CW.
During the pretreatment stage, the adsorption strategy has attracted wide attention for removing and separating pollutants owing to many advantages, such as low construction investment, convenient operation and management, stable water quality of effluent, wide range of applicable concentrations, and small space occupation (Cui et al., 2020; Guo et al., 2025). Generally, the materials with porosity, high specific area, and multifunctional group properties are preferable adsorbents for water purification. Powdery activated carbon (PAC) is usually used as the adsorbent because of its large adsorption capacity. And it has a great removal effect on both high and low-concentration wastewater. Li et al. (2015) found that the COD adsorption capacity reached up to nearly 500 mg/g by PAC for CW pretreatment. Similarly, MBR-PAC system could reduce the COD to 83 mg/L in the presence of 4 g/L PAC, while the COD dropped to 39 mg/L after the addition of 5 g/L granular activated carbon (Jia et al., 2016). But the high cost of PAC limited its application in industrial wastewater. Therefore, the search for efficient and inexpensive adsorbents has become a research hotspot recently. Industrial residues have abundant resource value and broad application prospects. Among them, fly ash (FA) is the granular industrial waste residue produced during coal combustion, containing SiO2, Al2O3, FeO, Fe2O3, CaO, TiO2, and other oxide components with large pore sizes, irregular shapes, honeycomb structures, large specific surface areas, and strong physicochemical adsorption properties for pollutants (Gao et al., 2017; Xu et al., 2020). Compared with PAC, FA contains abundant mesoporous structure, particularly for the removal of macromolecular organic contaminants in wastewater (e.g., benzene, toluene, and phenolic compounds). The relevant adsorption process is affected by physical (i.e., specific surface area, pore size, and pore volume) and chemical properties. Physical adsorption under ambient conditions is a spontaneous, nonselective behavior, whereas the adsorption process through functional groups is an irreversible, highly selective chemisorption (Ozkan et al., 2023). In addition, some components of FA can flocculate and precipitate with harmful substances in wastewater. Currently, the application requirement for FA is shifting from low value-added building materials (e.g., cement) to high value-added fields (Labidi et al., 2024).
Based on the above analysis, our pretreatment process selected adsorption method with high treatment efficiency and utilized FA as the adsorbent in order to reduce the cost of adsorption process and the burden of subsequent biological unit and increase the feasibility of its application in the actual pretreatment process. This strategy not only reduces the concentration of organic pollutants in the pretreatment stage but also solves the problem of waste production accumulation to achieve waste utilization and ultimately reduces the overall treatment process cost. Hence, various industrial residues [CG, granulated blast furnace slag (GBFS)], and PAC were firstly selected to compare the removal efficiency of pollutants from the CW. Subsequently, the adsorption performance of FA on COD at different doses was investigated in detail, and the adsorption process was further fitted using adsorption kinetics and isotherms to clarify the FA adsorption behavior of organic pollutants. The adsorption mechanism was further elaborated by analyzing the structural properties of FA before and after reaction. Finally, the CW components were analyzed before and after adsorption. The above research content, with the goal of “treating waste with waste,” is of great significance in promoting the green and sustainable development of engineering materials.
Materials and Methods
Materials and wastewater
CW was taken from the coal coking company of Ma’anshan Iron and Steel Co., LTD, which is one of the mega iron and steel joint ventures in China, and came from the actual CW influent of the anoxic process, which was recovered by the phenol/ammonia process before use. A specific analysis of the water matrix is shown in Supplementary Table S1. CW is yellowish-brown in color, slightly turbid and has a harsh smell (Supplementary Fig. S1). The pH of wastewater appears to be weakly alkaline (7.25–7.64), and the average values of COD, BOD5, total organic carbon (TOC), NH3-N, TN, TP, and total phenols (Tph) are 3,670 mg/L, 1,130 mg/L, 1,271.5 mg/L, 225.9 mg/L, 267.55 mg/L, 2.64 mg/L, and 533 mg/L, respectively. The average values of conductivity and chromacity were 1,760.5 μs/cm and 2,150, respectively. CW was stored in a refrigerator at 4°C and shaken well before use.
FA, CG, and GBFS were purchased from Huishun Mining Co. Ltd. (Hebei, China), Terun Energy Co. Ltd. (Dongguan, China), and Jiuhua New Materials Co. Ltd. (Anhui, China), respectively. Due to low adsorption capacity and the presence of impurities on the surface, the selected industrial residues should be chemically modified before use. The residues were treated in H2SO4 (50 wt. %) and NaOH (5 wt. %) successively at 80°C through the reflux method (Manyepedza et al., 2024). Acid treatment could roughen the originally smooth and dense surface of residues and create new microscopic pores by loosening the pores (Lankapati et al., 2023). And alkali modification could disrupt the dense glass layer film on its surface, exposing the internal glass matrix prone to hydration (Mazumder and Rano, 2015). PAC was obtained from Xinhu Activated Carbon Co. Ltd. (Jiangsu, China). All adsorbents were crushed by jaw crushing and planetary ball milling, the particle size was controlled to be <80 μm, and the milled samples were dried at 105°C for 24 h before use. Photobacterium luminescens freeze-dried powder was purchased from the Nanjing Institute of Soil Science, Chinese Academy of Sciences. Deionized water was obtained from a pure water treatment system (EPED-Z1-30T, Eped Technology, China) to prepare all the solutions (resistivity ≥ 1 MΩ · cm).
Characterization of FA
Qualitative and quantitative analyses of oxides in industrial residues were achieved using X-ray fluorescence spectroscopy (XRF, ZSX Primus II, Rigaku, Japan) with a Rh target of 4.0 kW. FA, CG, and GBFS contained the same oxides, including SiO2, Al2O3, Fe2O3, Na2O, K2O, MgO, and CaO (Supplementary Table S2). Among them, SiO2 and Al2O3 were the main components in FA and CG, with total amounts of 84.7 wt. % and 71 wt. %, respectively, while other oxides have lower amounts. The composition of GBFS was dominated by Si and Ca, with a total oxide amount of 74.4 wt. %. This indicates that the structural components of FA are relatively similar to those of CG and GBFS. The specific surface area, pore volume and pore size were obtained using a Brunauer–Emmett–Teller method with a Builder 4200 instrument (Tristar II 3020M, Micromeritics Co., USA). The zeta meter (system 4.0, Ankersmid, Netherlands) was used to measure the surface charge of the FA. The phase composition of FA before and after adsorption was tested using an X-ray diffractometer (XRD, D8-Focus, Bruker AXS, Germany) with a Cu target at 0.15418 nm, 40 kV, and 40 mA. The X-ray photoelectron spectrometer (XPS, VG Multilab 2000, Thermo, USA) was used to detect the valence and structure of the elements in the material. The X-ray source was Al Kα with an operating voltage of 12.5 kV, an operating current of 20 mA, and an energy step of 0.05 eV. All binding energies were corrected with reference to the C1s peak at 284.8 eV. The Fourier transform infrared spectrometer (FT-IR, Nicolet iS50, Thermo, USA) was utilized to measure the functional groups of samples before and after adsorption. The samples were dried at 105°C for 2 h before analysis and pressed into tablets at a mass ratio of 1:100 with KBr.
Batch adsorption experiments
Unless otherwise specified, all batch experiments were performed in a shaker (THD-200, YataiKelong, China). Typically, 500 mL of CW was added to a conical flask, and then 10 g/L of adsorbent was added to the solution. The mixture was placed in the shaker at 25°C and the speed was maintained at 200 rpm for 3 h. In which the optimized adsorbent dose and reaction time were determined based on the results of the effect of FA dose and kinetic analysis for COD removal, respectively. At the given intervals, 15 mL of water samples were filtered through the membrane (0.45 μm) for subsequent water quality analysis. Descriptions of the kinetic and isotherm experiments are provided in Supplementary Data S1 and Supplementary Data S2, respectively (Supporting Information). All experiments were performed in triplicate to ensure reproducibility.
Analytical methods
COD was measured using the closed reflux colorimetric method (HJ/T 399-2007, China) (Jiang et al., 2019). For the BOD test, the water samples were first filled with completely closed bottles and then incubated in the dark at (20 ± 1) °C for 5 ± 4 h. The mass concentration of dissolved oxygen (DO) in the water samples before and after incubation was determined using a DO meter (S975; Mettler Toledo, Switzerland). The TOC was determined using a TOC elemental analyzer (Vario Toc CUBE, Germany). The NH3-N and TN concentrations were determined using Nessler’s reagent spectrophotometry method (HJ 535-2009, China) (Meng et al., 2022). Tph concentration was measured using the brominated volumetric method (HJ 502-2009, China) (Li et al., 2021). Photobacterium luminescens T3 was selected as the test organism for the toxicity analysis of samples, and the toxicity test was carried out according to GB/T 15441-1995 (China) (Kurvet et al., 2011). The detailed operation process is provided in Supplementary Data S3, Supporting Information. The chromaticity of CW was determined using the water colorimeter (HD-SD10, HORDE ELECTRIC, China). UV-visible spectral analysis of the water samples was performed using a UV-visible spectrophotometer (UV/vis, UV-2700, Shimadzu, Japan). To obtain the composition and characteristics of the organics in the CW before and after adsorption, 3D fluorescence spectra were analyzed by simultaneous scanning using an excitation-emission matrix spectroscopy analyzer (EEM, Model F-7000, Hitachi, Japan). The gas chromatography-mass spectrometer (GC-MS, ISQ 7610, ThermoFisher, USA) was used to analyze the organic fractions in CW, and the compositions were identified using the NIST 05 Mass Spectral Library database.
Results and Discussion
Comparison of the adsorption performance of various adsorbents
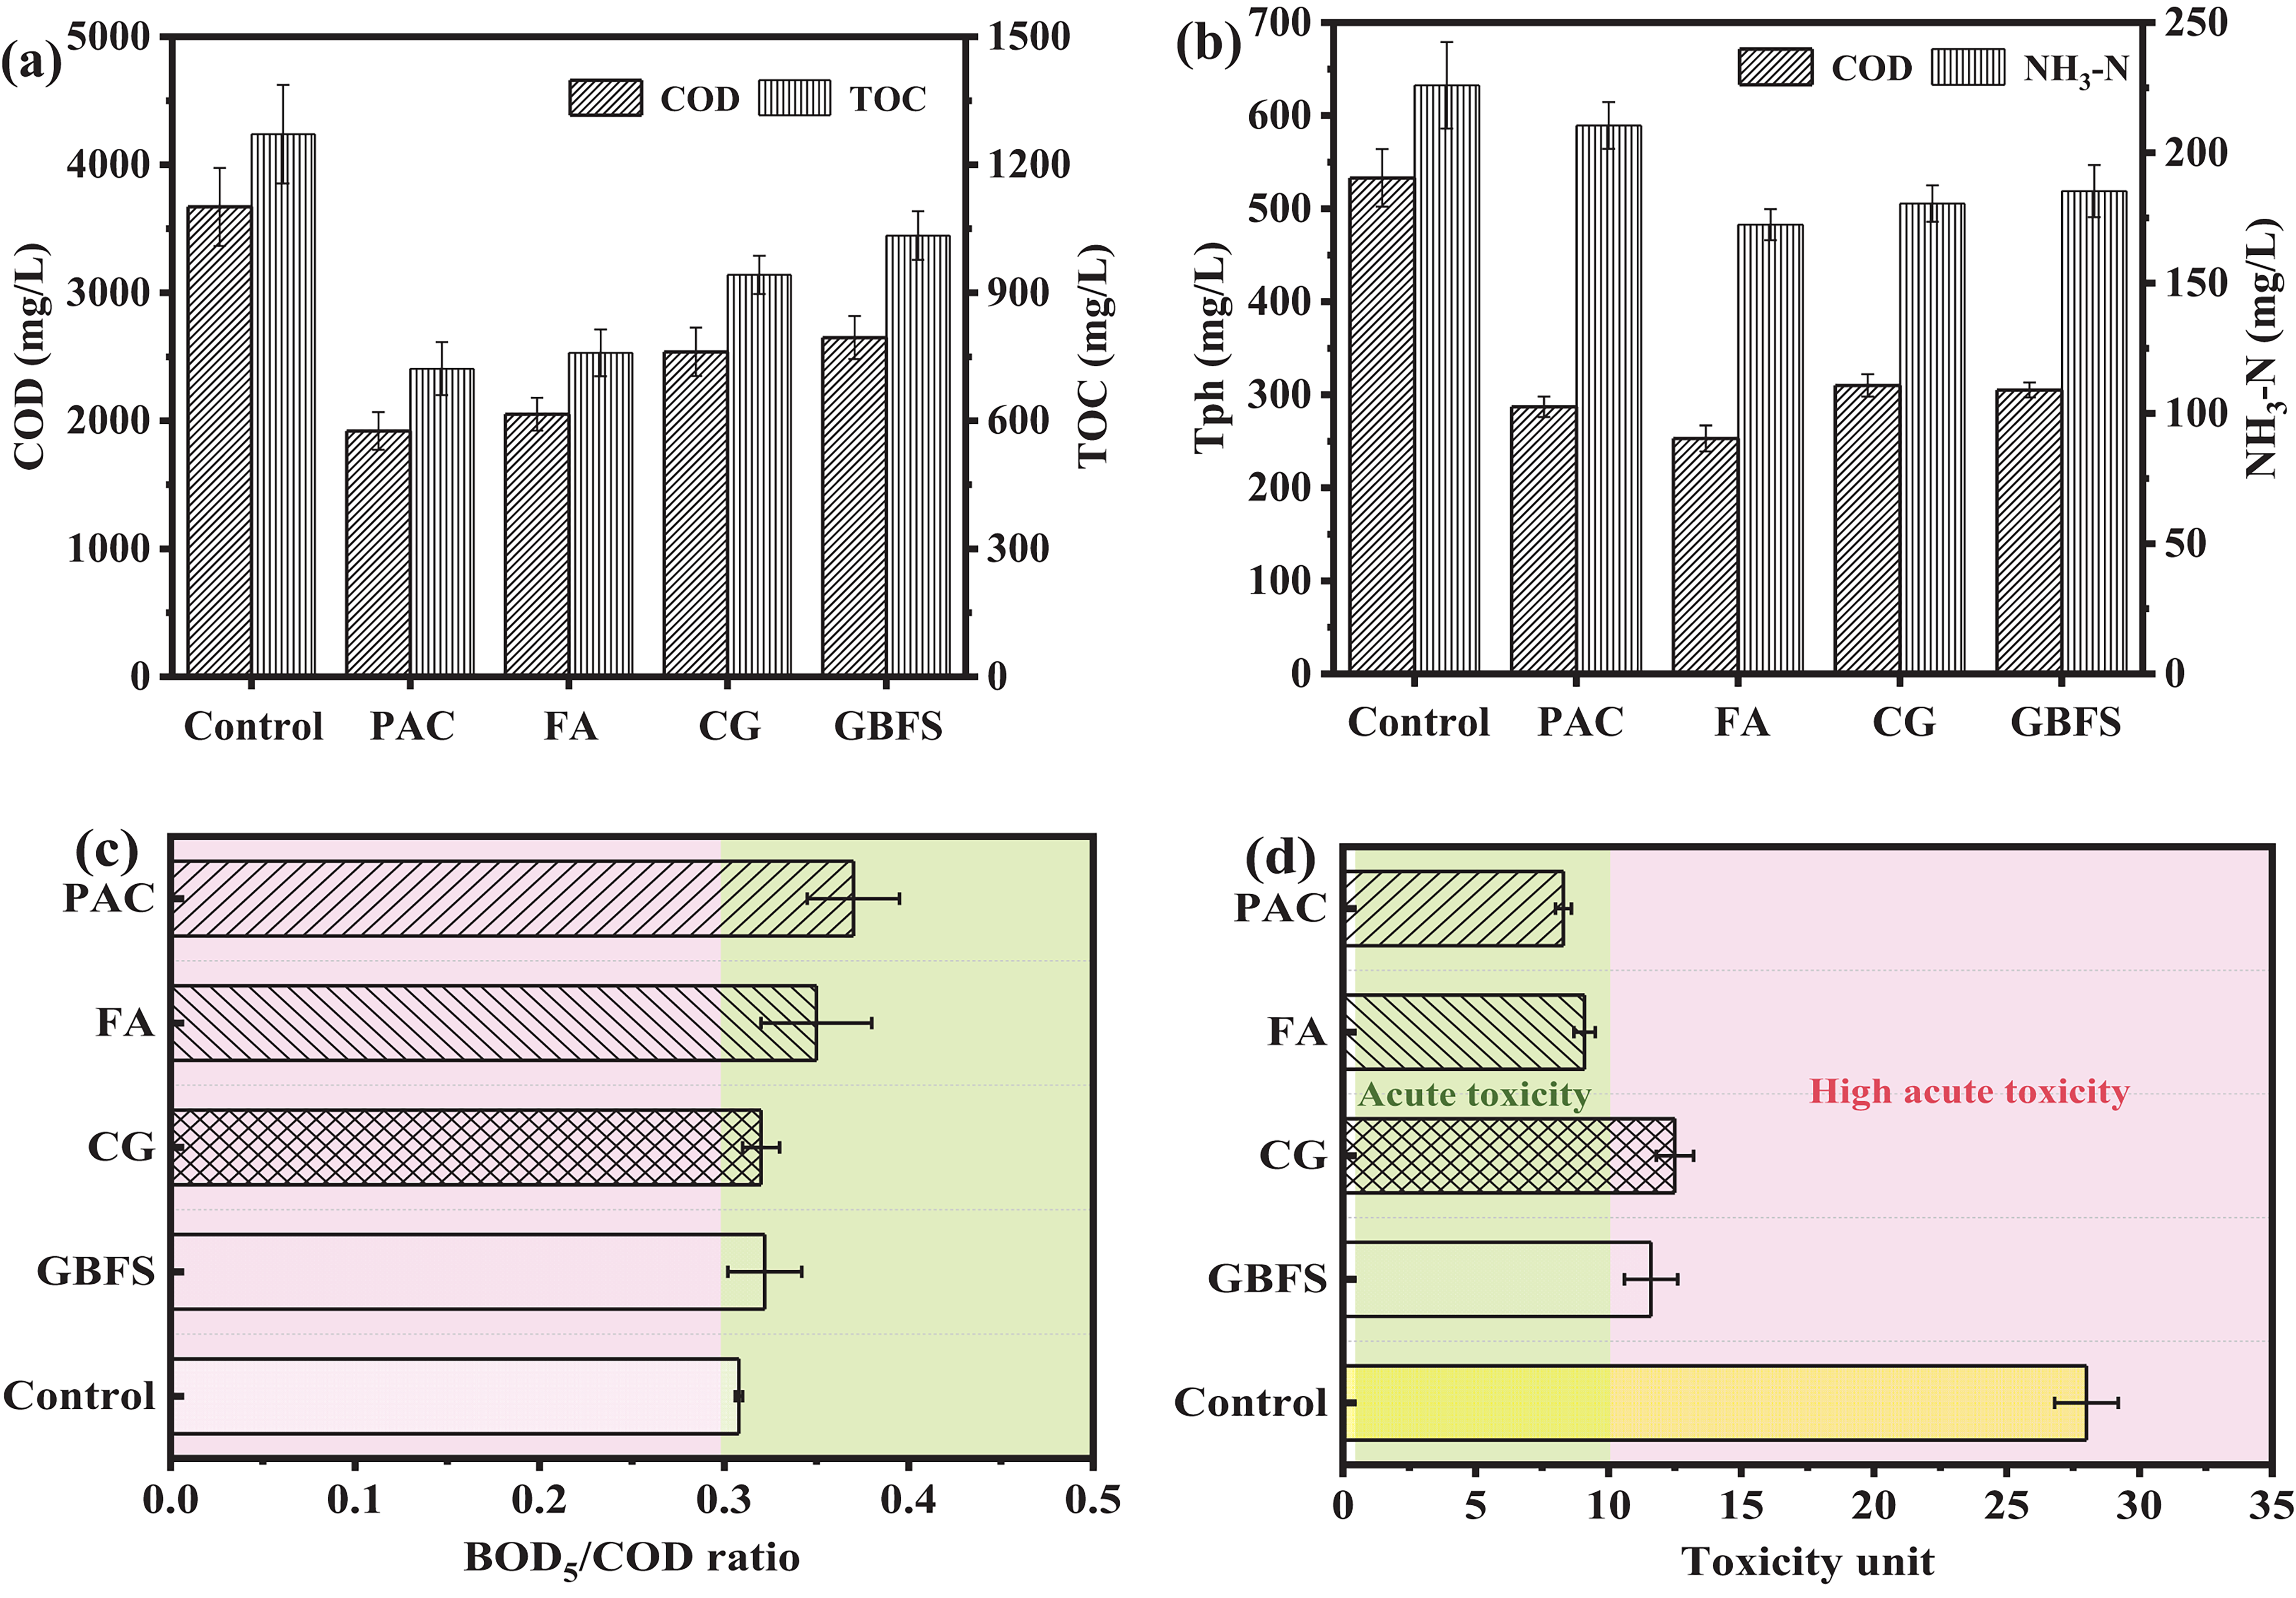
The color of all the water bodies varied from yellowish brown to light yellow after adsorption, and the color was similarly lighter after PAC and FA treatments (Supplementary Fig. S1). The similar result was obtained for the chromaticity of water samples. The chromacity removal efficiencies of CW after the adsorption of PAC, FA, CG, and GBFS are 63%, 58%, 30%, and 33%, respectively (Supplementary Fig. S2). This indicates that both PAC and FA possessed relatively higher absorption capacity for contaminants. The adsorption performance of PAC and industrial residues on various parameters from CW was further investigated (Fig. 1a and b). Among the industrial residues, the removal of dissolved organic carbon (DOC) from CW by CG and GBFS is unsatisfactory, with COD and TOC removal efficiencies of 30.84% and 25.91%, 27.83%, and 18.68%, respectively. Surprisingly, compared with PAC, FA also has excellent adsorption capacity for DOM, and relevant COD and TOC removal efficiencies can reach 44.15% and 40.31%, respectively. This was attributed to the higher specific surface area and pore size of FA (1,600 m2/g, 16.94 nm) and PAC (1,350 m2/g, 15.35 nm) than those of CG and GBFS (Supplementary Table S3). These properties provide abundant active sites for DOC adsorption.
The removal efficiencies of
The removal efficiencies of PAC, FA, CG, and GBFS for Tph are 46.15%, 52.53%, 41.84%, and 42.78%, respectively (Fig. 1b). Notably, FA exhibits the highest adsorption capacity for Tph. Apart from the electrostatic adsorption triggered by large specific surface area, reactive groups such as hydroxyl groups in FA can also form hydrogen bonds with phenol molecules, enhancing the adsorption of phenols. The surface charge of adsorbent was determined at pH 3–9 by zeta potential m (Supplementary Fig. S3). In contrast, FA (4.4), CG (5.8), and GBFS (5.7) have lower pHpzc values than PAC (8.0). The adsorbent surface carried negative charge if the pHpzc was lower than the pH of CW (7.25–7.64), which was favorable for enhancing the NH3-N adsorption from wastewater. In this case, a strong electrostatic attraction was generated between the negatively charged industrial residues in the solution and positively charged NH3-N. It can be seen from the experimental results that a higher pHpzc of PAC allows the removal efficiency of NH3-N to be only 6.82%. Besides, in comparison with the adsorption performance of all industrial residues, FA has higher adsorption capacity for NH3-N (5.35 mg/g). Overall, FA exhibits superior adsorption capacity for various contaminants in the CW.
Biodegradability before biochemical process was further assessed using the B/C ratio (Fig. 1c). The B/C ratio of raw wastewater is only 0.308, which increases to 0.37, 0.35, 0.32, and 0.322 after adsorption of PAC, FA, CG, and GBFS, respectively. A higher B/C ratio implies a greater proportion of biodegradable organics in wastewater and a lower concentration of refractory organics (Zhi et al., 2020). In addition, it facilitates the treatment efficiency and stability of biological system.
CW is a typical toxic and refractory industrial wastewater. Therefore, the median effect concentration (EC50) was applied to measure the reduction efficiency of biological acute toxicity after pretreatment (Fig. 1d). The toxic unit (TU) value of raw CW is 28, indicating a significantly elevated acute toxicity level based on the established toxicity classification criteria (Li et al., 2023). Although the TU values are reduced to 12.5 and 11.6 after the adsorption of CG and GBFS, wastewater still keeps the nature of high acute toxicity unchanged. It is gratifying to note that FA and PAC contribute to the reduction of the toxicity rank of CW to acute toxicity, standing at 8.3 and 9.1, respectively. This effectively protects microbial activity and maintains the balance of microbial community in subsequent biological units, thus promoting contaminant degradation by microbes (Martín-García et al., 2022). Since the goal of pretreatment is to increase the operational capacity of subsequent biological systems and reduce the organic load, we will focus on the effect of FA on organic adsorption in the following sections.
Adsorption kinetics
The adsorption results of FA for COD removal from wastewater at different adsorption times are shown in Figure 2a. The adsorption capacity gradually increases with adsorption time. During the initial 90 min, the adsorption capacity of FA is rapidly enhanced, attributed to the high specific surface area and abundant adsorption sites. These characteristics facilitated the rapid capture of organic pollutants at the adsorption sites. However, as the active sites on the FA surface became progressively occupied after 90 min, the mutual repulsion between adsorbed organics and pollutant molecules in the solution impeded the rapid adsorption of COD, resulting in a decrease in the adsorption rate. Finally, the adsorption equilibrium (∼73.75 mg/g) is reached within 3 h, indicating that the large pore size and specific surface area effectively enhanced the adsorption capacity of adsorbent. Therefore, in the subsequent optimization of experimental adsorption conditions, the adsorption time is fixed at 3 h.
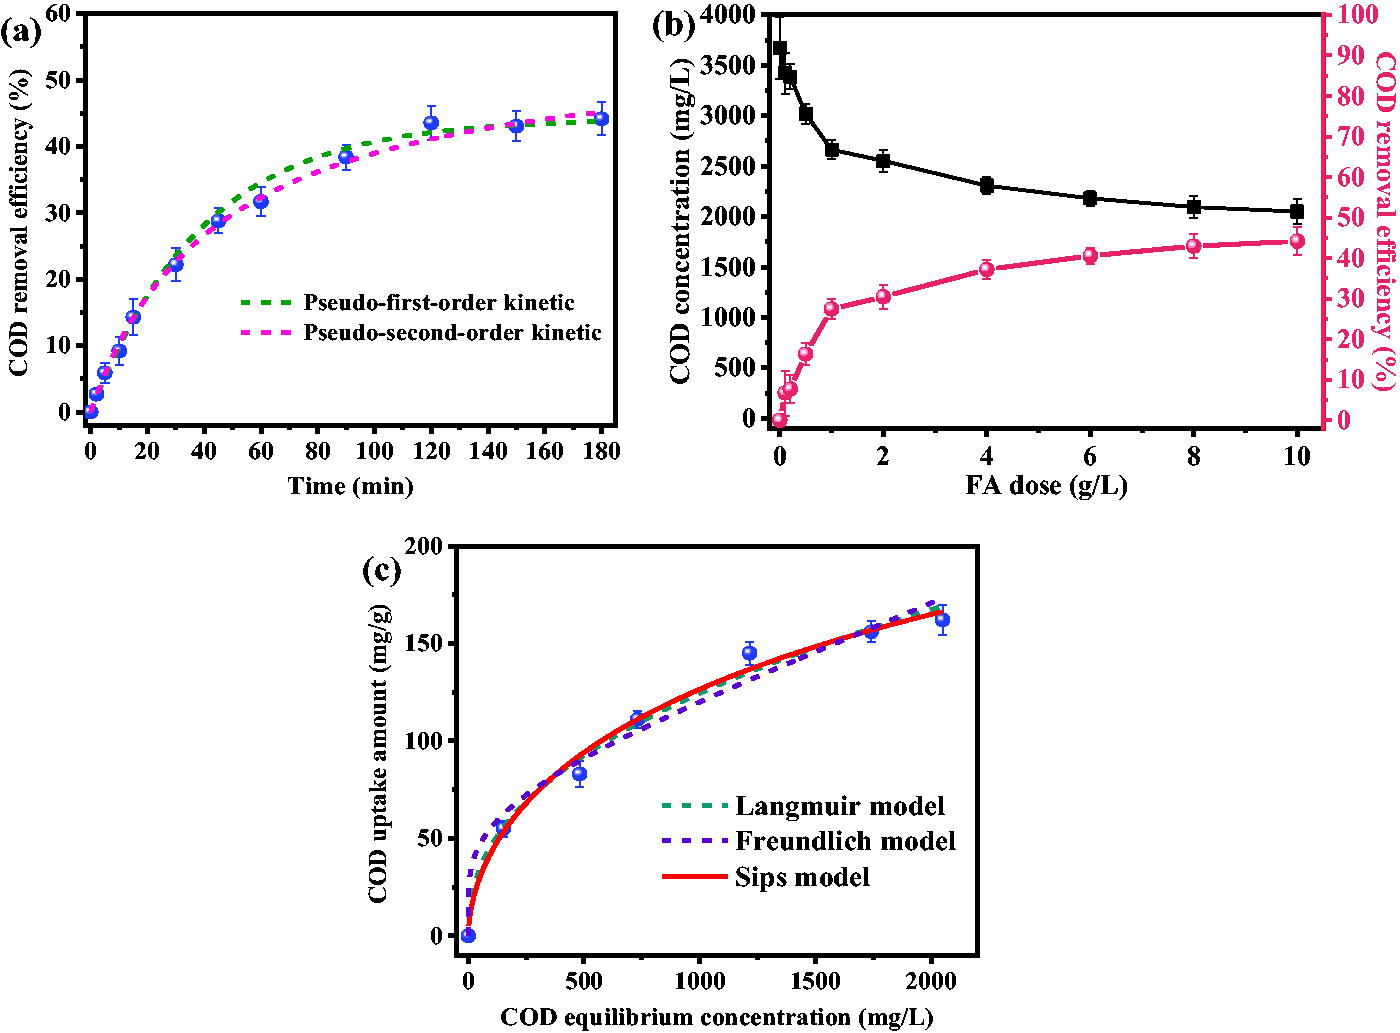
Adsorption kinetics can be applied to investigate the patterns of adsorption capacity and adsorption rate of adsorbents for pollutants (Wang et al., 2025). The pseudo-first-order kinetic model assumes that ions adsorb to idle adsorption sites on the adsorbent surface, whereas the pseudo-second-order kinetic model describes the adsorption process in the presence of electron share and transfer in solution (Ahmaruzzaman and Sharma, 2005). To further investigate the adsorption characteristics of FA for COD removal, the adsorption process was fitted and analyzed through kinetic models (Supplementary Table S4). Owing to the fact that the R2 value of the pseudo-second-order kinetic model (0.998) is significantly higher than that of the pseudo-first-order kinetic model (0.963), and the qe value (204.7 mg/g) of the pseudo-second-order kinetic model is closer to the actual value. Thus, the pseudo-second-order kinetic model can better describe the kinetic adsorption process of organic compounds on the FA surface (Liu et al., 2024). In addition, the pseudo-second-order kinetic model indicated that the primary rate-limiting step in the FA adsorption process was chemical adsorption (Liu et al., 2022). It can be seen that the adsorption of FA for organic pollutants is mainly chemical adsorption controlled by multiple processes.
The internal diffusion equation is consistent with the adsorption process. And the fitting curves for the first two stages of the diffusion stage do not pass through the origin of coordinate system, suggesting that internal diffusion of particles is not the unique rate-limiting step, and the adsorption process may involve other adsorption mechanisms (Li et al., 2024). The data were categorized into four stages based on the trend in adsorption capacity (Supplementary Table S5). It can be found that the internal diffusion rate constant decreases gradually with adsorption time, suggesting that the adsorption rate is fast in the initial stage. In the latter two stages, the slope of the fitted straight line gradually decreases and diffusion slows down, especially in stage IV, demonstrating that the adsorption process gradually reaches the equilibrium state. Overall, COD adsorption gradually diffused into the interior of the FA surface layer. In the initial stage of fast diffusion, abundant organic molecules diffused from the solution to the FA surface and immediately adsorbed onto the abundant active sites on its surface at a fast adsorption rate. Then, many adsorption sites got covered by organic molecules over time, resulting in slower diffusion rate.
Effect of FA dose
The effect of the adsorbent dose on COD removal is shown in Figure 2b. As the adsorbent dose increases from 0.1 g to 10 g, the adsorption efficiency gradually improves and then tends to stabilize. The COD concentration drops from 3,423 to 2,050 mg/L, and the relevant removal efficiency improves from 6.71% to 44.15%. Although the specific surface area and active adsorption sites provided by FA increased, while maintaining a stable total amount of organic molecules, resulting in enhanced adsorption capacity. Notably, an additional increase in the FA dosage (>10 g/L) did not allow for maximum utilization of the adsorbent and could not appreciably enhance the adsorption effect.
Adsorption isotherms
Adsorption isotherms typically describe the relationship between adsorption amount and solution concentration when the adsorption equilibrium is reached at a fixed temperature. This enables the prediction of the maximum adsorption capacity of the adsorbent and allows for the inference of the adsorption mechanism between adsorbent and adsorbate (Garba et al., 2019). The Langmuir model represents the single-layer adsorption of organic molecules on the homogeneous surface. The Freundlich model is a widely used empirical isotherm that can be applied to describe nonideal adsorption. The Sips model integrates the Langmuir and Freundlich adsorption models, providing the mechanism for analyzing heterogeneous monolayer adsorption. This avoids the adsorption concentration limitation of the Freundlich model and offers higher fitting accuracy (Lu et al., 2023). The results reveal that the R2 value of Sips model (0.9871) is greater than that of Langmuir (0.9382) and Freundlich (0.9416) models (Fig. 2c, Supplementary Table S6). The theoretical adsorption amount (147 mg/g) is closer to the actual adsorption capacity (162 mg/g), illustrating that the Sips model can better describe the adsorption behavior of organics on the FA surface. Moreover, the adsorption process occurs on heterogeneous surface in the form of multilayer adsorption, encompassing the control of multiple mechanisms.
Possible adsorption mechanism of FA
The crystalline phase of the FA was analyzed using XRD. Fresh FA crystals contain large numbers of quartz and mullite crystal structures, with the major characteristic peaks corresponding to mullite (PDF# NO. 79-1456) (Labidi et al., 2024). The amorphous phase is mainly composed of amorphous silicate glass. The bulging broad peaks indicate the presence of amorphous glassy phase, mainly amorphous SiO2 in FA, which may lead to rougher material surface, increasing the specific surface area of material and thus increasing its adsorption capacity and activity (Fig. 3a). The main characteristic diffraction peaks are SiO2 (26.3°, 39.1°), Al2O3 (25.9°, 42.5°), CaO (49.3°), CaCO3 (30.9°), 3MgO•4SiO2•H2O (32.7°), Al2O3•2SiO2 (16.5°, 35.1°, 61.9°), and other oxides. After acid–base modification, the quartz and mullite structures of FA were transformed to produce 3MgO•4SiO2•H2O, thereby releasing negatively charged groups within the material and enhancing adsorption capacity. Two distinct peaks appear at 47.5° and 48.8°, indicating that PO43− has been successfully captured by FA to form new brushite crystal phase (JCPDS 11-0293) (Largo et al., 2020). Besides, the intensity of characteristic diffraction peaks is reduced to a certain extent after adsorption, confirming that large amounts of organic pollutants have been efficiently adsorbed (Lazaratou et al., 2021). This phenomenon is similar to the result of previous study (Hong et al., 2020).
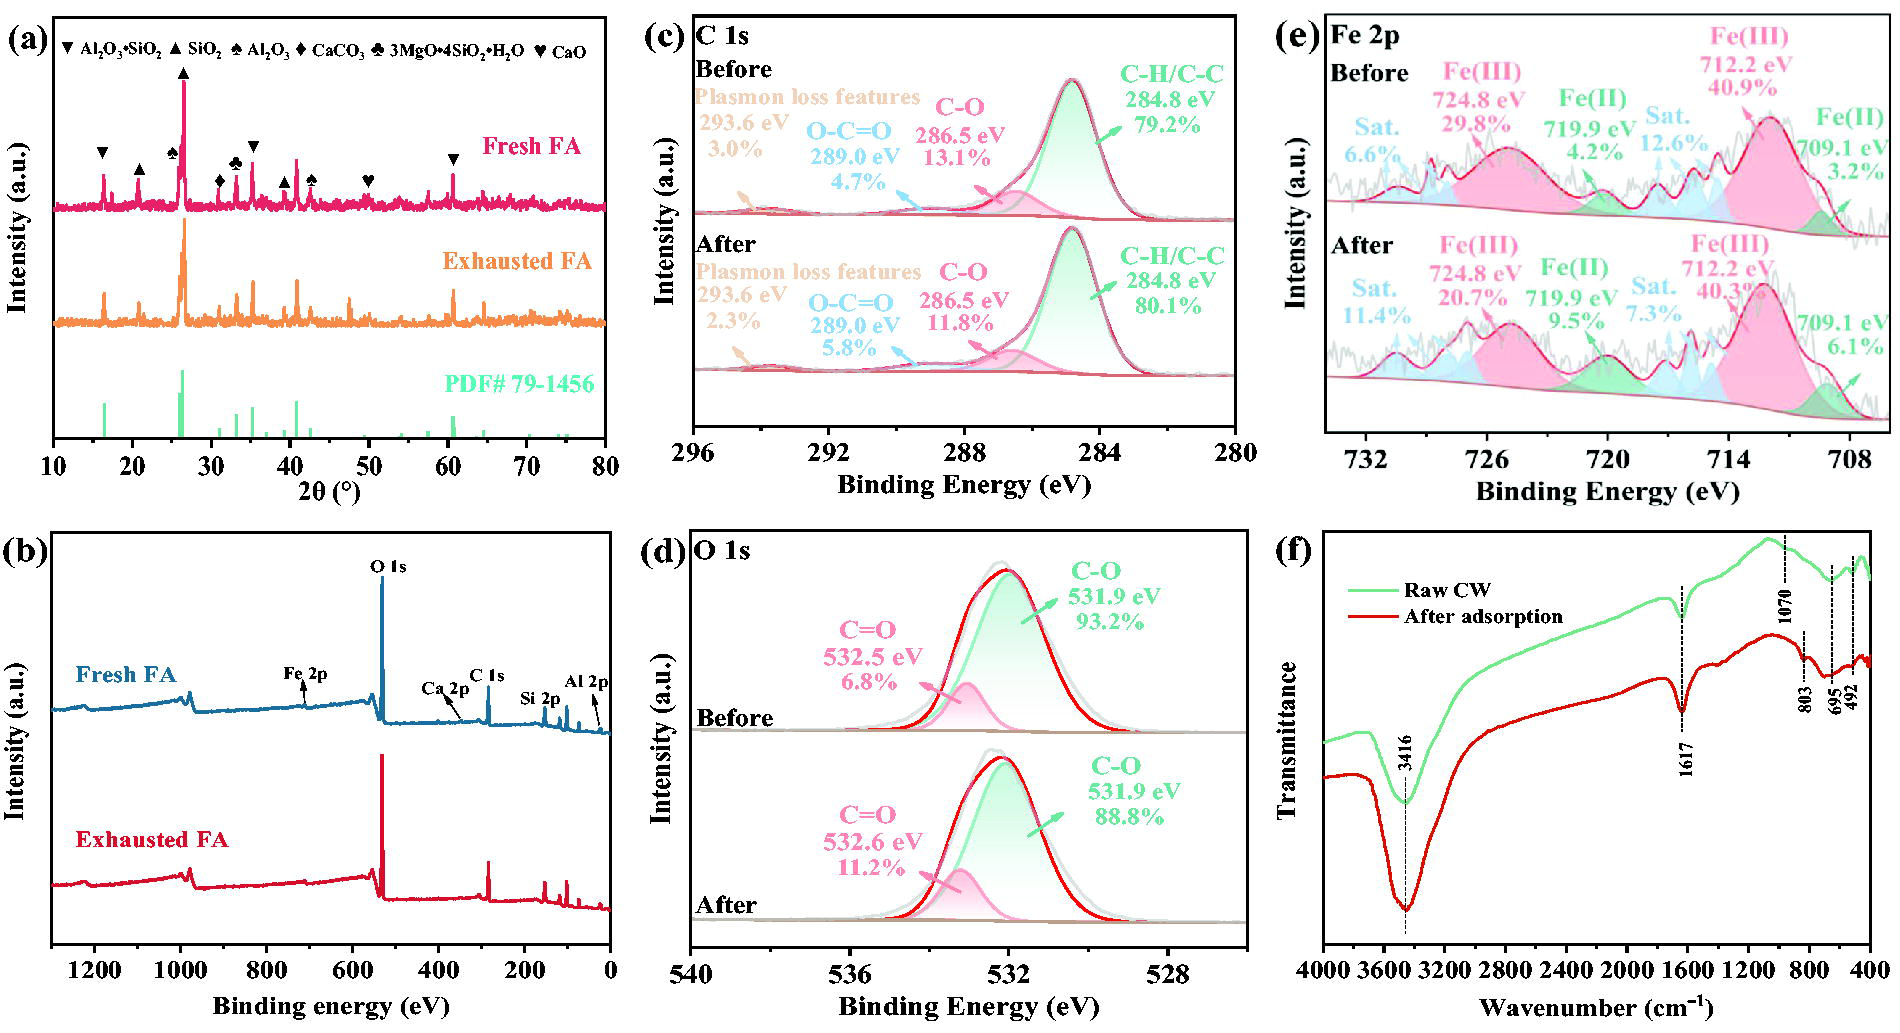
The elemental composition of FA before and after adsorption was detected using XPS analysis. As shown in Figure 3b, the characteristic peaks of Si, O, Fe, Ca, Al, and C appear on the surface of materials, and this result is consistent with the XRF analysis. The content of C-C/C-H groups after FA adsorption rises from 79.2% to 80.1%, and the content of C = O functional groups declines from 13.1% to 11.8% (Fig. 3c). This is attributed to the fact that O-containing groups, such as C = O and C-O, could form hydrogen bonds with C-C unsaturated bonding electrons in the benzene ring, enhancing the adsorption of DOC (Jiang et al., 2019). In the XPS spectrum of O1s, the diffraction peaks of C = O and C-O are observed at 532.5 eV and 531.9 eV, respectively, before the adsorption of DOC. And the diffraction positions of each functional group are slightly shifted after adsorption, and the percentage of C = O increases from 6.8% to 11.2%, and the percentage of C-O drops from 93.2% to 88.8% (Fig. 3d). This suggests that C = O may act as an electron donor to reduce the DOC, leading to the conversion of C = O to C-O. Because the C-O group had electron density and partial positive charge, it acted as an electron donor in the electron donor-acceptor mechanism (Ahmaruzzaman and Sharma, 2005). As shown in Figure 3e, the percentages of Fe(III) before and after FA adsorption are 70.7% and 61%, respectively, which implies that Fe(III) might be involved in the DOC complexation reaction. Moreover, Fe-O groups might also be engaged in phenol adsorption through surface complexation. In summary, the adsorption of DOC by FA involves hydrogen bonding and surface complexation.
The FT-IR spectrum of FA shows that there are the stretching vibration peaks of -OH at ∼3,416 cm−1 and the bending vibration peaks of H-O-H at ∼1,617 cm−1 (Fan et al., 2023) (Fig. 3f). These absorption peaks are due to the vibration caused by the water absorption of FA. The two absorption peaks are observed at ∼1,070 cm−1 for the inverse stretching vibration of Si-O-Si, ∼695 cm−1 for the bending vibration of Si-OH, and ∼492 cm−1 representing the asymmetrical stretching vibration of Si-O and Al-O (Mushtaq et al., 2019). The new characteristic peak at 803 cm−1 after adsorption appears to be attributed to the ionic carboxyl group (-COO-), the C = O bond in ketones, -OH of phenolics, and the C = C bond stretching vibration of the mononuclear aromatic hydrocarbons (Zhang et al., 2022). It means phenolic organics in CW can be adsorbed on FA through hydrogen bond formation. The emergence of new characteristic absorption peak is also due to the surface adsorption and partitioning effect during the adsorption process. The above results show that -OH, Si-O, and Al-O functional groups are involved in the adsorption of phenols.
Component variation of CW by FA preadsorption
UV/vis analysis
UV-vis spectroscopy could be employed to analyze variations in the composition, structure, and properties of organic pollutants (Ghosh et al., 2022). The obvious absorption in the band of 200–300 nm indicates the presence of monocyclic aromatic hydrocarbons, polycyclic aromatic hydrocarbons, and some heterocyclic compounds in the water samples (Fig. 4). There are three obvious absorption peaks at 230, 270, and 280 nm in the CW, which corresponded to the three characteristic absorption peaks of aromatic compounds, indicating that the main organic compounds in the CW were aromatic compounds. These three absorption bands are red-shifted compared with the E1 band (λmax = 184 nm), E2 band (λmax = 204 nm), and B band (λmax = 255 nm) of benzene, suggesting that aromatic compounds in CW tend to have larger conjugation system than benzene rings. And benzene rings are connected to electron-donating groups to form polycyclic compounds (Liu et al., 2023). The effluent exhibits different degrees of absorbance reduction across the entire wavelength range. This again illustrated that FA had stronger adsorption performance for DOC.
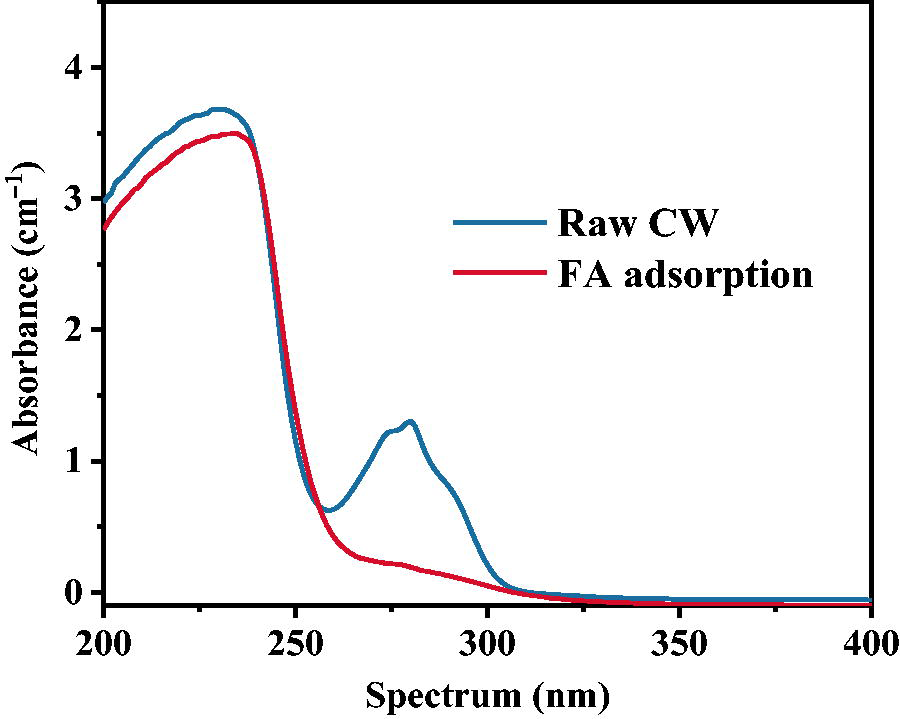
UV-vis absorption spectra before and after FA adsorption. FA, fly ash.
Other UV absorption parameters can also characterize the DOC component in wastewater to some extent. UV254 is the absorbance of water sample at 254 nm, representing compounds containing C = C, C≡C groups, or aromatic compounds. These substances are the main chromophores in wastewater, as well as the main components of residual organics (Yang et al., 2025). The UV254 value drops from 7.02 to 5.03 after adsorption, indicating that FA exhibited adsorption activity toward aromatic compounds (Supplementary Table S7). The SUVA value reflects the aromaticity of organics, and the higher value represents the higher proportion of aromatic substances in the solution. Thus, SUVA can also reflect the biochemical performance of wastewater. The relevant value also increases from 25.2 L/mg•m to 36.3 L/mg•m after adsorption. The UV254/UV365 value is negatively correlated with the molecular weight of organics, and UV300/UV400 reflects the humification degree of wastewater. It can be seen that UV254/UV365 value and UV300/UV400 value change from 27.8 and 0.82 to 17.2 and 1.11, respectively. It revealed the humification degree of effluent decreased after pretreatment.
EEM analysis
EEM is a series of fluorescence emission spectra obtained by changing the excitation wavelength (Hu et al., 2024). Different fluorescent substances have different fluorescence intensities and characteristic fluorescence peaks at different positions, thus reflecting information such as the class of organic molecules and origin of their properties. The 3D-EEM spectra can be divided into five regions: aromatic-like protein substances I (Region I), aromatic protein substances II (Region II), fulvic acid-like substances (Region III), soluble microbial metabolites (Region IV), and humic acid-like substances (Region V) (Zhi et al., 2020) (Supplementary Table S8).
The fluorescence peaks of CW are mainly in Regions III, IV, and V, indicating that the organics in CW are mainly fulvic acid-like, soluble microbial metabolites, and humic acid-like substances (Fig. 5). Microbial metabolites can also be tryptophan-like, tyrosine-like, or residues (Jiang et al., 2019). The EEM distribution of main fluorescence peaks is consistent with phenolic substances, such as phenol and catechol, indicating that the main organic pollutants are phenolic compounds (Fig. 5a) (Ahmaruzzaman and Sharma, 2005). The fluorescence intensities of three regions drop sharply after FA adsorption (Fig. 5b). The integration and proportion of the fluorescence regions are listed in Supplementary Table S9. The integration percentage is not significantly altered, but regional integration is drastically reduced by adsorption, especially in Regions V and IV. The results also showed that FA had a better adsorption performance for aromatic substances, especially phenolic substances.
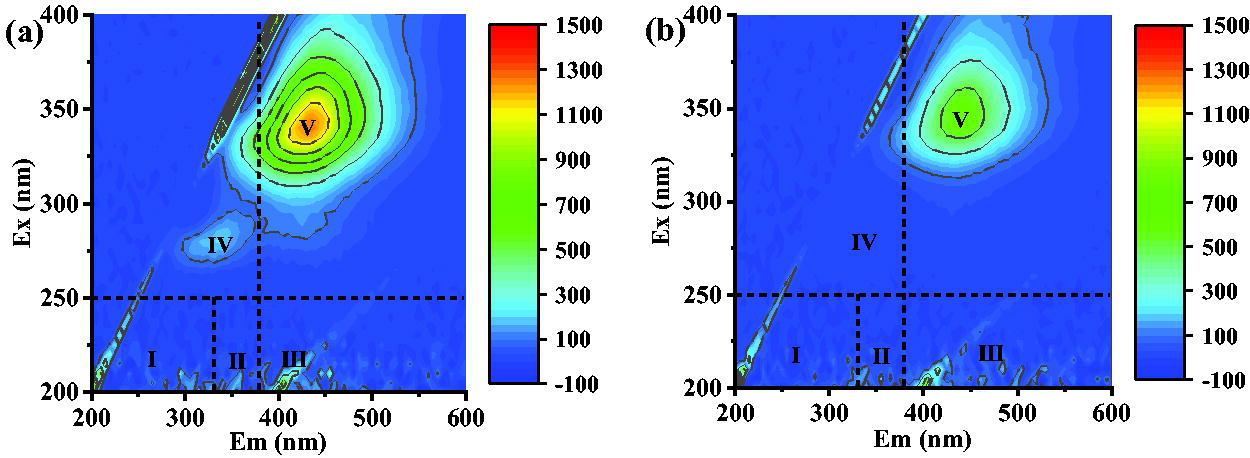
EEM analysis of CW
GC-MS analysis
GC-MS analysis shows that the main components of raw CW are phenols (phenol, 4-methylphenol, catechol, o-cresol, etc.), ketones (2-ethylcyclohexanone, 3-methylcyclopentanone, etc.), heterocyclic compounds and heterocyclic compounds, etc. (Supplementary Table S10). These organic compounds are toxic, hazardous, and refractory. Phenolic organics account for 75% of total organic pollutants, followed by ketones (11.9%). The total phenolic content remarkably decreased to 41.79%, where phenol was reduced from 25.5% to 18.53%, indicating that FA had a significant effect on phenol removal. Typical high-toxicity refractory organic compounds (e.g., indole, pyridine, and quinoline) are also efficiently removed during the pretreatment stage. Besides, the low-content organic in raw CG are not detected after adsorption.
Economic analysis
The above analysis shows the actual effect of FA during the CW pretreatment, and it is necessary to analyze its actual cost in application. Supplementary Table S11 lists the cost of PAC and FA during CW pretreatment, and COD adsorption capacity was calculated based on the adsorbent dose of 10 g/L. Although the COD adsorption capacity of PAC (1,758 mg/L) was better than that of FA (1,620 mg/L), the unit price of PAC (5 ¥/kg) was much higher than that of FA (0.1 ¥/kg). After calculation, the cost of removing COD per kilogram of FA is only 0.6 ¥ while the cost of PAC is as high as 28.4 ¥, thus the cost advantage of FA adsorption is obvious.
Conclusions
The chromacity removal efficiencies of CW after the adsorption of PAC, FA, CG, and GBFS were 63%, 58%, 30%, and 33%, respectively. And the B/C ratio of raw wastewater is only 0.308, which increases to 0.37, 0.35, 0.32, and 0.322 after adsorption of PAC, FA, CG, and GBFS, respectively. Because FA (1,600 m2/g, 16.94 nm) and PAC (1,350 m2/g, 15.35 nm) exhibited higher specific surface area and pore size than those of CG and GBFS. FA showed superior adsorption capacity for dominant contaminants in CW and also contributed to the reduction of toxicity rank of CW to acute toxicity (8.3). COD adsorption gradually diffused into the interior with the surface layer of the FA. The adsorption process occurs as multilayer adsorption on a heterogeneous surface and is controlled by various mechanisms. After acid–base modification, the quartz and mullite structures of FA were changed to produce 3MgO•4SiO2•H2O, releasing negatively charged groups within the material and enhancing adsorption. The fluorescence peaks of CW were mainly in Regions III, IV, and V, indicating that the organics in CW were mainly fulvic acid-like, soluble microbial metabolites, and humic acid-like substances. GC-MS analysis showed FA had a significant effect on phenol removal, and typical high-toxicity refractory organic compounds (e.g., indole, pyridine, and quinoline) were also efficiently removed during the pretreatment stage.
Authors’ Contributions
H.X.: Visualization and investigation. J.H.: Visualization and investigation. T.Z.: Visualization and investigation. G.L.: Visualization and investigation. W.L.: Conceptualization, methodology, software, data curation, and writing—original draft. C.H.: Methodology, software, and data curation. P.W.: Conceptualization, methodology, and software. W.C.: Conceptualization, methodology, supervision, software, and validation. S.D.: Data curation. B.L.: Writing—review and editing.
Footnotes
Author Disclosure Statement
The authors declare that they have no known competing financial interests or personal relationships that could have appeared to influence the work reported in this article.
Funding Information
This research was financially supported by the “Jiangsu Provincial Key Laboratory of Environmental Engineering” (grant no. ZX2023001), “Jiangsu Carbon Peaking and Neutrality Science and Technology Innovation Fund” (Grant No. BE2022861), and “Jiangsu Funding Program for Excellent Postdoctoral Talent” (Grant No. 2022ZB775).
Data Availability Statement
Supplemental Material
References
Supplementary Material
Please find the following supplemental material available below.
For Open Access articles published under a Creative Commons License, all supplemental material carries the same license as the article it is associated with.
For non-Open Access articles published, all supplemental material carries a non-exclusive license, and permission requests for re-use of supplemental material or any part of supplemental material shall be sent directly to the copyright owner as specified in the copyright notice associated with the article.