
Abstract
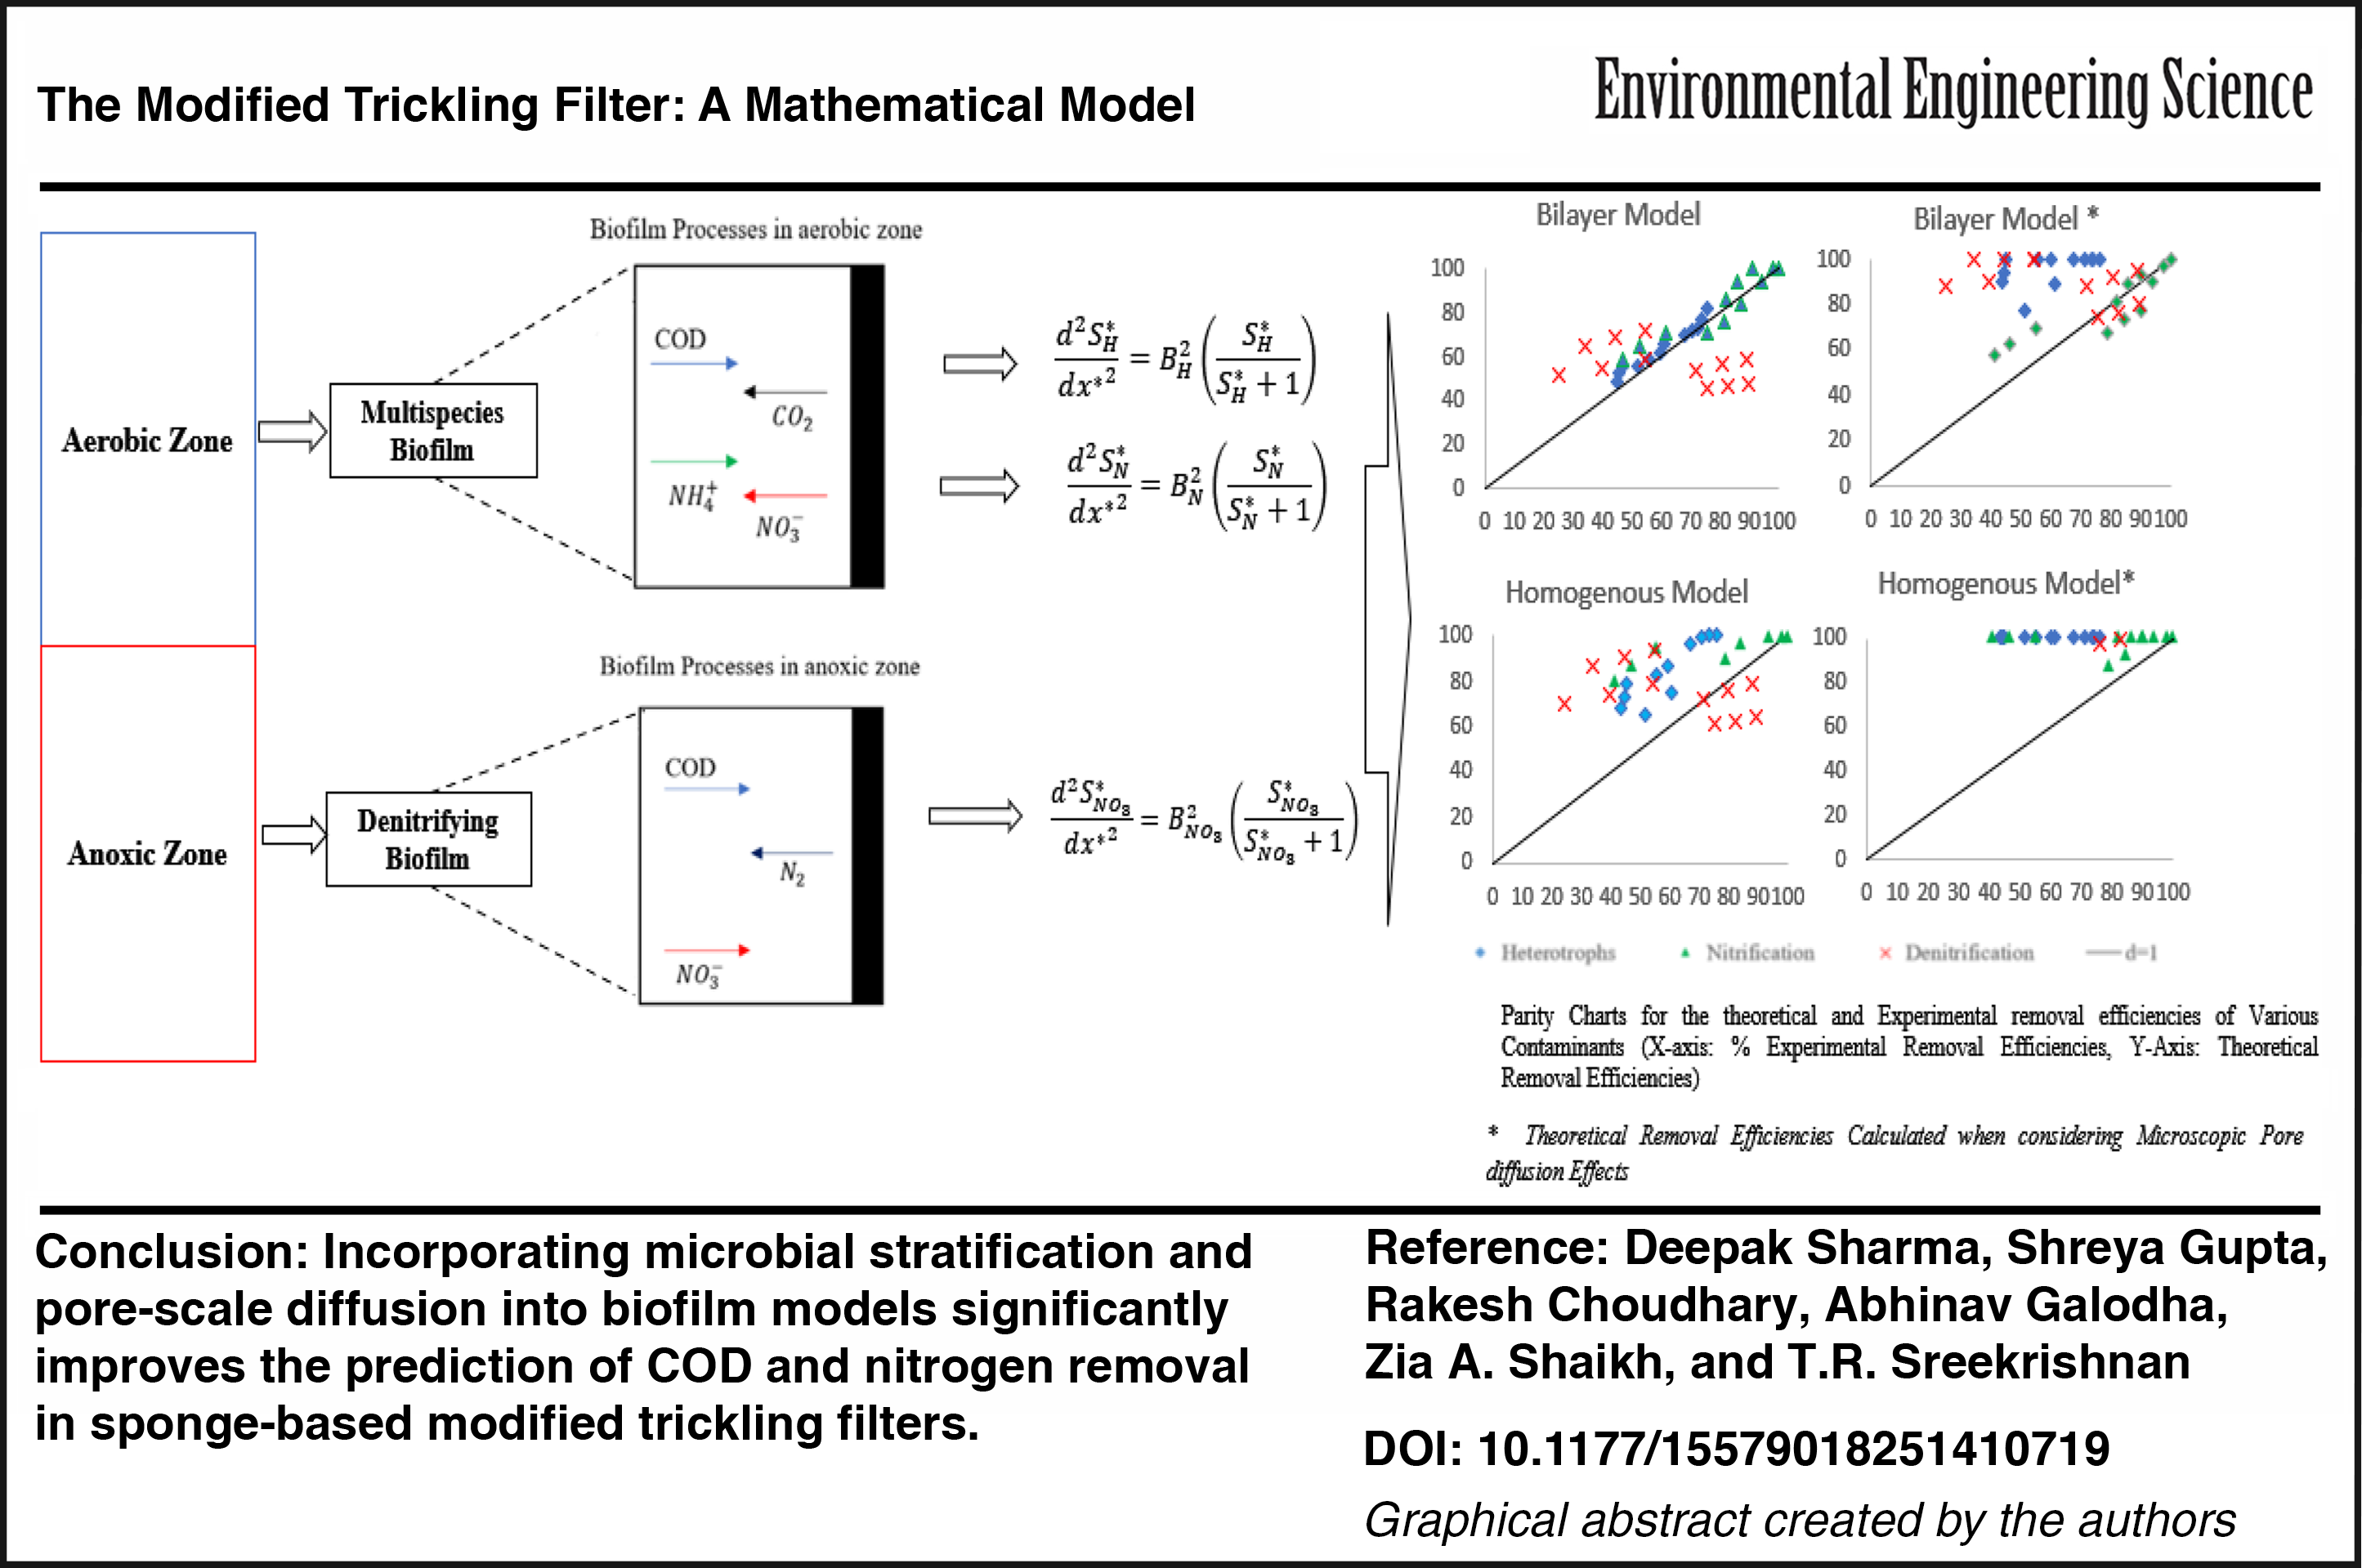
The primary objective of this study is to develop a modified trickling filter (MTF) mathematical model that addresses limitations of conventional biofilm models, including their inability to capture microbial stratification, simultaneous nitrification–denitrification, and diffusion effects in porous sponge media. Under fixed-bed circumstances, the MTF uses a polyurethane sponge medium to promote biomass adhesion and proliferation. The two main zones of the MTF are aerobic and anoxic. Heterotrophic organic carbon oxidation and nitrification are both carried out concurrently in the aerobic zone. The two main zones of the MTF are aerobic and anoxic: heterotrophic organic carbon oxidation and nitrification occur in the aerobic zone, whereas denitrification proceeds in the anoxic zone. The model integrates three components: a compartmental reactor flow model (axial plug-flow representation of completely mixed biofilm reactors), a biofilm kinetics module (substrate conversion by heterotrophs, nitrifiers, and denitrifiers), and a porous-media diffusion module (effective diffusion via the Millington–Quirk relationship). Within the biofilm, both bilayer distributions (heterotrophs outer, nitrifiers inner) and homogeneous distributions were evaluated. Model predictions were validated against experimental data (influent COD = 119–161 mg L−1, NH3-N = 29–35 mg L−1, hydraulic residence times = 2–4 h, with/without recycle) using parity charts and statistical indices. The bilayer biofilm with pore diffusion provided the most accurate results, with Willmott’s index of agreement (d) = 0.95 for COD, 0.95 for Ammoniacal Nitrogen (NH3-N), and 0.94 for Nitrate Nitrogen (NO3-N) and relative errors (RE) of 0.05–0.07, compared with d ≤ 0.47 and RE ≥ 0.24 for the homogeneous model. These findings confirm that incorporating stratification and pore diffusion significantly improves model performance. The framework not only clarifies COD, NH3, and NO3 removal mechanisms in sponge-based MTFs but also offers design guidance on recycle ratios and porosity thresholds for enhanced operation.
Graphical Abstract
Keywords
Introduction
Wastewater treatment has been a global concern for decades. The first known biological wastewater treatment systems utilized beds filled with rocks in 1901; however, the mechanism involved was unknown for many decades of the 20th century (Peters and Alleman, 1982). The concept of trickling filters that commonly utilize pebbles and Raschig rings originated from this ancient way of water filtration. The simple mechanism of biomass immobilization on a solid support, involved in the trickling filter, makes it even more easily applicable. With the invention of various microscopic techniques, researchers became able to visualize the slime layer coated on the rock surface, known as biofilm (Bakke and Olsson, 1986; Chatterjee et al., 2014; Cooke, 1959; Costerton et al., 1978; Palmer and Sternberg, 1999; Seymour et al., 2004). Many scientists worked on improving the efficiency of trickling filters; however, the mechanism of pollutant removal was still unknown. Two researchers named Germain and Schulze established empirical correlations for the treatment efficiencies of trickling filters (Germain, 1966; Schulze, 1960). These correlations helped determine the experimental efficiencies of typical trickling filters for limited conditions, but still could not explain the mechanism of nutrient removal.
The mathematical model can offer a far more comprehensive approach to system analysis. Rather than doing tests under particular settings, researchers may examine all treatment-related elements and processes using a mathematical model as well as how changing one parameter might impact the entire system. The 1970s saw the development of fundamental analytical techniques by several authors who used mathematical modeling in wastewater treatment. These techniques assume that the biomass in the biofilm is equally distributed across the biofilm matrix and that the biofilm is a continuum. For suspended culture systems, the simple Monod growth kinetics can be the most effective (Alsaeed et al., 2023; Nuhoglu et al., 2005), but it would not work for biofilm systems. To simulate a biofilm reactor, one of the main goals is to examine biofilm kinetics because the transport is diffusion limited. The mass movement of nutrients across the biofilm matrix via microbial breakdown and diffusion was taken into account by the fundamental biofilm model (Costerton et al., 1978; Rittmann and McCarty, 1980). Diffusion and microbial reactions with Monod kinetics are included in the biofilm model. The biggest obstacle is that the Monod growth kinetics is a variable order, and there is no analytical solution to that equation (Rittmann and McCarty, 1978). These analytical limitations of classical Monod-based biofilm formulations underscore the need for advanced modeling frameworks that explicitly account for diffusion limitations and biofilm structure.
The analytical solution of the model exists only under two circumstances. Either it can be presumed to be the first order when the concentration of the substrate is less than the Monod half-saturation constant, or Monod kinetics simply decreases to zeroth order when the substrate concentration is significantly higher than the half-saturation constant (Haug and Mccarty, 1972; Mulcahy and La Motta, 1978). Since substrate concentrations in biofilm kinetics are not always in high or low ranges and both situations are severe, two methods might be used: half-order kinetics, which involves averaging the analytical solutions of first-order and zeroth-order kinetics (Harris and Hansford, 1976; Rittmann and McCarty, 2001), which is an erroneous approximation. The second method, on the other hand, is numerical and uses an appropriate software program to solve the model with a minimal margin of error (Kissel et al., 1984; Versteeg and Malalasekera, 2007). The solution of the biofilm model is necessary for the biofilm reactor modeling. To determine the substrate mass flow into the biofilm surface, the biofilm model solution is utilized. The model of the reactor is developed using the mass flux. The biofilm model was seen as a uniform layer of microorganisms in the 1970s and early 1980s. These models may be used to investigate a number of phenomena, such as mass transport, molecular diffusion, and substrate utilization kinetics. With a single species and a single limiting substrate, these models presupposed a steady-state methodology (Jennings et al., 1976; Williamson and McCarty, 1976). The idea of steady-state biofilm thickness is presented by Rittmann and McCarty. In their study of substrate usage to biofilm growth, they found that biofilms maintain a consistent thickness, have no net growth or decay, and have identical rates of biomass growth and decay (Williamson and McCarty, 1976).
The biofilm modeling method used in previous studies worked well for assessment systems that have a single dominating process (such as COD removal or nitrification). These techniques were not very effective in predicting the precise distributions of various microorganisms, the conversion of many substrates, the overall buildup of biofilms, or the intricate structure of biofilms. Using a continuum method, several authors provided a more explicit depiction of a multispecies dynamic biofilm model. The model forecasts the impact of variations in biofilm thickness (Wanner and Gujer, 1986). The basic model was expanded into a more complex representation around 10 years later, representing biomass as particulate components and an extracellular matrix as a liquid phase. The model also incorporated impacts on the liquid fraction of the biofilm created by the displacement of particulates within the matrix. The biomass was considered to be fixed in the biofilm in the previous model. Particulate flow was also taken into account by the model (Wanner and Reichert, 1996). A concise timeline summarizing the evolution from conventional trickling filters to sponge-based modified trickling filters (MTFs) is provided in Supplementary Figure S1. The biofilm reactor may be modeled with the help of the recently established biofilm kinetics model, which is based on a dimensionless quantity called “biofilm number B” (Sharma et al., 2022).
Sponge carrier media are widely reported to enhance biomass retention and improve nitrification and denitrification compared with conventional rock or plastic media, primarily due to their high porosity and large specific surface area (Deguchi and Kashiwaya, 1994; Mattei et al., 2018; Morgenroth, 2020; So et al., 2014). The extent of improvement varies with operating conditions such as loading, recycle ratio, and sponge porosity, whereas excessive pore clogging can reduce permeability and slow reaction rates (So et al., 2014). Recent studies further confirm the relevance of sponge-based carriers: Jiang et al. (2021) demonstrated improved pollutant removal using modified polyurethane (PU) sponge fillers in moving bed biofilm reactors (Jiang et al., 2021); Wang et al. (2022) showed that PU sponge carriers enhance substrate diffusion and removal efficiency in biofilm electrode reactors (Wang et al., 2022); and Chalipa et al. (2024) reported effective pharmaceutical removal in sponge-based MBBRs (Chalipa et al., 2024). These findings highlight that sponge morphology, porosity, and maintenance practices (e.g., backwashing to prevent clogging) remain critical design variables in current applications.
Building on these insights, this study develops and validates a mechanistic multispecies model of the MTF that, unlike prior biofilm models, explicitly incorporates microbial stratification (homogeneous vs. bilayer structures) and pore-scale diffusion in PU sponge carriers. Adapted from Sharma et al. (2022), the model integrates heterotrophic and nitrifying kinetics and was tested against nine experimental datasets (influent COD = 119–161 mg L−1, NH3-N = 29–35 mg L−1, hydraulic residence time [HRT] = 2–4 h, with and without recycle). Validation showed that the bilayer model with pore diffusion achieved Willmott’s index of agreement (d) ≈ 0.95 and relative error (RE) ≤ 0.07 for COD, NH3-N, and NO3-N removal compared with d ≤ 0.47 and RE ≥ 0.24 for the homogeneous model.
Materials and Methods
The MTF’ description
The two zones that make up the MTF are the anoxic zone at the bottom and the aerobic zone at the top (Fig. 1). After entering the aerobic zone, the influent wastewater descends into the anoxic zone. As a carrier material for biomass immobilization in both zones, the PU sponge is used. Anoxic conditions are maintained in the bottom zone, whereas holes are positioned on the aerobic zone’s edge for natural aeration. In the aerobic zone, heterotrophs and nitrifiers use oxygen to oxidize substrates of organic carbon and ammonia, respectively. For heterotrophic denitrification, the oxidized products are transferred to an anoxic zone.
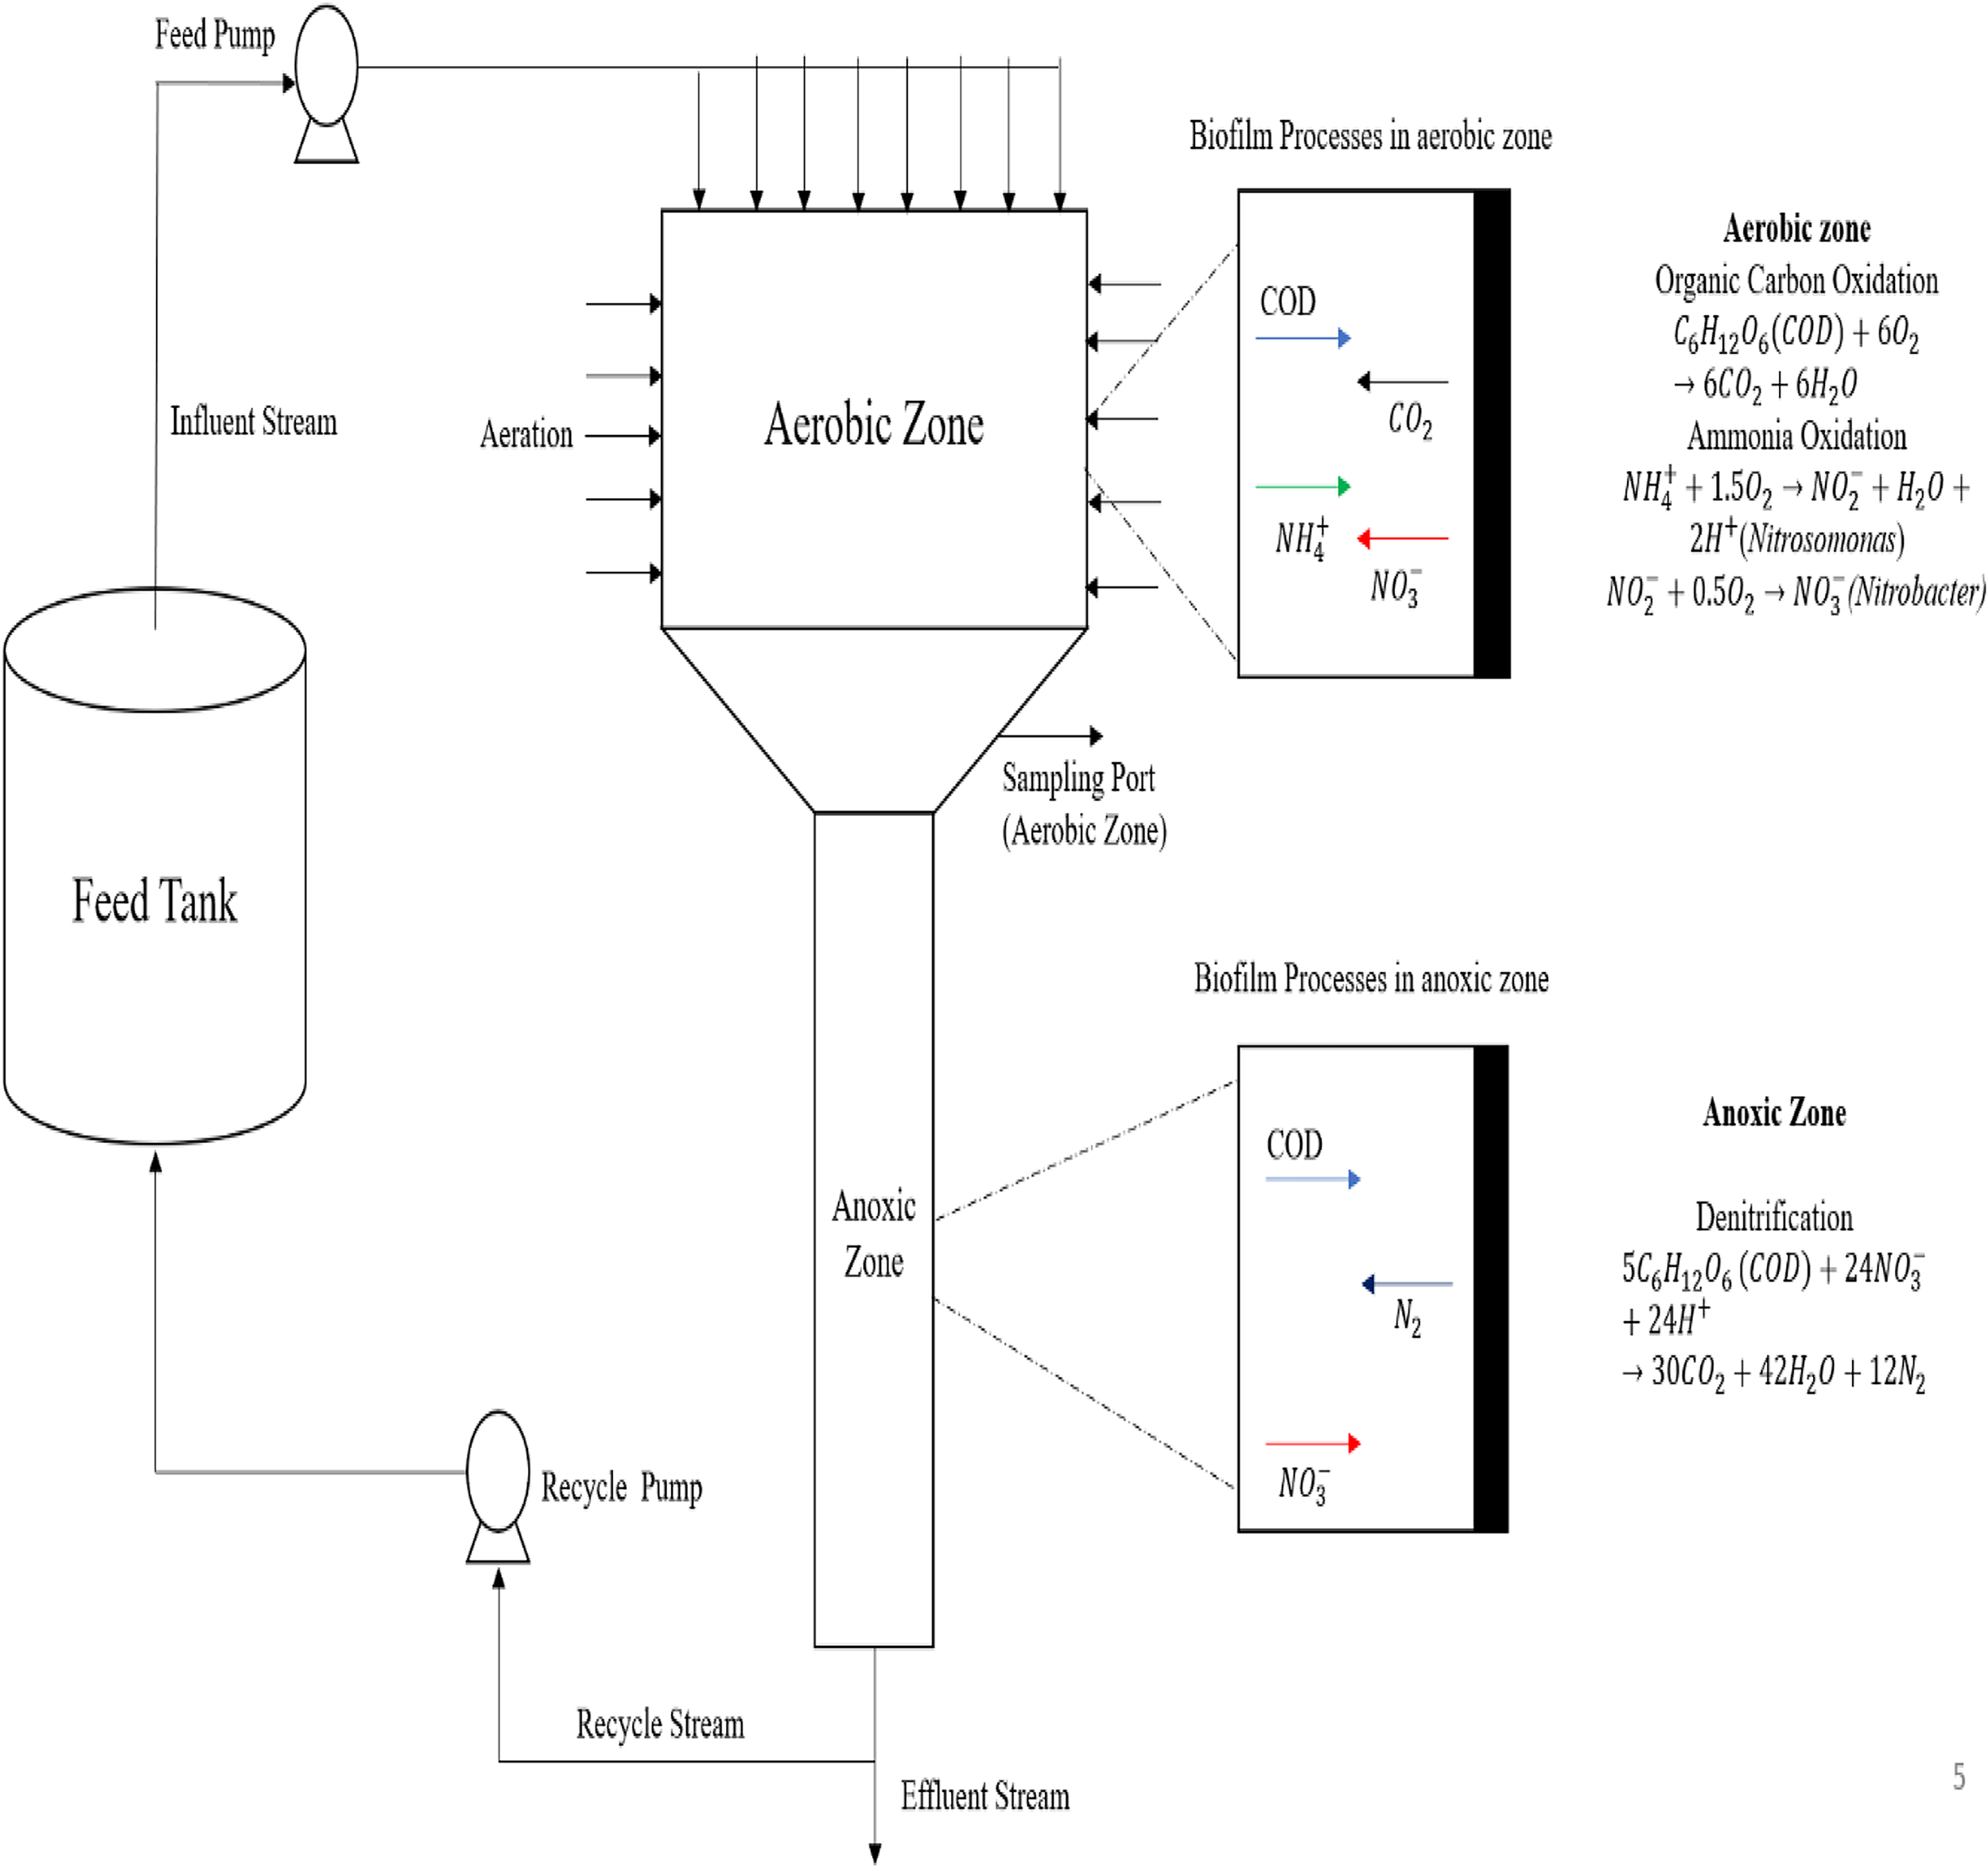
Schematic diagram of a modified trickling filter.
Biofilm processes
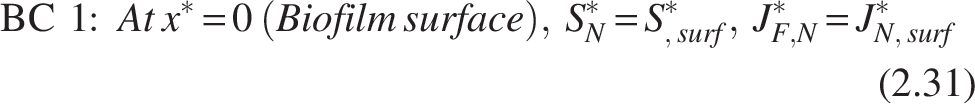
The aerobic zone consists of a biofilm containing two species: (1) nitrifiers and 2) heterotrophs. To flourish, the heterotrophs need oxygen and organic carbon. Heterotrophic metabolism is represented by the following equation:

This oxidation process provides energy for the growth of bacteria. In conjunction with heterotrophs, the nitrifiers also utilize oxygen for their growth. In two steps, the two nitrifier species convert ammonia substrate into nitrate: (1) Ammonia is converted to nitrite by nitrosomonas, nitrosospira, and nitrosococcus species (Burrell et al., 1999), and (2) nitrite is oxidized into nitrate by nitrobacter; the reaction is as follows:


Both species, as autotrophic nitrifiers in wastewater treatment systems, can be categorized as a single, wide species (Horan, 2004; Wanner et al., 2006). Biofilm containing facultative heterotrophs makes up the anoxic zone, which receives the wastewater from the aerobic zone. The anoxic zone lacks oxygen; therefore, the heterotrophs change their metabolism to use nitrates as terminal electron acceptors. This results in heterotrophic denitrification. The reaction is shown as follows:

Denitrification reduces oxidized nitrogenous compounds to nitrogen gas (Payne, 1981).
Model development
To develop the mathematical model for the MTF, the following elements are needed: (1) Biofilm model, (2) reactor model, and (3) reactor flow model and are covered in this section.
The following presumptions were used for modeling:
The biomass within the biofilm is treated as a continuum (Sharma et al., 2022). The substrate has negligible mass-transfer resistance in the bulk liquid phase. Substrate movement inside the biofilm is described by Fick’s law of diffusion (Wanner et al., 2006). The diffusivity within the biofilm is assumed to be 80% of the diffusivity of that substrate in water (Morgenroth, 2020; Rittmann and McCarty, 2001; Wanner et al., 2006). The reaction within the biofilm follows Monod growth kinetics (Wanner et al., 2006). Steady-state conditions exist everywhere. The basis of steady-state biofilm is taken from the literature (Sharma et al., 2022). Only diffusive transport and microbial response inside the biofilm are taken into account (Wood and Whitaker, 1998). All components are assumed to be transported normally to the substratum. The heterotrophic and nitrifying metabolism are substrate limited, and oxygen is assumed to be abundant. The biofilm has a uniform biomass density.
Biofilm model
Two species make up the biofilm in the aerobic zone: nitrifiers and heterotrophs, as discussed in the “Biofilm Processes” section. Because both groups depend on oxygen, there is potential competition for oxygen consumption. For simplicity, oxygen was assumed to be abundant in the biofilm. Given their distinct growth rates (heterotrophs as fast growers, nitrifiers as slow growers), heterotrophs are typically found near the outer layer and nitrifiers deeper within the biofilm. In this study, bilayer and homogeneous arrangements were prescribed as alternative configurations rather than emergent predictions, to explicitly test their impact on model outcomes. The bilayer structure represents stratification supported by earlier experimental and modeling studies (Rittmann and Manem, 1992; Wanner and Gujer, 1985; Wanner and Reichert, 1996; Watanabe et al., 1995), whereas the homogeneous case was included as a control scenario where heterotrophs and nitrifiers are evenly distributed across the biofilm volume. Click or tap here to enter text. For the anoxic zone, it was assumed that only facultative heterotrophs were present, following facultative aerobic metabolism. This zone was therefore modeled as a single-species biofilm.
The biofilm model’s derivation
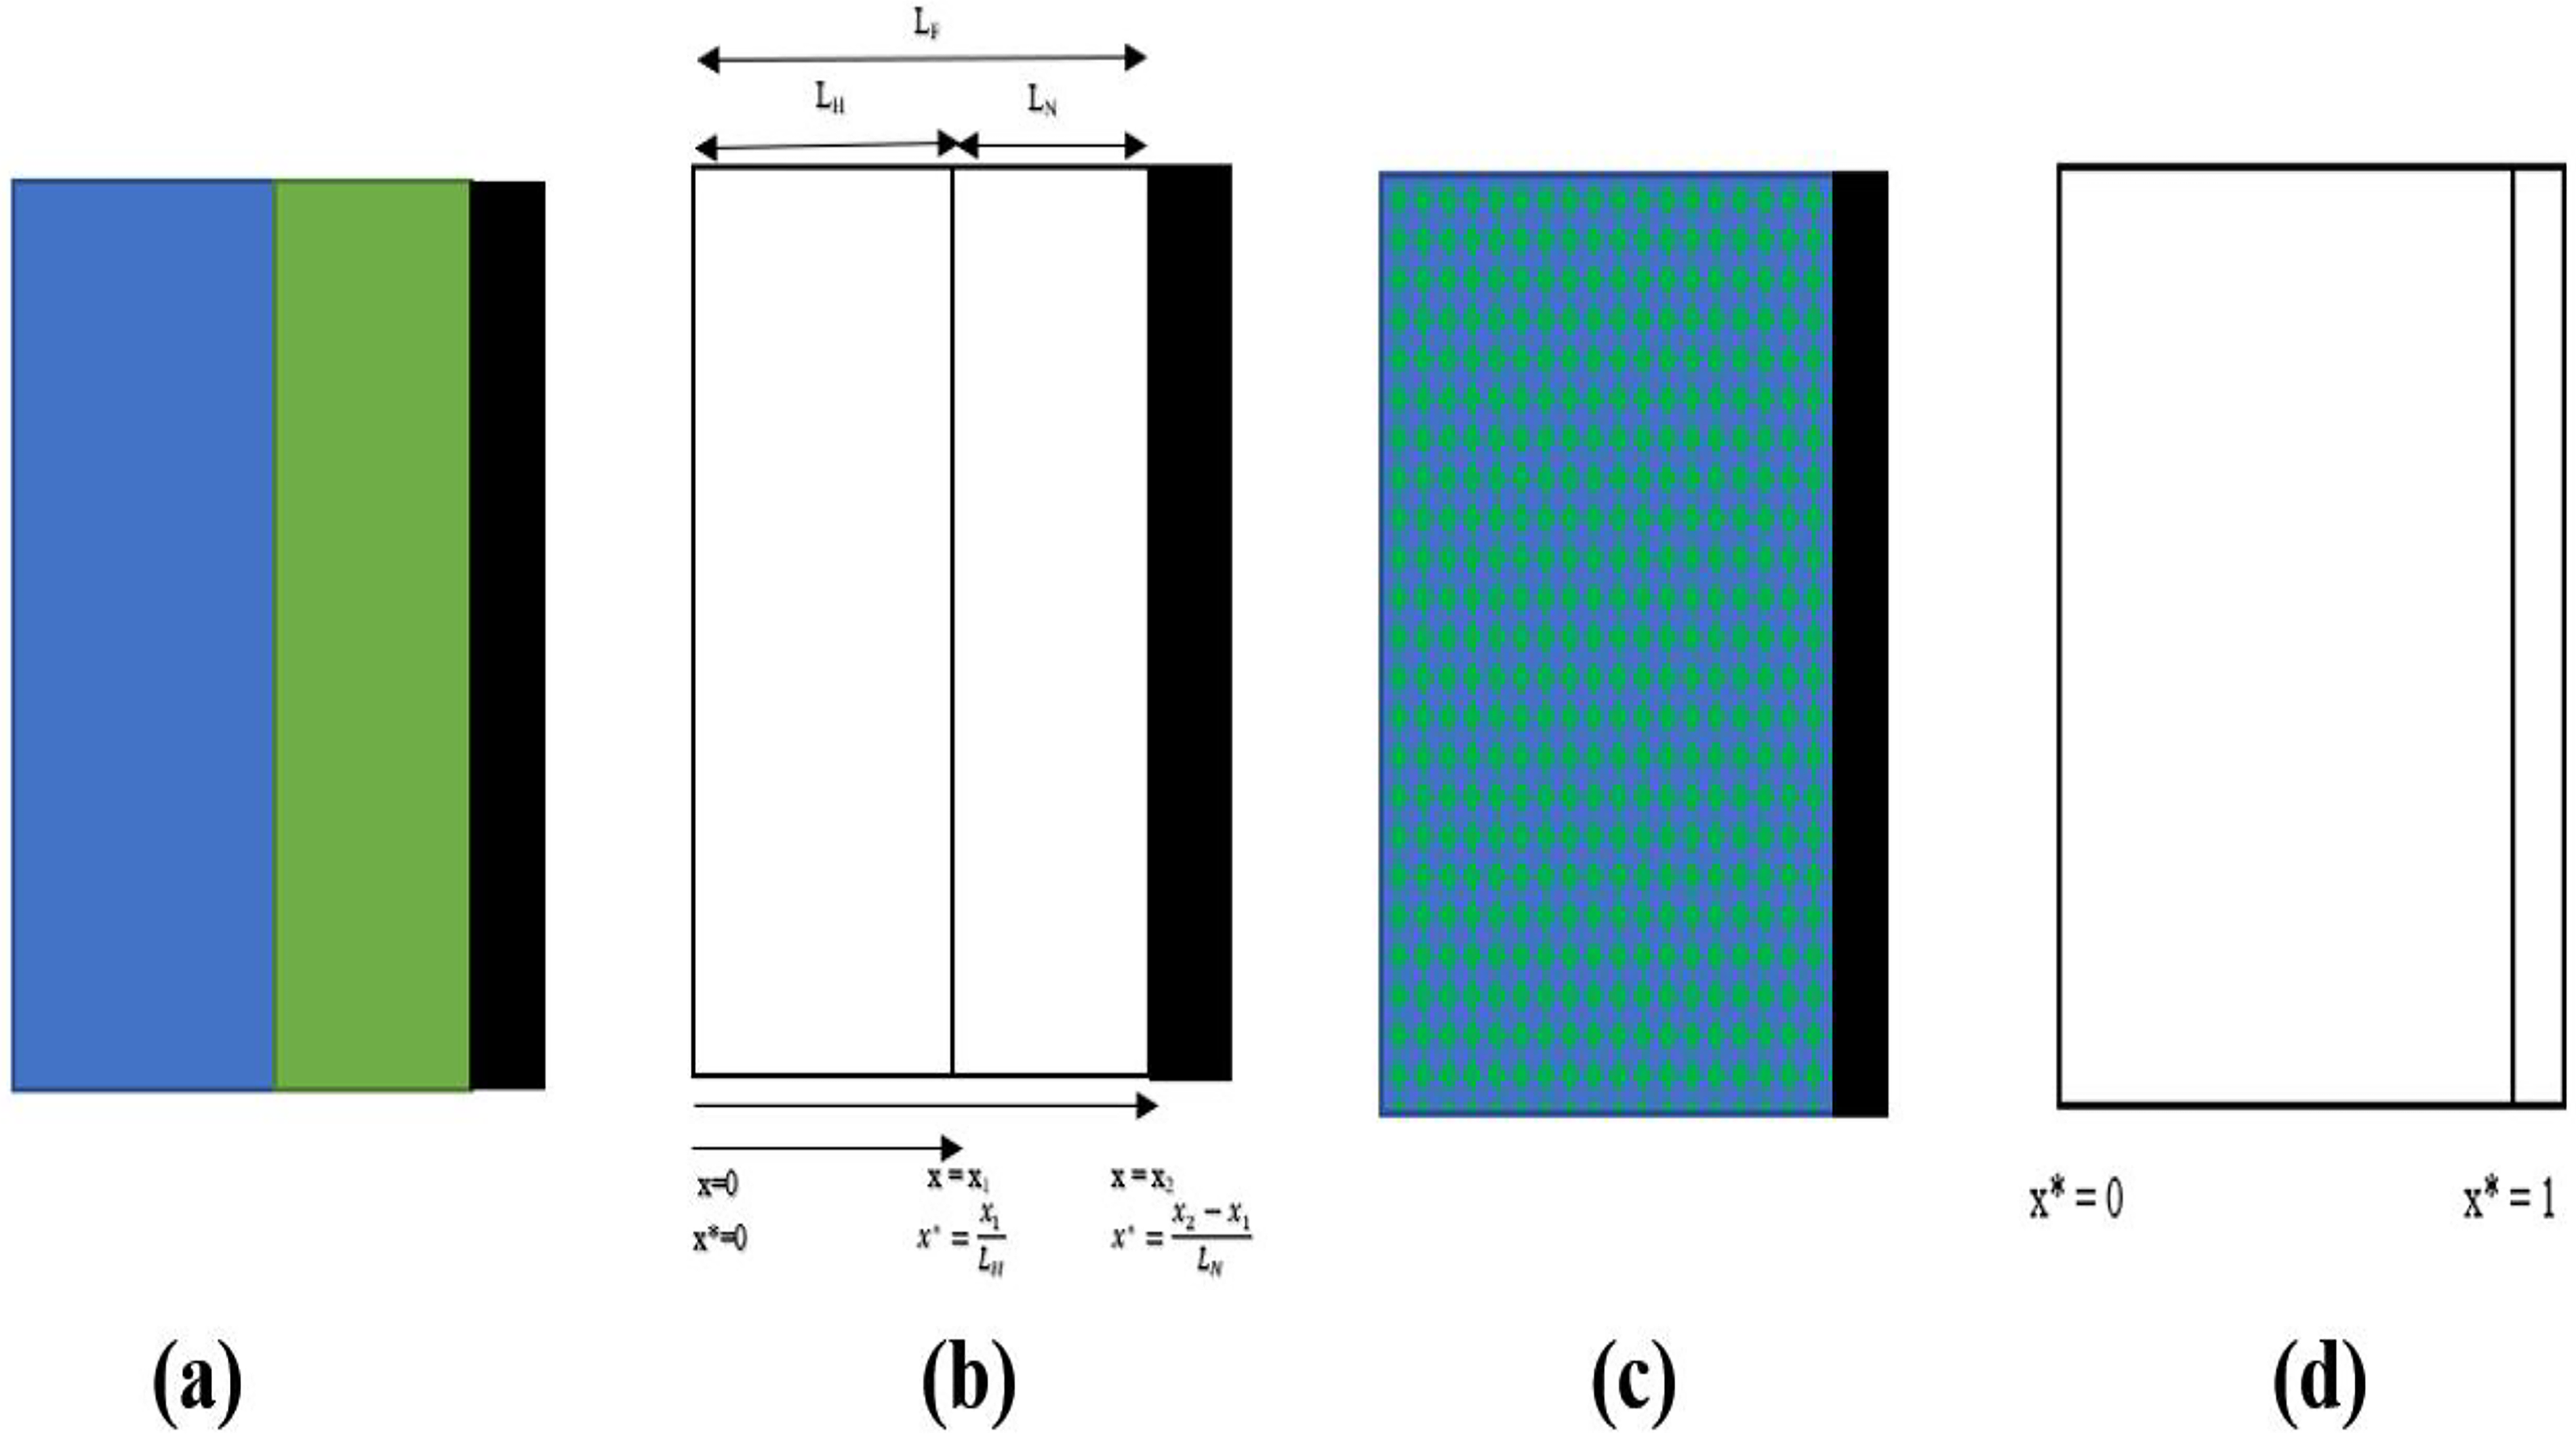
To determine the substrate consumption kinetics inside the differential section of a biofilm adhering to the carrier, the biofilm model is derived using the microscopic mass balance. This section covers the derivation of the two types of aerobic biofilm models (1) bilayer biofilm model [Fig. 2(a)], (2) homogeneous biofilm [Fig. 2(c)], and (3) denitrifying biofilm.
Bilayer biofilm model
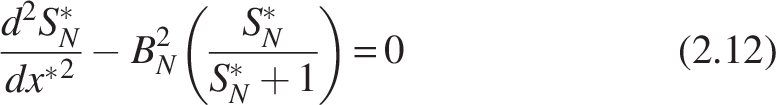
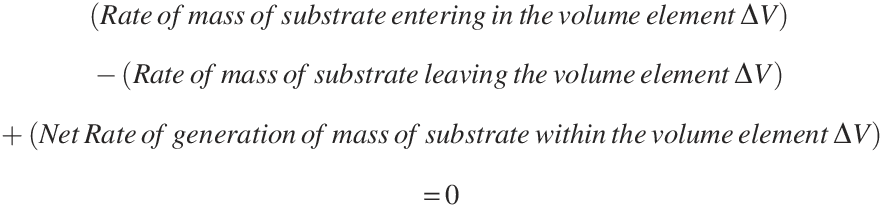
General steady-state component mass balance within a biofilm can be written as follows:
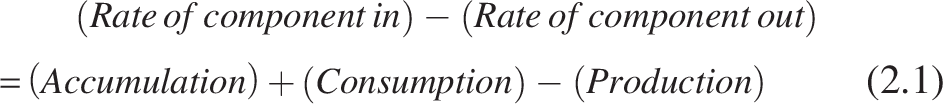
At the steady state, accumulation = 0. The mass balance equation’s component degradation and production terms describe the kinetics of the corresponding component-degrading/producing microbial group.
Consider a layer of biofilm thickness Δx within the biofilm, applying mass balance for a species whose mass flux JF moving across the Δx element is written as:

Applying Taylor’s series, for
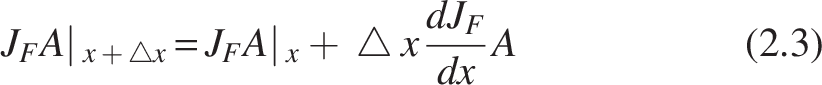
Substituting (2.3) in (2.2),

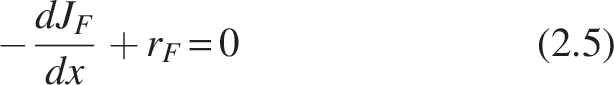
Rearrangement of the equation, as rF is a degrading term,
According to Monod kinetics
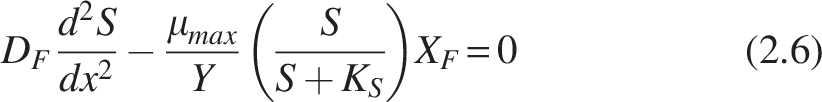
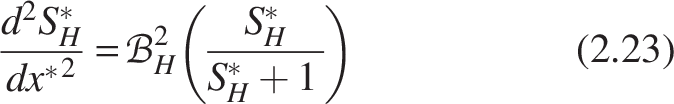
For bilayer biofilm Equation (2.6) is as follows:
Heterotrophs
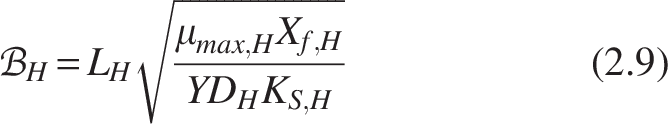
Rearranging the equation into dimensionless form by substituting
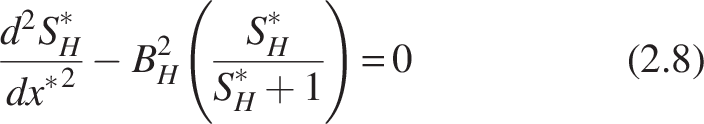
Where
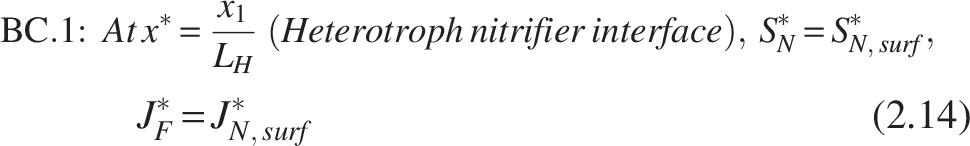
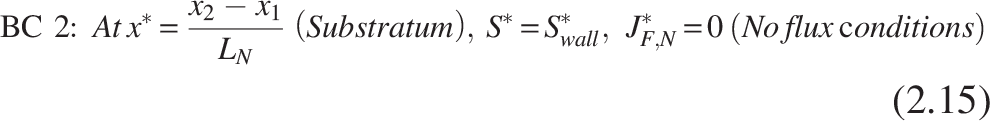
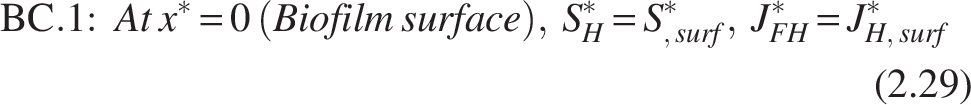
The boundary conditions [refer Fig. 2(b)] for the heterotrophic layer are
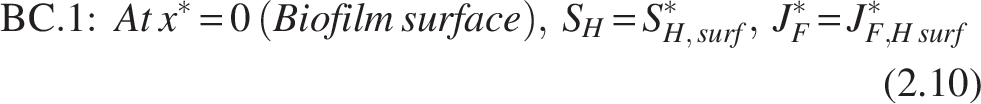
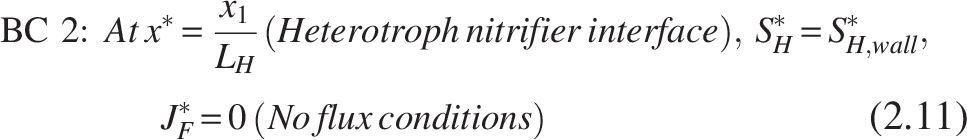
Note: The inner layer, which primarily consists of the nitrifiers, is thought to be completely penetrated by the COD substrate, leaving the heterotroph–nitrifier interface flux free.
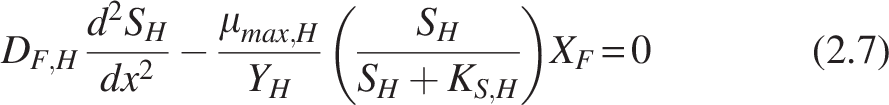
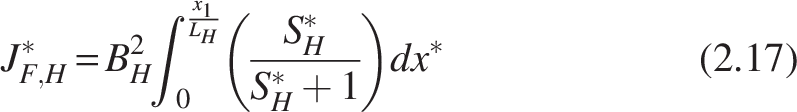
Similarly, for nitrifiers:
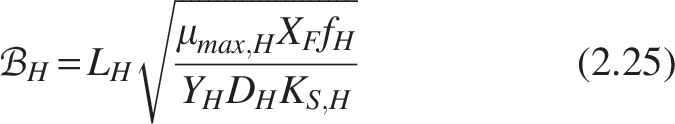
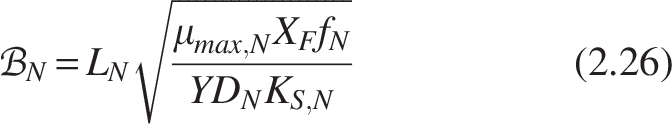
Like Equation (2.8), the biofilm number for the nitrifiers within the biofilm can be written as
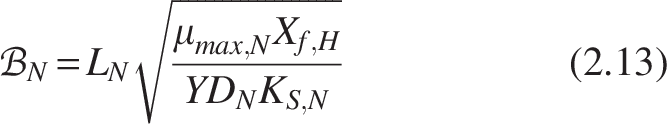
The boundary conditions [refer Fig. 2(b)] for the nitrifiers are
Note: Similarly, the heterotrophic layer has been entirely penetrated for ammonia substrate (SN*), which leads to substrate consumption and provides no hindrance to mass transfer.
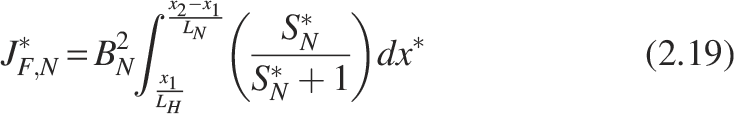
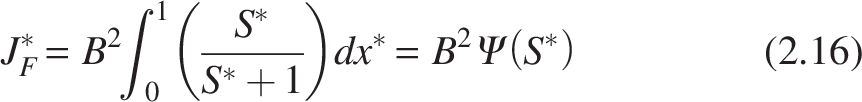
From the previous work (Sharma et al., 2022), the derived expression for the dimensionless flux for the single rate-limiting substrate and single-species model is given by
The expression for dimensionless flux is derived from the Equations (2.5) and (2.15) as follows:
For heterotrophs
Where
Similarly, for nitrifiers


Where
Homogeneous biofilm model
Given that the nitrifiers and heterotrophs have volume fractions fH and fN [refer Fig. 2(c)], respectively, the biomass density of the two groups inside the biofilm is determined by


Heterotroph model equations can be derived from Equation (2.8) as follows:
In the same way, for nitrifiers
The biofilm numbers for heterotrophs and nitrifiers can be formulated for the homogeneous model by substituting Equations (2.21) and (2.22) as follows:
The expression for the dimensionless mass flux for heterotrophs and nitrifiers from Equation (2.16) can be written as


Heterotrophs [refer to Fig. 2(d)]:

Nitrifiers [refer to Fig. 2(d)]:

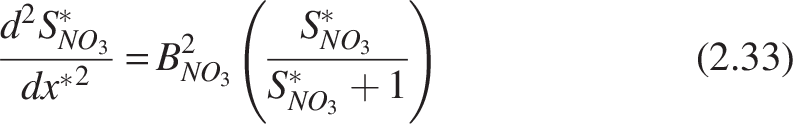
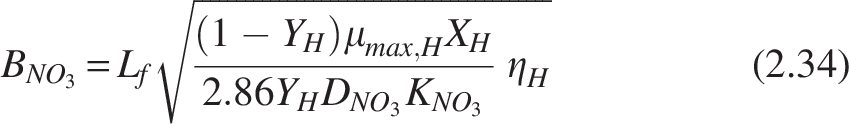
Biofilm model for denitrification
Stoichiometric Table for the Microbial Processes
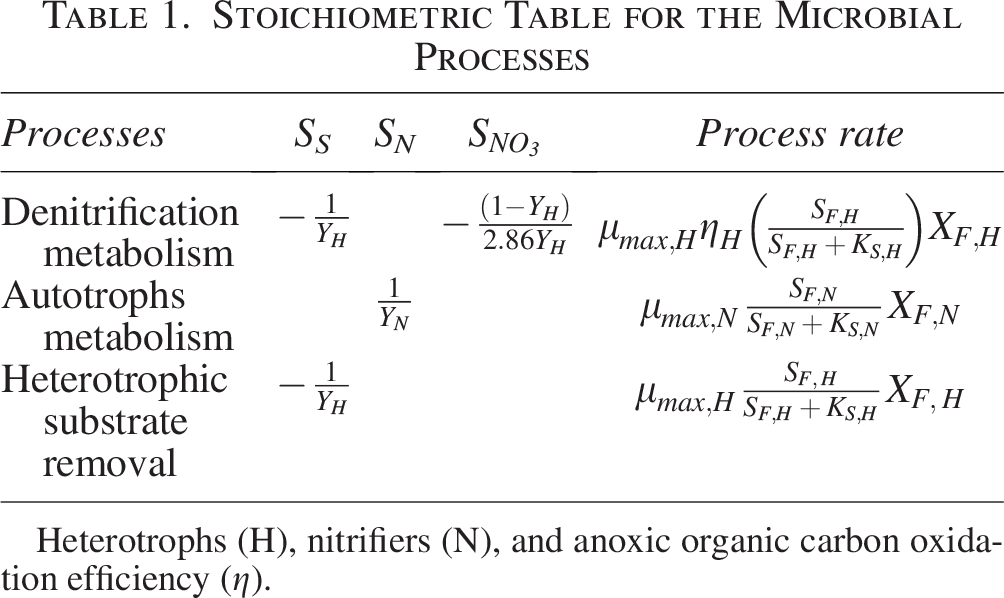
Heterotrophs (H), nitrifiers (N), and anoxic organic carbon oxidation efficiency (η).
Stoichiometrically, 1 gram of nitrate oxidizes 2.86 grams of COD substrate

Model for porous media
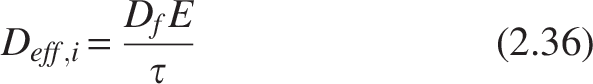
The PU sponge media used in the MTF is different from regular Raschig rings and other nonporous media. Biofilm in Raschig rings or rocks may be consistent in thickness; however, in the pore network of a PU sponge, biofilm may vary in architecture depending on the microscopic pore structure. The hydrodynamic conditions and pore structure have a major impact on pore diffusion and biomass morphology (Rittmann, 1993). The attachment mechanism in the porous medium of biomass differs from that of the smooth surface. The effective diffusion coefficient will take the place of the standard diffusion coefficient if pore diffusion is taken into account in the system. The definition of the effective diffusion coefficient is

While the Millington–Quirk formulation is widely applied for soils and granular porous media, its direct application to sponge carriers should be interpreted with caution. Sponge matrices differ structurally, exhibiting interconnected pores, higher tortuosity, and variable compression under flow, which may affect effective diffusivity estimates (Jiang et al., 2021; Mattei et al., 2018; So et al., 2014). Here, it is used as a first-order approximation, consistent with prior biofilm modeling studies.
This representation assumes constant porosity and tortuosity for the sponge medium. Although pore clogging and occlusion are known to reduce effective diffusivity and permeability in practice (So et al., 2014), these dynamic effects were not explicitly modeled here. Instead, the present model uses fixed E and τ values derived from literature and experimental measurements. Observed trends from prior studies suggest that excessive pore clogging can lower effective diffusivity and thereby reduce reaction rates, but in this framework, such effects are only acknowledged qualitatively and not mechanistically simulated.
Reactor model
The global mass balance on a differential axial portion of the reactor column is used to create the reactor model. (1) The compartment model and (2) the flow model comprise the reactor model. Each differential section or compartment of a trickling filter can be considered a completely mixed biofilm reactor (CMBR) (Rittmann and McCarty, 2001; Wik, 2003). CMBRs are assumed to be connected in series in this flow model, resulting into a plug-flow reactor (PFR) design.
Compartment model: CMBR
The CMBR could potentially be considered as a typical biofilm reactor. Bulk flows through a CMBR after the biofilm has been completely mixed in one compartment. The whole resultant would behave like a chemostat.
Flow model: CMBRs in series
The trickling filter modeling assumes that the CMBRs are connected in series. CMBRs connected in succession would produce a PFR overall. The uniform distribution of the influent in a deceiving filter eliminates the assumption of radial flux fluctuation. The rate of reaction or flux will fluctuate in the reactor’s axial direction due to the plug-flow nature (Rittmann and McCarty, 2001; Wik, 2003).
Derivation of the reactor model
The reactor model is derived by applying the steady-state mass balance axially to the differential reactor volume element ΔV (Fig. 3a). This element assumes that the substrate’s conversion is ΔX, as shown below:

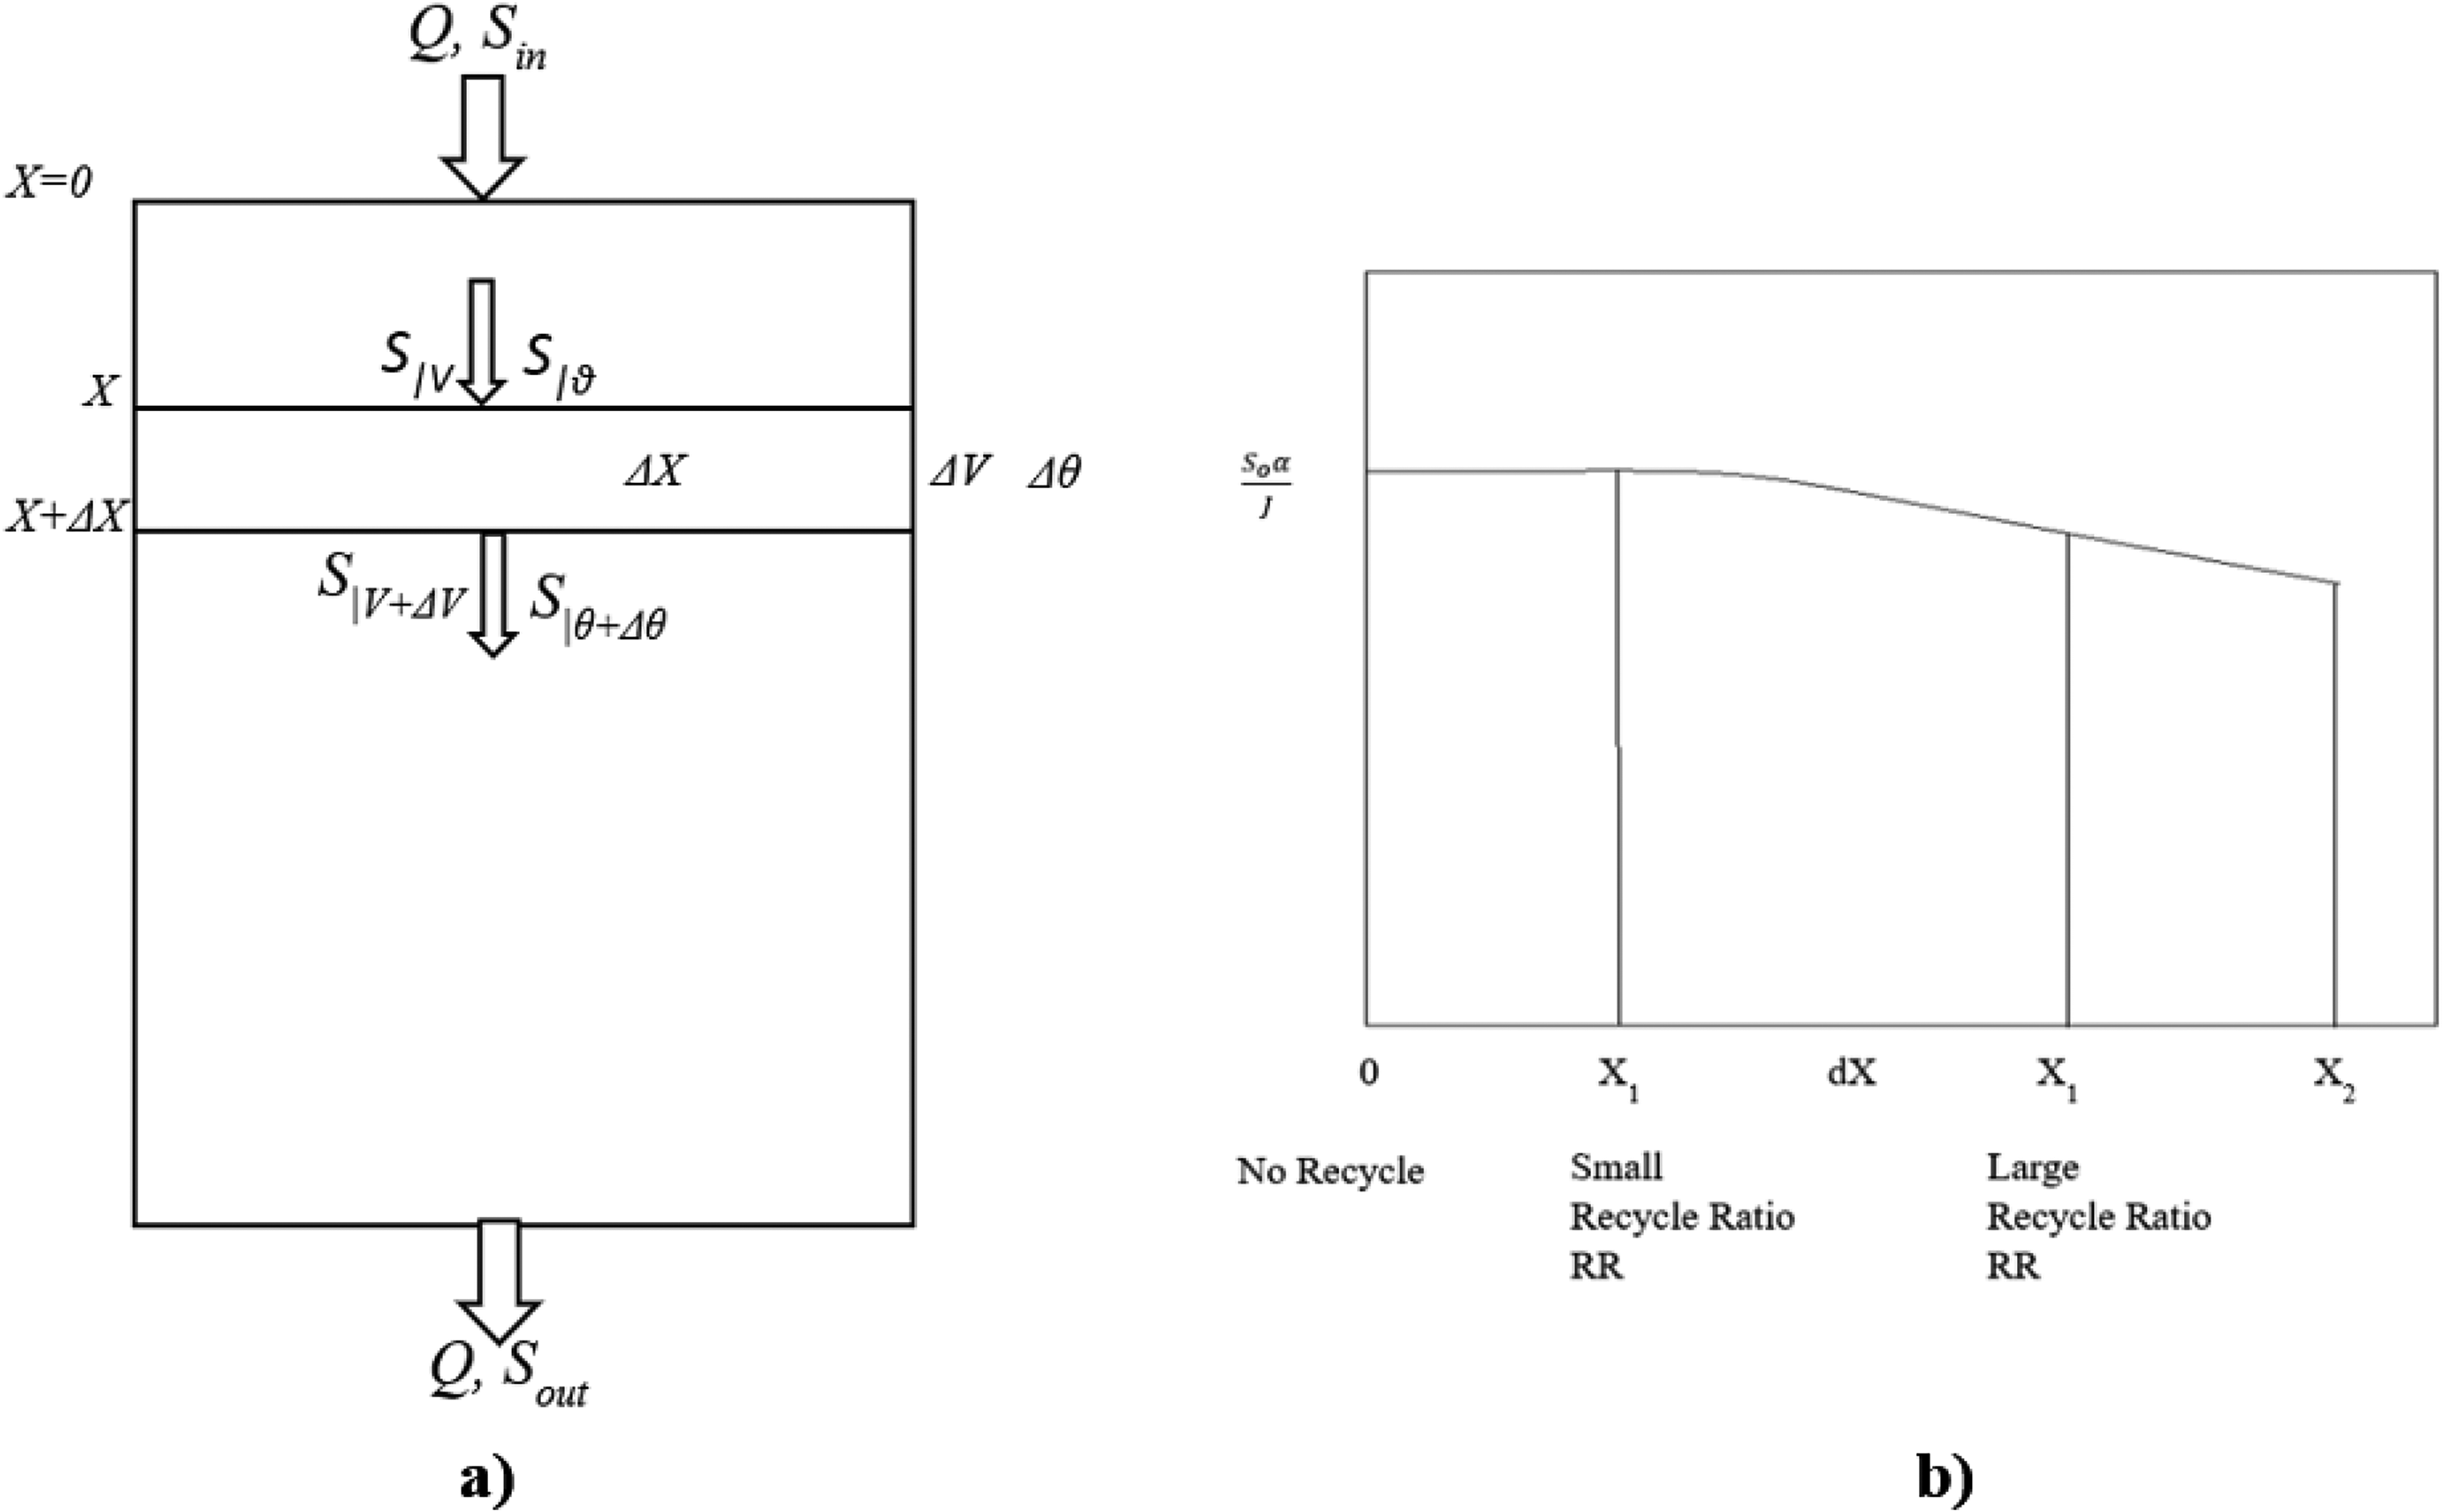
Where a is the specific surface area (cm−1) of the media on which biofilm is attached, Ri = -Jia, Ji = mass flux (mg cm−2 day−1) in the biofilm in the ith compartment of the CMBR, and Q is the volumetric flow rate (cm3/day).
Dividing S|V in the equation on both sides, we get
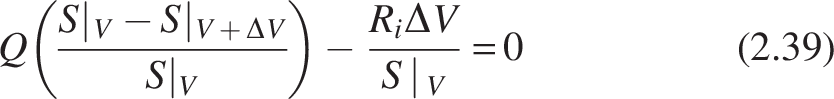
Substituting 
The Levenspiel equation can be obtained as follows:
Taking limits 
If the reactor has void volume fraction Φ, then the equation becomes
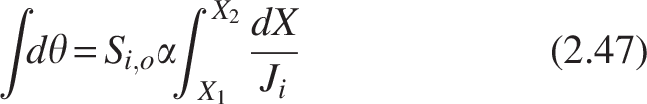
Rearranging and separating the variables and integrating under limits X1 = 0 at V1 = 0, X2 = X to V2 = V, we get
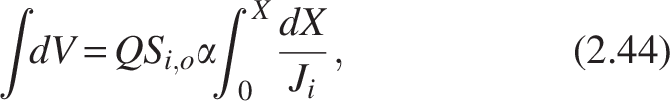
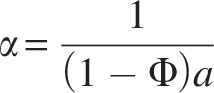
The equation is known as the Levenspiel equation for computing the volume and area under the curve
Where group constant,
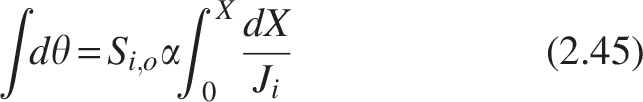
Dividing the equation by Q into both sides converts the Levenspiel plot in HRT, θ, as follows. This can be considered as modified Levenspiel equation and is given by
The curve between
Recycle reactor model
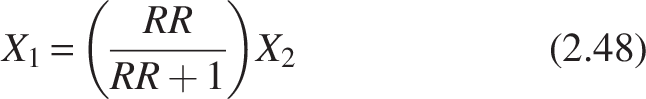
As previously stated, the trickling filter can be seen as a PFR. For PFR with recycle, the recycling ratio (RR) is
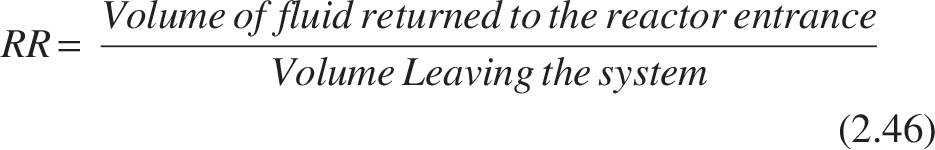
The range of the RR is zero to infinity. The reactor exhibits pure plug-flow behavior when RR = 0; at RR = ∞, the system acts more like a mixed-flow reactor. In a PFR, recycling results in reverse mixing.
Rearranging the reactor’s equation with recycling and using the mass balance is
In this equation,
The recycle in the trickling filter results in back mixing. The HRT, θ calculated using the modified Levenspiel plot is as follows:
For the nonrecycled system, the integral dθ can be evaluated under the limits For recycle system, the integral dV is evaluated under the limits
The modified Levenspiel plot (Fig. 3b) demonstrates that the area under the curve reaches its maximum when the initial restriction is zero. When recycling is used, the initial limit shifts to the right, resulting in a smaller area under the curve with an increasing recycle ratio. As a result, less HRT is required to achieve the same conversion as if the system had not been recycled.
Solution procedure
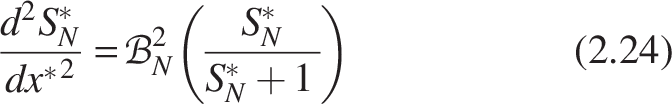
The rate law expression equations obtain the solution of the biofilm model for heterotrophs (Eqs. 2.18, 2.24), nitrifiers (Eqs. 2.20, 2.25), and denitrifiers (Eqs. 2.34) for two types of biofilms (bilayer and homogeneous). The values of biofilm kinetic function Ψ(SH*), Ψ(SN*) 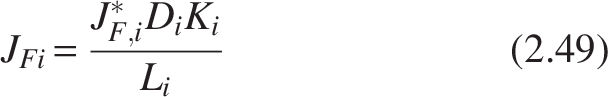
Where i = H, N, NO3
The algorithm for the modeling process is demonstrated in Fig. 4.
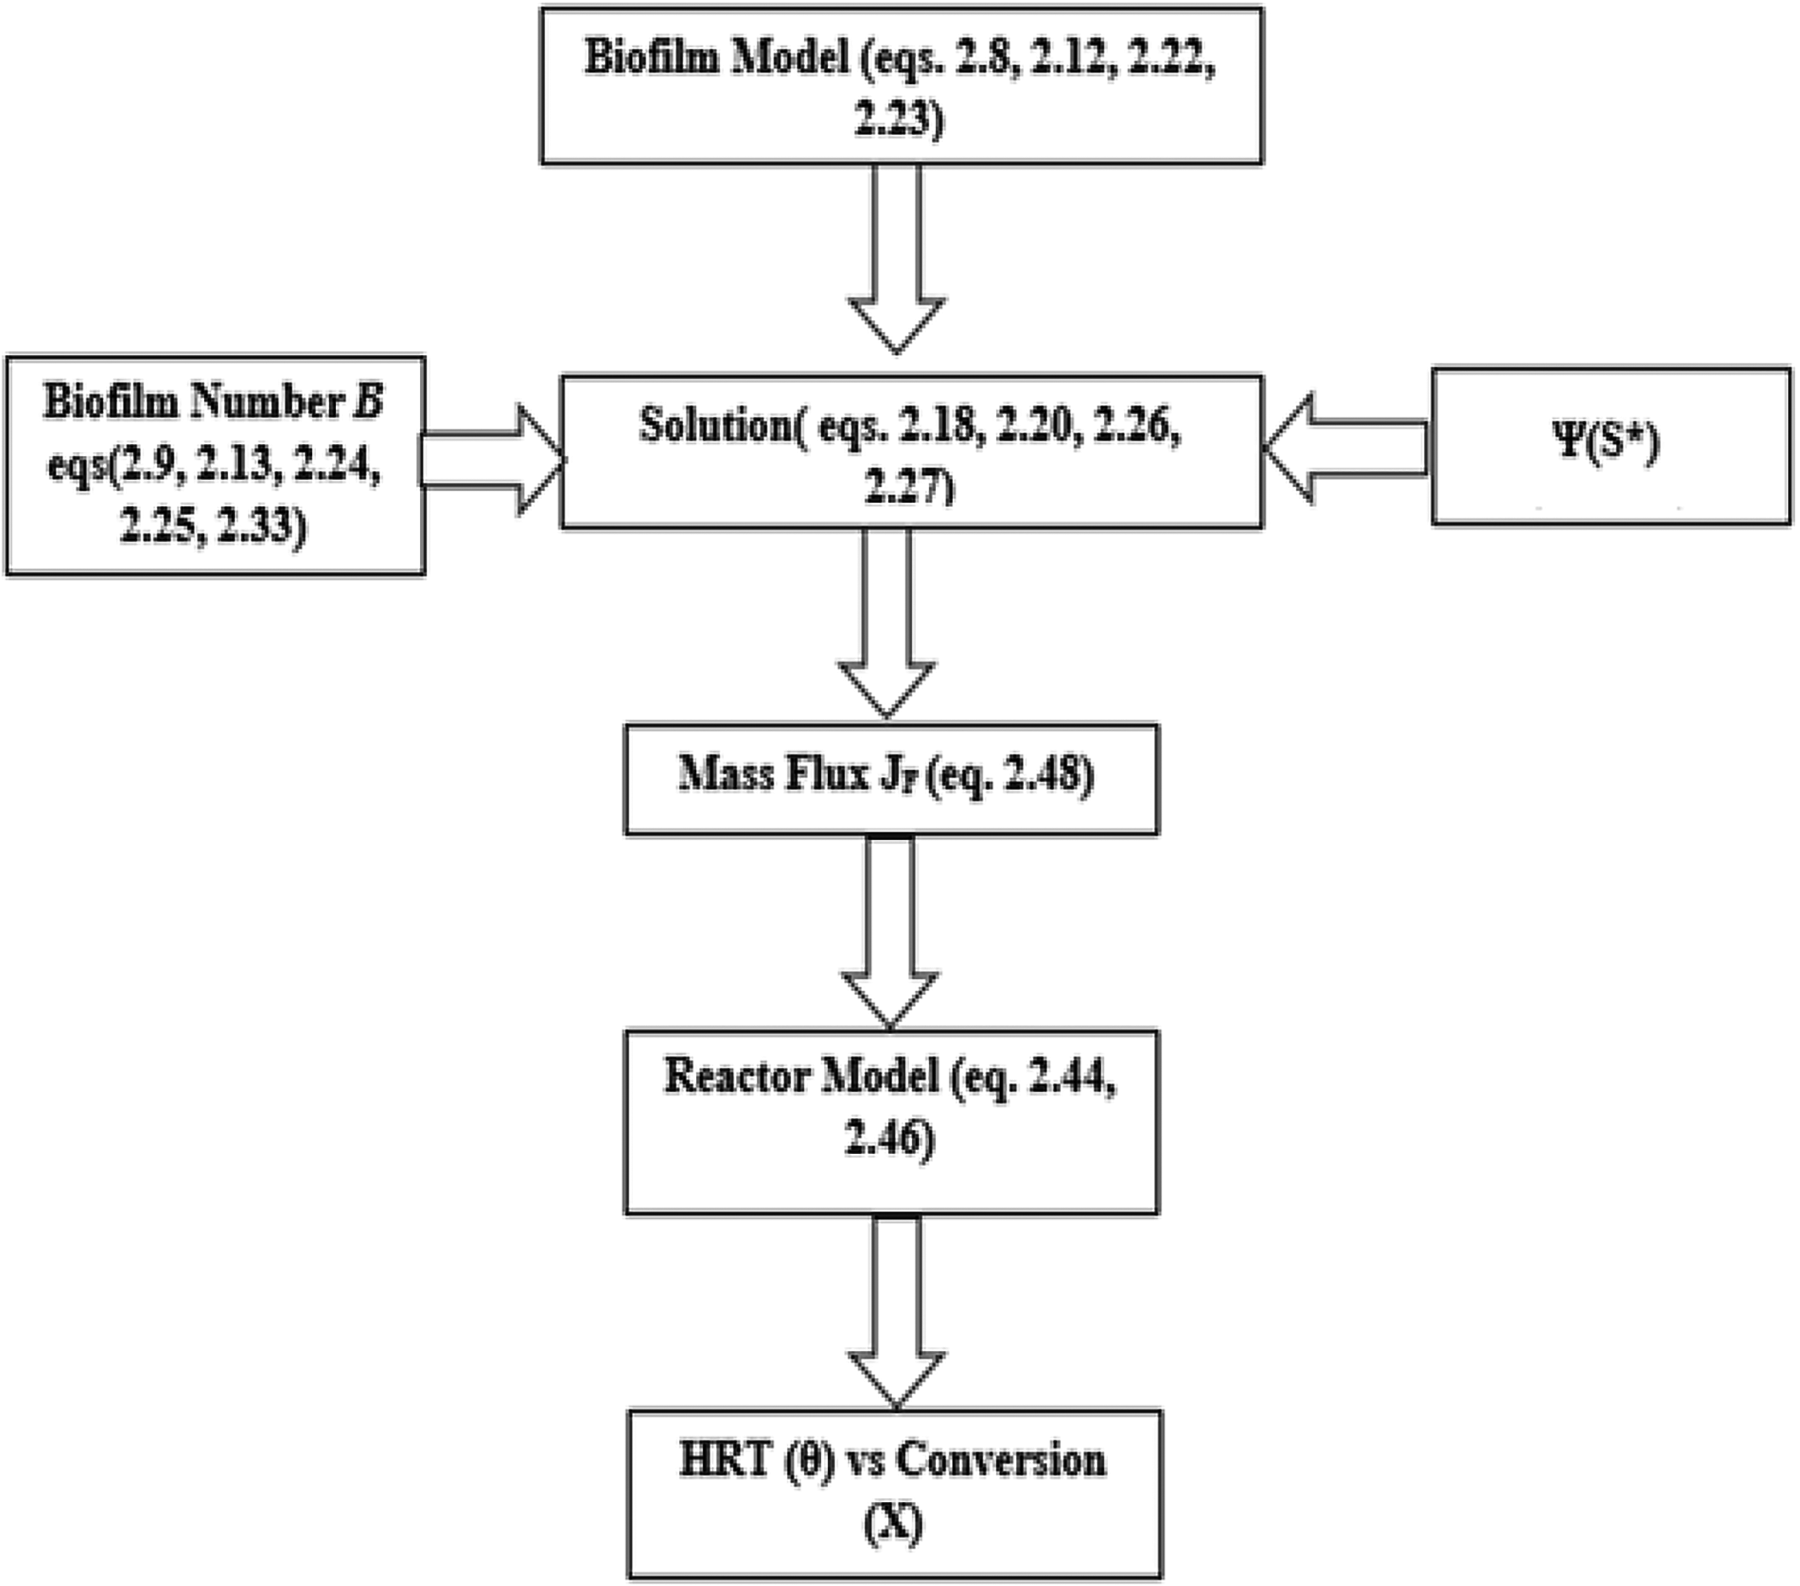
Algorithm for the modeling of MTF. MTF, modified trickling filter.
Results and Discussion
Theoretical performance calculations
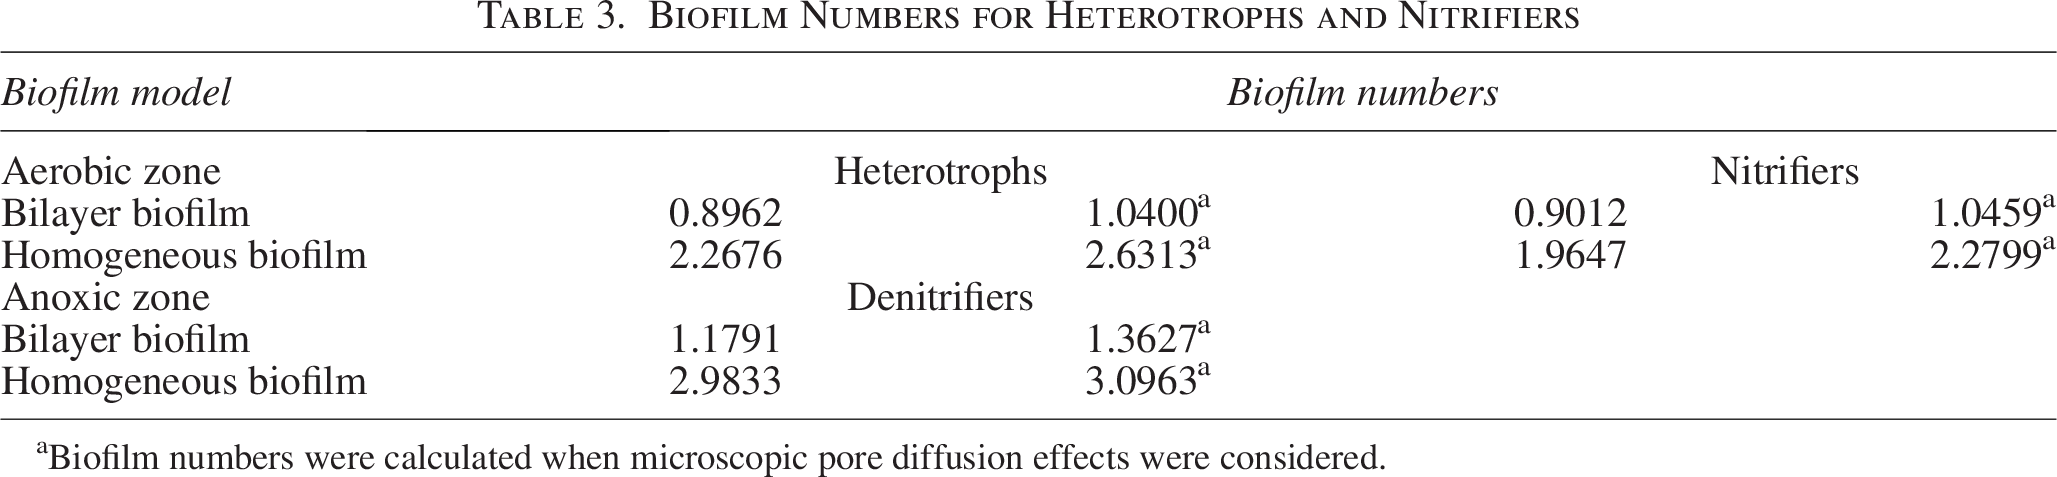
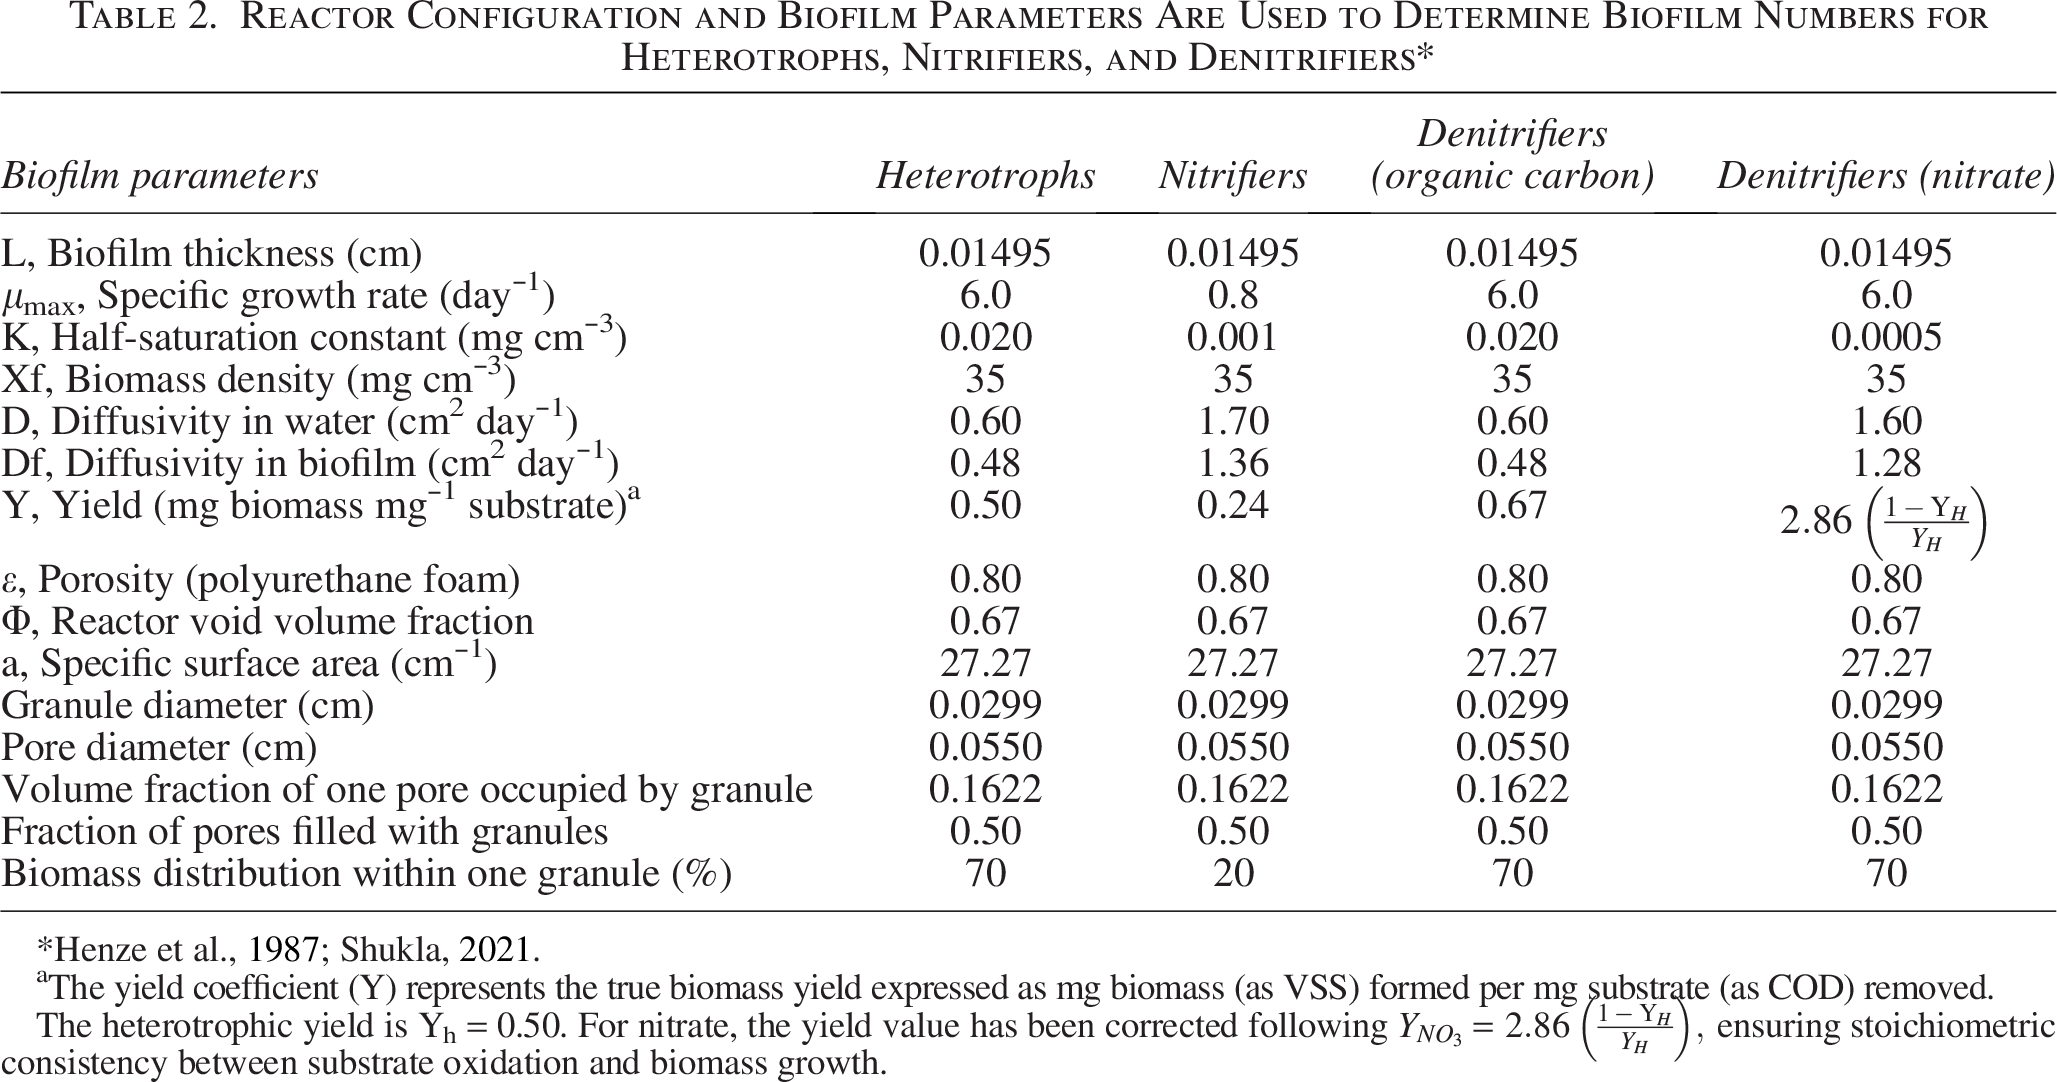
The mass fluxes of COD and ammonia substrates are calculated using the rate law expressions described by Equations (2.18) and (2.20) for bilayer biofilm and by Equations (2.26) and (2.27) for homogeneous biofilm, respectively. Activated Sludge Model No. 1 contains the parameters needed to calculate the biofilm numbers for each species (Henze et al., 2015) and from the literature (Morgenroth, 2020). The experimental results of the biomass dispersion in the PU sponge utilized in a MTF that are used to calculate the biofilm thickness (Shukla, 2021) are mentioned in the table, and the biofilm numbers calculated are shown in Table 2.
Reactor Configuration and Biofilm Parameters Are Used to Determine Biofilm Numbers for Heterotrophs, Nitrifiers, and Denitrifiers*
The yield coefficient (Y) represents the true biomass yield expressed as mg biomass (as VSS) formed per mg substrate (as COD) removed.
The heterotrophic yield is Yh = 0.50. For nitrate, the yield value has been corrected following
The biofilm kinetic functions are Ψ(SH*), Ψ(SN*), and
Biofilm Numbers for Heterotrophs and Nitrifiers
Biofilm numbers were calculated when microscopic pore diffusion effects were considered.
Using the technique described in the “Model for Porous Media” section, the theoretical removal efficiencies of the MTF at different HRTs were computed and compared with the experimental removal efficiencies of COD, NH3-N, and NO3-N at the identical HRT shown in Table 4.
Comparison of Experimental and Theoretical Removal Efficiencies in the Modified Trickling Filter Under Varying Hydraulic Residence Times and Inlet Concentrations
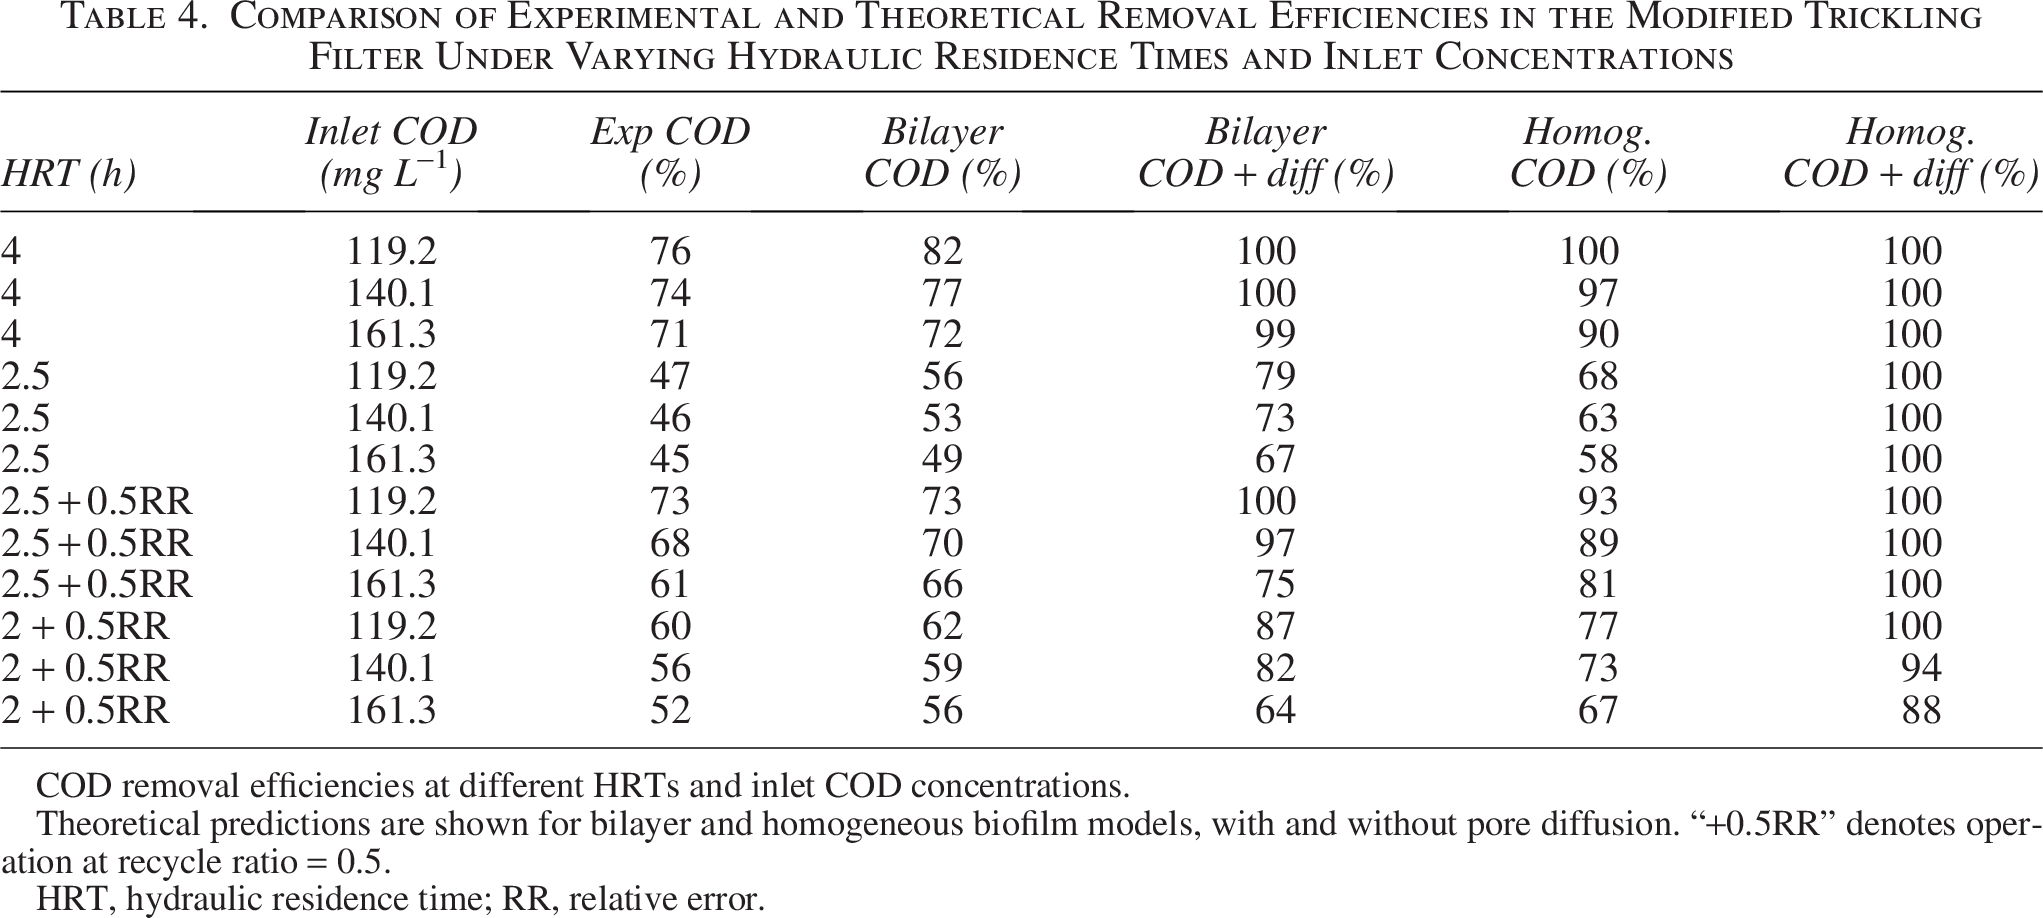
COD removal efficiencies at different HRTs and inlet COD concentrations.
Theoretical predictions are shown for bilayer and homogeneous biofilm models, with and without pore diffusion. “+0.5RR” denotes operation at recycle ratio = 0.5.
HRT, hydraulic residence time; RR, relative error.
The theoretical removal efficiencies are estimated using the formulation of the following conditions: Microscopic pore diffusion effects are not taken into account while assuming a bilayer biofilm (Fig. 5a).
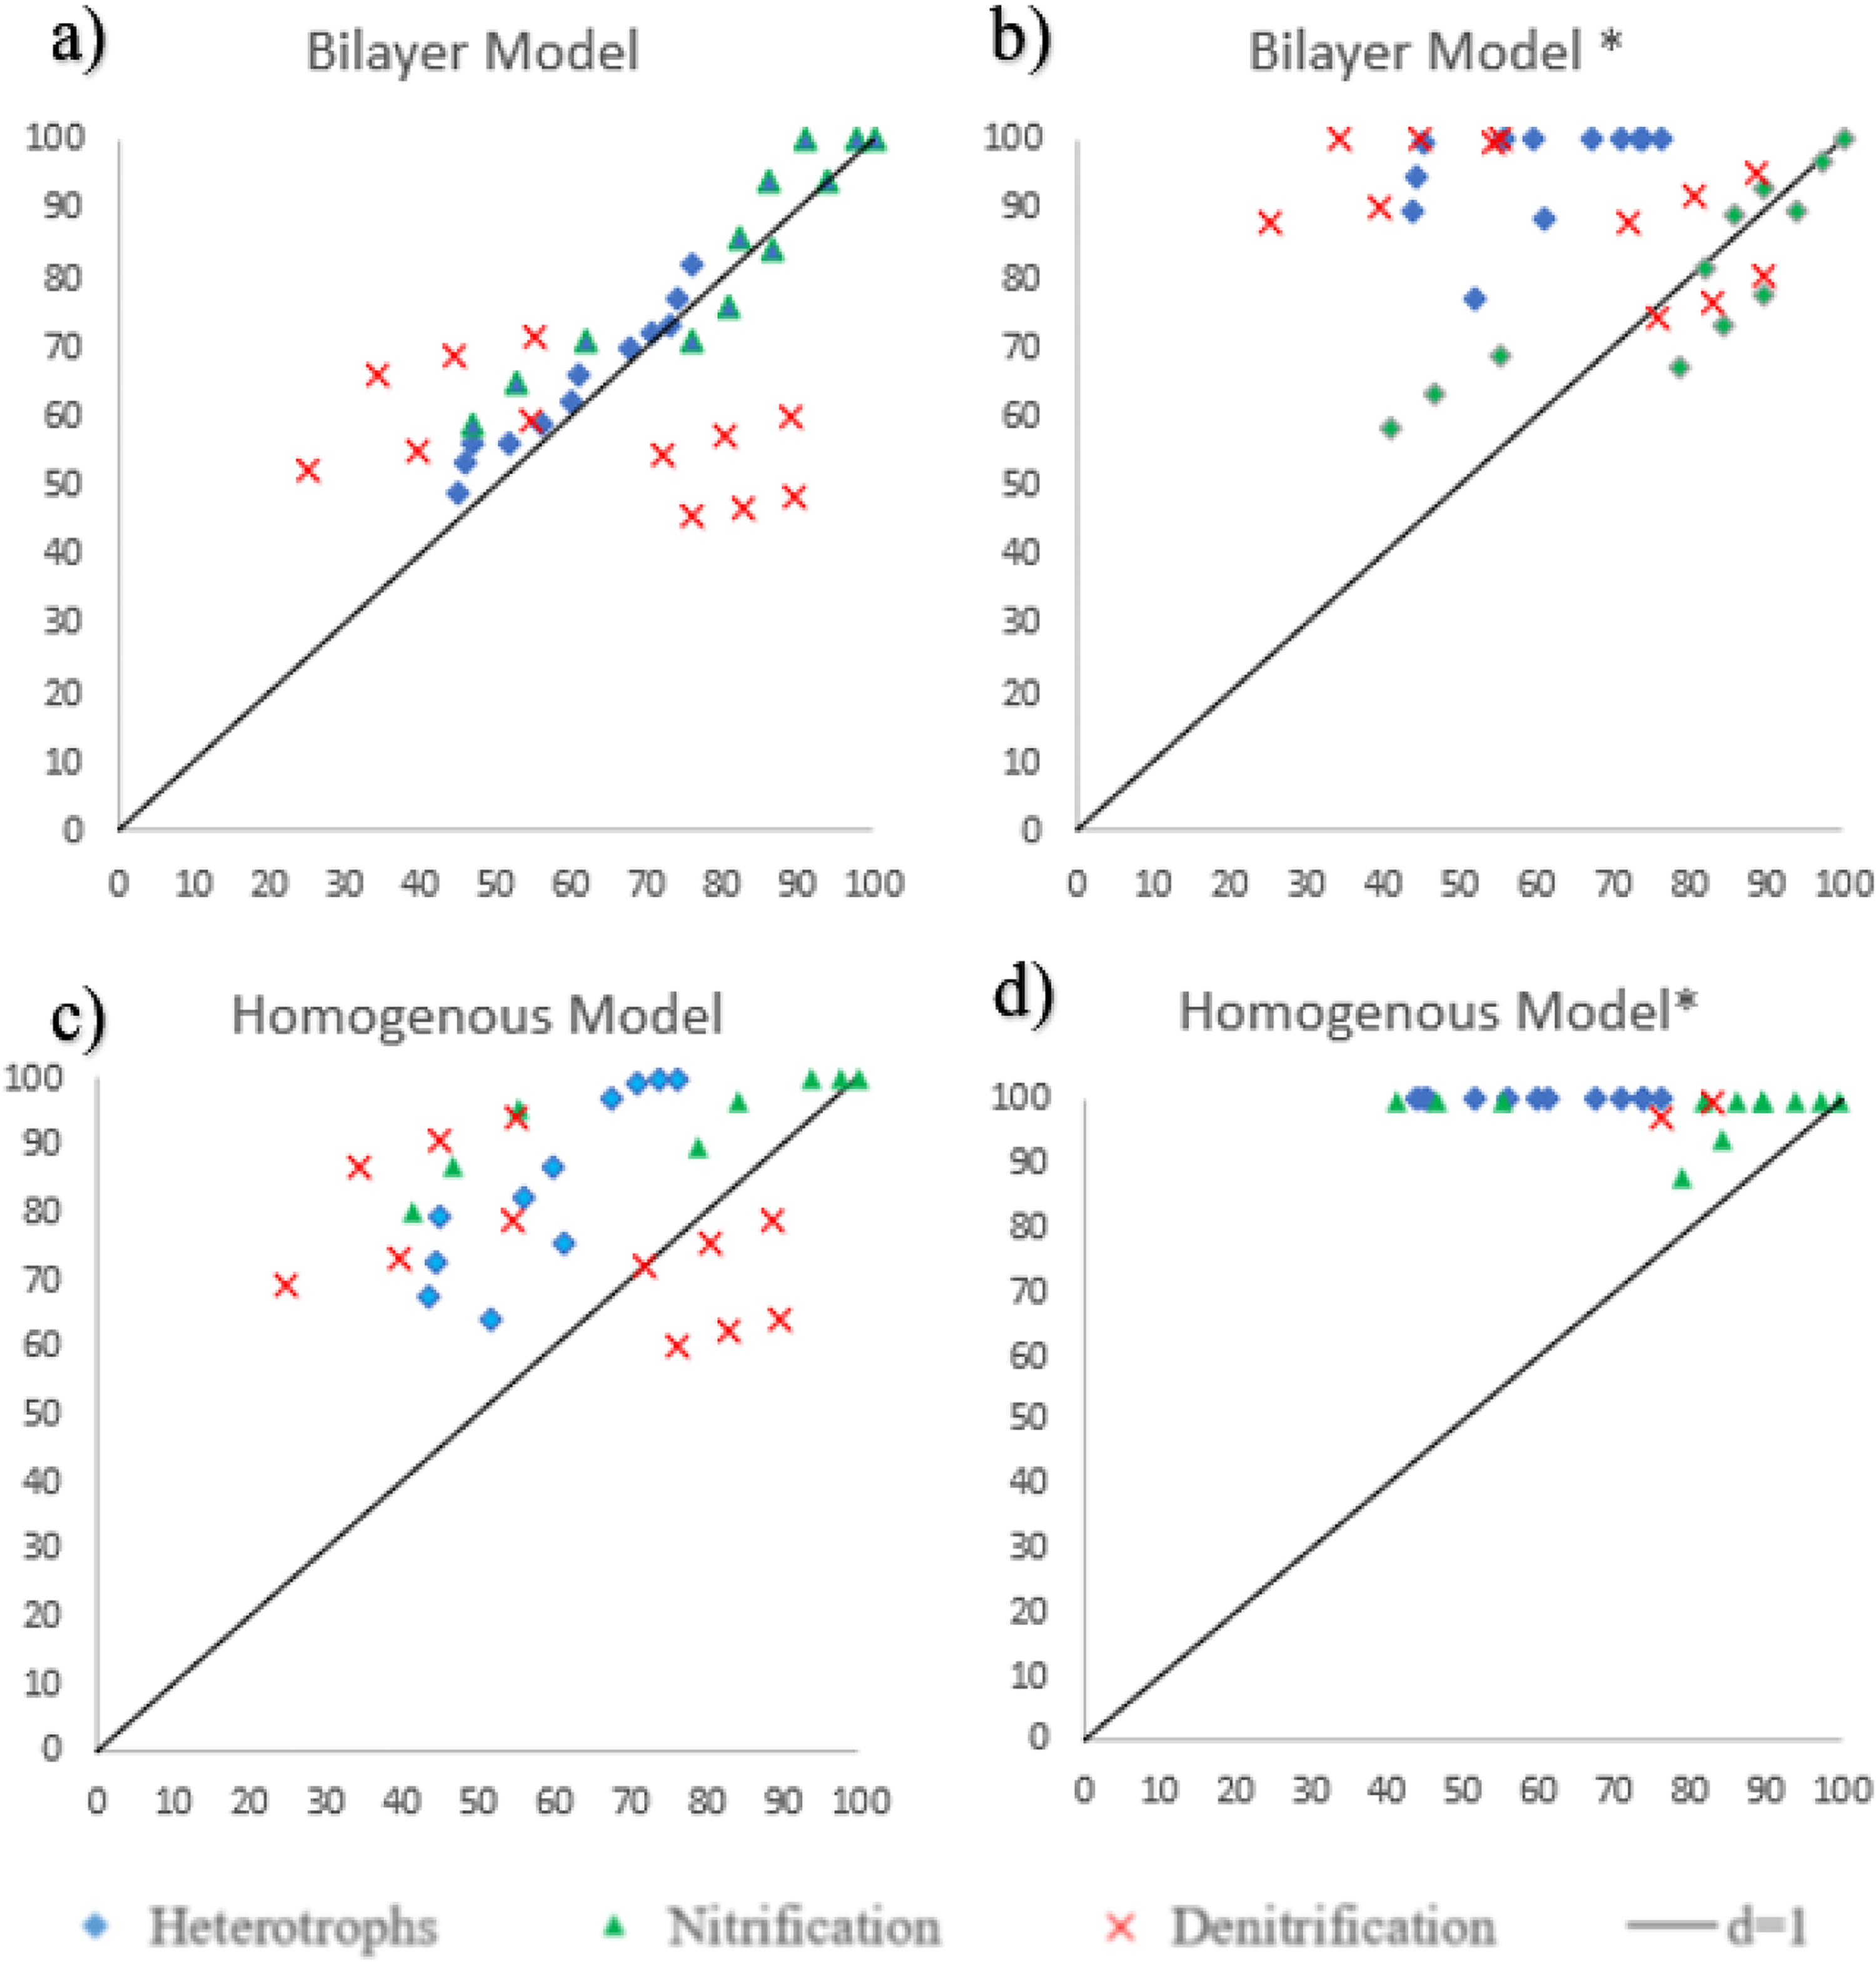
Parity plots comparing theoretical and experimental removal efficiencies (X-axis: experimental, %; Y-axis: theoretical, %).
Microscopic pore diffusion effects are taken into account while assuming a bilayer biofilm (Fig. 5b).
Microscopic pore diffusion effects are not taken into account while assuming a homogeneous biofilm (Fig. 5c).
Microscopic pore diffusion effects are taken into account while assuming a homogeneous biofilm (Fig. 5d).
Following the reactor configurations shown in Table 2, the mass fluxes for each column compartment were obtained. The % removal of each substrate (COD, ammonia, and nitrates) at different HRTs and inlet concentrations was computed using Equations (2.44) and (2.46). The void volume % of the column filled with the PU sponge is determined by the experimental results from the SEM pictures of the biomass immobilized in the sponge network (Shukla, 2021), and the group parameter for the reactor design is determined by α and comprises a specified surface area shown in Table 2. The theoretical and experimental removal efficiencies of each substrate at different HRTs and inlet concentrations are summarized in Table 4. The MTF was tested under a range of COD and ammonia loadings and at multiple HRTs to evaluate treatment effectiveness. For clarity, the results are divided into two subtables: Table 4 presents COD removal efficiencies, whereas Table 5 shows ammonia and nitrate removal efficiencies. In both subtables, experimental data are compared with predictions from the bilayer and homogeneous biofilm models, evaluated with and without pore diffusion. To avoid masking trends by high percent removals, the full datasets, including effluent concentrations and, for nitrogen species, complete mass balances (influent, effluent, and N removed), are reported in Supplementary Tables S1 and S2. These supplementary data allow direct evaluation of compliance with discharge standards and provide additional insight into denitrification performance.
Comparison of Experimental and Theoretical Removal Efficiencies in the Modified Trickling Filter Under Varying Hydraulic Residence Times and Inlet Concentrations
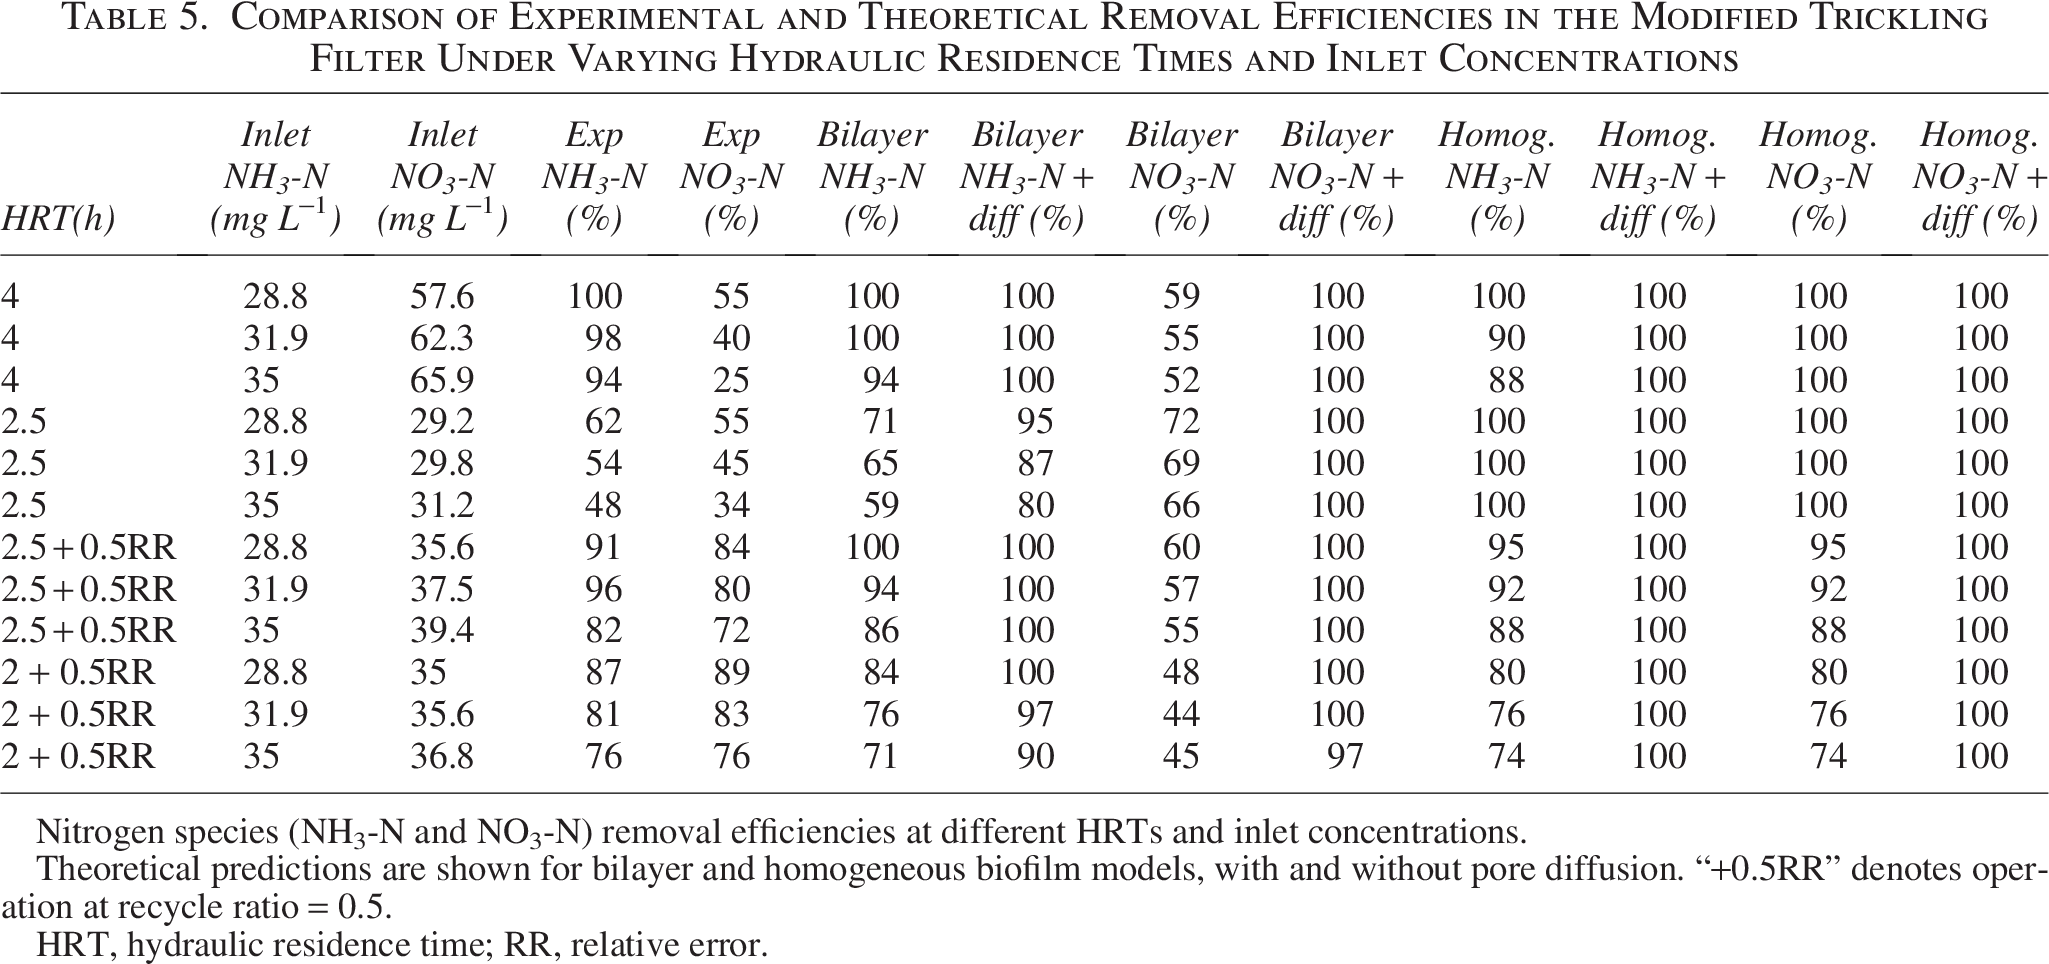
Nitrogen species (NH3-N and NO3-N) removal efficiencies at different HRTs and inlet concentrations.
Theoretical predictions are shown for bilayer and homogeneous biofilm models, with and without pore diffusion. “+0.5RR” denotes operation at recycle ratio = 0.5.
HRT, hydraulic residence time; RR, relative error.
Experimental validation
The model was validated against published experimental data obtained from a 170 L pilot-scale MTF (Shukla, 2021). The available dataset included COD, NH3-N, and NO3-N removal efficiencies measured under different inlet concentrations and HRTs. These reported values were used directly for model validation, as replicate statistics (SD/SE) were not available in the source publications.
The theoretical and experimental removal efficiencies are summarized in Table 4 and illustrated in the form of parity charts in Fig. 5. Across all tested conditions, the bilayer biofilm model provided closer agreement with reported experimental removal efficiencies than the homogeneous biofilm model. When pore diffusion was incorporated, the bilayer model achieved up to ∼25% higher removal efficiency compared with the no-diffusion case. It should be noted that the composition of PU sponge media limits true microscopic pore diffusion; however, representing this effect in the model improved predictive agreement.
Model validation was quantified using Willmott’s (d) (Willmott, 1982) and RE, defined as the normalized RMSE with respect to the mean of the experimental data. These metrics provide a robust evaluation of model–experiment agreement in the absence of replicate-based variability measures (Stöckle et al., 2004; Willmott, 1982).
The computed values of Willmott’s Index and RE are shown in Table 6. Without taking into account the effects of pore diffusion, it has been found that the bilayer model has values that show a good model prediction with the experimental value. The bilayer biofilm is also justified when the difference in the kinetics of the two species is significantly higher than the outer layer that is occupied by rapid growers (for heterotrophs, μmax = 6 d−1), as they tend to use substrate more rapidly than slow growers (nitrifiers, μmax = 0.8 d−1) (Stöckle et al., 2004). The growth dynamics of both species make the homogeneous model impossible. The oxidation of ammonia into nitrates is carried out by two different groups of organisms. In this model, they were considered collectively as one species. This assumption is based on the kinetics of both species. The difference in the kinetics of these species is extremely insignificant; thus, they can exist evenly dispersed in the nitrifying layer beneath the heterotrophic layer (Blackburne et al., 2007). Figure 5 shows that the experimental values for denitrification are higher than the theoretical values.
Index of Agreement of Goodness and Relative Error for Model Predictions and Experimental Data
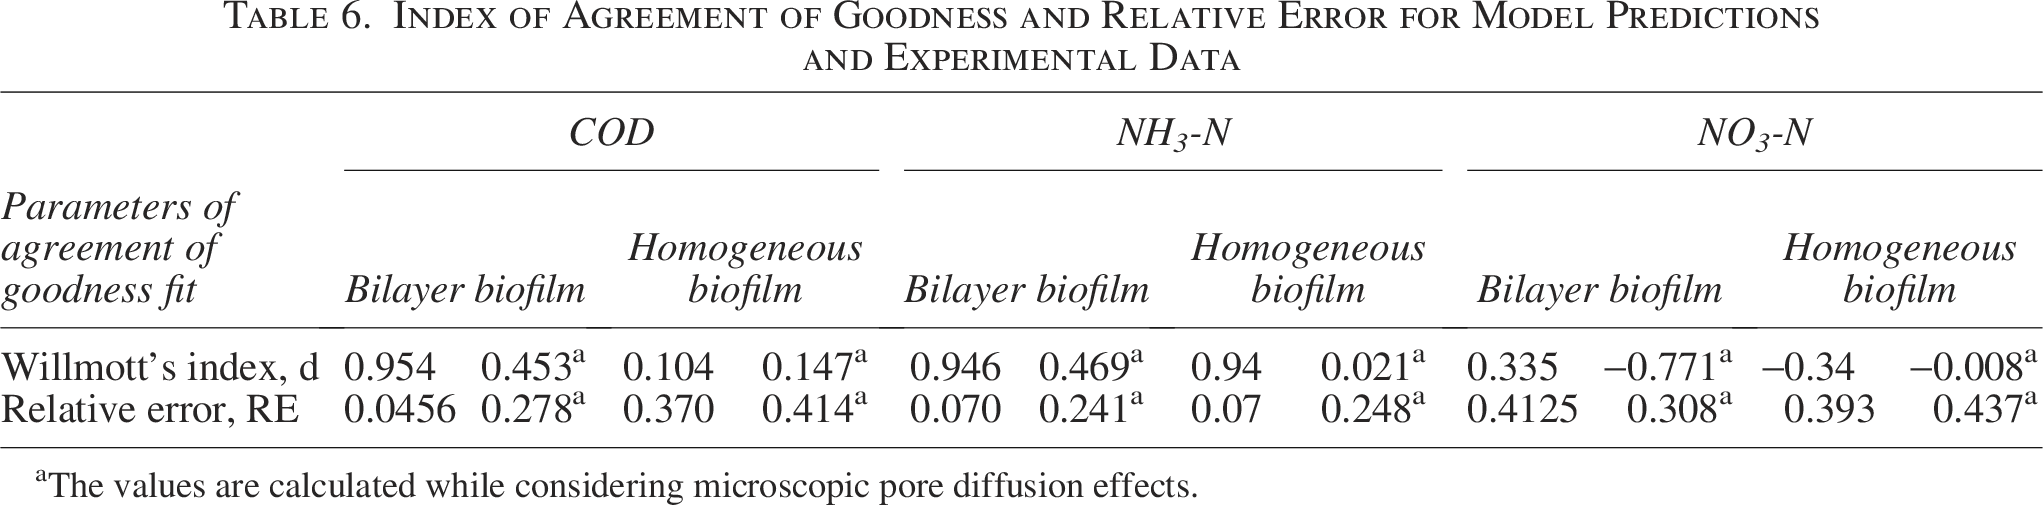
The values are calculated while considering microscopic pore diffusion effects.
In the aerobic zone, ammonia is oxidized to generate nitrates (Shukla, 2021); according to the results of the research, the MTF contains a variety of denitrifying species, including around 10% of the anammox species found in the biomass that were separated from the anoxic zone. Anammox are slow-paced growers, with an extremely high doubling time of 29 days (van de Graaf, 1997). Adding explicit representations of biomass growth, decay, and wash-off would make the model better in a more direct way than adding anammox kinetics. These processes influence solid retention time (SRT), biofilm stability, and the competition between fast-growing heterotrophs and slower nitrifiers that dominate the MTF under aerobic and intermittently anoxic conditions. In the present study, the model was developed to describe heterotrophic oxidation of organic matter with simultaneous nitrification in the aerobic zone and heterotrophic denitrification in the anoxic zone, which represent the principal mechanisms of pollutant removal in the system. To make the analysis easier and focus on these main pathways, we assumed that the biofilm thickness and biomass density stayed the same. Anammox bacteria, on the other hand, grow very slowly (doubling time ≈ 29 days) and need long SRTs and stable anoxic environments, which are not what the MTF is currently doing. Consequently, forthcoming model enhancements will concentrate on integrating biomass growth, decay, and detachment dynamics before expanding the framework to encompass anammox under suitable environmental conditions. The fauna of the biofilm may become more diverse as a result of the PU sponge medium. In the model, only heterotrophic denitrification is taken into account. Pure heterotrophic denitrification is the basis for calculating the theoretical values. The observation suggests that autotrophic denitrification or other microbial activities inside the biofilm may be contributing to the denitrification process.
Classical multispecies biofilm and trickling filter models (Rittmann and McCarty, 2001; Wanner and Gujer, 1986) have long provided frameworks for stratification and substrate diffusion in nonporous media, but they typically omit detailed treatments of porous sponge media, tortuosity, or bilayer versus homogeneous structures. More recent studies have begun to address these gaps. For example, Bottomley and Eberl, (2024) developed a coupled PDE–ODE model for biofilm growth in porous media, showing that neglecting longitudinal diffusion can underestimate substrate depletion and required reactor length. Building on these insights, the present model advances beyond existing approaches by (1) incorporating an effective diffusion coefficient explicitly linked to sponge porosity and tortuosity, (2) comparing bilayer and homogeneous biofilm structures under identical conditions, (3) validating model predictions with experimental data using rigorous metrics such as Willmott’s (d) and RE, and (4) identifying design-relevant operating windows (recycle ratio ≈ 0.5, biofilm thickness 0.015–0.020 cm, porosity > 0.7) that can be directly applied to sponge-based MTF systems. One limitation is that replicate statistics were not available in the source datasets; future experimental studies with replicated measurements would enable confidence intervals to be established and further strengthen the robustness of model validation. In addition, future extensions of the model could incorporate slow-growing functional groups such as anammox by applying hybrid kinetic approaches, thereby capturing their long doubling times and potential contribution to nitrogen removal under anoxic microzones.
Summary and Conclusions
Two categories of biofilm structures are covered by the rate law expressions obtained from the research of Sharma et al. (2022): (1) homogeneous biofilm and (2) bilayer biofilm. When the kinetic speeds of the two species differ significantly, a multilayer structure is feasible due to competition for space; heterotrophs inhabit the outer layer, and nitrifiers occupy the interior layer. A homogeneous biofilm can form when the kinetics of the two species are similar or when there is no interaction between the two species. The axial part of a trickling filter functions as a CMBR. In a trickling filter, these CMBRs are linked together in series. Overall, the trickling filter functions as a PFR. The experimental findings verified the model as the top zone is composed of two species: heterotrophs and nitrifiers, whereas the bottom zone is composed solely of facultative heterotrophs. The bilayer model hypothesis in the upper zone provides promising results, with theoretical values estimated using the model and experimental data of acceptable correctness. With RE values of 0.04564 and 0.0703 for heterotrophs and nitrifiers, respectively, Willmott’s (d) is 0.954 and 0.946, indicating an ideal prediction.
The experimental nitrate removal efficiency for denitrification is greater than the theoretical values. Ammonia undergoes oxidation in the aerobic zone, resulting in nitrates. According to the experimental results of Shukla (2021), the MTF contains a variety of denitrifying species, including around 10% of the anammox species found in the biomass that was isolated from the anoxic zone. The biofilm’s flora may diversify as a result of the PU sponge medium. In the model, only heterotrophic denitrification is taken into account. Pure heterotrophic denitrification is the basis for calculating the theoretical values. It is likely that autotrophic denitrification or other microbial activities inside the biofilm are contributing to the observed denitrification. It has been noted that denitrification does not proceed by a single pathway, often heterotrophic denitrification; additional denitrifying processes in wastewater treatment are a promising area of research. Theoretically, the quantity of biofilms increases due to pore diffusion. Microscopic pore diffusion is not supported by the PU sponge media utilized in MTF, according to observations (Fig. 5b, d). The available specific area (27.27 cm2/cm3) for biomass growth and attachment is being macroscopically enhanced by the PU sponge. Under the conditions tested, predicted removal efficiencies with microscopic pore diffusion are ∼25% higher than those without microscopic pore diffusion.
From a design perspective, the model highlights several actionable levers for optimizing MTF performance:
In summary, the model not only reproduces COD, NH3-N, and NO3-N removal trends but also provides quantitative operating windows (recycle ratio ≈ 0.5, porosity > 0.7, biofilm thickness 0.015–0.020 cm) that can guide the design and operation of sponge-based MTFs toward reliable and energy-efficient treatment.
Authors’ Contributions
D.S.: Conceptualization, methodology, software, formal analysis, investigation, writing—original draft, and numerical modeling. S.G.: Data curation, validation, and writing—review and editing. R.C.: Resources and writing—review and editing. A.G.: Software and data visualization. Z.A.S.: Supervision, project administration, investigation, and resources. T.R.S.: Supervision, project administration, and investigation.
Footnotes
Author Disclosure Statement
The authors declare that they have no competing financial interests.
Funding Information
This research did not receive any specific grant from funding agencies in the public, commercial, or not-for-profit sectors.
Supplemental Material
Supplemental Material
Supplemental Material
References
Supplementary Material
Please find the following supplemental material available below.
For Open Access articles published under a Creative Commons License, all supplemental material carries the same license as the article it is associated with.
For non-Open Access articles published, all supplemental material carries a non-exclusive license, and permission requests for re-use of supplemental material or any part of supplemental material shall be sent directly to the copyright owner as specified in the copyright notice associated with the article.