
Abstract
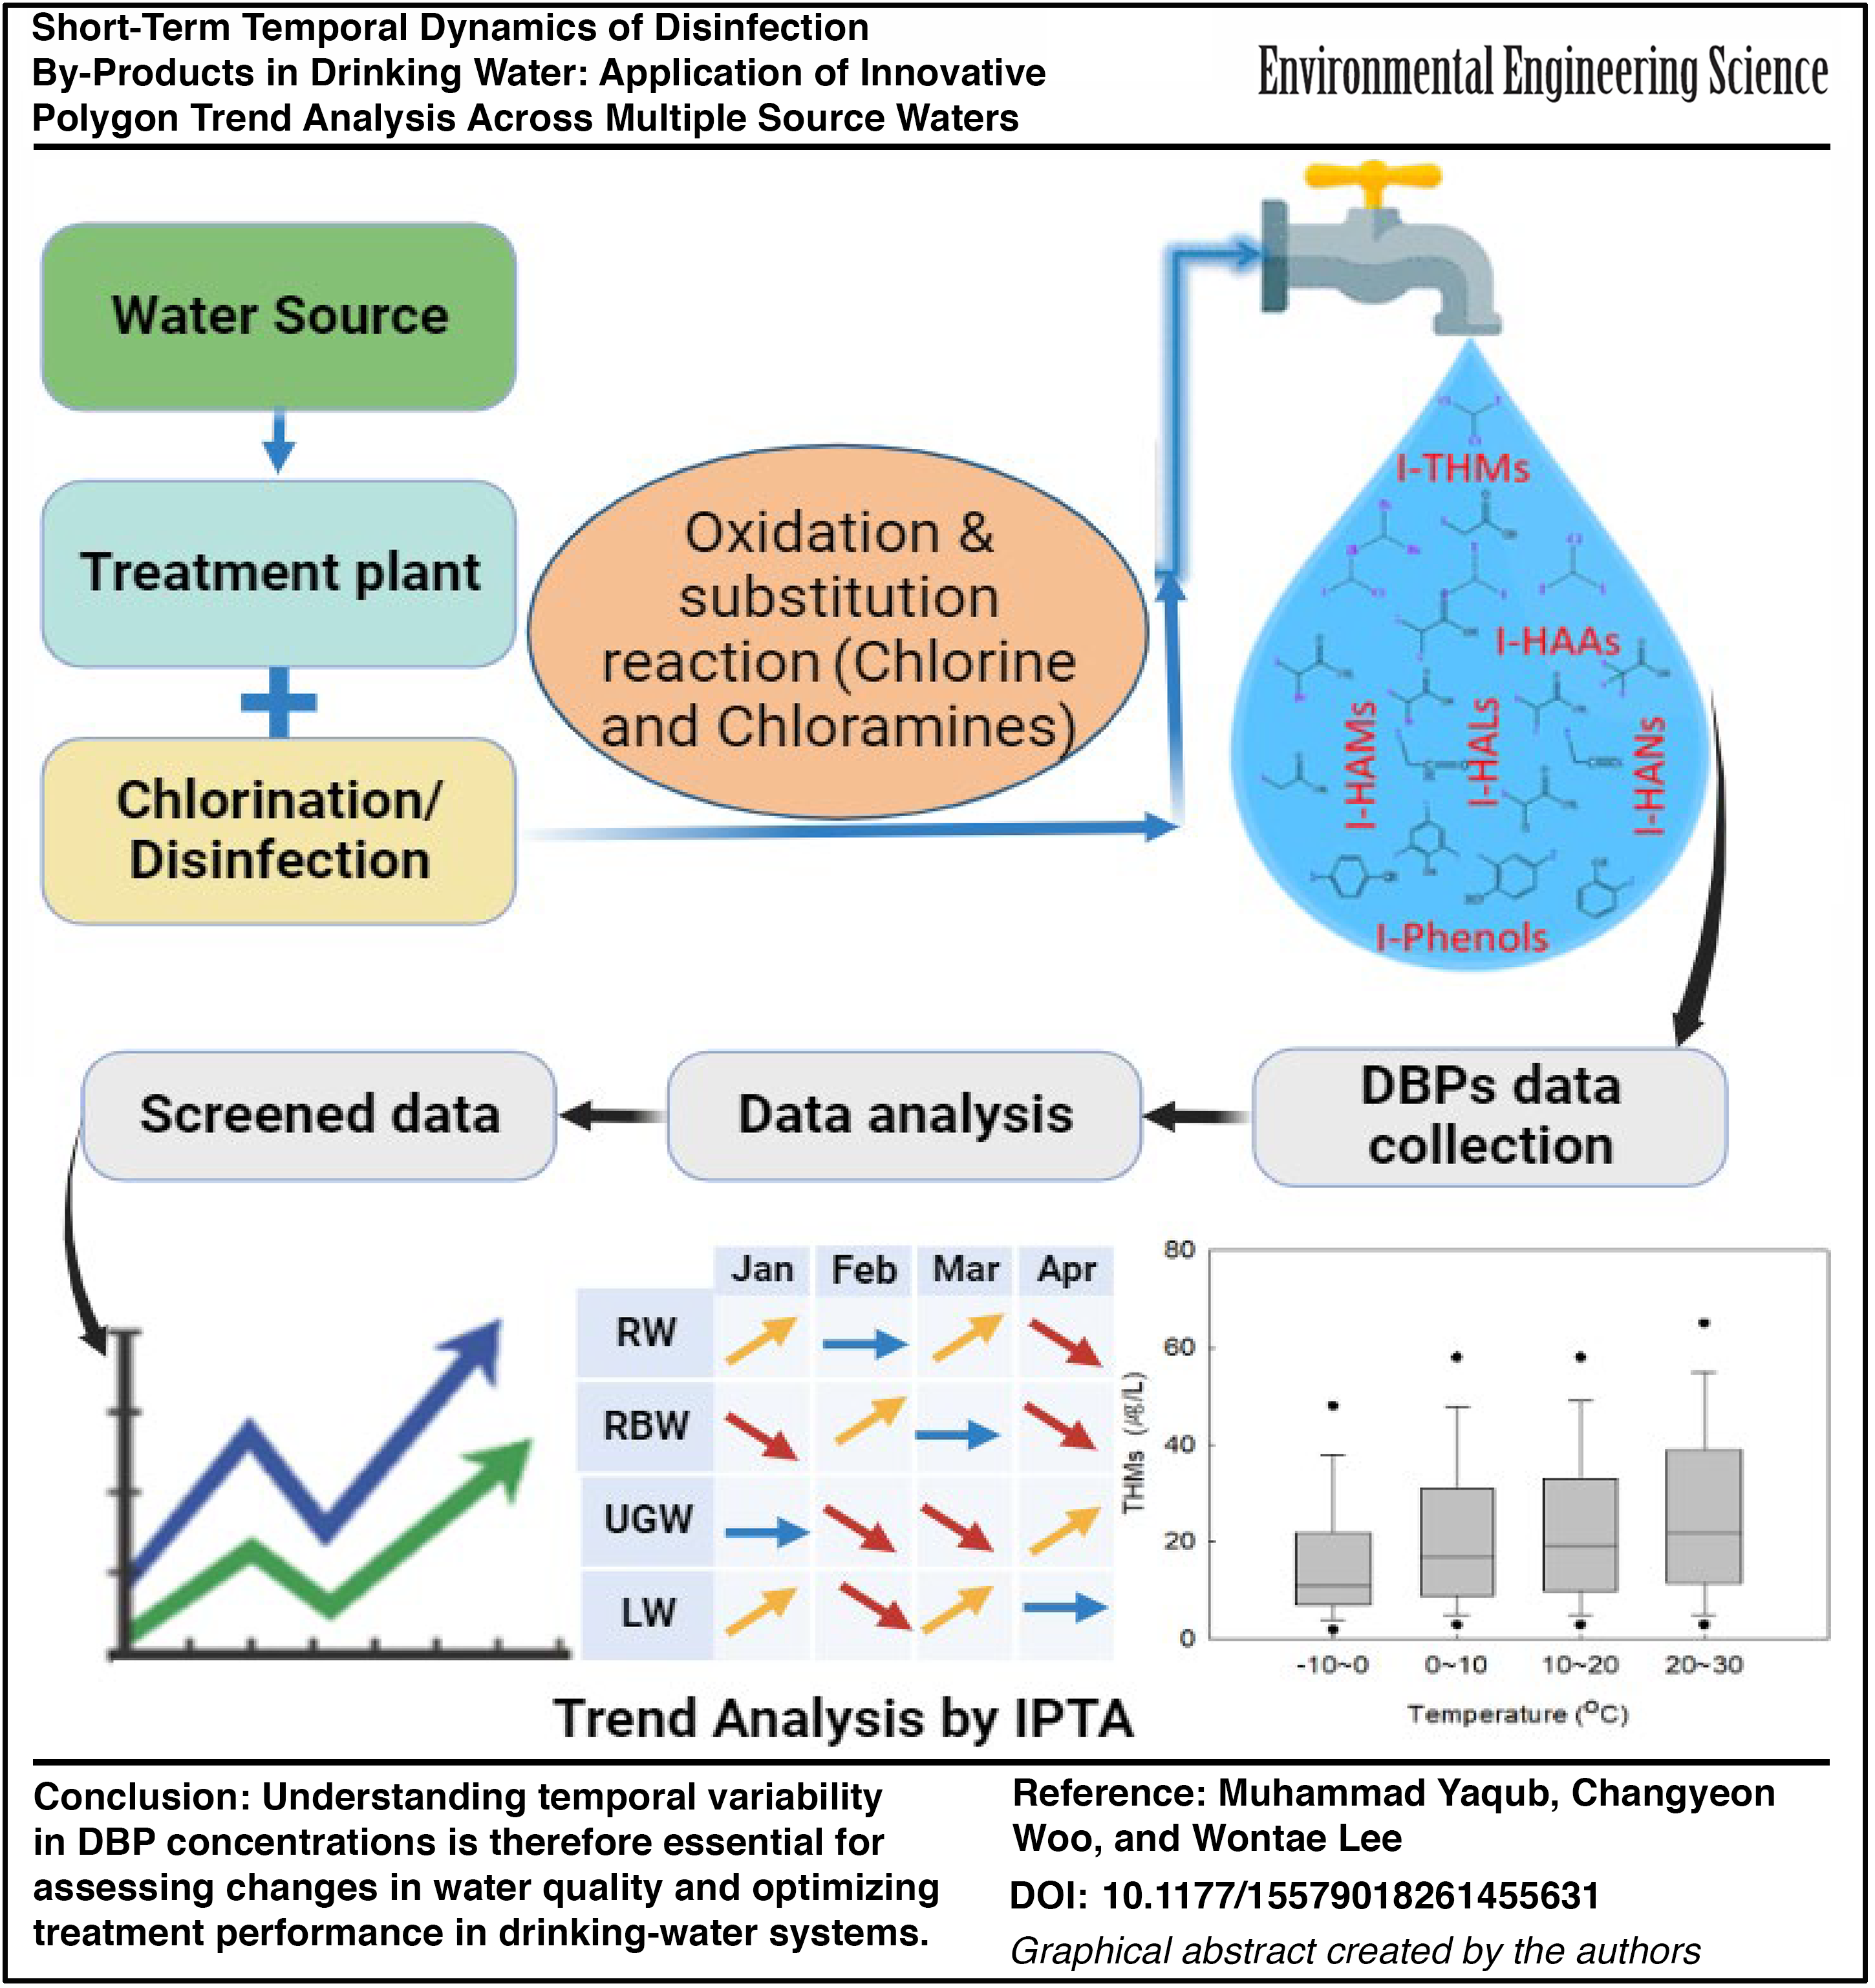
Understanding short-term variations in disinfection by-products (DBPs) is essential for effective drinking-water management. This study applied Innovative Polygon Trend Analysis (IPTA) to evaluate temporal trends in DBP concentrations in treated water from 2011 to 2022 across four source-water types: river water (RW), riverbed water (RBW), underground water, and lake water. IPTA provides a visual framework for identifying month-specific and asymmetrical trends in environmental time-series data. A dataset from 82 treatment plants was analyzed. Trihalomethanes (THMs), haloacetic acids (HAAs), and haloacetonitriles (HANs) were evaluated, with detailed correlation analysis performed for THMs due to complete data availability. Results indicate that THM concentrations decreased during January–April but increased during warmer months, with peak values observed in the 20–30°C range based on monthly average temperature data. THM concentrations were consistently lower in advanced treatment plants, with average reductions of ∼10–25% compared with conventional systems. HAAs exhibited seasonal variability, increasing during cooler periods and decreasing during warmer months in RW and RBW. IPTA effectively identified month-specific trend reversals and asymmetries across water sources. These findings highlight the importance of seasonal optimization of treatment processes, including precursor removal and chlorination control, and demonstrate the applicability of IPTA for operational monitoring and DBP management.
Graphical abstract
Highlights
Studied short-term disinfection by-product (DBP) trends (2011–2022) in water treatment plants using monthly data. Evaluated multiple water sources, including river, riverbed, underground, and lake water. Focused on key DBPs: trihalomethanes (THMs), haloacetic acids, and haloacetonitriles. Used IPTA method to analyze DBP trends and seasonal variations. Found lower DBP levels in river water and advanced plants, with THMs strongly linked to temperature.
Introduction
Water professionals modify treatment processes as source-water chemistry and regulatory requirements evolve. High concentrations of organic matter (OM) challenge chemical disinfection in ∼70% of municipal treatment facilities in the United States (AWWA, 2018). Although chemical disinfection effectively inactivates pathogens, it can also react with aqueous OM to form carcinogenic disinfection by-products (DBPs) (Srivastav et al., 2020). Over 700 DBPs have been identified, with 11 (four trihalomethanes [THMs], five haloacetic acids [HAAs], one bromate, and chlorite) currently regulated in the United States (Richardson and Plewa, 2020). According to EPA DBP rules from 1998 and 2006, water systems applying disinfectants must comply with maximum contaminant levels and conduct routine monitoring of THMs, HAAs, and haloacetonitriles (HANs) (Leonard et al., 2022; US EPA, 2010). Intracellular OM has a higher potential for forming THMs and HANs than extracellular OM, prompting a focus on these DBPs in source waters near treatment plants (Kralles et al., 2020). Although DBP formation remains a major concern for municipal treatment facilities (Flancher and Chaballa, 2020), it can be mitigated through enhanced precursor removal or alternative disinfection strategies as widely reported in environmental engineering studies on DBP control in drinking-water systems (Tafvizi and Husain, 2022; Wang et al., 2022). Numerous studies have explored modifications to conventional treatment processes for DBP reduction, although such changes often involve increased operational and infrastructure costs (Zhang et al., 2021; Andersson et al., 2020).
Trend analysis is widely used in hydrometeorological and environmental studies to identify systematic temporal patterns. However, conventional statistical methods for trend detection often rely on restrictive assumptions, including linearity, normality, and data independence (Şen, 2012). In practice, environmental datasets frequently exhibit nonlinear and stochastic behavior, limiting the effectiveness of such approaches. Recent studies have demonstrated that DBP formation is governed by multiple interacting factors, including seasonal variability, natural OM (NOM) characteristics, precursor fractions, and treatment configuration. Predictive modeling approaches have been applied to estimate THM formation potential, while full-scale and process-based investigations have emphasized the role of NOM fractionation, pretreatment strategies, and optimized precursor removal in DBP control. These findings highlight the need for analytical approaches capable of resolving temporal variability and month-specific behavior in drinking-water systems. However, most existing studies focus on prediction or process performance rather than detailed visualization of temporal trend patterns across multiple water-source types. In this context, Innovative Polygon Trend Analysis (IPTA) provides a flexible and assumption-free framework for detecting asymmetrical and month-specific variations in environmental time-series data (Alver et al., 2021; Alver et al., 2025a; Alver et al., 2025b; Alver et al., 2025c; Alver et al., 2026).
After the Mann–Kendall trend test was introduced by (Mann, 1945) and later expanded by (Kendall, 1975) and Kendall and Gibbons, 1962), many researchers have widely applied trend analysis to time-series datasets (Güçlü, 2018; Jones et al., 2015). In addition, the Theil–Sen approach was investigated to support the Mann–Kendal test in detecting the magnitude of the trend, as previously reported (Bari et al., 2016; Swain et al., 2015). This method offers more robust confidence intervals for nonnormal distribution data unaffected by outliers. Recently, Şen et al. (2019) refined this method into an approach known as IPTA. IPTA employs a 1:1 (45°) straight-line method without depending on specific assumptions for time-series analysis. It detects particular changes in individual data sequences, subsequently used to create a change polygon (Şen et al., 2019). This polygon offers a valuable framework for improved linguistic and numerical analyses and for understanding changes between two equivalent segments of a time series. As a result, IPTA delivers trends and polygons that aid in evaluating a critical system and its components.
Previous studies have reported IPTA applications to assess time-series data trends for hydrometeorological variables and other areas (Şen et al., 2019). For example, the total monthly precipitation and temperature data of the Susurluk Basin in Turkey were analyzed using IPTA (Ceribasi et al., 2021). Researchers have applied IPTA for monthly trend precipitation analyses in Algeria, Pakistan, and Vietnam (Ahmed et al., 2022; Achite et al., 2021; Şan et al., 2021). A few studies have applied IPTA for temperature data trend analysis (Yenice and Yaqub, 2022) and air quality identification (Güçlü et al., 2019) in Turkey. Furthermore, recent developments, such as standardized IPTA frameworks, have extended its application to multivariable trend analysis, enabling improved interpretation of complex environmental datasets (Alashan et al., 2024). Our literature review revealed that researchers have tested the IPTA method for trend analyses of rainfall, temperature, and air pollution data series, but no studies have tested DBPs concentrations in water resources. There is a gap in the literature regarding the comprehensive evaluation of IPTA in understanding short-term changes in DBP concentration in water resources. The presence of DBPs and their increasing or decreasing trends are related to the water characteristics, treatment methods, and other factors. Therefore, it is crucial to understand the trends over extended periods to launch precautionary measures against potential risks and help authorities in decision-making. It is important to understand that water pollution transcends borders, with neighboring cities or countries significantly impacting water quality. This highlights the necessity for both regional and global initiatives to address DBP issues and improve human health and ecosystem sustainability. Achieving this requires the analysis of DBP quality datasets (such as monthly, hourly, or daily measurements) using statistical methods to detect significant changes. In environmental engineering practice, monitoring and controlling DBPs are critical for ensuring drinking-water safety and regulatory compliance. Analytical tools that can resolve short-term variability and seasonal patterns are particularly valuable for supporting treatment optimization and operational decision-making. In this context, the IPTA method offers a practical advantage by enabling detailed visualization of month-specific changes without relying on restrictive statistical assumptions, thereby complementing conventional trend analysis approaches commonly used in environmental engineering studies.
Thus, this study employed the IPTA method to evaluate short-term changes in DBP levels across various water resources. We applied IPTA to analyze variations in the concentrations of THMs, HAAs, and HANs monitored over a 12-year period (2011–2022). The primary objective was to assess the effectiveness of IPTA in identifying and comparing significant changes in DBP concentrations among different water sources and to examine the relationship between temperature and THMs for seasonal monitoring and control. The findings of this research aim to support water authorities and researchers in understanding the temporal dynamics of DBP formation and to provide a framework for applying IPTA in water-quality trend studies. Compared with conventional statistical trend analysis methods such as the Mann–Kendall test and Sen’s slope estimator, IPTA provides several practical advantages for environmental time-series analysis. Unlike traditional approaches that summarize overall monotonic trends, IPTA enables visualization of month-specific directional changes and identification of asymmetrical patterns between different time segments. In addition, IPTA does not rely on strict assumptions regarding data distribution or linearity, making it suitable for datasets exhibiting seasonal variability and nonlinear behavior, such as DBP concentrations in drinking-water systems. Therefore, IPTA is used in this study as a complementary analytical tool to provide additional insight into temporal variability rather than replace conventional statistical methods. This study provides a novel application of IPTA for identifying short-term and month-specific DBP trends across multiple water-source types; however, it is limited by the absence of key precursor and operational parameters (e.g., total organic carbon [TOC], dissolved organic carbon [DOC], and chlorine dosage) and the relatively short data record, which may constrain detailed mechanistic interpretation.
Methodology
IPTA method
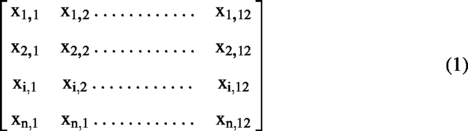
The IPTA can be applied to timescales such as yearly, monthly, or daily data. In this study, a monthly timescale was utilized to organize the dataset into a matrix format, with monthly DBP concentrations represented as

Schematic of the IPTA method showing comparison of arithmetic means from two time periods. Points above and below the 1:1 line indicate increasing and decreasing trends, respectively. IPTA, Innovative Polygon Trend Analysis.
Study area and data description
The study included four source-water types with distinct hydro-chemical characteristics. River water (RW) represents surface water directly withdrawn from the Nakdong River, exhibiting moderate organic content and seasonal variation. Riverbed water (RBW) is drawn through infiltration galleries beneath the riverbed, typically showing reduced turbidity and organic content compared with RW. Underground water (UGW) originates from confined aquifers with low OM and stable quality throughout the year. Lake water (LW) is obtained from lacustrine surface sources characterized by higher organic content and longer hydraulic residence times. Although the dataset did not include key DBP precursor and controlling parameters—such as TOC, DOC, UV absorbance (UV254, UV280), bromide concentration, pH, and detailed chlorine dosage—these variables are widely recognized as important factors influencing DBP formation. Their absence in the current dataset limits the ability to establish mechanistic relationships between source-water characteristics and DBP concentrations, and therefore they are recommended for inclusion in future monitoring programs.
Description of selected sites
The selected (82) water treatment plants and sources were in Gyeongsangbuk-do, North Gyeongsang Province, South Korea. Each site was chosen based on data availability and its representation of water treatment plants.
The dataset used in this study comprises monitoring records from 82 water treatment plants located in Gyeongsangbuk-do, South Korea, including 52 RBW, 17 LW, 10 RW, and 3 groundwater (UGW) systems. DBP concentrations (THMs, HAAs, and HANs) were measured as daily averages at treatment plant outlets (postchlorination) and aggregated into monthly averages for analysis over the period 2011–2022. The dataset was obtained from national open-access monitoring platforms and includes minor data gaps (<1%), which were addressed through standard interpolation techniques. As summarized in Table 1, a total of 82 plants were investigated, comprising 52 (RBW), 17 (LW), 10 (RW), and 3 (UGW) systems. Most RBW and UGW facilities employed conventional treatment, while advanced processes—such as ozonation and granular activated carbon (GAC), or biological activated carbon (BAC)—were primarily applied to RW and LW sources. This distribution provides crucial context for interpreting DBP behavior in subsequent sections, where variations in THMs, HAAs, and HANs are linked to both source type and treatment configuration. A 12-year dataset (2011–2022) was selected based on data completeness and consistency across all treatment plants, as longer historical records contained substantial gaps (>30%). While longer datasets are generally preferred for long-term trend detection, the selected period is sufficient for analyzing short-term and seasonal variability, which is the primary focus of this study. The selected sites included RW, RBW, UGW, and LW. The analysis focused on three primary DBPs to examine short-term water quality changes. Table 2 summarizes the statistical information of the DBP data for each site.
Summary of Water Treatment Plants, Source Types, and Process Categories (2011–2022)
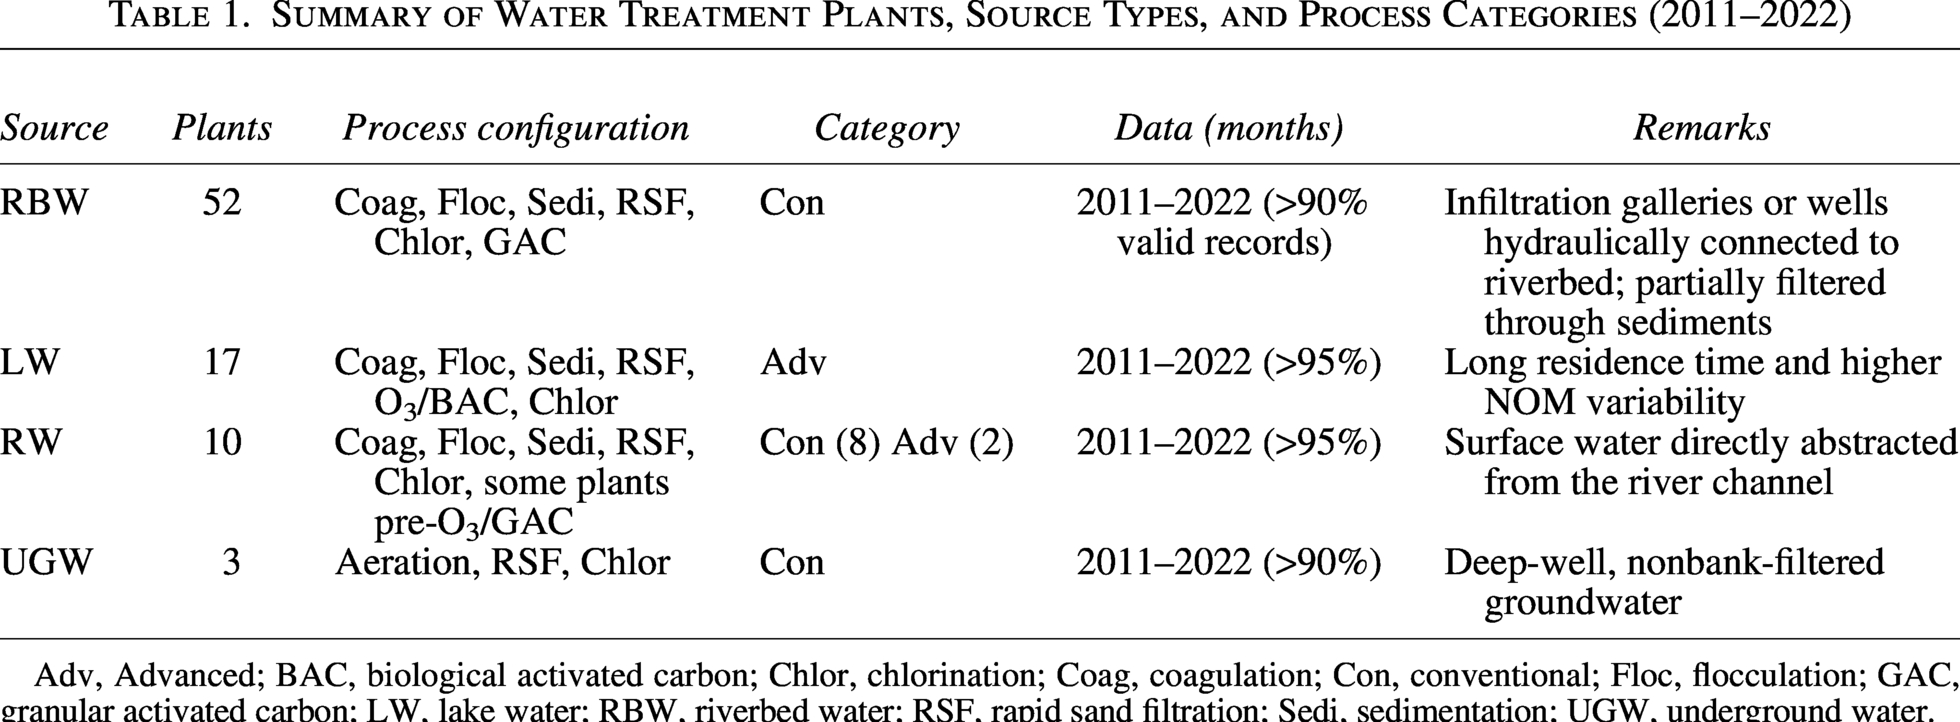
Adv, Advanced; BAC, biological activated carbon; Chlor, chlorination; Coag, coagulation; Con, conventional; Floc, flocculation; GAC, granular activated carbon; LW, lake water; RBW, riverbed water; RSF, rapid sand filtration; Sedi, sedimentation; UGW, underground water.
Data Statistics of Selected Disinfection By-products at Different Sites
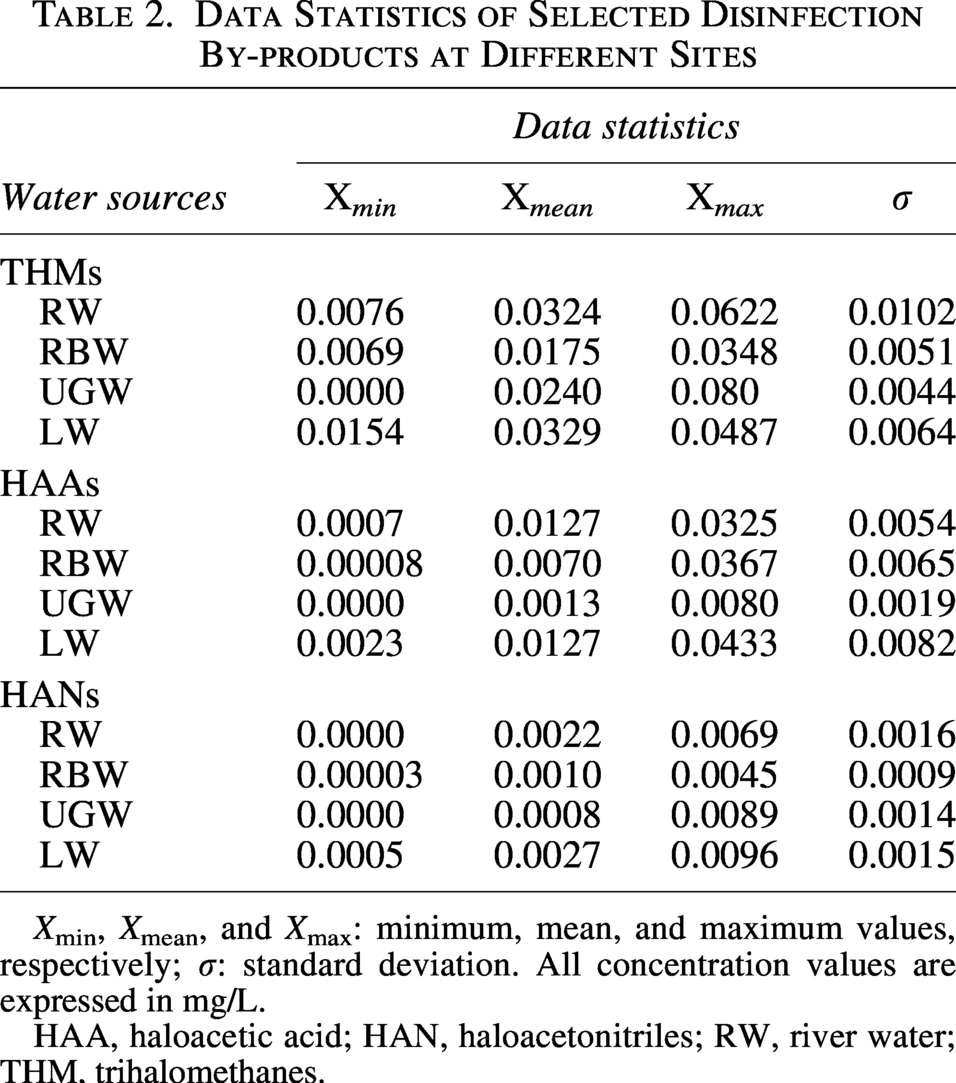
Xmin, Xmean, and Xmax: minimum, mean, and maximum values, respectively; σ: standard deviation. All concentration values are expressed in mg/L.
HAA, haloacetic acid; HAN, haloacetonitriles; RW, river water; THM, trihalomethanes.
The treatment plants analyzed in this study were categorized as either conventional or advanced, depending on their process configuration. Conventional treatment plants typically employed a sequence of coagulation, flocculation, sedimentation, rapid sand filtration, and final chlorination. In contrast, advanced treatment plants incorporated one or more additional processes aimed at improving the removal of organic precursors, most commonly ozonation, GAC adsorption, or BAC filtration. These supplementary steps enhanced the degradation or adsorption of dissolved OM, thereby reducing the potential for DBP formation in the finished water. All treatment plants applied chlorination as the final disinfection step in accordance with national water-quality standards. Chlorine dosage was not constant but routinely adjusted according to seasonal variation, source-water turbidity, and organic content. Operational records indicated that dosages generally ranged between 0.8 and 1.2 mg/L at the point of application. Detailed historical dosage logs, however, were not included in the archived dataset, a limitation discussed in Section 3.6.
Water quality datasets
Monitoring systems for water pollution play a crucial role in managing water quality across various resources by providing essential data for evaluating the concentrations of DBPs in drinking water. In South Korea, treatment plants and regional monitoring agencies routinely measure and record key DBPs, including THMs, HAAs, and HANs. Advancements in Global System for Mobile communication have enabled automated transmission of water quality data from local monitoring stations to centralized databases. The data used in this study were obtained from the open-access national platforms WaterNow and Korea Meteorological Administration, which provide verified, publicly available environmental and treatment water-quality datasets. Temperature data were obtained from the Korea Meteorological Administration database and represent monthly average values corresponding to the study period (2011–2022). The retrieved data included daily average concentrations of THMs, HAAs, and HANs (expressed in mg/L) from 2011 to 2022 across four different water-source types: RW, RBW, UGW, and LW. The DBP measurements correspond to treated water samples collected at the outlet of each water purification plant (postchlorination stage), representing the final water supplied to consumers. Additional parameters, such as TOC, DOC, and UV absorbance (UV254, UV280), were not available in the open dataset. However, these indicators are recognized as major precursors influencing DBP formation and are recommended for inclusion in future monitoring efforts. Likewise, detailed records of reaction time after chlorination were unavailable, which may introduce uncertainty in correlating DBP formation kinetics with operational conditions.
An important initial step in IPTA analysis was data preprocessing to enhance accuracy and continuity. A small proportion of missing daily data (<1% annually) was observed in the dataset, primarily due to routine maintenance or calibration of monitoring systems. To address these, several imputation techniques were evaluated—forward fill, backward fill, linear and quadratic interpolation, mean of nearest neighbors, and mean of seasonal counterparts. These approaches are well established for hydrological and environmental time-series reconstruction (Junninen et al., 2004; Little and Donald, 2019; AlSalehy and Bailey, 2025). Forward fill replaced missing values with the most recent valid observation, while backward fill used the next available value, preserving dataset continuity without distorting temporal structure. The mean squared error between imputed and observed values was computed to verify reliability. Monthly average concentrations (mg/L) were then calculated from daily measurements and used for IPTA analysis by plotting averages from 2011 to 2016 on the x-axis and those from 2017 to 2022 on the y-axis to visualize directional changes. No data normalization or transformation was applied, as IPTA relies on direct comparison of arithmetic mean values between two-time segments. Statistical uncertainty was evaluated using the standard deviations of monthly average concentrations, which quantify variability within each dataset, in combination with mean squared error analysis to ensure that interpolation did not introduce significant bias.
Results and Discussion
Changes in THMs trend
Figure 2 illustrates the IPTA graph depicting THM concentrations at various sites (RW, RBW, UGW, and LW). This graph compares pollutant concentrations from 2011 to 2016 (horizontal axis) with those from 2017 to 2022 (vertical axis), highlighting changes between these two periods. For instance, THM concentrations in the RW data predominantly fall below the 1:1 line (except for May to December), indicating a steady decrease in THM concentrations over the last 6 years (2017–2022) compared with the initial 3 years (2011–2016). An exception to this trend was observed in May and December, where no significant systematic change affected the overall trend. The absence of regular polygons for THM concentrations suggests variability in monthly arithmetic average concentrations, reflecting a lack of consistent trends. In contrast, regular polygons indicate stable changes. Conversely, THM concentrations in RBW appeared above the 1:1 line during January, March, April, June, July, September, October, and November, indicating an increase in THM concentrations during these months. Conversely, THM concentrations remained neutral in February, August, and December, with a decreasing trend observed only in May.

IPTA plots of monthly mean THM concentrations in RW, RBW, UGW, and LW, comparing 2011–2016 (x-axis) and 2017–2022 (y-axis). The 1:1 line indicates no change.
The graph depicting THM concentrations in UGW revealed a decrease during January, May, June, and August, while an increase was observed in February, March, April, July, September, October, November, and December. Overall, THM concentrations in UGW increased in 8 months and decreased in 4 months of the year. Similarly, in LW, THM concentrations increased during January, February, April, May, June, July, November, and December, while decreases were observed in March, September, and October, and no trend was evident in August. A critical observation is that THM concentrations have increased sharply in RBW, UGW, and LW in recent years, highlighting the need for close monitoring. The increasing trends in these stagnant or low-flow water sources may be associated with longer source-water residence times and greater accumulation of organic precursors prior to treatment, which can increase DBP formation potential after chlorination. In contrast, RW represents a flowing system connected to the Nakdong River, where continuous water movement, dilution, and shorter retention time limit DBP buildup and enhance natural reaeration and photodegradation. Therefore, the lower THM levels observed in RW compared with RBW, UGW, and LW are consistent with hydrodynamic and precursor-availability differences among these water bodies. These observations are consistent with previous studies reporting higher DBP concentrations in stagnant or low-flow water sources due to increased precursor accumulation and reduced dilution effects (Alver et al., 2025a; Alver et al., 2025b). In addition, the continuous flow in RW promotes rapid dilution of DBPs, while extended rainy seasons further reduce concentrations by flushing out localized zones of higher contamination. THM concentrations increased in RBW, UGW, and LW during the study period. These findings suggest that policymakers and water managers should give particular attention to improving the water quality of these resources through targeted monitoring and management strategies. However, THM concentrations exhibited a decreasing trend in RW, which may indicate improved water quality in river systems influenced by continuous flow and dilution dynamics. Unlike RBW, UGW, and LW, which represent stagnant or low-exchange environments, RW is characterized by greater mixing, dilution, and seasonal flushing, which can influence source-water quality and precursor availability prior to treatment. Consequently, DBP formation potential tends to be lower in such flowing systems.
The previously mentioned speculation regarding rainfall and detection errors has been clarified. While heavy rainfall events can increase catchment runoff and transport of NOM into rivers, they also substantially increase discharge and dilution capacity, often resulting in net decreases in measured DBP concentrations. Furthermore, the detection system follows uniform calibration protocols across all plant types, so systematic measurement errors are unlikely to explain the trend differences. The increasing THM trends observed in RBW, UGW, and LW are plausibly related to their longer water residence times and higher accumulation of organic precursors, which are less efficiently flushed or degraded. Future investigations should therefore focus on quantifying and characterizing OM—including TOC, DOC, UV absorbance at 254 nm, true color, and SUVA—across all water types to establish causal relationships between OM composition and DBP formation potential. Finally, all DBP concentrations analyzed in this study were measured postchlorination at the treatment plant outlets, following national monitoring standards. Chlorine was used as the sole disinfectant, with dosage adjusted seasonally according to source-water conditions. Detailed reaction times or chlorine decay profiles were not available in the open dataset; therefore, this represents an important area for future process-specific assessment.
Table 3 presents the arithmetic means used to construct Figure 2. It also reports the corresponding standard deviations, trend lengths (TL, expressed in mg/[L·month]), and trend slopes of monthly average THM concentrations in RW, RBW, UGW, and LW. The dataset—publicly available from the WaterNow portal—shows measurable variability in THM concentrations across months and water sources. In RW, pronounced changes in mean THM concentrations and standard deviations were observed between April–May, August–September, and November–December, while other months showed more stable values. These fluctuations are not strictly seasonal, as they span both warm and cool periods, suggesting that short-term operational or hydrological factors (e.g., flow rate, precursor loading, or water-temperature shifts) may have played a larger role than seasonal effects alone. In RBW, standard deviations varied notably between January–April and again from July–December, while UGW exhibited higher month-to-month variability from January–February and September–October, indicating sensitivity to local groundwater recharge or chlorination adjustments. For LW, elevated variability was detected from January–May and again in October–November, possibly reflecting stratification effects and changing organic inputs during late autumn. The maximum trend length, mean, and standard deviation values were 0.012, 0.0208, and 0.010 mg/L for RW; 0.006, 0.006, and 0.0039 mg/L for RBW; 0.005 and 0.004 mg/L for UGW; and 0.004 mg/L for LW, respectively. These differences highlight the need to further examine how source-specific hydraulic conditions and precursor characteristics influence monthly THM dynamics. While this study identifies distinct statistical patterns, future work incorporating organic-matter data and treatment-process parameters is required to confirm the drivers of these variations.
Quantitative Analysis of Trihalomethanes at Targeted Water Sources
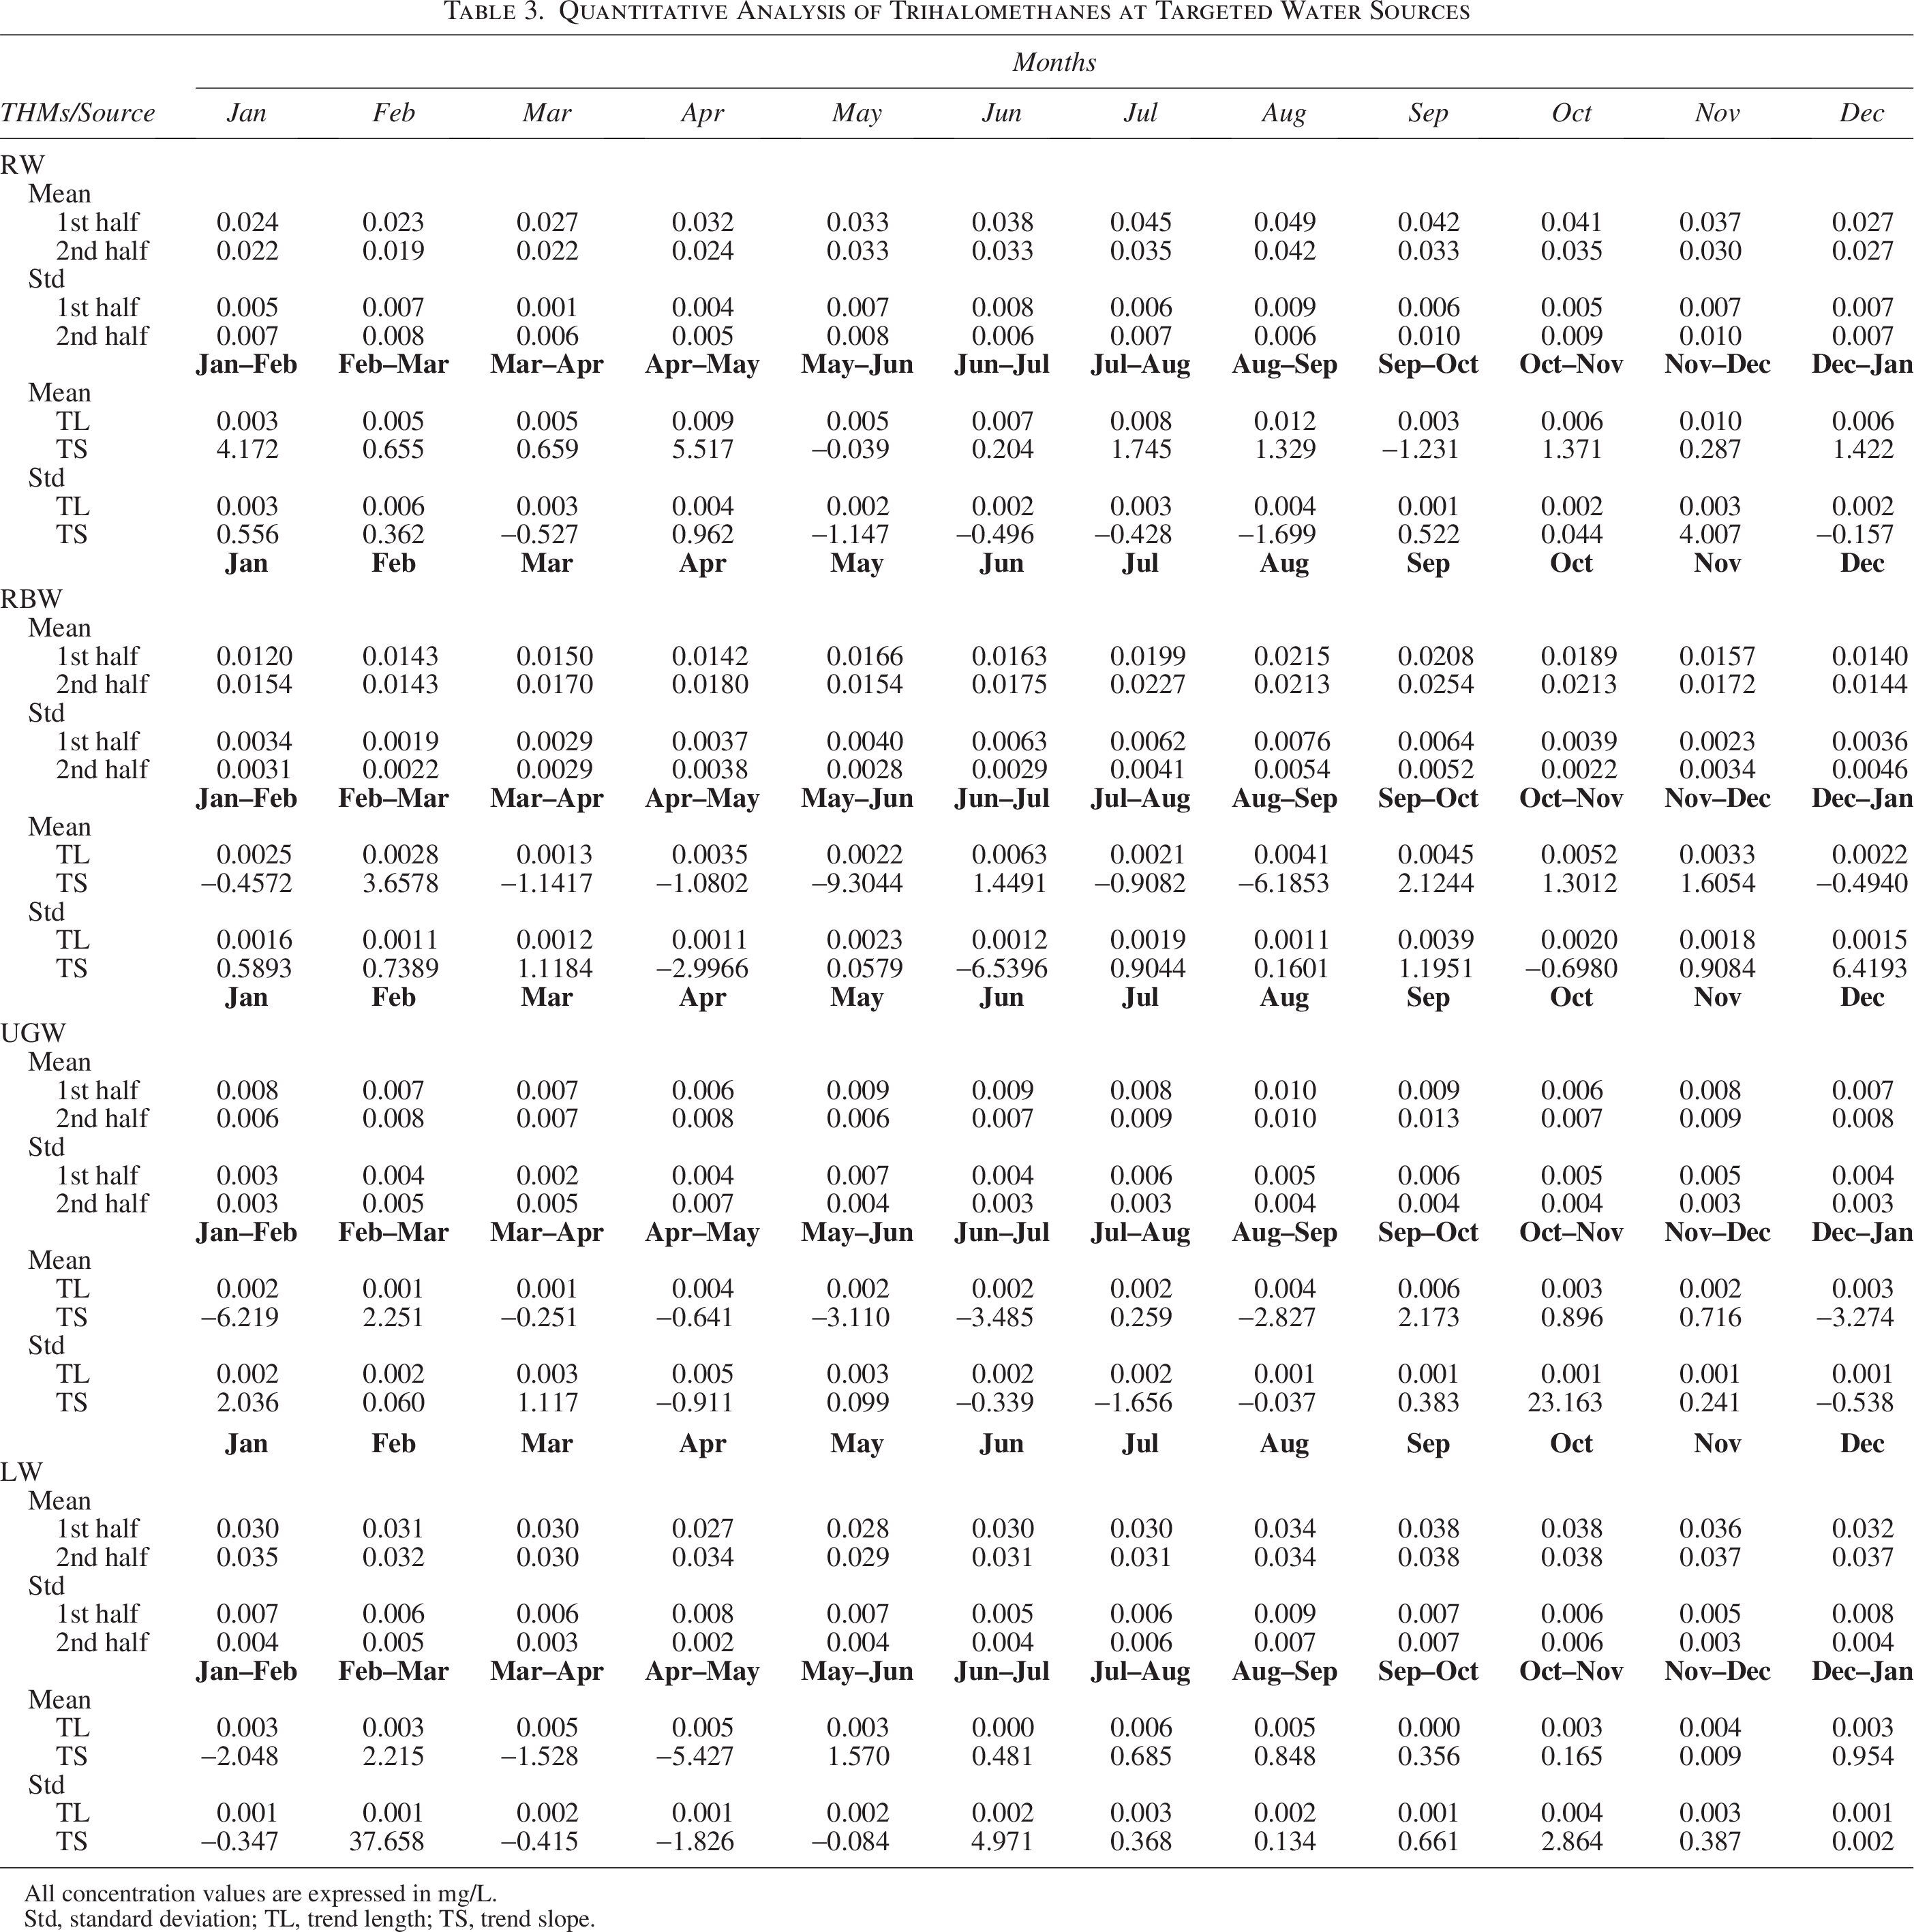
All concentration values are expressed in mg/L.
Std, standard deviation; TL, trend length; TS, trend slope.
Changes in HAAs trend
Figure 3 displays the IPTA graphs illustrating HAAs at various sites (RW, RBW, UGW, and LW). This figure compares pollutant concentrations from 2011 to 2016 on the horizontal axis with those from 2017 to 2022 on the vertical axis, highlighting concentration shifts between the two 6-year periods. For instance, HAA concentrations in RW generally remained below the 1:1 line (except for January and February), indicating a gradual decrease in recent years compared with the earlier period. The absence of a clear trend in April did not substantially affect this overall decline. In contrast, HAA concentrations in RBW consistently appeared above the 1:1 line, indicating an overall increase across most months. For UGW, a mixed pattern was observed—decreasing trends in March, August, September, October, and December, and increasing trends in the remaining months. This variability likely reflects short-term hydrological or operational fluctuations such as changes in recharge, contact time, or residual chlorine levels, rather than a uniform long-term directional trend. In LW, HAA concentrations generally increased throughout the year, with March showing a slight decrease. The observed upward tendencies in RBW and LW suggest higher precursor availability or longer residence times that promote DBP formation. However, the concentrations of HAAs remained within national drinking-water standards (typically <60 mg/L), and therefore these increases are not necessarily of regulatory concern. Continued monitoring is nonetheless recommended to identify whether such patterns persist or intensify over time. Only January and February in RW exhibited an increase in HAAs during the recent period, which may be related to low-temperature effects on precursor removal efficiency. A more detailed assessment of influencing factors—such as TOC, DOC, UV absorbance, and treatment operation data—was not possible in this study due to the limited availability of ancillary parameters in the open-access datasets. Future work incorporating these measurements will help elucidate the mechanisms underlying the observed temporal trends.

IPTA plots of monthly mean HAA concentrations for RW, RBW, UGW, and LW, showing trends between 2011–2016 and 2017–2022.
An increasing trend was observed in water resources (RBW and LW), whereas increases during two and 5 months were observed in RW and UGW, respectively. A similar pattern to THMs was observed, with increasing trends in RBW and LW and more stable behavior in RW. Fast dilution of organics in RW may be one reason for the decreasing trend, and long rainy seasons can also cause the flushing of highly concentrated water pockets. The results indicate that HAA concentrations have recently gradually increased significantly in RBW and LW resources. Therefore, policymakers should prioritize efforts aimed at enhancing the water quality of these resources. The decreasing HAA concentrations observed in RW suggest improving RW quality. This trend may reflect enhanced precursor removal efficiency, improved source-water management, or reduced organic loading in recent years. Given the dynamic nature of river systems—with higher dilution rates and shorter residence times compared with RBW, UGW, and LW—HAA formation potential is inherently lower. Further investigation incorporating OM characterization and treatment process data would help confirm the underlying causes of this decline. Monitoring other DBPs could provide additional insights into the water quality of these targeted resources, facilitating the assessment of improvements or deteriorations in regional water quality.
Like previous sections, irregular polygons were absent, and transitions between decreasing and increasing trends were evident. The following are key observations from the IPTA graphs of HAA concentrations presented in Figure 3 for RW, RBW, UGW, and LW. While a complete increase was noted from December to January, there was a significant shift from a decreasing to an increasing trend in the arithmetic mean HAA concentrations for RW. Similarly, a steady decrease was observed after March and subsequent months until July, with another notable transition from February to March showing decreasing HAA concentrations. The final segment of the IPTA analysis involves transitions from decreasing to an increasing trend, culminating in the January transition from December in the arithmetic mean graph. Throughout the year, HAA concentrations decreased overall, with significant standard deviation changes observed only in January and February over the last 6 years in RW. Conversely, RBW exhibited an increasing trend in HAA concentrations, with notable month-to-month variations across the years analyzed. As discussed, both RBW and LW showed increased HAA concentrations throughout the year. In contrast, UGW displayed increasing and decreasing trends, highlighting the need for further investigation into feedwater analysis to understand potential causes and solutions for minimizing HAA concentrations in RBW, LW, and UGW. This trend analysis can assist policymakers in revising future policies aimed at enhancing household water quality by reducing DBP concentrations.
Table 4 provides the arithmetic mean values of the concentrations (mg/L) of the targeted DBPs in RW, RBW, UGW, and LW, facilitating quantitative analysis of the dataset. For example, the trend length was the longest during June–July, while the shortest was in September and October for HAAs sourced from RW. The highest standard deviations were noted in March–April and August–September. The trend lengths of HAA concentrations were longer during August–October and shorter during March–April in the RBW source, and the highest and lowest standard deviations were observed during December and January, respectively. Moreover, in the UGW, longer and similar trend lengths were noticed during May–June, June–July, August–September, and December–January, with a minimum in January–February. The highest standard deviation was observed in August and September and zero in January, April, and May. For LW, the most increased trend lengths were noticed in March–April and December–January. The standard deviation was higher during March–April, August–September, and October–November–December. The standard deviation is also higher between the months in the RBW and LW sources. Therefore, concerned authorities should prioritize these two sources to find the possible cause and best options by providing either pre- or posttreatment opportunities to minimize the increasing trend of HAAs in water sources.
Quantitative Analysis of Haloacetic Acids at Targeted Water Sources
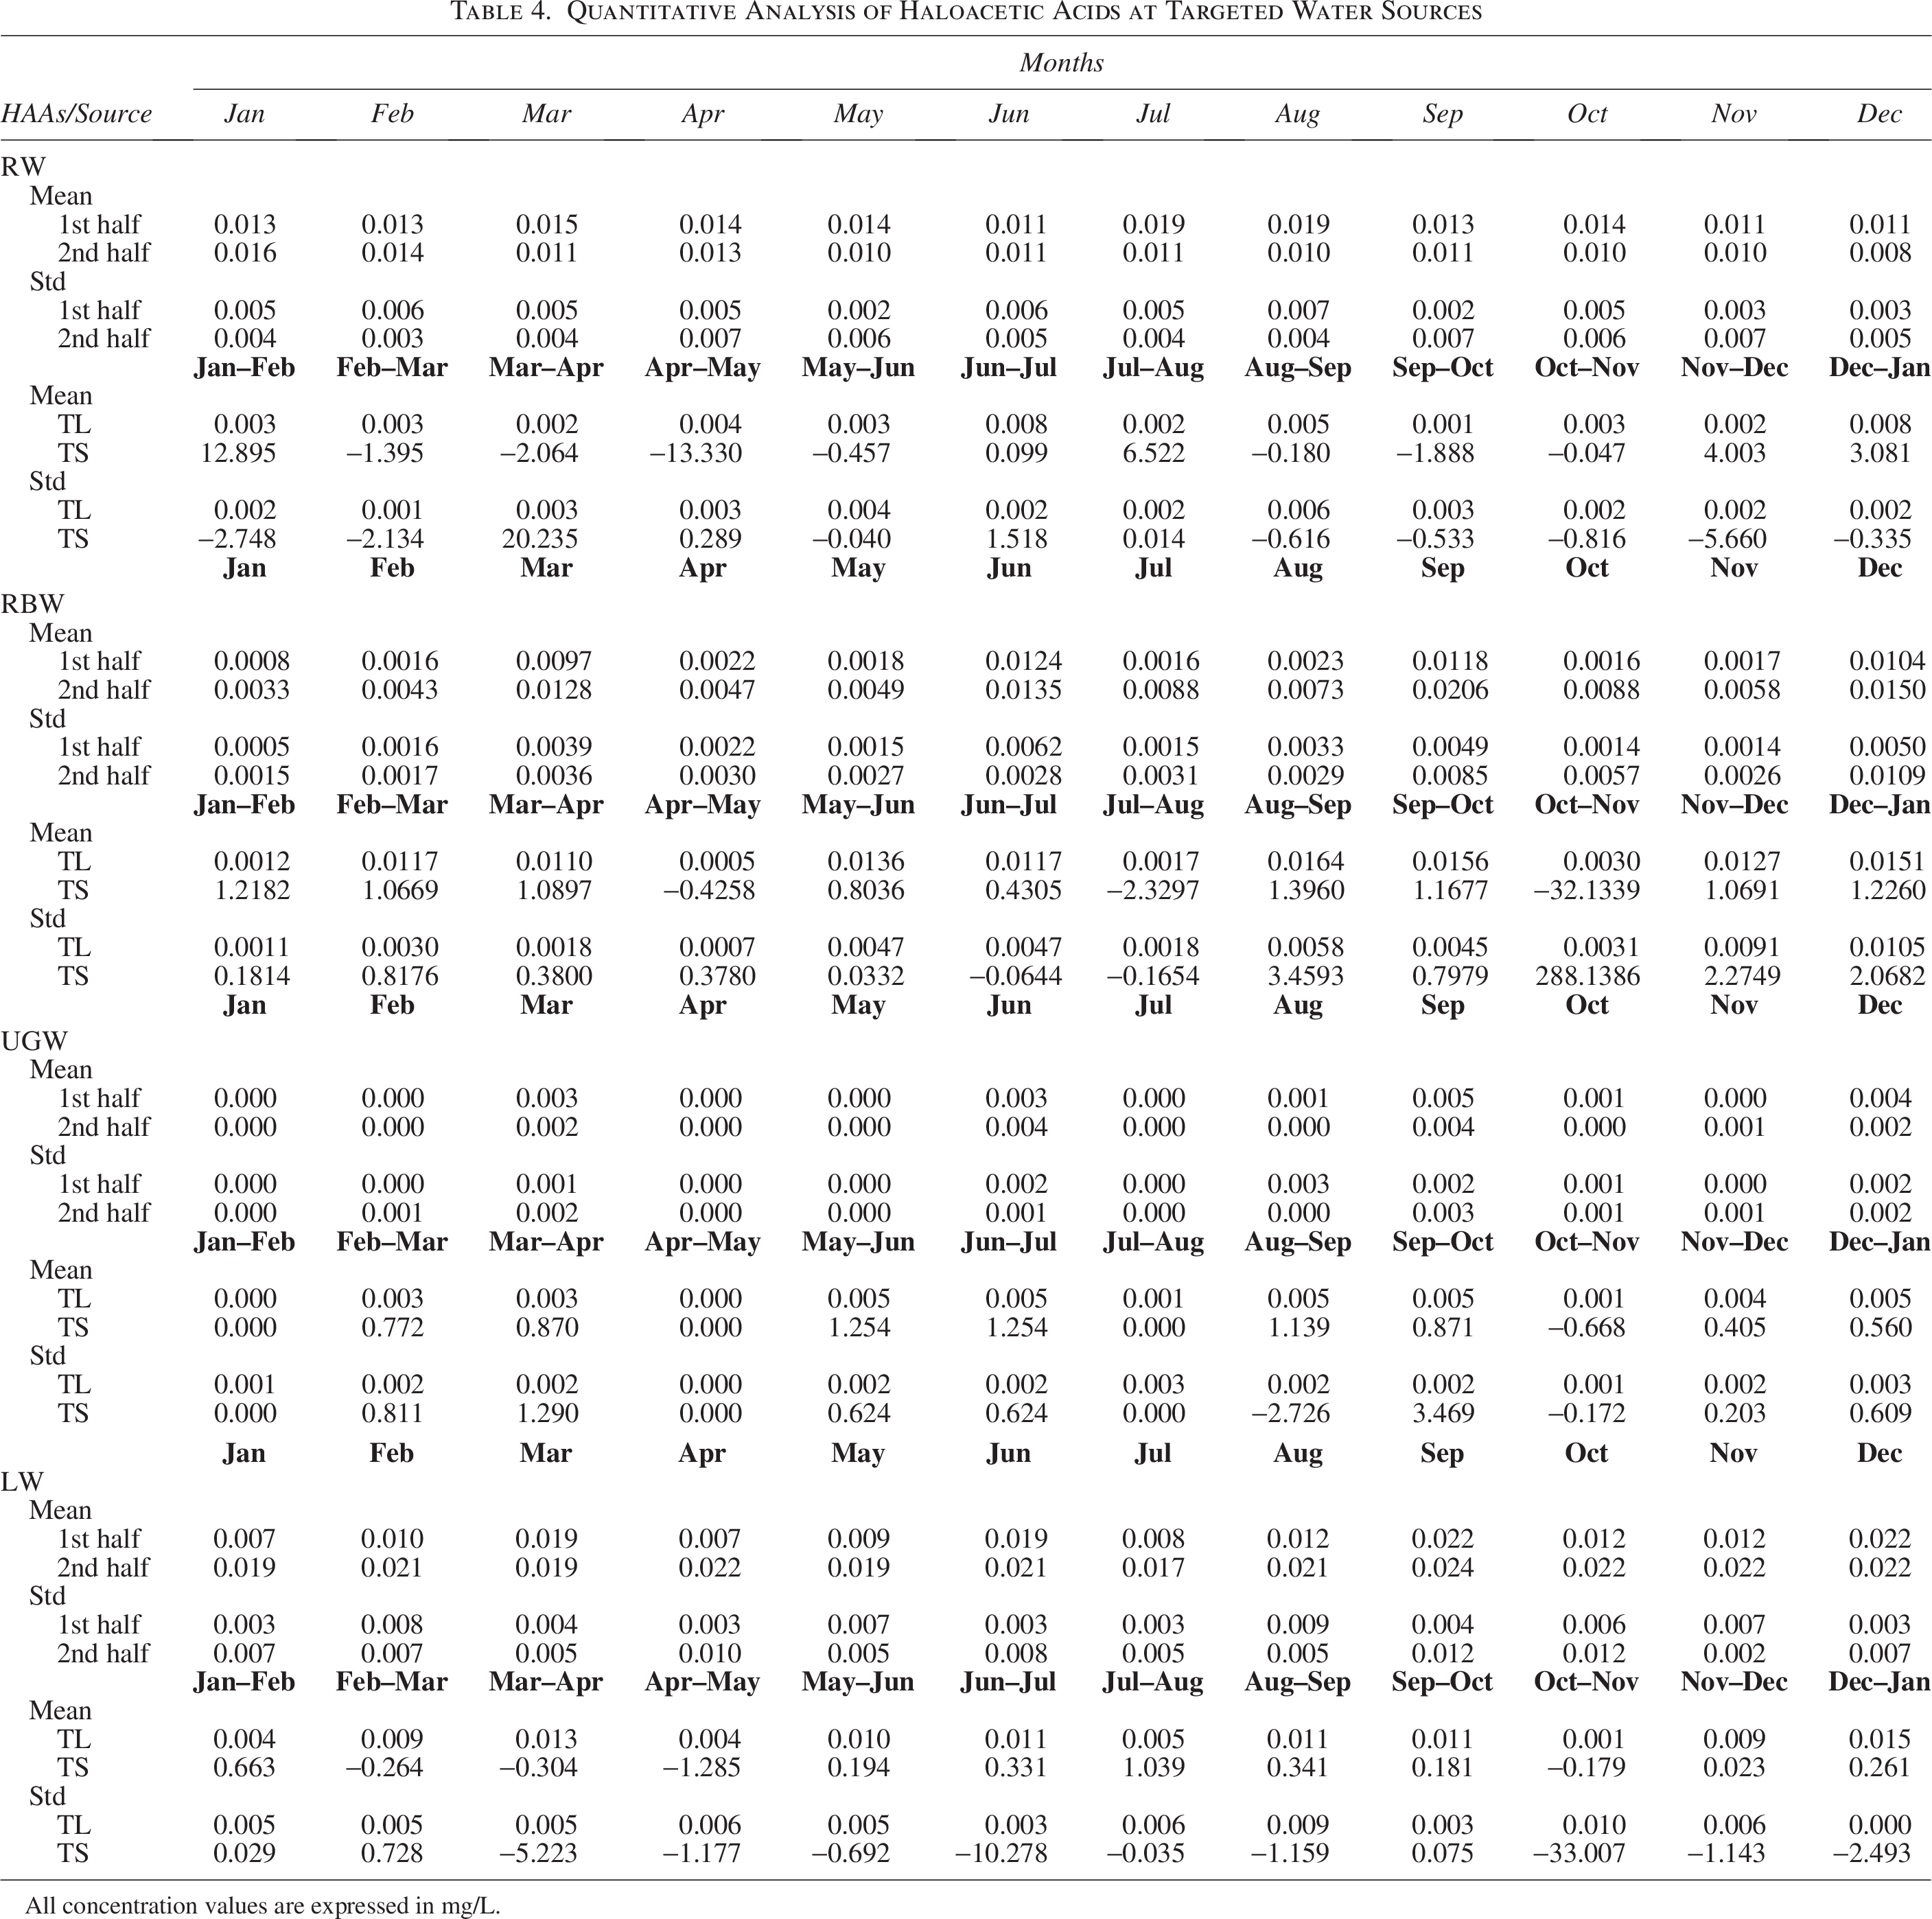
All concentration values are expressed in mg/L.
Changes in HAN trend
Figure 4 shows an IPTA graph illustrating the trends of HANs at the sites (RW, RBW, UGW, and LW). This graph charts the concentrations of HANs from 2011 to 2016 on the horizontal axis against those from 2017 to 2022 on the vertical axis, allowing for comparison between the two periods. For instance, HAN concentrations in the RW data consistently fall below the 1:1 line (like HAAs in January), suggesting a steady decrease over the last 6 years (2017–2022) compared with the initial 6 years (2011–2016). The absence of regular polygons in the HAN concentrations indicates that the monthly arithmetic average concentration did not remain constant, indicating a lack of systematic change. In contrast, the HAN concentration in RBW appeared above the 1:1 line throughout the year, except for January and December, wherein it fell on the line, indicating no trend change. Overall, an increasing trend of HAN concentration was observed during the 10 months of the year, and the concentration was unchanged during January and December.
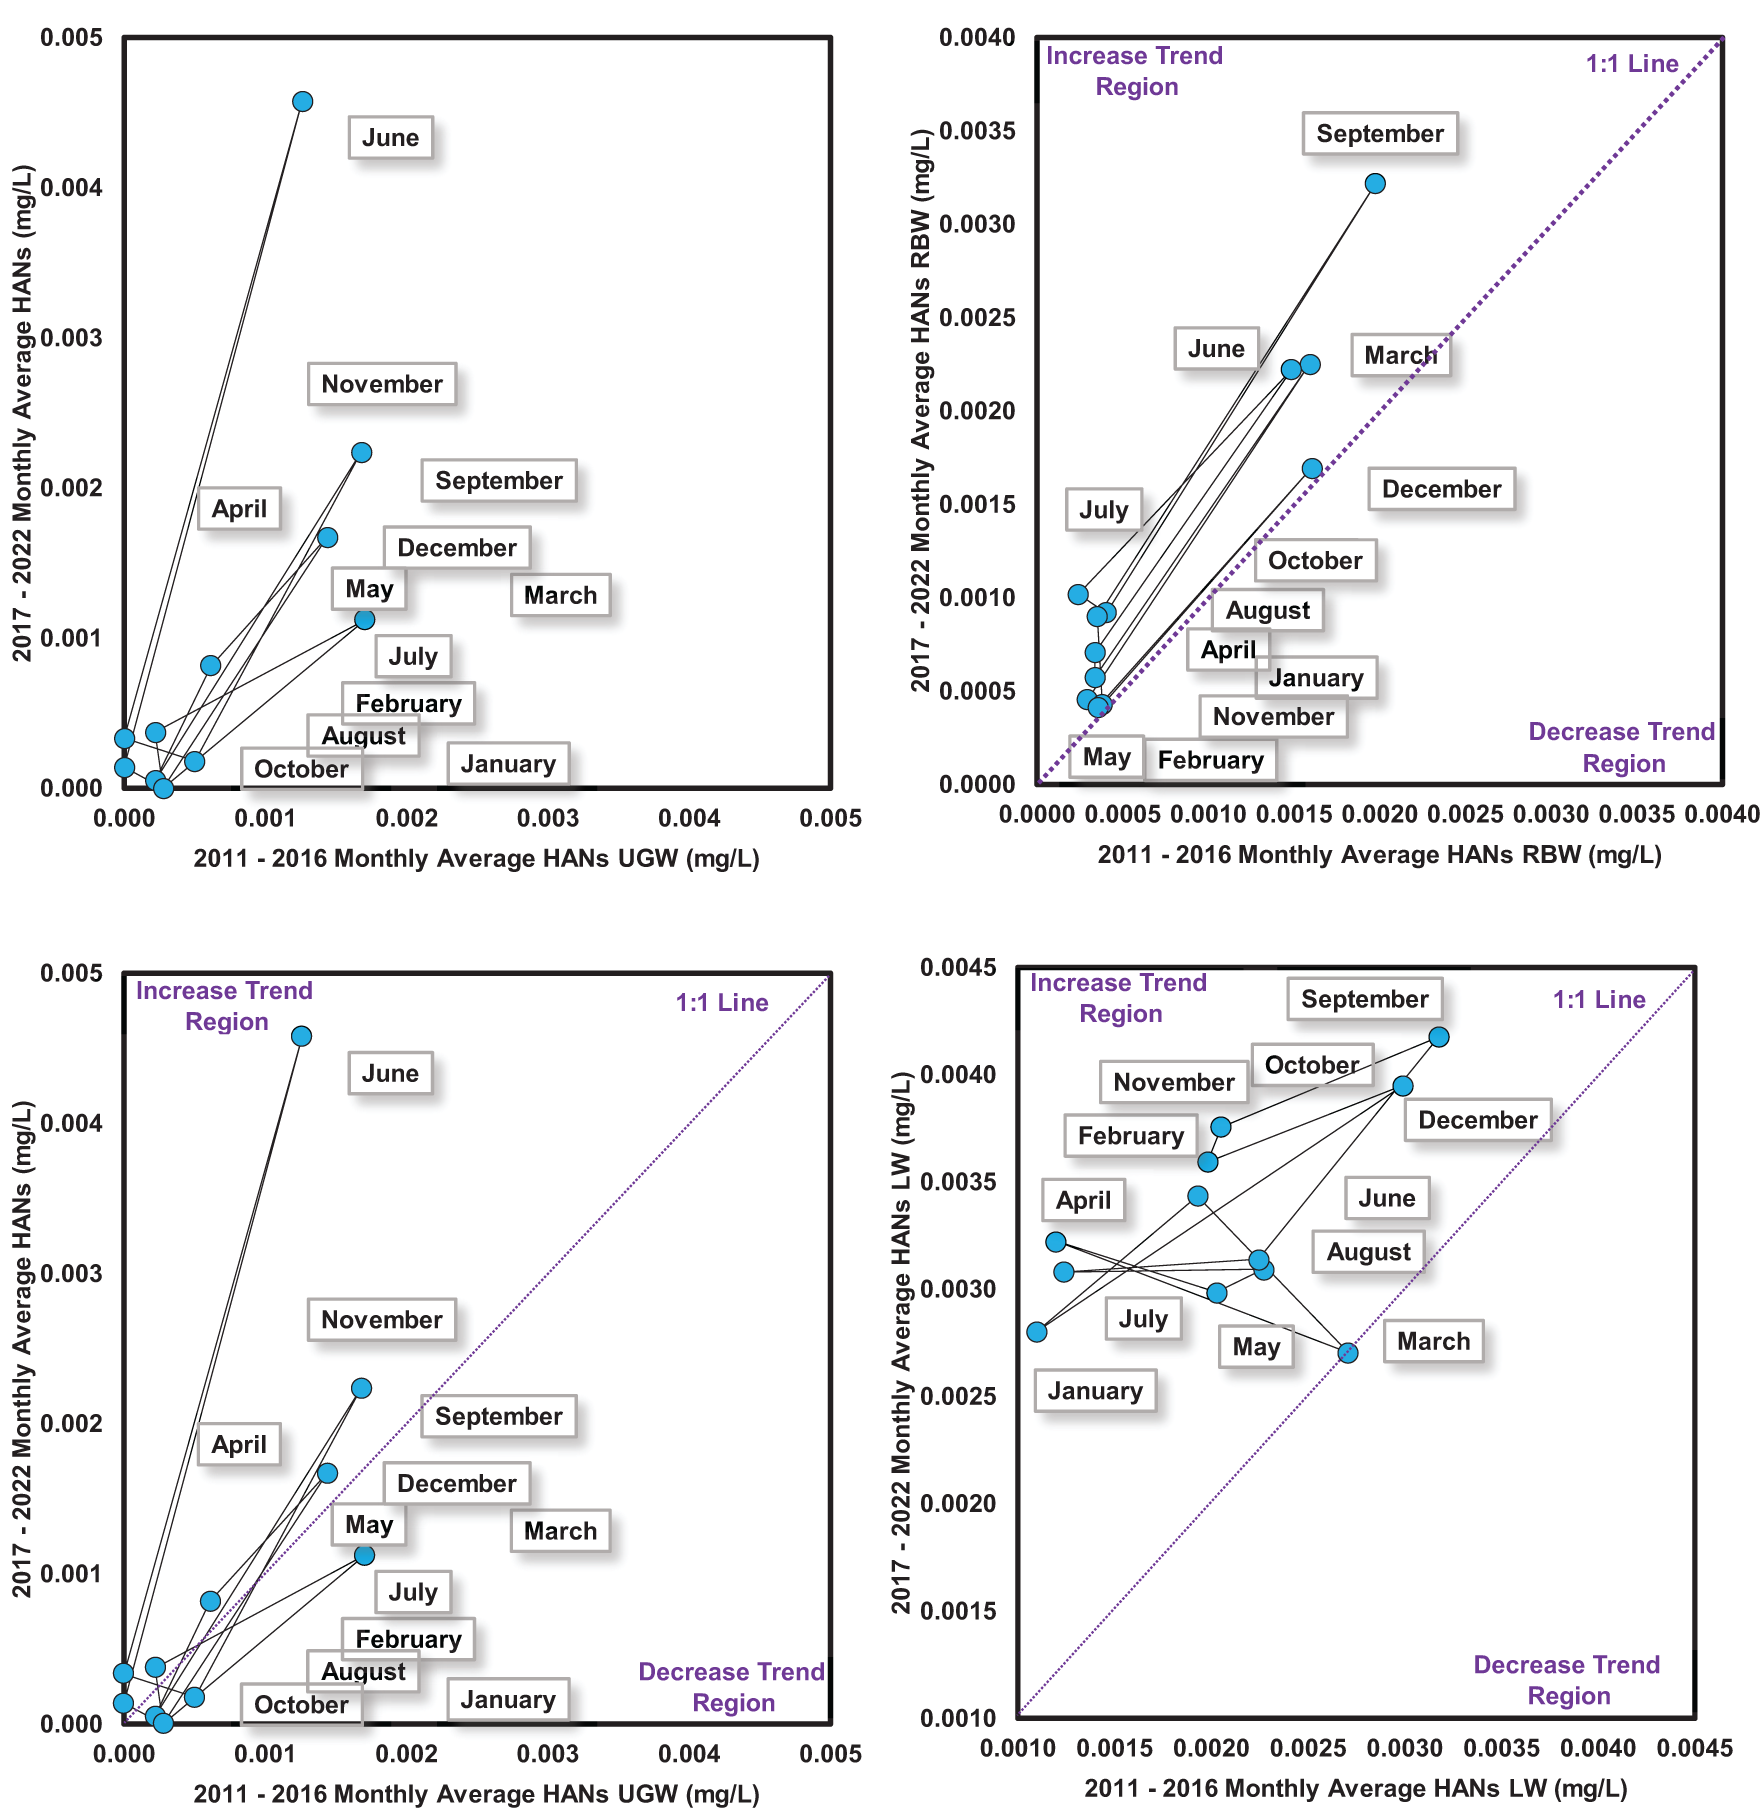
IPTA plots of monthly mean HAN concentrations for RW, RBW, UGW, and LW. Points near the 1:1 line indicate minimal change.
The plot for HAN concentrations in UGW showed a decreasing trend during January, March, April, August, and October and an increasing trend during the remaining months. However, many of these variations were close to the origin of the IPTA plot, indicating that the absolute concentration changes were very small—typically within analytical uncertainty. Therefore, while the IPTA visualization suggests minor directional shifts, these should not be interpreted as statistically significant long-term trends. Instead, they reflect low background levels of HANs in groundwater, where overall concentrations remained stable and well below guideline limits throughout the study period. Overall, an increasing trend of HAN concentrations in UGW was observed during 7 months of the year, while decreasing trends were found in 5 months. This roughly balanced pattern suggests short-term variability rather than a persistent directional trend. Moreover, in LW, the concentration of HANs also showed an increasing trend throughout the year, except for March, when it fell on the no-trend line; this is very similar to the HAAs trend. HAAs and HANs have a close relationship, as their trend changes are very similar in all water sources, especially in RBW and LW, where the trend is increasing. However, additional studies examining the correlations between DBP concentrations, OM characteristics, and treatment process conditions are recommended to improve understanding of the mechanisms driving these temporal variations.
A critical observation is that HAN concentrations have shown a noticeable increase in recent years in RBW and LW, with a slight rise in UGW. These upward tendencies warrant continued observation to determine whether they represent persistent trends or short-term variability. The increases observed in stagnant or low-flow sources (RBW, UGW, and LW) likely reflect longer hydraulic residence times and greater accumulation of organic precursors that favor DBP formation. In contrast, RW represents a continuously flowing river system connected to the Nakdong River, where dilution, flushing, and shorter retention times limit DBP buildup and reduce formation potential. Moreover, fast dilution occurs in RW, concentration decreases, and long rainy seasons can also cause highly concentrated water pockets to flush. These results indicate that HAN concentrations have gradually increased in RBW, UGW, and LW in recent years. Therefore, policymakers and water managers are encouraged to focus on factors that enhance the water quality of these resources. In contrast, HAN concentrations showed a decreasing trend in RW, which may indicate improving RW quality. This decreasing trend should be examined further to determine whether it reflects genuine improvements in treatment performance or variations in precursor loading and hydrological conditions affecting HAN formation in RW. Monitoring other DBPs can provide additional insights into the water quality of the targeted water resources. Such information can help confirm and assess improvements or deteriorations in the overall water quality of the region.
The numerical data for the IPTA diagram and additional information are presented in Table 5. The trend length and standard deviations were insignificant between months, indicating no significant changes in the HAN concentrations in RW over the last decade. For RBW, trend lengths and standard deviations were considerable throughout the year but were higher during August–October and June–September, respectively. In UGW sources, a similar trend of HANs concentration was noted in RW, as there were no significant changes in trend lengths and standard deviations. A similar trend was observed for LW trend lengths and standard deviations, although an increasing trend was observed in LW sources.
Quantitative Analysis of Haloacetonitriles at Targeted Water Sources
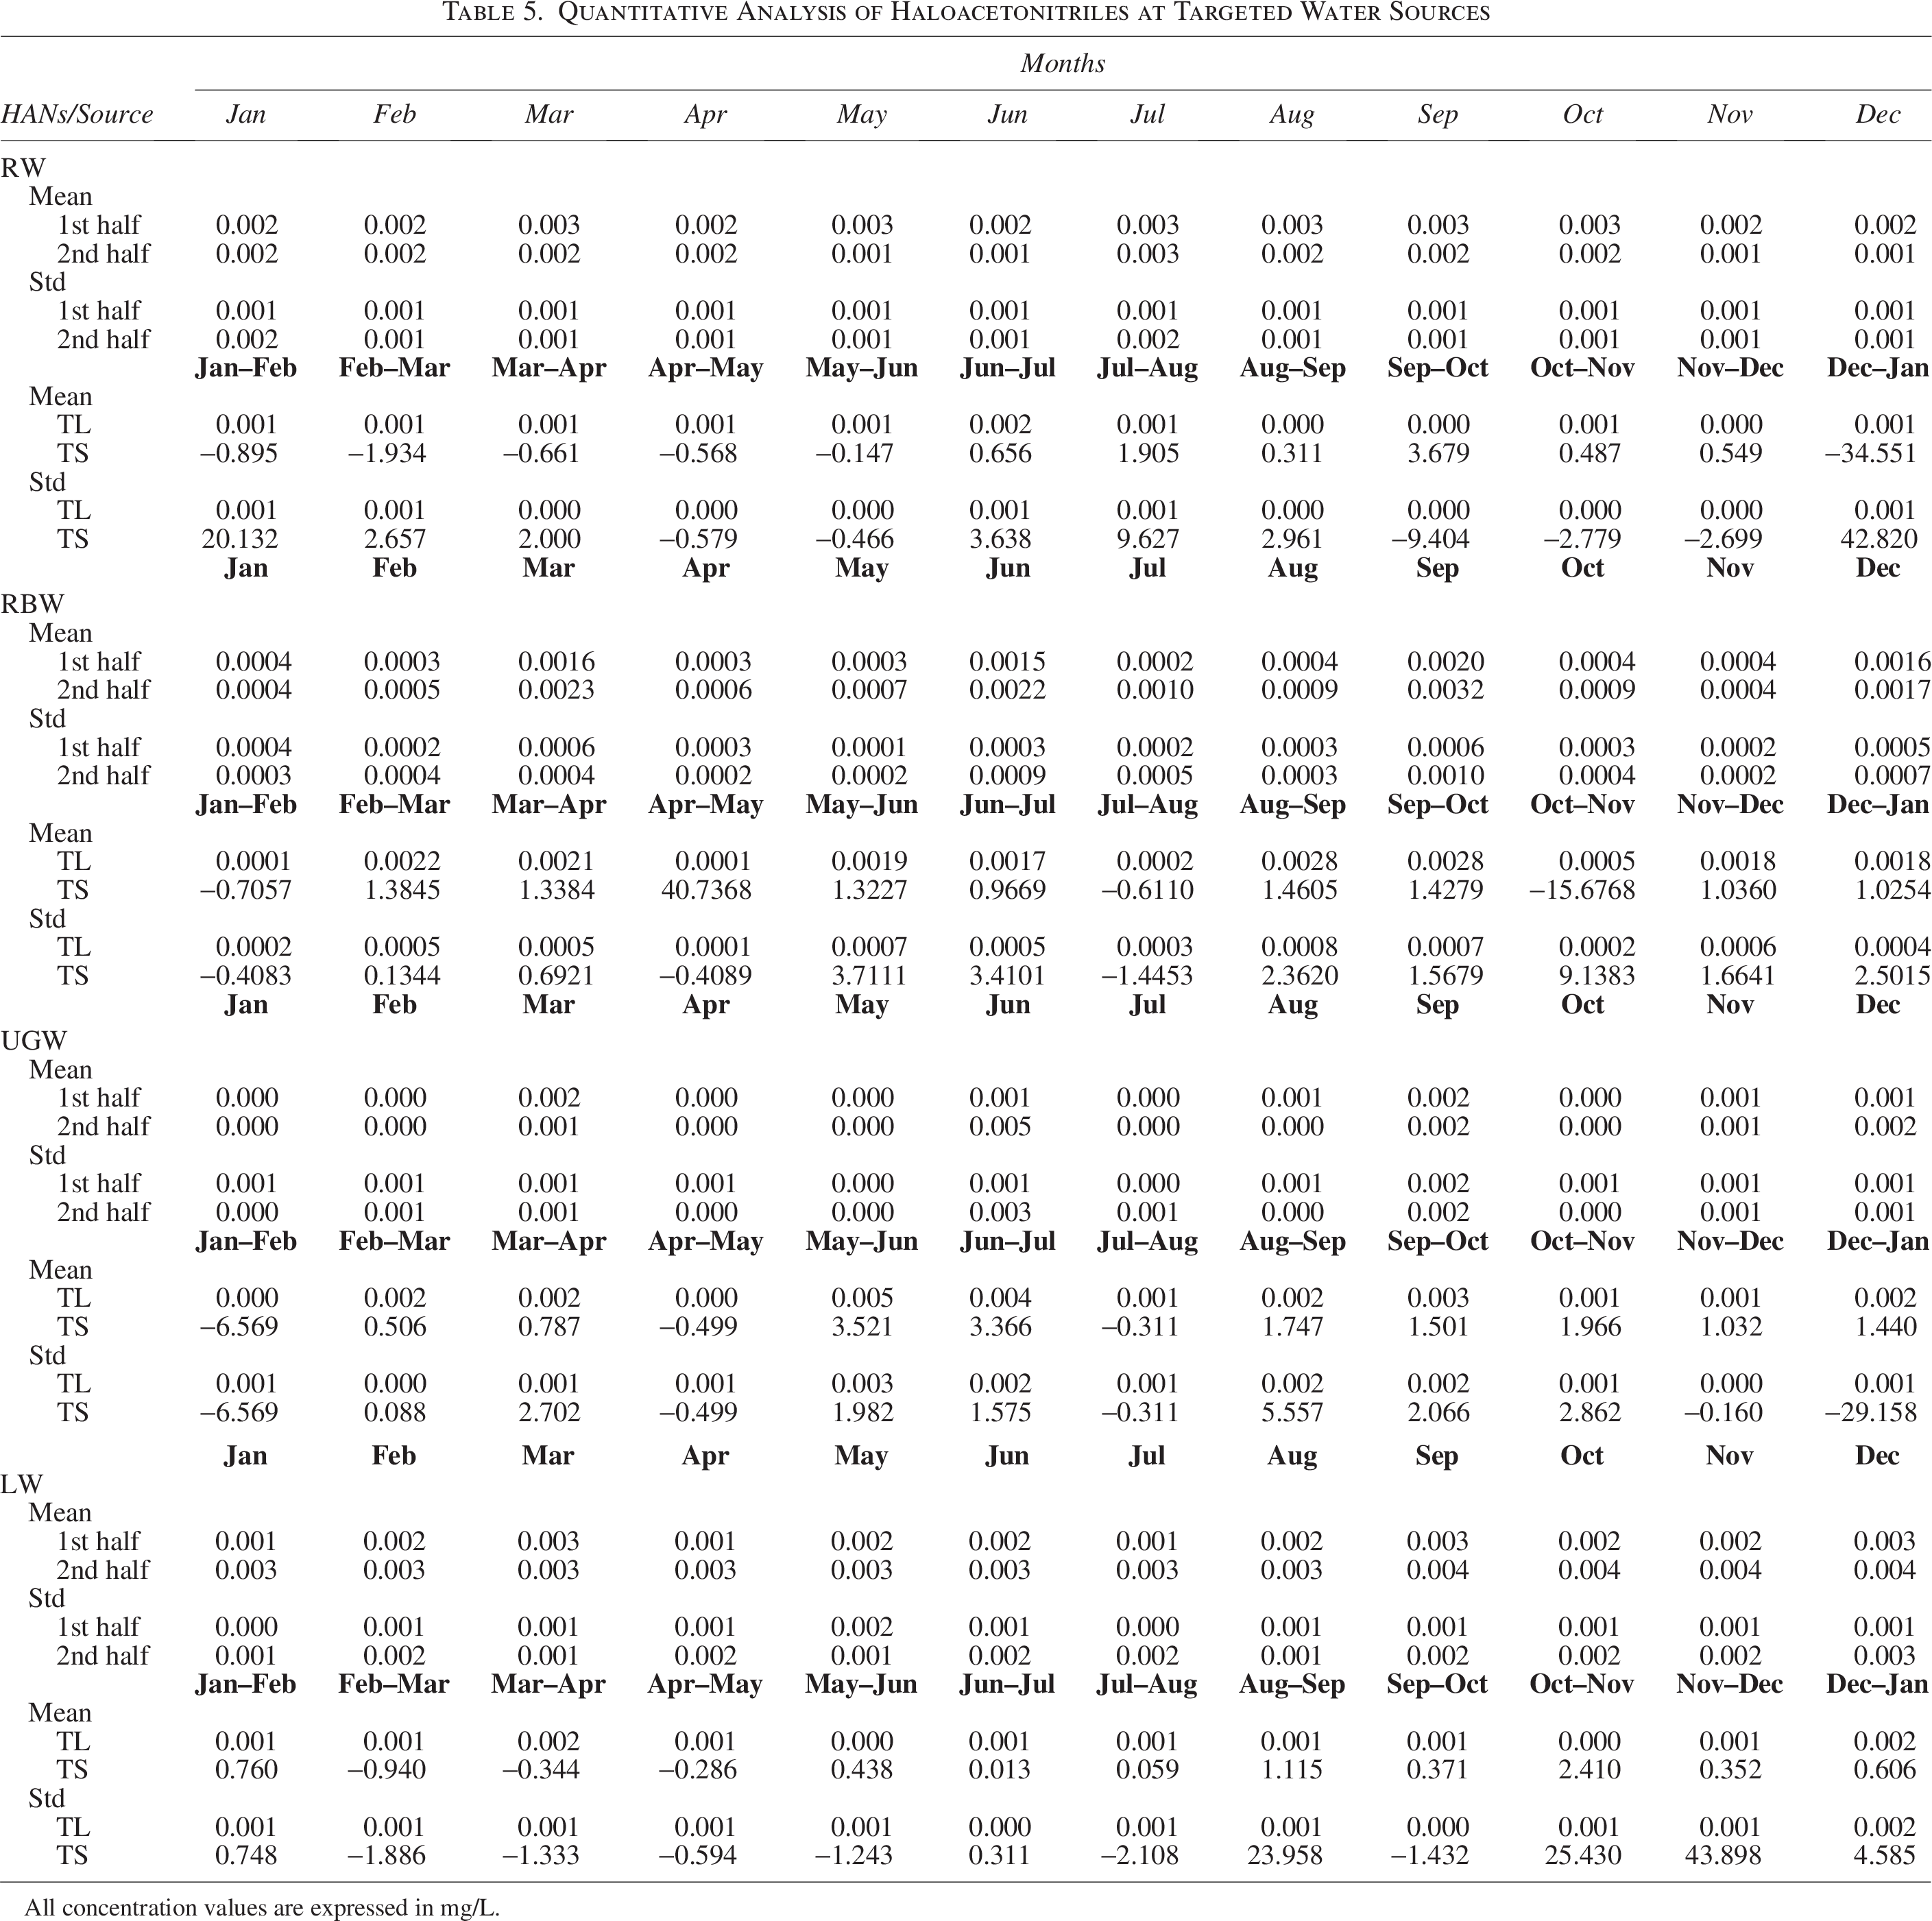
All concentration values are expressed in mg/L.
The concentration of HANs exhibited a decreasing trend over the years in RW, except for an increasing trend observed mainly in January. For RBW, an increasing trend was observed throughout the year, whereas during January and December, no trend was observed, and a similar increasing trend was seen in the HAN concentrations of LW, except in March. UGW presented mixed increasing and decreasing trends. These variations are likely influenced by source-water characteristics, hydrological conditions, and treatment practices. Moreover, hydrological and meteorological conditions can influence variations in DBP concentrations across different water sources. Therefore, enhanced coordination among treatment plants, distribution utilities, and regulatory agencies is recommended to facilitate data sharing and support more effective management of increasing DBP trends in water resources.
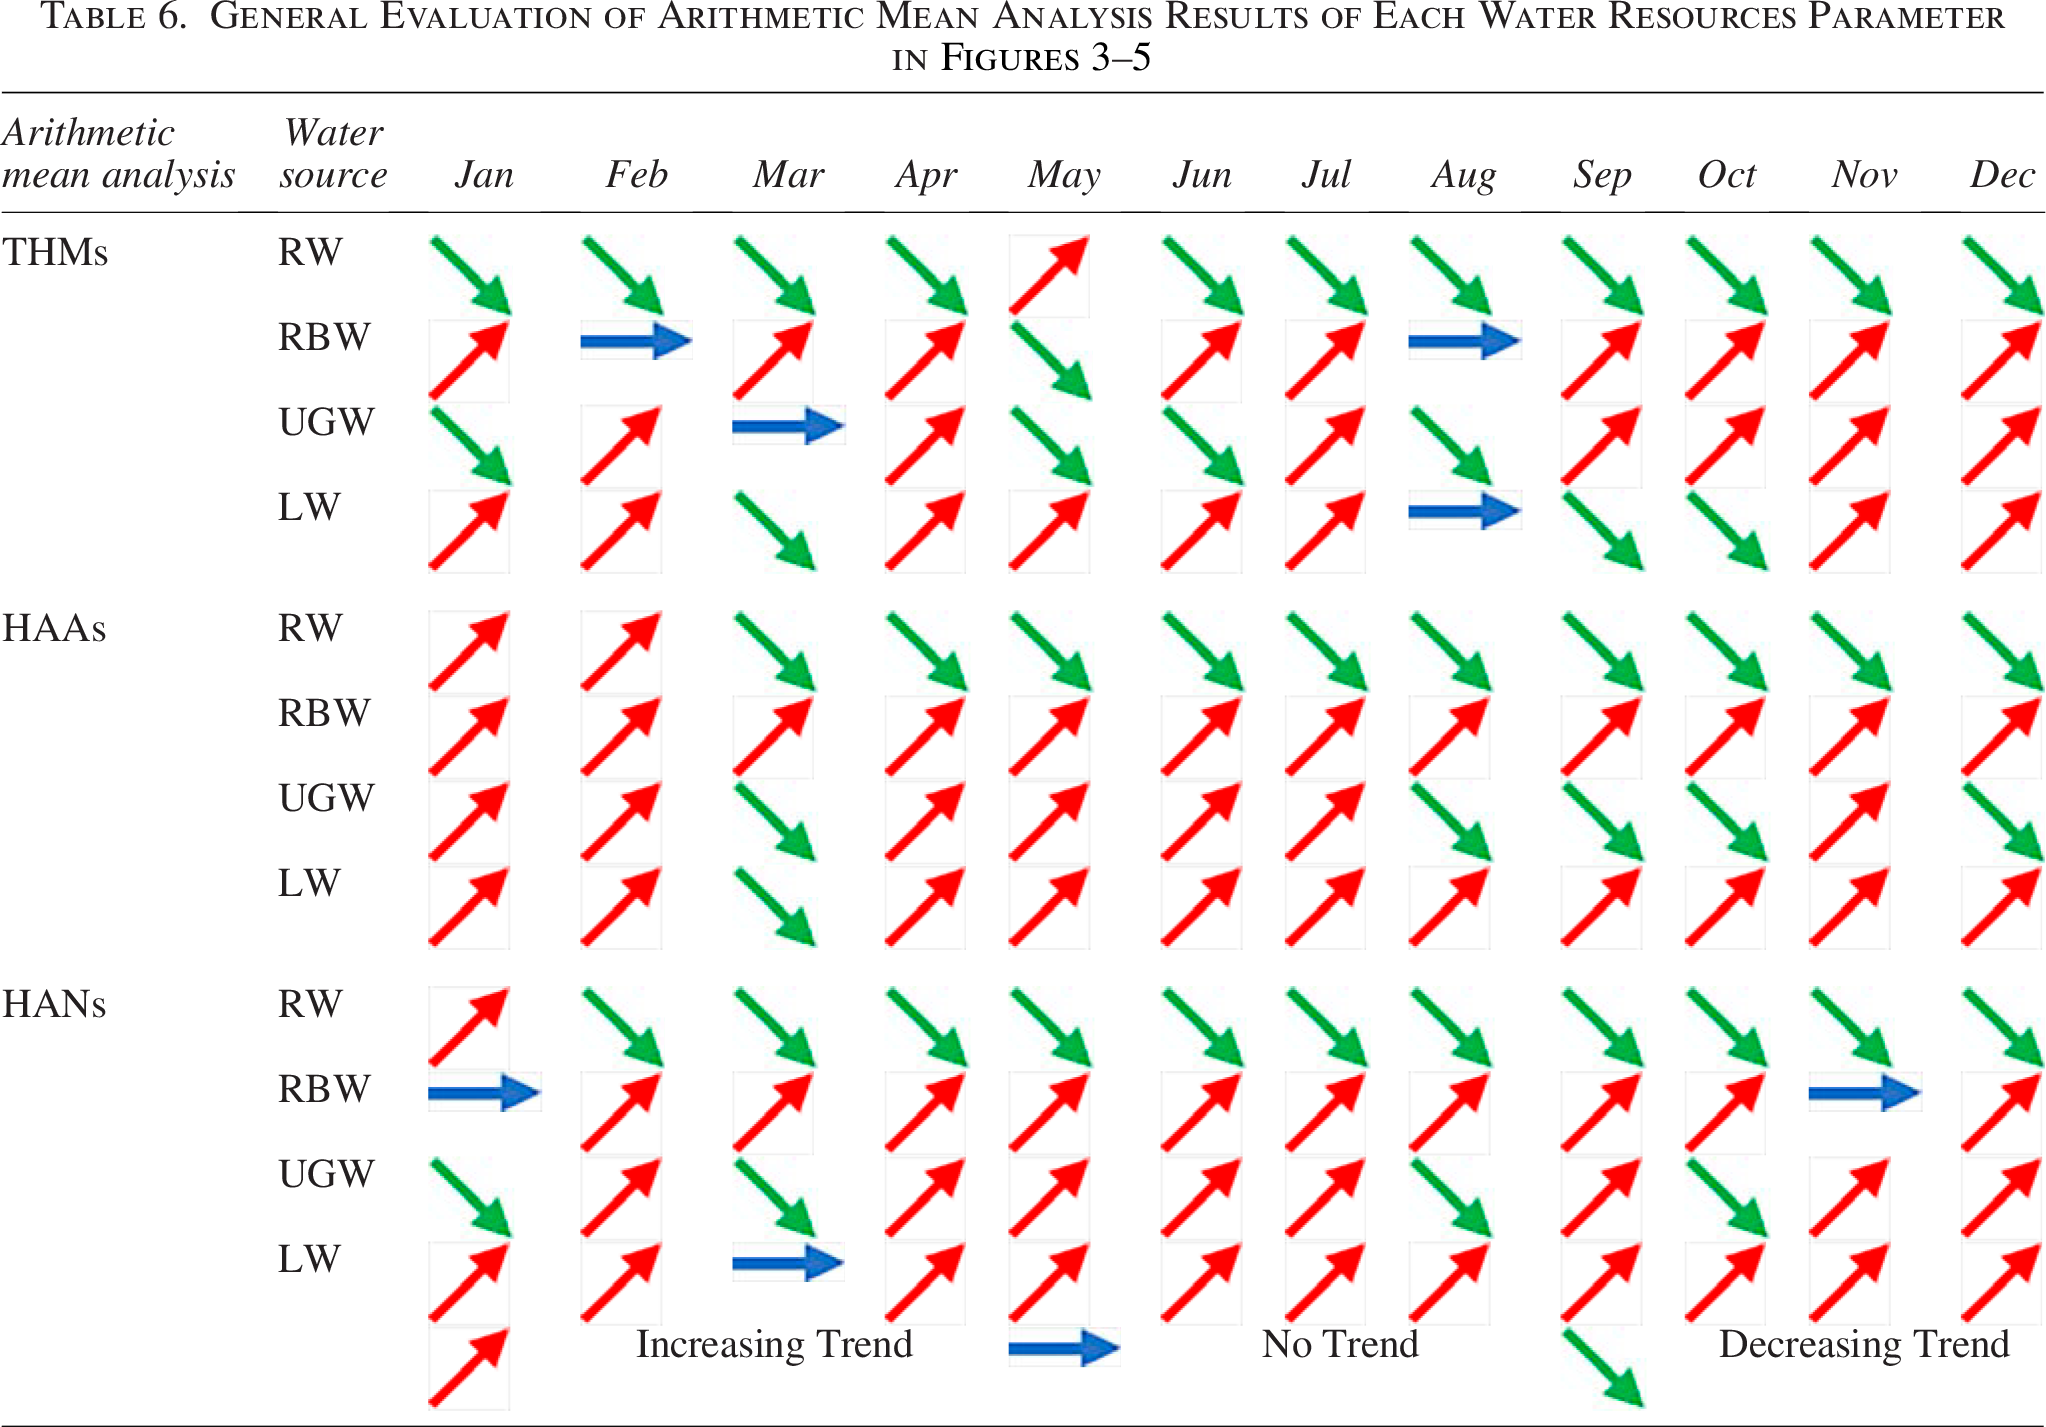
In the arithmetic mean analysis of THMs, increasing trends were generally observed throughout the year in the IPTA diagram, with a summary in Table 6. Specifically, except for May, THM concentrations in RW exhibited a decreasing trend throughout the year. Similarly, HAAs decreased throughout the year, except for January and February. HANs, on the other hand, displayed an increasing trend only in January. THMs in RBW sources were relatively high for 9 months, and 2 months showed no trend, whereas only a decreasing change was observed in May. The concentration trends of HAAs and HANs were similar and increased throughout the year. In the case of UGW, a mixed trend analysis was observed, but it was almost identical in the number of months on increasing and decreasing trends, with a ratio of eight/seven to four. The THMs concentrations showed an increasing trend except in March, September, and October in the LW sources, and HAAs and HANs concentrations showed a similar increasing trend throughout the year. This study indicates that the water quality of RW sources remains relatively good and has not shown significant deterioration over the past 6 years compared with RBW, UGW, and LW, particularly in terms of THM, HAA, and HAN concentrations. Sustaining and improving this condition may involve the adoption of advanced water treatment technologies, consistent monitoring programs, the enforcement of regulatory standards, and the introduction of incentives that encourage industrial sectors to maintain compliance with environmental and water quality requirements. Overall, the IPTA method applied in this study can be utilized for short-term water quality analysis of other pollutants and areas, providing a better understanding of trends. This approach can assist authorities in formulating effective policies for the future management of water resources.
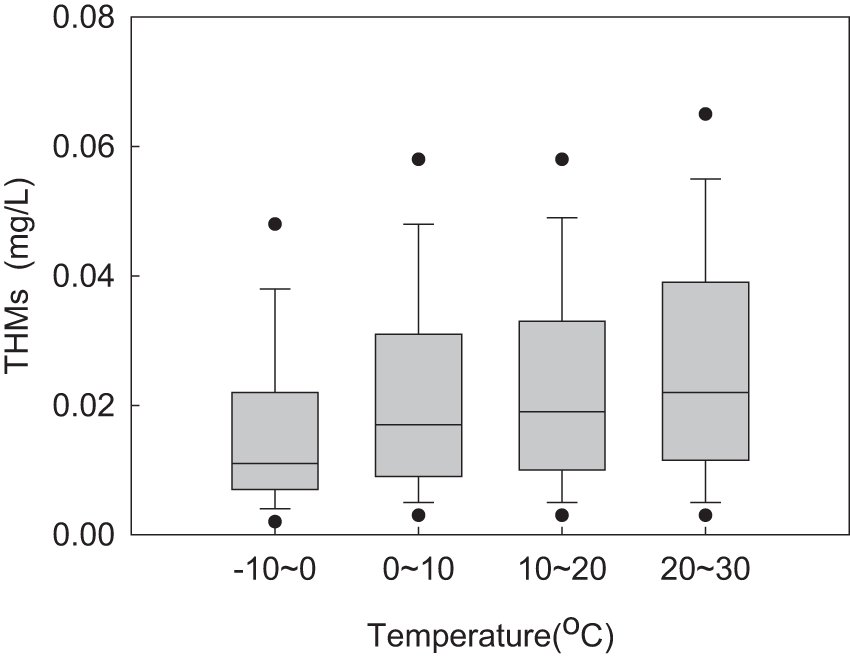
THM concentrations across temperature ranges for all sites, showing variation with seasonal temperature.
Relationship between THMs and temperature
From 2011 to 2021, the monthly THM concentrations after water purification in Gyeongsangbuk-do were studied using different feedwater sources, including RW, RBW, UGW, and LW. In the DBP analysis, THMs were selected for temperature analysis because they were consistently detected and showed trends like HAAs and HANs. Figure 5 summarizes THM concentrations across different temperature ranges to illustrate their relationship with seasonal temperature variation. As the water temperature was not measured separately at the water purification plants, it was measured at the consumer tap (point of use) in this study. The minimum THM concentrations were observed at temperatures between −10°C and 0°C, and the highest concentrations occurred between 20°C and 30°C. Within the intermediate ranges of 0–10°C and 10–20°C, the concentrations showed only minor variation. Overall, temperature showed a positive association with THM concentrations; however, this relationship reflects only one of several interacting factors influencing DBP formation in drinking-water systems. Similar relationships between temperature and THM formation have been reported in previous studies; however, it is widely recognized that temperature interacts with other controlling factors such as OM composition and treatment conditions (Alver et al., 2021). Therefore, closer monitoring of THM concentrations and adjustment of treatment parameters—such as precursor removal efficiency and chlorination dosage—during high-temperature months are recommended in future studies. As THMs are affected by various factors, such as differences in water quality by region, water purification method, and chlorine injection amount, it is not easy to accurately determine the correlation by simply comparing the temperature and THMs concentration; overall, the concentration of THMs tends to increase as the temperature increases. It should be noted that DBP formation is governed by multiple interacting factors, including OM composition, disinfectant dose, pH, and bromide concentration; therefore, temperature alone cannot fully explain the observed variability.
Treatment plants and THMs concentration
Figure 6 shows the THM concentrations observed in multiple water purification plants employing either advanced or conventional treatment configurations. Most advanced plants in Daegu and Gyeongsangbuk-do use RW as their primary source; therefore, for comparability, the analysis focused on plants using RW and LW. Conventional treatment plants generally follow the standard sequence of coagulation, flocculation, sedimentation, rapid sand filtration, and final chlorination. Advanced treatment plants, in contrast, include one or more additional processes aimed at enhancing organic-matter removal—typically ozonation, BAC, or GAC filtration. The advanced configurations exhibited lower THM concentrations than conventional ones, with maximum and average values of ∼0.035 and 0.031 mg/L, respectively, compared with 0.047 and 0.034 mg/L for conventional plants. This difference is likely related to improved removal of DBP precursors in advanced treatment processes, such as ozonation and activated-carbon filtration. These findings align with previous research demonstrating that advanced treatment processes, particularly ozonation and activated carbon filtration, significantly reduce DBP formation by enhancing precursor removal (Alver et al., 2026). However, in 2019, it was confirmed that the THM concentrations in traditional water purification processes were lower than those in advanced water purification processes. This may be associated with changes in water characteristics or modifications in the treatment process, which require a more detailed study of specific plants in the next few years.
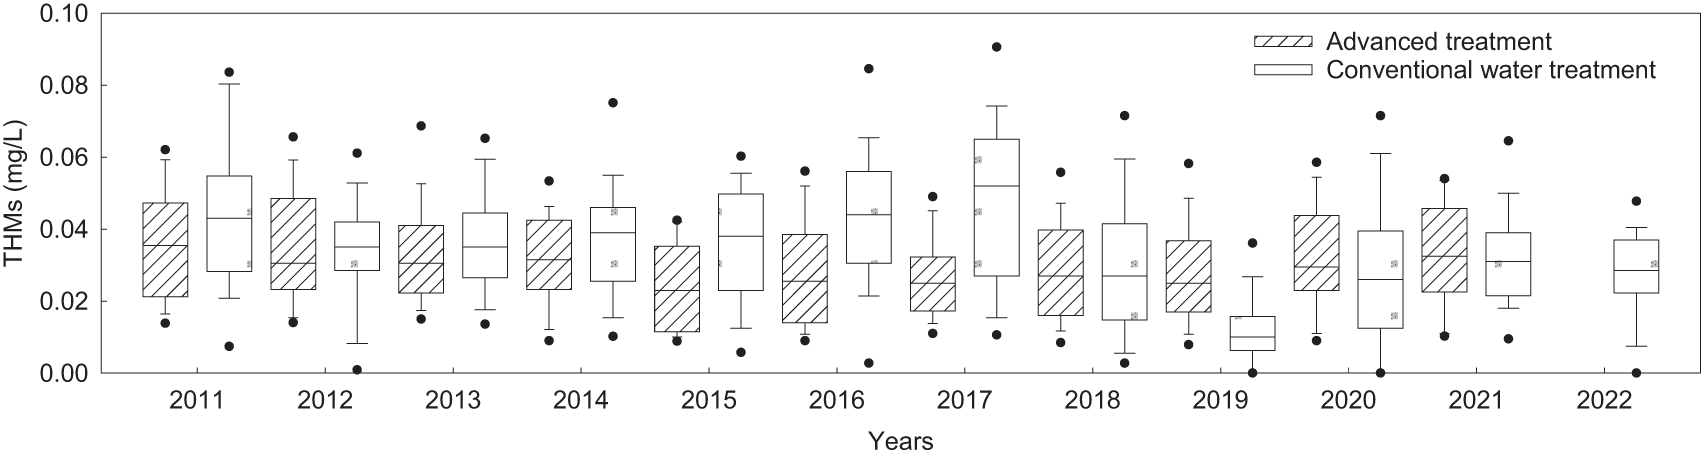
Comparison of average THM concentrations in conventional and advanced treatment plants.
The overall THMs concentration was higher in the water purification plants using RW and LW than in those using RBW and UGW. The concentration of THMs is believed to be relatively low in the RBW and UGW because the precursors of THMs are initially filtered once by the soil and gravel. In addition, in the case of RBW, UGW, and RW, THM concentrations were relatively high in August and September, and in the case of LW, they increased relatively late, reaching a high level in September and October. In conclusion, the THMs concentration was higher in summer than in winter because temperature affects the THMs concentration. The temperature relationship was evaluated for THMs only, as these compounds were consistently detected across all water sources and exhibited complete time-series data throughout 2011–2022. HAAs and HANs, while analyzed for overall temporal trends using the IPTA method, were excluded from direct temperature correlation due to data discontinuities and their lower detection frequency. These findings have direct implications for environmental engineering practice, as they support the optimization of treatment processes and operational strategies aimed at minimizing DBP formation while maintaining disinfection efficiency.
Limitations and future work
This study utilized archived monitoring data from 2011 to 2022 that did not include detailed measurements of NOM, such as TOC, DOC, or UV absorbance (UV254, UV280). Because both the quantity and composition of OM, as well as disinfection conditions, strongly influence DBP formation, the absence of these parameters limits the ability to establish causal relationships between observed trends and underlying processes. Inclusion of these variables in future datasets would enable more detailed identification of DBP precursor characteristics and improve interpretation of formation mechanisms across different water sources. In addition, the dataset did not contain detailed information on disinfectant (chlorine) dosage or residual levels. Variations in disinfectant dose directly influence DBP formation; therefore, incorporating such data would allow more accurate assessment of operational impacts and improve linkage between treatment conditions and DBP concentrations. The analysis focused on short-term variability using the IPTA method. While this approach is effective for identifying month-specific trends, integration with advanced statistical or machine-learning techniques in future studies could further enhance predictive capability and support process-level interpretation. Future work should also evaluate temperature and treatment-type relationships for HAAs and HANs once more complete datasets become available.
Conclusion
Studying short-term fluctuations in water quality is essential for developing effective management strategies under varying environmental and operational conditions. This study applied the IPTA method to evaluate temporal variations in DBPs—including THMs, HAAs, and HANs—across four source-water types (RW, RBW, UGW, and LW). The IPTA approach effectively captured month-specific variations and asymmetrical trends that are not easily resolved using conventional statistical methods, demonstrating its value as a complementary tool for time-series analysis in water-quality studies. RW generally exhibited lower DBP concentrations with predominantly decreasing trends, whereas RBW showed consistent increases throughout most of the year. UGW and LW displayed mixed seasonal patterns, reflecting variability in source-water conditions. THM concentrations showed a positive association with temperature, with higher levels observed during warmer months; however, this relationship represents only one of several interacting factors influencing DBP formation. Advanced treatment processes incorporating ozonation and activated-carbon filtration were associated with lower THM concentrations than conventional systems, emphasizing the importance of enhanced precursor removal for DBP mitigation. From an operational perspective, these findings highlight the need for adaptive and seasonally responsive treatment strategies, particularly during high-temperature periods. The IPTA framework can support utilities in identifying critical periods of change, enabling targeted process optimization and improved compliance with regulatory standards.
Based on the findings of this study, water utilities should prioritize improved precursor removal, particularly during warmer periods when DBP formation potential is elevated. The application of advanced treatment processes, such as ozonation and activated carbon filtration, can contribute to reducing DBP concentration by enhancing OM removal. In addition, monitoring strategies should incorporate seasonal assessments to support timely operational adjustments. Integrating key water-quality parameters, including OM characteristics, disinfectant dosage, and source-water variability, will further improve the effectiveness of DBP control strategies. The proposed IPTA framework complements existing analytical tools used in environmental engineering by providing enhanced resolution of short-term variability relevant to treatment process optimization. Although this study relied on archived monitoring data without direct measurements of key DBP-controlling parameters (e.g., TOC, DOC, UV absorbance, bromide concentration, pH, and chlorine dosage), it provides insight into the influence of source-water characteristics and treatment configurations on DBP dynamics. Future research should integrate these parameters to establish mechanistic relationships between precursor composition, operational conditions, and DBP formation. In addition, combining IPTA with advanced statistical or machine-learning approaches may further enhance predictive capability and support data-driven decision-making. Continued long-term monitoring and periodic reassessment are recommended to ensure sustainable and reliable drinking-water quality management.
Authors’ Contributions
M.Y.: Data curation, data analysis, writing—original draft, review and editing, and funding; C.W.: Data collection, data analysis, and revision; W.L.: Supervision and revision.
Data Availability
Data that support the findings of this study are available from the https://www.waternow.go.kr/web/ and https://www.weather.go.kr/w/index.do websites, but restrictions apply to the availability of the dataset. Refined data are available from the corresponding author on request.
Footnotes
Author Disclosure Statement
The authors declare that they have no competing financial interests or personal relationships that could have influenced the results presented in this study.
Funding Information
This research was supported by the National Research Foundation of Korea under Grant No. RS-2023-00280338. The funding body had no role in study design, data collection and analysis, decision to publish, or preparation of the article.