
Abstract
This article uses data from 65 teachers participating in a K-2 mathematics professional development research project as an example of how to analyze video recordings of teachers’ classroom lessons using mixed methods. Through their discussion, the authors demonstrate how using a mixed methods approach to classroom video analysis allows researchers to draw more comprehensive conclusions about participants both collectively and individually. Implications for using a mixed methods approach to analyze classroom video research are provided.
Video data has been a common medium for capturing as well as helping analyze social interaction for more than 50 years (Erickson, 2006). It has been used in many disciplines including the social sciences and education. However, video data has only recently become a common means to capture interactions within classrooms, particularly mathematics classrooms, and is rapidly growing in popularity (Powell, Francisco, & Maher, 2003). Video data is increasingly being used in classroom research because it allows the capturing of both verbal and nonverbal behavior, which can be analyzed from both quantitative and qualitative perspectives. Since this is the case, video data easily lends itself to mixed methods analysis or the combination of both quantitative and qualitative analyses (Jacobs, Kawanaka, & Stigler, 1999).
Although video data can be analyzed using quantitative and qualitative methods, there has been little discussion on the role mixed methods approaches can play in the analysis of video data. In fact, the recent publication of Video Research in the Learning Sciences, a comprehensive anthology that “addresses the key theoretical, methodological, and technical advances concerning uses of video-as-data in the learning sciences,” neglects to discuss the role of mixed methods in video analysis (Goldman, Pea, Barron, & Derry, 2007, p. ix). Thus, the purpose of this article is to address this void in the literature by discussing the use of mixed methods to analyze video data through the examination of video data from K-2 teachers participating in a mathematics professional development research project.
We begin the article with a discussion of the use of video analysis in educational research, focusing on mathematics education. We then contextualize our discussion by describing our project and data sources. Next, using our project data as an example, we use mixed methods to analyze our video data in order to provide both collective and individual descriptions of our participants. Then we discuss our findings, focusing on the integration of our quantitative and qualitative results. We end our discussion with implications and recommendations for using mixed methods to analyze video data.
Video Analysis and Education
It is a long-standing practice for educational researchers to use video recordings of classroom lessons to observe teacher behaviors (Erickson, 2006). The power of video data is that it allows for repeated viewings of a phenomenon, at any time, by multiple viewers, with the potential to attend to different features during each viewing (Bottorf, 1994; Roschelle, 2000). At the same time, collecting video-recorded data usually results in an overabundance of data, making analysis complicated especially when the recorded sessions are complex, such as classroom lessons (Clement, 2000). Although the use of video recordings is common, there is little consensus as to how to best analyze video recordings of teachers’ classroom lessons (Hall, 2000; Powell et al., 2003).
Video-recorded data itself is not “data” in the traditional sense. Erickson (2006) points out that video data is a “resource for data construction, an information source containing potential data out of which actual data must be defined and searched for” (p. 178). One of the first decisions a research team must make in any study involving video recordings regards what will count as “data” (e.g., Pirie, 1996; Powell et al., 2003). When deciding what will count as data, it is important for researchers to keep in mind that video does represent a point of view (i.e., one which is heavily influenced by the way the video was captured) and depicts a limited context in that recordings are restricted to capturing only a portion of an environment (Roschelle, 2000). As a result, it is essential to collect other data sources to complement video data. Moreover, this somewhat contradictory characteristic poignantly highlights why using mixed methods to analyze video data is a complementary process.
Once decisions are made as to what will constitute the data for a study, the process of analysis must be consistent with those choices as well as with the theories guiding the study. According to Erickson (2006), there are six major theoretical and empirical approaches to video analysis: (a) concentrate on subject matter content, (b) focus on learning as the result of social interaction (neo-Vygotskyan influence), (c) center on classroom talk as unit of analysis, (d) highlight the conversation between the actors (conversation analysis), (e) center the attention on the variations of speaking (sociolinguistics), and (f) focus on verbal and nonverbal activity (context analysis). These various perspectives help determine every stage of the process of analyzing video. Specifically, they help determine whether the procedures for analyzing data from videotape should be done from either an inductive (based on observations), deductive (based on theory), or manifest perspective (based on subject or pedagogical knowledge).
Video Data in Mathematics Education
The use of video-recorded data in mathematics education research is common practice. In most cases, the video captured is either of individual students or small groups of students engaged in mathematical work or whole class lessons, focused either on the teacher or on the work of the students (Pirie, 1996; Powell et al., 2003). Thus, the video that is captured determines the available choices for analysis. For example, classroom video that focuses on the teacher will not allow for close analysis of student work throughout the class period. At the same time, a video recording of a small group within that class will not allow for analysis of whole class interactions. Although many important studies use video recordings, as in educational research as a whole, there is little consensus of how analysis should be carried out (Powell et al., 2003).
There are, however, a few excellent examples that have been published. For instance, Pirie (1996) wrote explicitly about how she used video as data (rather than transcript) and analyzed which teacher interactions influenced the development of students’ mathematical understandings. As part of her analysis, she first identified a segment of video in which a student’s mathematical understanding had indeed changed. Then, she re-viewed that segment to analyze what happened prior to the change. This latter activity represents something that can only be done with video as data and it demonstrates how video can be analyzed for the purpose of attending to tone of voice, gesture, and other aspects of interaction or behavior that would not be accessible in other data formats. Similarly, Cobb and Whitenack (1996) outlined their methods of analysis for a study exploring mathematical learning in a social context. Their methods included the line-by-line analysis of detailed transcripts of classroom video. Other researchers, Lesh and Lehrer (2000), have taken another approach. They detailed a multiple-step analysis of mathematics classroom video of small groups solving multiple problems. The steps included having observers fill out debriefing forms based on being physically in the room during the taping session, different observers filling out the same forms based on viewing of the video recording, followed by producing transcripts and executive summaries of the sessions (one problem across multiple groups and one group across multiple problems). This process allows them to be sure that they have captured the context of the sessions, multiple perspectives of each session, and allows for triangulation of data. Also, more recent work by Powell et al. (2003), details a process for analyzing video data of small groups engaged in mathematics with a focus on student reasoning. Similar to Lesh and Lehrer (2000), their process involves a slow movement from video recording to transcription and includes a “sequence of seven interacting, non-linear phases” (p. 413): (a)viewing attentively the video data, (b) describing the video data, (c) identifying critical events, (d) transcribing, (e) coding, (f) constructing story line, and (f) composing narrative. Finally, Stigler, Gonzales, Kawanaka, Knoll, and Serrano (1999) use both qualitative and quantitative analyses for the Third International Mathematics and Science Study. Using a cyclical approach they began by watching the classroom video and discussing the segments of the mathematics lesson. Next they generated hypotheses (e.g., German students spend more time doing classwork than Japanese and American students) and collected the appropriate quantitative data to test the hypotheses.
Although each of these descriptions of video data analysis has helped clarify the complexity in the process, few studies in mathematics education have explicitly considered video data as inherently mixed data (i.e., to be analyzed using both quantitative and qualitative methods). Furthermore, although each has noted the importance of additional data for triangulation purposes, none has stated what types of data might be useful or how this might be done. It is this latter issue that we detail in the remaining sections of this discussion.
Project Summary: Nurturing Mathematics Dreamkeepers
Nurturing Mathematics Dreamkeepers (NMD), a mathematics professional development project, was a quasi-experimental, longitudinal study that examined the impact of culture on the teaching and learning of K-2 mathematics. The study consisted of three intervention groups and one control group. Intervention groups were organized into three levels called cohorts with Cohort I teachers participating in the project for 3 years, whereas Cohorts II and III participated for 2 years and 1 year, respectively. Teachers within schools (across cohorts and in some cases grade levels) were organized into “buddies.” The goal of the buddy structure was for the teachers to serve as professional support to a same-grade peer and thereby promote pedagogical experimentation in the context of mathematics instruction. In the “buddy” role, teachers observed each other’s mathematics lessons and participated in post-teaching reflection sessions (led by a trained project research assistant [RA]) regarding their mathematics lessons.
The cohorts participated in the project intervention which consisted of approximately 90 hours of professional development delivered during four 2-day retreats per year. 1 Content for the retreats was informed by a conception-based perspective (CBP) of mathematics which explains that students’ constructions of mathematics are based on their realities which are often different from the teachers’ constructions (see, Simon, Tzur, Heinz, Kinzel, & Smith, 2000). Thus, a goal of the retreats was to help teachers gain insights into their students’ understanding of mathematics. In addition, retreat content was informed by culturally relevant pedagogy (CRP), a professional ideology which uses “the cultural knowledge, prior experiences, frames of reference, and performance styles of ethnically diverse students to make learning more relevant and effective” (Gay, 2000, p. 29). According to Ladson-Billings (1995), there are three basic tenets or propositions of CRP: (a) academic success, (b) cultural competence, and (c) critical consciousness. The retreats were designed to help teachers understand CRP as a professional orientation and stimulate their thinking about manners in which its tenets might be incorporated into planning for instruction, actual classroom practice, and postreflection on teaching.
In addition, to participating in the retreats, the teachers were required to complete project instruments (Likert-type format surveys), be videotaped teaching mathematics lessons, observe buddies’ mathematics lessons, participate in postteaching reflection sessions, and participate in one-on-one interviews at the start and conclusion of each project year. Teachers were paid a $1,000 stipend for each year they participated in the study.
Participant Description
Schools rather than individual teachers were solicited for participation. There were a total of seven participating schools, six intervention/cohort schools (49 participants), and one control school (16 participants), for a total of 65 teachers. In Cohort I, there were 8 women participants (4 Whites and 4 Blacks) from two area elementary schools, including 2 kindergarten teachers, 4 first-grade teachers, and 2 second-grade teachers. On average, these teachers had more than 15 years of teaching experience and had taught for more than 4 years in their current schools. The majority of the teachers had bachelor’s degrees although one had a master’s degree. In Cohort II, there were 10 women participants (4 Whites, 5 Blacks, and 1 Asian) from two area elementary schools, including 4 kindergarten teachers, 3 first-grade teachers, and 3 second-grade teachers. On average, the teachers had more than 11 years of teaching experience and had taught for more than 6 years in their current schools. The majority of the teachers had bachelor’s degrees although four had master’s degrees. In Cohort III, there were 31 women participants (29 Whites and 2 Blacks) from two area elementary schools, consisting of 12 kindergarten teachers, 7 first-grade teachers, and 12 second-grade teachers. On average, the teachers had almost 8 years of teaching experience and had taught for more than 3 years in their current schools. The majority of Cohort III teachers had bachelor’s degrees although eight had master’s degrees. In the control group, there were 16 women participants (14 Whites, 1 Black, and 1 Latina) from one area elementary school, consisting of 6 kindergarten teachers, 8 first-grade teachers, and 2 second-grade teachers. On average, the teachers had almost 9 years of teaching experience and had taught for more than 1 year in their current school. The majority of the teachers had master’s degrees (10).
In this article, we provide a discussion of all three cohorts and control group teachers to illustrate the quantitative elements of the analyses. In addition, to discuss the qualitative aspect, we will focus on three Cohort II teachers (Sasha, Giselle, and Aisha) from one project school, Rhine River Elementary. 2 These teachers were chosen because their cases best illustrate the utility of analyzing video data using mixed methods.
Data Sources and Collection Procedures
Several data sources were used in the project; however, the video analysis focuses on three sources of data from three different perspectives: videotaped mathematics lessons, videotaped reflection sessions, and field notes of the mathematics lessons.
Videotaped mathematics lessons
Project RAs videotaped two “typical” consecutive mathematics lessons per teacher, four times a year (twice each semester). The lessons averaged 30 to 45 minutes each and the videotapes of the mathematics lessons served as a “first” representation of what occurred in the mathematics lesson.
Videotaped reflection sessions
The buddy teachers were required to engage in semistructured group interviews in which they reflected on their mathematics lessons. These sessions occurred shortly after the buddy teachers’ mathematics lessons were recorded, averaging 45 to 90 minutes. The videotaped reflection sessions served as a “second” representation (based on the teachers’ perceptions) of what occurred in the mathematics lessons.
Field notes
At the same time the videotape recording of the mathematics lessons was under way, a project RA recorded field notes regarding what occurred in the classroom before, during, and after the mathematics lesson. Capturing field notes is a means of observing “day-to-day events and behavior, overheard conversations, and informal interviews” (Dewalt & Dewalt, 2002, p. 141). These field notes served as a “third” representation (based on the RA’s perceptions) of what happened in the mathematics lesson.
Data Analysis Procedures
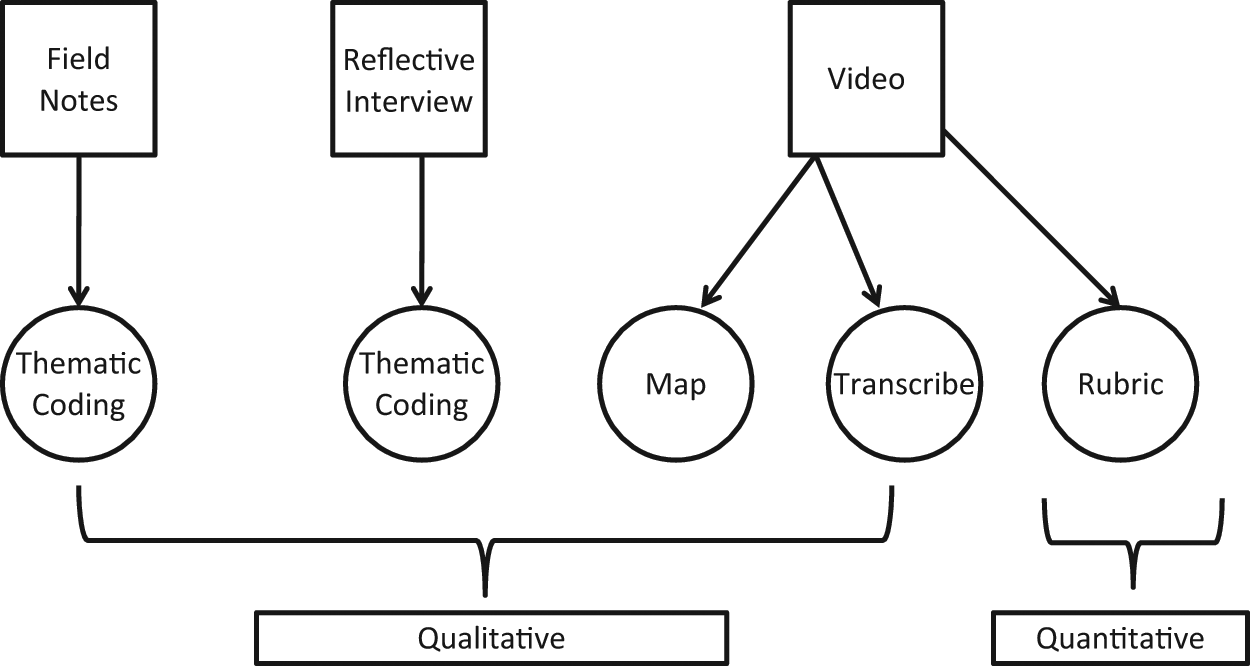
Using the lenses of CBP and CRP, we used a mixed methods approach to analyze the video data. A mixed methods approach can be defined as “research in which the investigator collects and analyzes data, integrates the findings, and draws inferences using both qualitative and quantitative approaches or methods in a single study or program of inquiry” (Tashakkori & Creswell, 2007, p. 4). The quantitative data emerged from our analysis of the videotaped mathematics lessons whereas the qualitative data consisted of the transcripts of the reflection sessions, and the actual field notes as well as the videos. The quantitative data were managed using Microsoft Excel and analyzed using SPSS whereas the qualitative data were managed using Atlas.ti.
We used a hybrid approach to data analysis (Vrkljan, 2009) in that we engaged in both parallel mixed data analysis as well as inherently mixed data analysis (Teddlie &Tashakkori, 2009). We began with parallel mixed data analysis in that we coded the qualitative and quantitative data separately (see Figure 1). Thus, we coded both the reflection sessions and field notes separately from the video analysis. However, when we analyzed the video data, we used an inherently mixed data analysis approach, a form of conversion mixed data analysis which enables the generation of both quantitative and qualitative information from the same data (Teddlie &Tashakkori, 2009). Once the data sources were coded, we combined, compared, and contrasted our findings from the different sources. The following provides specific details regarding our analysis process.
Hybrid analysis of video data using parallel mixed and inherently mixed data analysis
Analysis of reflection sessions
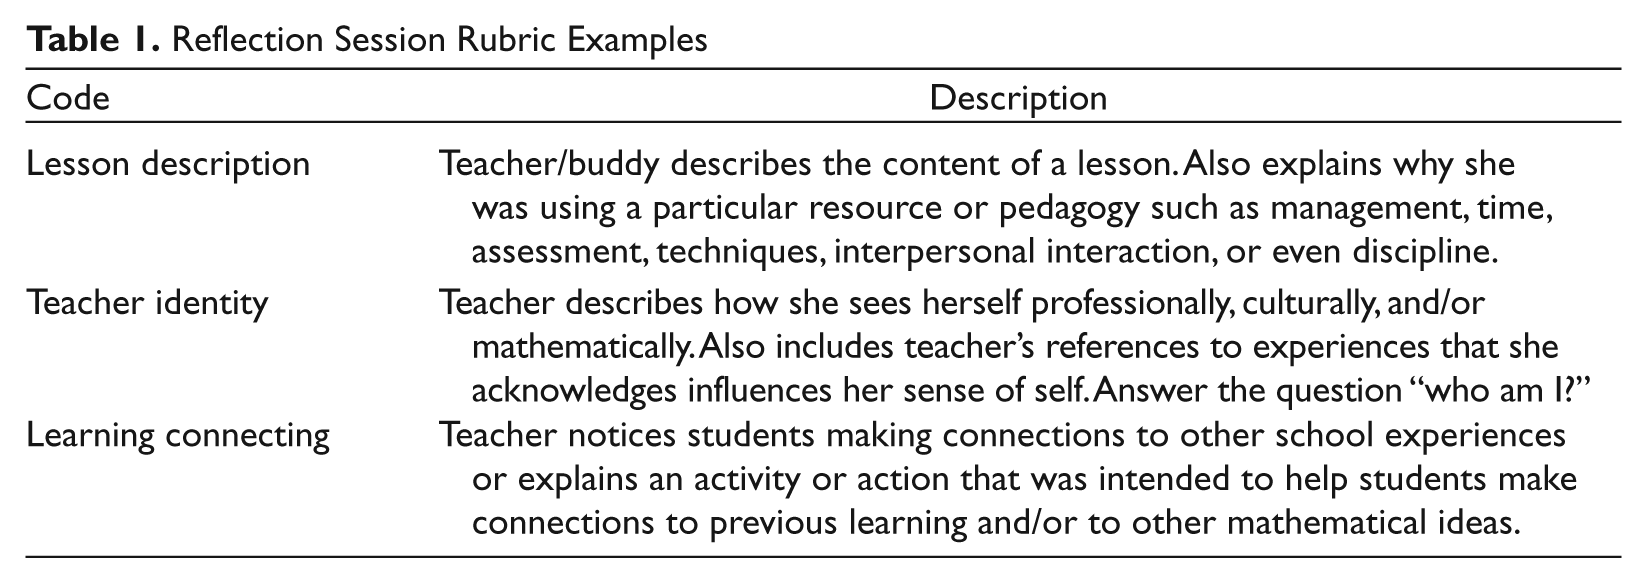
The reflection sessions were analyzed using thematic content analysis (Coffey & Atkinson, 1996). We created a codebook using both theoretical (from CBP and CRP) and data-driven codes, for a total of 27 codes (see, DeCuir-Gunby, Marshall, & McCulloch, 2011). See Table 1 for reflection session codes and examples. After we created the codebook, we determined the relationships between the codes and how the information gained from coding informs theory and research (Coffey & Atkinson, 1996). First, the codes were organized into larger categories/themes. This required examining the relationships between codes and grouping all the related individual codes together. These groupings were guided by existing theory or they were allowed to emerge from the data. Once the individual codes were organized into larger categories/themes, connections were made between the larger categories/themes. After these associations were made, the larger categories/themes were compared with theory and research goals. Last, the findings were interpreted.
Reflection Session Rubric Examples
Analysis of videotaped mathematics lessons
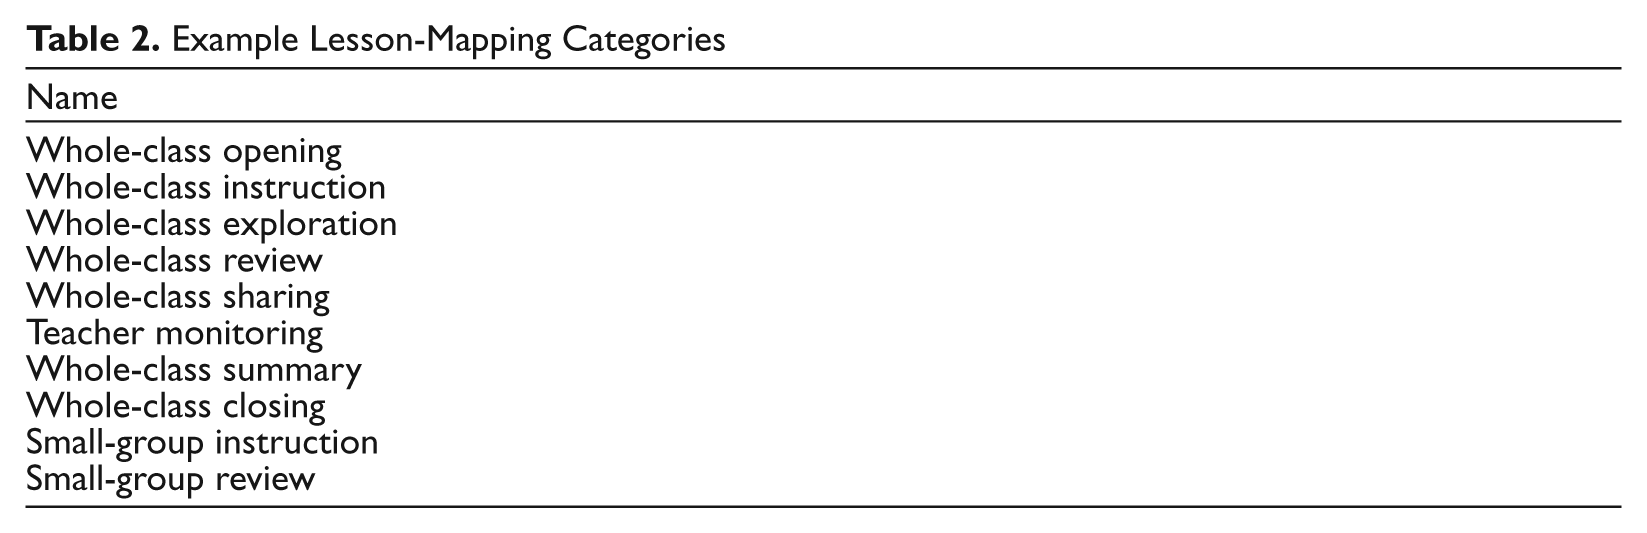
After viewing the mathematics lessons in their entirety, they were coded using a three-step process: (a) lesson mapping, (b) lesson rubric coding, and (c) transcription of verbal communication from the lesson rubric. Lesson mapping, the first step of analysis, is the act of providing descriptions of the organization and structure of mathematics lessons. It involves dividing a lesson into segments and making categorizations based on teachers’ classroom interactions (Stigler et al., 1999). Mappings were used to help describe participants’ classroom interactions and teaching of mathematics over time. See Table 2 for a listing of the mapping categories.
Example Lesson-Mapping Categories
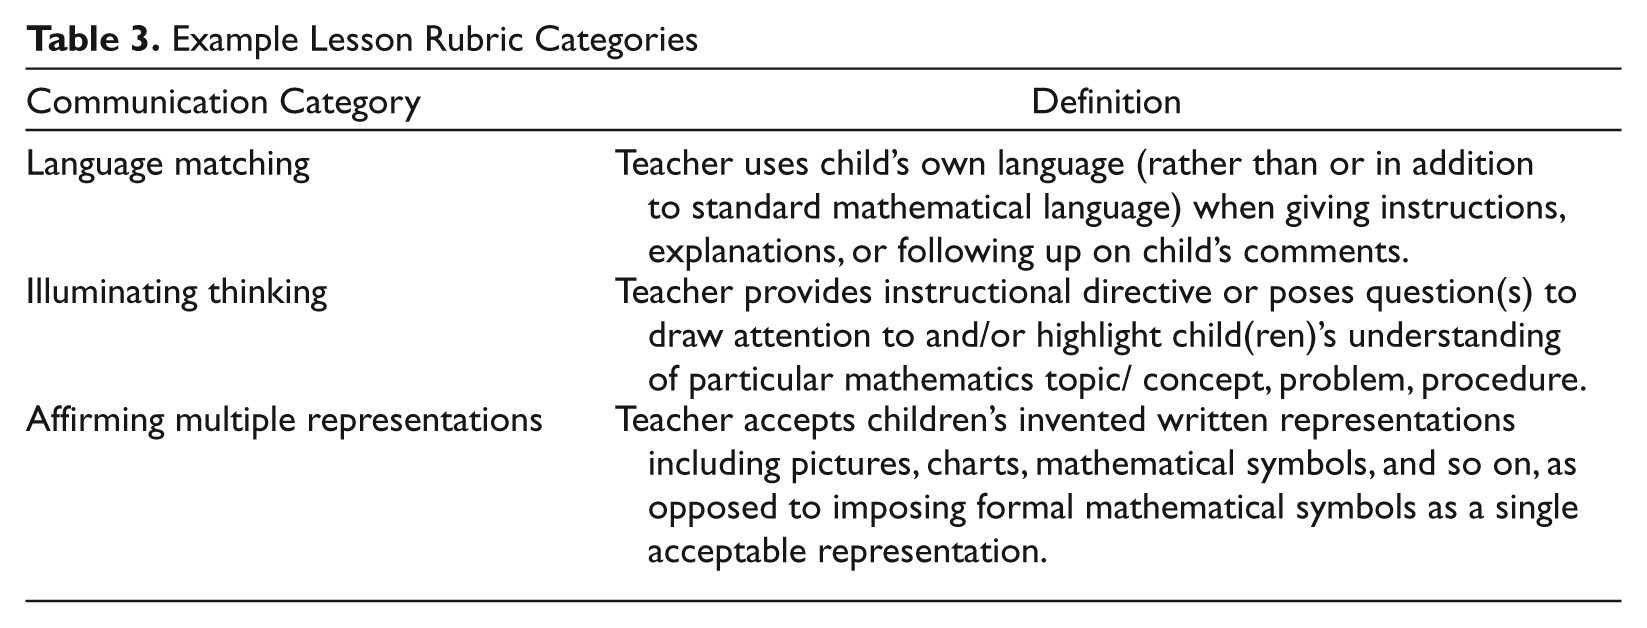
Lesson rubric coding was the second step of lesson analysis. A lesson rubric that was consistent with CRP and CBP was created and used to examine teacher-initiated verbal communication. It specifically focused on the teacher’s incorporation of elements of cultural relevance and attempts to use students’ mathematical thinking during a lesson. The rubric categories included learning connecting, illuminating thinking, affirming multiple representations, extensions of tasks, language matching, relevance making, cultural connecting, and communalizing. See Table 3 for a sample description of the rubric categories. With the lesson rubric, we took a deductive or part-to-whole approach to analyzing the video data (Erickson, 2006). Step 1 comprised focusing on an event or episode and determining the communicative functions of interest. Step 2 involved identifying the instances of interest. Step 3 included tabulating the frequencies of occurrence of the phenomena within 2-minute segments. This is based on Flanders’s interaction analysis technique (Flanders, 1970) which was designed to capture teacher’s classroom behavior with the goal of improving teacher classroom interaction. In the case of NMD, we captured behavior that was consistent with CRP and CBP. The goal was to determine if teachers incorporated more elements of CRP and CBP over time, as they participated in the NMD project. After the tallies were tabulated for each teacher, to provide a description of collective teacher classroom communication, we combined the frequencies by teacher group per category. We then calculated one-way analyses of variance to determine if there were any differences between Cohorts I, II, and III and the comparison group on the rubric categories. Bonferonni post hoc tests were used to identify significant differences between teacher groups.
Example Lesson Rubric Categories
The last step of lesson analysis is the transcription of verbal communication from the lesson rubric. After we tallied each lesson using the lesson rubric, the exact verbal communication representing each tally was transcribed. This was done to capture “what” was being said.
Analysis of field notes
After the RAs collected their field notes, they engaged in field-note expansion, which involved providing more details to what they had previously written (Dewalt & Dewalt, 2002). The field notes were also analyzed using thematic content analysis (Coffey & Atkinson, 1996). We focused on the codes/themes that were used in the lesson coding rubric and the reflection sessions. In addition, we coded the field notes for characteristics, focusing on the RA’s use of particular words to describe the teachers, children, and classroom interactions.
Findings
Engaging in a mixed methods approach during both data collection and analysis allows researchers to proffer more complex and more nuanced results. Using mixed methods to analyze video data enables the viewing of data in a variety of ways. Traditionally in the video analysis of classroom lessons, researchers have made use of only the video of the actual mathematics lesson. In the case of our project, we drew on three different lenses (mathematics lesson, teachers’ perspective in the form of the reflection sessions, and RAs’ perspectives from the field notes) to gain insights. In addition, we were able to analyze the video of the mathematics lesson both quantitatively (lesson rubric) and qualitatively (lesson maps, reflections, field notes, and transcripts of the videos) which allowed us to provide a richer description of what was going on in the mathematics classroom, how it was being done (including the frequency), and why it was being done. It also provided us with both collective and individual descriptions of teachers.
Collective Descriptions: Quantitative Findings
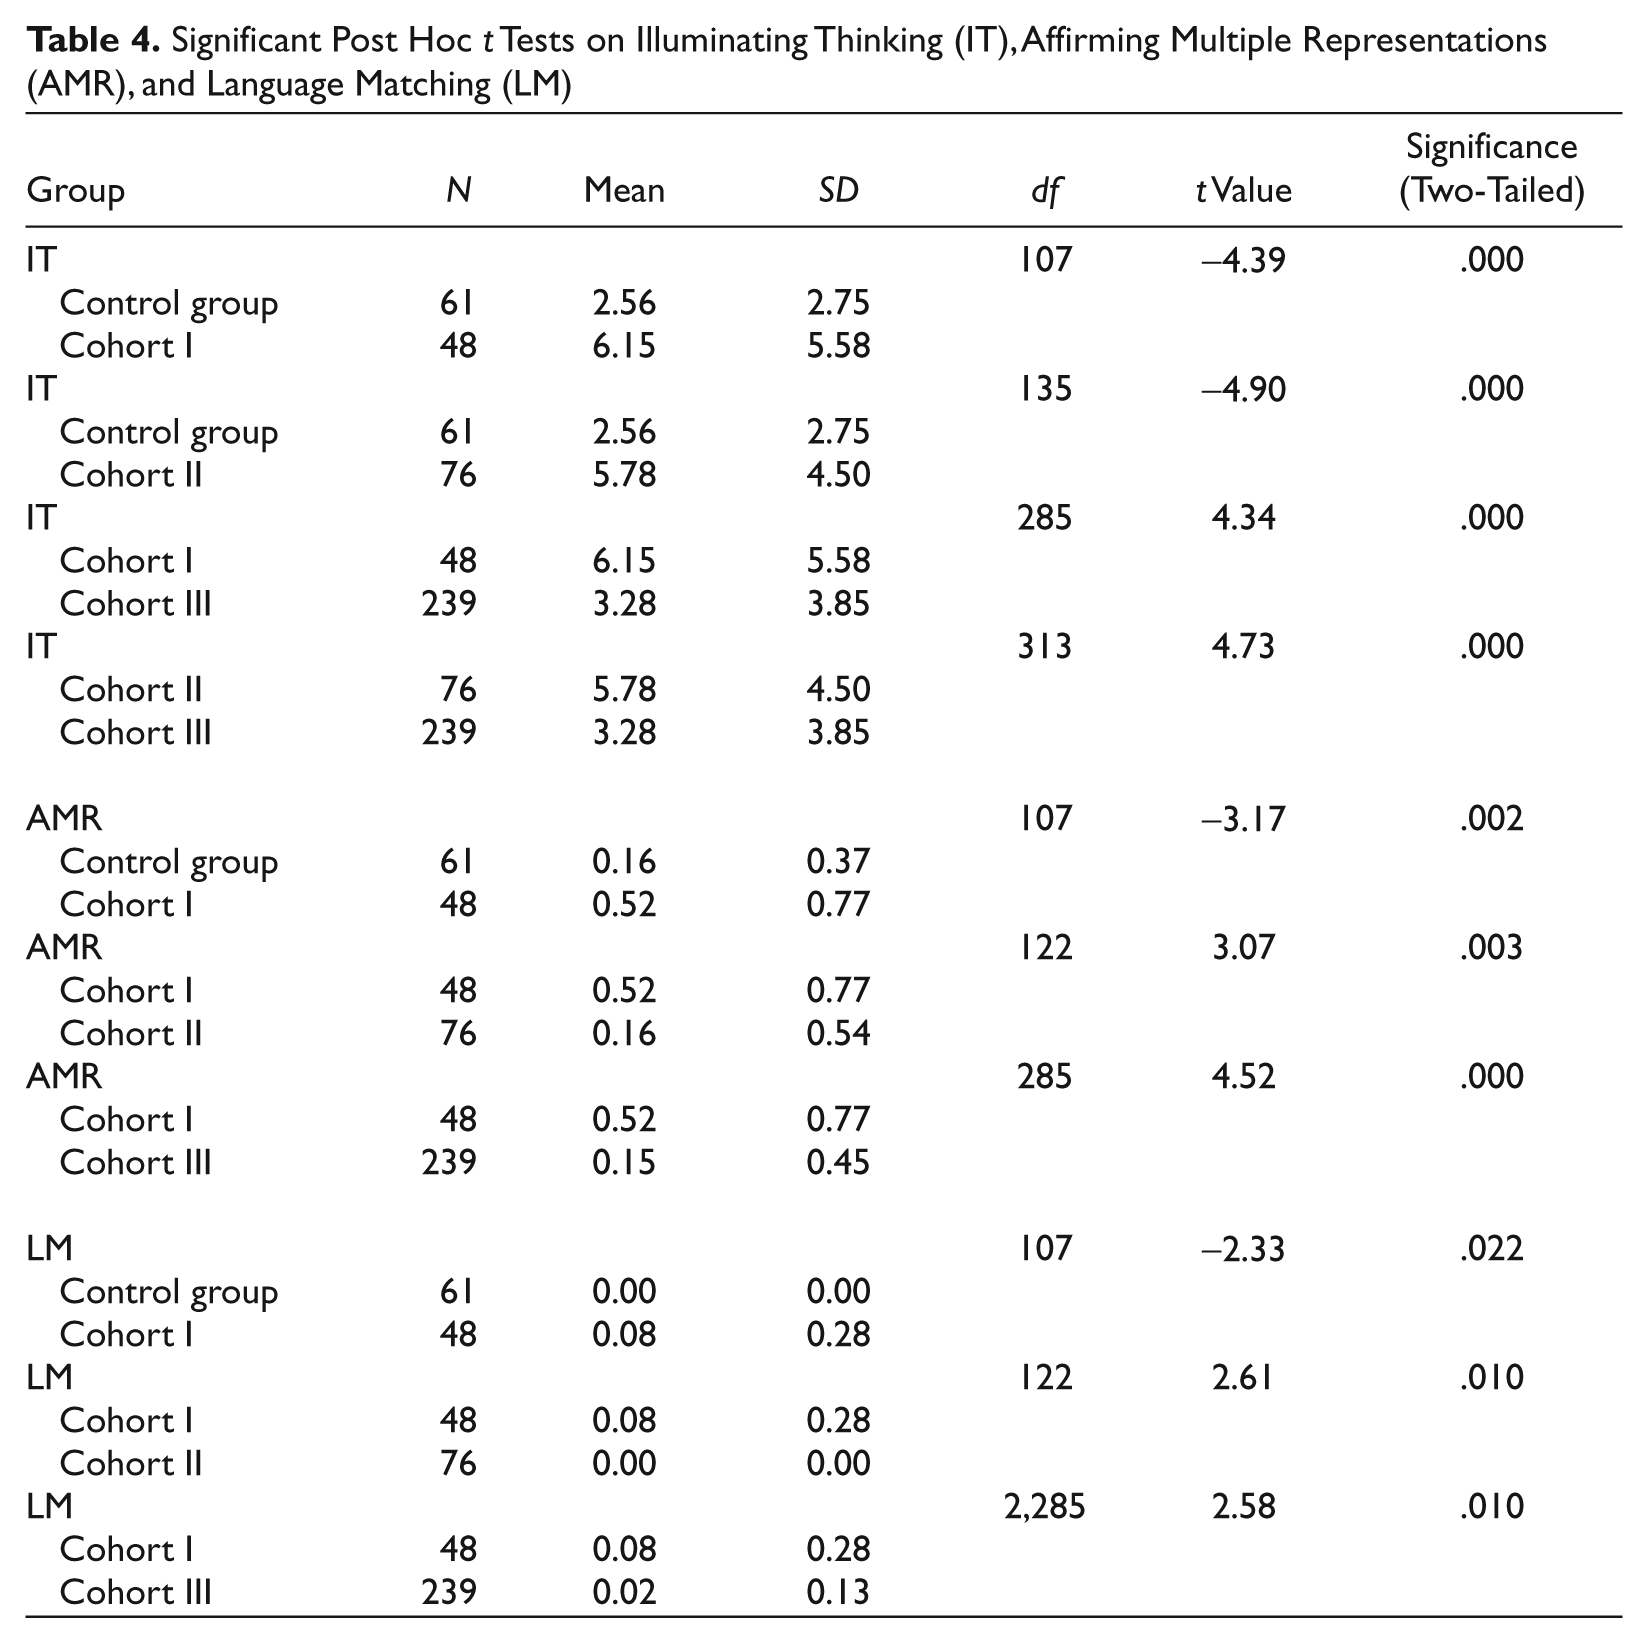
A total of 482 mathematics lessons were coded for the three cohorts whereas 64 lessons were coded for the comparison group. We ran one-way analyses of variance to determine if there were any differences between Cohorts I, II, and III and the control group on any of the rubric categories. Our analyses showed significant differences in the categories of illuminating thinking, F(3, 420) = 14.31, p = .000, affirming multiple representations, F(3, 420) = 7.50, p = .000, and language matching, F(3, 420) = 4.60, p = .004. We then conducted a Bonferonni post hoc test to indicate significant differences (see Table 4). We found that Cohort I teachers had significantly more instances of illuminating thinking (M = 6.15, SD = 5.58), affirming multiple representations (M = 0.52, SD = 0.77), and language matching (M = 0.08, SD = 0.28) than Cohort III (M = 3.28, SD = 3.85; M = 0.15, SD = 0.45; M = 0.02, SD = 0.13, respectively) and the control group teachers (M = 2.56, SD = 2.75; M = 0.16, SD = 0.37; M = 0.00, SD = 0.00, respectively). Also, Cohort II teachers (M = 5.78, SD = 4.50) outperformed Cohort III (M = 3.28, SD = 3.85) and the control teachers on the illuminating thinking construct (M = 2.56, SD = 2.75). Cohort I demonstrated more instances of affirming multiple representations (M = 0.52, SD = 0.77) and language matching (M = 0.08, SD = 0.28) than Cohort II (M = 0.16, SD = 0.54; M = 0.00, SD = 0.00, respectively). Cohort III did not differ significantly from the control group on any construct.
Significant Post Hoc t Tests on Illuminating Thinking (IT), Affirming Multiple Representations (AMR), and Language Matching (LM)
Individual Descriptions: Qualitative Findings
After we collectively examined the teachers, we engaged in in-depth analyses of individual teachers’ lesson rubric codings. We then compared the lesson rubric codings with each teacher’s reflection session interviews and field notes. To do so, we engaged in a 5-step process. First, we used the lesson mapping categories to provide a structure and framework for each mathematics lesson. Second, we paired the lesson rubric codings within the events highlighted by the lesson mappings. Third, we placed comments from the RA field notes within the lesson mapping categories. Fourth, we matched up the events of the mathematics lesson with the teacher’s statements from the reflection interview. In the fifth and final step, we created the individual cases based on the integration of the various data sources listed in the previous steps.
In analyzing the individual cases, we discovered that there were inconsistencies between teachers’ data sources. This was not surprising because engaging in a mixed methods approach during both data collection and analysis allows researchers to proffer more complex and more nuanced results of data. On closer examination, we discovered that several teachers’ data sources corroborated (triangulation), complimented (complementarity), or contradicted (initiation) each other. According to Greene, Caracelli, and Graham (1989) and Rossman and Wilson (1985, 1994), multiple sources, analyzed from multiple perspectives, often help yield such complex findings. Next, we will discuss cases that demonstrate triangulation, complementarity, and initiation.
Triangulation
Sasha was a first-grade teacher who taught in three different states for a total of 8 years. She had a quiet demeanor, was very thoughtful and reflective, and was often the peacemaker between dominant personalities in the project. Sasha was a very conscientious teacher in that across 14 lessons that were taught in a 2-year span, she engaged in a relatively large amount of teacher-initiated communication that was consistent with CRP and CBP. She engaged in 9 instances of learning connecting, 131 instances of illuminating thinking, 9 instances of affirming multiple representations, 1 instance of extension of task, 2 instances of relevance making, and 1 instance of communalizing; there was no language matching in any of her lessons. Sasha was one of our most successful teachers in terms of incorporating CRP and CBP in her classroom. In addition, Sasha’s actual classroom interactions were often consistent with the descriptions of her interactions. The analysis of her mathematics lessons helped illustrate the corroboration of findings from the different data sources. Therefore, her case is used to demonstrate triangulation, the convergence or corroboration of results from different methods (Jick, 1979; Mathison, 1988). The lesson mapping, coding rubric, reflection sessions, and field notes all provided similar findings. Below is a sample description of one of Sasha’s mathematics lessons.
Sasha’s 56-minute mathematics lesson was regarding grouping by 10s. She began her lesson with a whole-class review of the previous day’s lesson, which involved workers in a store and making sets of marbles for customers. Sasha helped the students understand the context of the activity by explaining the roles of workers and customers in a store. She asked, “So if a customer walked in, if you were a worker and a customer walked into your store, how would you know what to give them? Would you just give them a group of ten?” Sasha then asked the students to think about their store and imagine that a customer came in and wanted 50 marbles. As corroborated by the RA’s field notes, she asked, “How could you make a group of 50 marbles from your jars?” After this discussion, the class then engaged in a whole-class exploration where the students were able to talk with each other regarding their strategies for making groups of 50 marbles.
Later in the lesson, Sasha began the whole-class instruction. She explained the activity for the day, which involved determining the number of jars needed for their marbles in their store and writing number sentences. She had a drawing on the board to help illustrate the activity. The picture consisted of three jars of different heights with different amounts of marbles—10, 20, and 30. During her reflection session, she further explained the purpose of the activity, which was consistent with the RA’s field notes:
[The purpose was] That they [the students] could find combinations to 100 using groups of 10. And I know at the beginning of the lesson I said, ‘We’re going to be counting on.’ But we really weren’t counting on. Like, we did it together. But then I noticed when they were working, because of the way I had set up everything, that they were doing a lot of—they could make combinations to 10, but they were counting from 10 all the way up to 100 instead of counting from 30 and adding on 10s after that. But being able to make combinations to 100. Being able to tally—tally how many jars they used to make those combinations. So they had to also remember how to tally, be able to do that. And then take the representation of tallies and organize into a number sentence, using the groups of 10.
After the students were finished with the activity, she brought the students back to the front of the classroom and asked them about the activity. The students shared their answers. Sasha then ended the lesson and asked the students to pass in their papers. During the reflection session, when asked about how well her students comprehended the lesson, her response was consistent with what was viewed on the video. Sasha explained,
They got better at figuring out how many bags of each, the more they did it. How many bags of each one they used. And then they would put the tally marks down. But then getting from the tally marks to the number sentence, you know, one tally, two tally marks under the number 20 would be two 20s, would be in your number sentence. That was tough for them. So, I took—I would draw—I drew the jars on the board. And just had them do—I did tally marks up there. And asked them what each tally stood for. And then they wrote the number sentences. And that’s all they did. And then, we went back to their paper, and they had to tally again and then write the number sentence.
The way teachers talk about what happened in their mathematics lessons should be reflective of what actually happened. This is what occurs in triangulation. In the case of Sasha, there were many instances where all the analyses of the data sources supported each other. For instance, as indicated by the lesson rubric codings, Sasha engaged in learning connecting, illuminating thinking, and affirming students’ multiple mathematics representations. In the follow-up reflection sessions, Sasha discussed how it was important for her to help make connections to previous lessons, question students’ thinking, and support their different strategies for solving mathematics problems. In addition, the RAs discussed how Sasha engaged in these activities. Making the same conclusion from multiple sources of data strengthens the legitimacy of the interpretations.
Complementarity
Giselle was a first-grade teacher and had been teaching for 6 years. She had a strong mathematics identity and saw herself as being proficient at understanding and teaching mathematics. Giselle used cognitively guided instruction (CGI), an orientation to mathematics teaching and learning, which posits that young children bring an intuitive understanding of mathematics to school that is grounded in their out-of-school experiences. Specifically, CGI encourages the use of independent, hands-on problem-solving activities (Carpenter, Fennema, Franke, Levi, & Empson, 1999). In addition, it relies heavily on teacher questioning for student understanding. Because of the nature of the CGI, Giselle’s teaching did not easily demonstrate instances of CRP and CBP. Specifically, across 16 lessons, she engaged in 1 instance of learning connecting, 94 instances of illuminating thinking, 2 instances of affirming multiple representations, and 1 instance of language matching; there were no instances of extension of task, relevance making, cultural connecting, and communalizing. In addition, when watching her mathematics lesson, it is difficult to understand how Giselle is teaching mathematics. Therefore, in this case, the qualitative analysis of her mathematics lessons helped translate or expand on what could be seen on the video. Her case is used to demonstrate complementarity, which means that one method elaborates, enhances, or clarifies the results of another method (Greene et al., 1989). For Giselle, the reflection session and field notes clarified and expanded what occurred during the mathematics video. Below is a sample analysis of one of Giselle’s mathematics lessons.
Giselle’s 51-minute lesson involving multiple-step word problems began with her writing a question on the board. A student read the question to the class:
Taylor has 5 (five) jewelry boxes. She has 12 (twelve) bracelets in each box. Then her grandma gave her 6 (six) more bracelets. How many bracelets does Taylor have altogether? (As indicated by the RA’s field notes, the sentence was written in black while the spelled-out numbers were written in red for emphasis.)
During the whole-class opening, Giselle described the word problem and discussed with the students their thoughts regarding the problem for approximately 5 minutes. During this time, Giselle engaged in one instance of illuminating thinking, as indicated by the lesson rubric. This one instance was in response to a student, wherein Giselle stated, “It’s sort of a grouping problem, can you explain a little more?” Although the rubric coding indicated that Giselle engaged in very little questioning, this was consistent with a CGI perspective in that the teacher is to serve more as a facilitator, while the students engage in most of the questioning.
As further explained by the RA’s field notes and the lesson mapping, for the majority of the lesson, the class engaged in whole-class exploration/teacher monitoring where the students solved the word problem using a variety of manipulatives (e.g., calculator, unifix cubes, 100 board, blocks, coins, etc.) and the teacher walked around observing and questioning the students regarding their strategies. This explanation provided by the RA is essential because the mathematics lesson was recorded with a stationary camera, thus, Giselle’s individual interactions with students were not captured. Also, during this time, as indicated by the RA’s field notes, the students were writing in their mathematics journals. Giselle clarified the purpose of the mathematics journals during her reflection session interview:
I have them talk about what they did, and try to explain it back to me, because a lot of times I don’t get to talk with each child every day. So I have to go back and read what they did. But I also want them to explain it. What they did, and then why they did it.
After whole-class exploration/teacher monitoring, the class reconvened for whole-class sharing, where students individually shared their strategies for solving the problem. Because many first-grade teachers in our project did not use CGI when teaching mathematics, Giselle was asked how her students felt about explaining their problem-solving strategies to the class. She elaborated,
It does a lot for their confidence, first of all. That they feel that what they’ve done is valued. And everybody is watching them. So they feel important. And then for them to kind of explain it, they have to, you know, kind of—you really have to understand it if you’re going to teach it to somebody else. Or you’re going to come up here and explain it to us. So you really have to know it. So a lot of times I see the kid practicing it over and over and over again before they get up.
Researchers cannot always fully comprehend what occurs in a video by simply watching it. Rather, it is often necessary to have additional information, as in the case of complementarity, to gain a clearer picture of what is going on. For instance, in the classroom that uses CGI practices, it could be difficult for an outsider to understand what is going on, especially in terms of teaching and learning. In the case of Giselle, the lesson mapping described the structure of her mathematics lesson as occurring in the whole-class opening, whole-class exploration/teacher monitoring, and whole-class sharing. During the whole-class opening, she engaged in one instance of illuminating thinking, as indicated by the lesson rubric, where she attempted to get a student to explain his thinking. The reflection session component allowed her to expand on what was seen during her mathematics lesson.
Initiation
Aisha was a kindergarten teacher. She had been an educator for nearly 16 years and had previously taught fourth and seventh grades. She was very comfortable with conversations regarding diversity and multicultural education. Although well versed in cultural relevance and general pedagogy, Aisha’s knowledge did not always translate well into practice. Across 13 lessons that were taught in a 2-year span, Aisha engaged in very little teacher-initiated communication that was consistent with CRP and CBP. She engaged in 10 instances of learning connecting, 12 instances of illuminating thinking, and 2 instances of affirming multiple representations; there were no instances of extension of task, language matching, relevance making, cultural connecting, and communalizing. In addition, her actions often conflicted with her descriptions of her actions. Because of this, a mixed methods approach to the analysis of her mathematics lessons helps explain the contradictions that exist between what she does and what she says she does. Her case is used to demonstrate initiation in that the results of one method are paradoxical, contradict, or question the results of another method (Greene et al., 1989; Rossman & Wilson, 1985, 1994). For Aisha, the reflection sessions contradicted what occurred during the mathematics video. Below is a sample analysis of one of Aisha’s mathematics lessons.
Aisha’s 25-minute mathematics lesson was on sorting and graphing. The first part of the lesson was a whole-class instruction in which Aisha explained the lesson. She engaged in one instance of learning connecting, as indicated by the lesson rubric, in which she made a connection to a previous lesson on sorting as well as provided an extension to the activity. She stated, “We are going to do another sorting activity, but then we are going to do something new. We are going to sort and then we are going to graph.” She passed out the students’ activity for the day. As indicated by the RA’s field note, the students had bags of rings featuring Halloween characters such as skulls, bats, and spiders, as well as squares of assorted colors including blue, green, red, and yellow. Also, the activity featured a graph for Halloween characters and a separate graph for the colored squares. The class then began to sort and graph items.
When asked about the purpose of the lesson and what the students were supposed to learn by participating in the activity, during her reflection session interview, Aisha discussed the skills of counting and one-to-one correspondence, despite the fact that her lesson was on sorting and graphing. She explained and contradicted the original goal of her lesson, which was sorting and graphing:
They were supposed to learn, again, about one-to-one correspondence. Graphing—that the concept of graphing, that you start from the bottom, that you count the number one—that when you do kindergarten graphs, in the beginning the zero is not on the graph. They know what zero is. But zero is not on the graph at this time. So it just gives them a chance to do something interactive, and have an opportunity to count. And really understand one—also the representation of one or two. I had two rings, and so I will color two blocks. And just—there’s a lot of abstract along with the concrete.
After the class had finished working on their activity, they then engaged in whole-class sharing, where Aisha asked students to come to the board to present their individual solutions. When asked about the students’ understanding of sorting and graphing, again, during the reflection session interview, Aisha contradicted the purpose of her lesson. Instead of discussing sorting and graphing, she described students’ general understanding of counting and one-to-one correspondence:
Well, at least 75% of them understood one-to-one correspondence. But transferring that knowledge to the graph was a little more challenging for some of them. Some of them, it’s because they just didn’t pay attention. And then some of them really struggled with that idea of how to—to show that number, coloring up the bar. And then some of it is just motor control. That they color so far up. And then they have to exit, and things like that. So it’s just a matter of practice
The last 5 minutes of the lesson was the whole-class closing where Aisha brought the lesson to an end and briefly discussed how the class would continue sorting during the next mathematics lesson. However, in her reflection interview, Aisha stated that her next mathematics lessons would be an extension of the current lesson, focusing on more graphing. Again, ignoring the subject of sorting, thus raising questions regarding the purpose of her mathematics lesson, Aisha explained,
Well, we’re still going to work on graphing for the rest of the week. It’s a pretty difficult concept . . . And the more they do it, the more some of the other kids catch on. So the kids who already get it are faster. But the other kids are starting to understand through repetition. So that’s just a concept that needs to be continued ’til we track out. When we come back we’ll be doing addition.
One data source may contradict or question another, as in the case of initiation. It was common for aspects of Aisha’s reflection sessions to differ from the perspective of the RAs, what was seen on the videotaped mathematics lesson, and what was captured with the lesson rubric. Because of these glaring contradictions, future analyses will require the exploration of other data sources. For example, with our project, we can incorporate her personal interviews as well as retreat artifacts. These additional sources should provide a clearer picture as to what was happening in Aisha’s classroom as well as give us some insight on Aisha’s thinking regarding her teaching.
Discussion
The analyses of the various data sources yielded both quantitative and qualitative findings. The quantitative analyses provided a global view of what occurred in the cohorts’ classrooms and helped us determine how each group specifically incorporated CRP and CBP into their classrooms. The qualitative analyses, on the other hand, allowed us to examine each teacher individually and focused on specific mathematics lessons. Both perspectives provided a better understanding of the project teacher’s incorporation of CRP and CBP.
The quantitative findings suggested that the longer teachers participated in the NMD project, the more instances of CRP- and CBP-related behaviors they exhibited in the classroom. Cohort I teachers participated in the project for 3 years and exhibited the most behaviors whereas Cohort III participated in the project for only 1 year and exhibited the fewest behaviors other than the comparison group. These findings suggest that the NMD intervention was successful in changing some aspects of classroom practice. Specifically, the NMD intervention was successful in helping change the ways teachers question students, use multiple representations of mathematics, and match students’ mathematics language. Ultimately, these findings support the idea that long-term professional development is needed to affect change in classroom practice.
The qualitative findings expanded our quantitative findings and provided more in-depth details regarding teachers’ use of CRP and CBP. We were able to examine teachers’ behaviors in the classroom through multiple lenses. It is often assumed that the analysis of multiple data sources will result in findings that support each other, as demonstrated by the case of Sasha. However, the analysis of multiple data sources can also be used for clarification or the revelation of discrepancies, as demonstrated by our discussions of Giselle’s and Aisha’s cases. Only after our sources were analyzed were we able to determine whether or not the analyses corroborated, complimented, or contradicted each other.
Together, both the quantitative and qualitative analyses gave us detailed descriptions of the teachers’ incorporation of CRP and CBP in the classroom. Our data sources were analyzed in various ways and provided distinct pieces of information that were helpful in demonstrating the success of our project intervention in changing teachers’ classroom behaviors. We were able to indicate specific elements of CRP and CBP that were exhibited by the teacher groups as well as explicate how individual teachers incorporated CRP and CBP in their classrooms.
Implications
The major goal of this article was to discuss using mixed methods to analyze video data. Videotaping of classroom lessons is a common practice among teacher education researchers and articles such as this one can provide more in-depth insights into the complexity of analyzing video data and the utility of using mixed methods approach to conduct analyses. The manner in which we used mixed methods to analyze video data was a new data analysis technique from which we gained research insights that we believe would be helpful to others. From these insights, we have four major recommendations.
Our first recommendation addresses how our video analysis technique should be applied. This technique can be applied in settings where researchers are interested in capturing the change in behavior using video data. For instance, in education it can be used to examine data that capture teacher and student behaviors in the classroom. Other uses include patients’ behaviors after engaging in psychological or medical interventions and supervisors’ use of management techniques in the workforce. The advantage of this video analysis approach is that various forms of data can be captured allowing for different types of analyses to be conducted using the same data sources. This comprehensive approach helps provide various levels of support for any claims that are made.
The next recommendation concerns how researchers should approach the use of mixed methods to analyze video data. Researchers should initially consider how to capture the same phenomenon from multiple perspectives. We suggest choosing at least three different sources to help determine trends of similarities and differences. In choosing the various data sources, it is important to pick sources that will allow the phenomenon of interest to be captured in similar, yet different ways and contribute different pieces of information. In the case of NMD, we had videotaped mathematics lessons, reflection session interviews (teacher perspective), and field notes (RA perspective). The reflection session interviews and field notes added a different angle to the analysis of the videotaped mathematics lesson. In addition to considering the type of data sources, it is imperative to think about the nature of data analysis. It is necessary to analyze the data in a manner that most effectively captures the phenomenon from a quantitative or qualitative perspective (Johnson & Onwuegbuzie, 2004). For our project, we found it necessary to capture the number of times a teacher engaged in a particular behavior (quantitative) as well as what she did when she engaged in the behavior (qualitative).
Third, researchers should recognize that using mixed methods to analyze video data might necessitate involving several individuals in the research project; consequently, this will likely result in the effort becoming a rather time-consuming process. Although it is possible for one person to complete the various analyses as described herein, we believe that the actual collection of the data could prove to be quite a complex task if undertaken independently. Due to the size of our project, as well as the distance between the school sites, we hired five graduate student RAs to perform most of the on-site data collection tasks. This included video-recording lessons, collecting field notes during the lessons, and facilitating (and videotaping) the postteaching reflection session discussions. Extensive training was needed for each of these tasks. We detailed the features of each of these tasks, and provided actual practice sessions on how to collect field notes as well as how to facilitate postteaching reflective sessions. The total amount of time devoted to training of this nature will vary depending on the research experience of team members. In addition to providing assistance in data collection, a multimember research team might also be valuable when multiple viewpoints on the research topic itself are represented among the team members. Although our RAs were trained in data collection techniques, they did not have extensive backgrounds in either of the theoretical concepts (CBP or CRP) that served as the framework for the study. Because of their lack of familiarity, we believe that the field note data collected by the RAs may have represented a more objective data source. In this regard, field notes for the NMD project may have constituted a less-biased rendering of the actual events that took place in the classroom than if this particular data source had been collected by one of the principal researchers for the study.
The last recommendation we offer relates to the overall management of multiple data sources. This issue can be especially critical in a longitudinal study that includes a multi-member research team such as the NMD project. We believe that it is necessary to formulate a highly organized and structured work plan that includes scheduled opportunities to revisit data collection protocols. Even though our RAs did a good job in collecting the various data sources, in hindsight additional time should have been devoted to practicing how to take field notes. We came to this conclusion when reviewing their work and discovering that field notes taken by some of our RAs were quite comprehensive, whereas those taken by others were incomplete thus requiring us to depend on other data sources to gain a full perspective of a given teacher’s experience in the study. The degree of experience in classroom observation among the research team members will affect the ease and speed with which they acquire competence in collecting field notes.
The NMD project sought to introduce a particular orientation to early mathematics instruction and study its impact on teachers’ classroom instruction as well as their thinking about their pedagogy. Thus, it represented a study of the continuing professional development of experienced teachers. Such studies are complex undertakings in that they necessitate attending to multiple variables in order to gain useful insights into the nature of teachers’ development. In the case of the NMD study, we sought to examine the actual classroom practices of teachers as well as their thinking about their pedagogy. This endeavor was best examined by using mixed methods.
Footnotes
Any opinions, findings, and conclusions or recommendations reported herein are those of the authors and do not necessarily reflect the views of the National Science Foundation.
Declaration of Conflicting Interests
The author(s) declared no potential conflicts of interest with respect to the research, authorship, and/or publication of this article.
Funding
The author(s) disclosed receipt of the following financial support for the research, authorship, and/or publication of this article:
The research reported in this article was supported by a grant from the National Science Foundation (Award No. 0353412).