
Abstract
We present outcomes from a mixed methods research project in agricultural sciences. An atypical methodology for sciences was developed as the only way to avoid embedded assumptions commonly seen in sustainability investigations. Eighty-three upper echelon participants from the wine grape industry participated in 14 focus groups in five countries: Australia, Chile, New Zealand, South Africa, and the United States. Quantitative measures were compared with results from qualitatively coded participant utterances using two content analysis software tools: Leximancer and NVivo. This article presents the strategies and method applied in this investigation to define sustainability. A consensual sustainability definition prior to the establishment of assessment systems is essential. The model developed seems to be viable for similar sustainability investigations of individual organizations.
Sustainability is a complex concept (Bebbington, Brown, & Frame, 2007; Dantsis, Loumou, & Giourga, 2009; Espinosa, Harnden, & Walker, 2008; Wojtkowski, 2006) that is often taken for granted. Consequently, different agents seem to use different embedded assumptions in sustainability investigations and assessments (Abbona, Sarandón, Marasas, & Astier, 2007; Koohafkan, Altieri, & Gimenez, 2012; Pacini, Lazzerini, & Vazzana, 2011; Söderbaum, 2011). In agricultural systems, the challenge to define sustainability seems even more complex because of the relationship between science-based and value-based indicators as well as a lack of agreement about where the farm boundaries end (Ohmart, 2011). To date, there is not a widely accepted definition of sustainability (Casini, Cavicchi, Corsi, & Santini, 2010; Ohmart, 2011; Wei, Davidson, Chen, & White, 2009), so different sustainability assessments cannot be compared with precision. The focus of the study was Sustainability in Viticulture, and the investigation was conducted with wine growers to define sustainability at the farm-gate level. Mixed methods were used for data gathering and analysis. These are discussed in the Methods section of this article.
Background
Since the 1960s, agriculture systems have been relying to a large degree on the use of high ex-farm inputs such as synthetic chemicals (e.g., fertilizers, pesticides, and herbicides) and mechanization to achieve high levels of food production at the lowest possible cost (Altieri, 1992; Ohmart, Storm, & Matthiasson, 2008; Wojtkowski, 2006). This period of the history of agriculture became known as the Green Revolution (Hazell, 2002; Woodhouse, 2010). These practices have dramatically increased food production but have had well-known harmful consequences to the world’s natural resources (e.g., loss of top soil, soil erosion, the effects of nitrate and pesticides on the environment among others). A number of major concerns about past and current practices in high-input conventional agriculture have become part of what was previously only considered a solution (Dordas, 2009; Kendall & Pimentel, 1994). One major challenge is to improve options available to growers and to make a profitable transition from high-input conventional agriculture to more sustainable systems for current and future generations (Abbona et al., 2007; Edwards, 1987; Madden, 1989; Ohmart et al., 2008; Zucca, Smith, & Mitry, 2009).
In 1983, the General Assembly of the United Nations created the World Commission on Environment and Development (WCED), also known as the Brundtland Commission, named after its chairman (Keeble, 1987). The special commission was created to develop a long-term strategy for achieving sustainable development by the year 2000 and beyond. The Commission’s task was, among other things, to recommend ways for organizations and countries to develop, taking into account the interrelationships between people, resources, and environment (United Nations, 1983). The WCED (United Nations, 1987) defined sustainable development as development that “meets the needs of the present without compromising the ability of future generations to meet their own needs.” Espinosa et al. (2008) pointed out that the assumption of equity between generations is critical and difficult to manage as a premise of the sustainability concept. Sustainability is embedded in fundamental and complex questions such as: To, or for, whom is one sustainable? At whose expense? With consequences (beneficial or disadvantageous) to whom?
In 1998, Elkington extrapolated the United Nation’s sustainability recommendations to the business unit level. The term “Triple Bottom Line” was coined emphasizing that sustainable development occurs when organizations show responsibility toward economic, social, and environmental aspects (Elkington, 1998). The triple bottom line approach was used as the backbone of this research with the aim to help build a useful definition of the term sustainability in wine growing. The premise that sustainability is the interrelationship of economic, environment, and social components at the business organizational level is the basis for developing a definition of sustainability for wine grape growers.
In agriculture, comprehension of the full scope of the concept of sustainability is essential to reconcile agriculture productivity, natural resource preservation, and conservation and to prevent the degradation of farms (Abbona et al., 2007). In the United States, public policies for rural development have considered both the environmental impact of farming techniques and the socioeconomic performance of rural communities. Because these components are intrinsically related, it is impossible to assess the outcomes of sustainability policies in an isolated way (Brodt, Feenstra, Kozloff, Klonsky, & Tourte, 2006). As a result, it seems essential to define sustainability prior to sustainability assessment proposals.
Why Wine Grape Growing?
Among agricultural crops, wine grape production is the most economically valuable fruit crop in the world (D. I. Jackson, 2010; R. S. Jackson, 2008). Wine grapes are part of a complex value chain because of the close and overlapping interests and interactions between source (grapes) and production (wine). Moreover, wine producing regions are important for rural development, landscape preservation, and tourism worldwide (Soosay, Stringer, Umberger, & Dent, 2009; Tesco, 2011). In 2010, vineyards covered about 7,355 million hectares worldwide (Wine Institute, 2013). Therefore, wine grape growing offers a unique complexity, depth, specificity, and crucial insights into economic, agricultural, social, political, and scientific aspects of sustainability.
Mixed Methods Choice: A Need to Step Back and Redesign the Research
The original primary objective of this investigation was to assess vineyard sustainability and understand adoption of sustainable practices by members of sustainability programs in viticulture worldwide. The assessment would primarily be a quantitative measure driven by a set of variables, followed by field trials according to the precepts of the statistical design of experiments. The research as it was originally conceived proved to be unfeasible. Field comparison trials are often used in scientific agricultural research, including viticulture. However, the lack of consensus on which variables should be used to evaluate if Vineyard X was more or less sustainable than Vineyard Y encouraged us to search for alternative ways to conduct this investigation.
A step back from the original objective became essential to proceed with the investigation. The search for a meaningful definition of sustainability for growers became our first objective. Growers were then chosen to be our primary research source because of the obvious impacts of potentially unsustainable practices on them. In agriculture, it seems that the farmer’s voice has been underrepresented in agricultural studies overall (Chambers, 1994), including sustainability assessments, due to the widely held belief of growers’ inferior knowledge. Top-down assessments through programs are often biased by the sponsors’ need to justify expenditures to the broader population. Systemic reports on farms’ sustainability, considering economic, environmental, and social as intrinsic components, are extremely complex and expensive to produce. Often, reporting a set of chosen indicators might be enough to the sponsor but does not necessarily mean direct improvement of the farmer’s sustainability.
A useful and meaningful sustainability definition became critical as it would drive future assessment choices. Additionally, a consensual definition could make different assessments comparable by analyzing farms’ or vineyards’ outcomes through the same lens. These outcomes should express a common understanding of what sustainability means. The ability to measure countless variables is currently possible because of the advances in science and technology. However, selecting variables that actually help growers make decisions toward more sustainable practices, in their own context, is still a challenge. Moreover, measurements imply costs. Choices need to be practical and driven by a sustainability definition.
Survey methods using a predefined questionnaire were not considered appropriate for the purpose of defining sustainability because of the risk of embedded assumptions from the investigation team. The development of a definition will be affected by the viewpoint and objectives of the investigator. In particular, variables will be preselected because the investigator perceives them to be crucial for a definition. More qualitative approaches exploring human perceptions, meanings, lexicons, and understanding were needed to acquire a better understanding of sustainability definitions in use, a grounded theory approach. As quantification of the data for ranking possibilities was also required, a mixed methods approach was chosen for this investigation. Mixed methods became the ideal approach for both data gathering—in which an adapted focus group method was designed and used—as well as for data analysis.
A focus group is generally described as a group discussion facilitated by a moderator. Focus groups have been commonly used in market, social science (Morgan & Spanish, 1984), and health research (Barbour, 2005) but not in agriculture sciences or sustainability investigations. When well conducted and organized, focus groups promote beneficial interactions between participants that helps build in-depth and synergic results (De Ruyter, 1996). An adapted focus group method was developed for this investigation: the Assisted Focus Group Method of Enquiry. Qualitative data collected from the focus groups were quantified. The data sets were then compared using a variety of mixed methods to analyze the data.
Mixed Methods in Sciences
Although qualitative and quantitative data integration has been largely used by experienced researchers for many years, mixed methods research was formally established only in the late 1980s (Guest, 2013). In the mid-1990s, Chambers (1994) published a series of papers on Participatory Rural Appraisals that could easily be described today as mixed methods in agricultural development. Creswell (2009) predicted that different fields beyond social and health sciences will soon benefit from the usage of mixed methods. In spite of this, to date, it seems that there is no mixed methods research in agricultural sciences. This article proposes that use of mixed methods research in agricultural research is the best way to capture the complexity of investigations on sustainability assessments and to minimize research bias.
Method
This article describes the research strategy and reports findings from the first stage of a large three-stage study, in which assessment of sustainability in viticulture is investigated. Stage 1 concentrates on the development of a definition of sustainability and uses data from the first section of focus group sessions. To place this in the context of the overall study, Stage 2 produces a list of indicators to assess sustainability using data from the second section of focus group sessions (Santiago-Brown, Metcalfe, Jerram, & Collins, 2014a), and Stage 3 will describe the engagement process, the enabling and inhibiting factors for growers and other participants to become part of relevant viticulture sustainability assessment programs worldwide (Santiago-Brown, Metcalfe, Jerram, & Collins, 2014b).
The Stage 1 study is based on data gathered from fourteen focus groups conducted from December 2011 to November 2012 with upper echelons of grape growing organizations from five countries: Australia, Chile, New Zealand, South Africa, and the United States. Upper echelons are executives or top managers of their organizations (Hambrick & Mason, 1984), and in the context of this investigation they are CEOs, Chief Winemakers, and Chief Viticulturists. The selection criterion for these countries was their being a wine producer with a well-documented sustainability program for viticulture. The countries represented in this investigation belong to a group known as “New World” wine producers. To the best of our knowledge, there were no relevant sustainability programs in “Old World” wine countries (Europe) at the time of this investigation.
Outsourcing Participants
This study applied a purposive (or nonprobability) sampling approach. Each participant’s role in their organization was defined as critical to achieving meaningful results. The research aimed to hear from a diverse group of people who were at the top level of decision making in their organizations. It was understood that this group could provide unique and representative information that could not be gathered through other means (Teddlie & Yu, 2007). A wider sample within these organizations, including nonmanagerial employees, could lead to misleading results, as this group does not drive strategies and, by consequence, sustainability outcomes of their organization.
Only upper echelons from wine grape organizations were recruited to be part of this research. Upper echelons characteristics often reflect organizational strategies (Hambrick & Mason, 1984). One of the expected benefits of using the upper echelons approach is the ability to predict organizational behavior and outcomes. Although most literature suggests focus group participants should be paid, our participants were not. Nevertheless, Morgan (1996) recognizes that among top-level executives, meaningful sponsors and/or topics might motivate unpaid participation. This project was introduced as academic research on sustainability in viticulture from the University of Adelaide, a recognized organization in the worldwide grape growing and winemaking community.
Participants were recruited mainly through an adapted snowball method. In a typical snowball sampling, the first individual recruited as part of the study suggests other participants. This sampling approach is often used when a standard sampling approach is not financially feasible because the population is very specific and characterized as impossible to be easily reached (Biernacki & Waldorf, 1981). Adapted snowball sampling was used in this case because the influential individuals who were identified to recruit others to become part of the study are not necessarily themselves focus group participants.
Two complementary pathways were used to recruit participants to the focus groups using our adapted snowball sampling: pathway one—identification and involvement of a highly influential individual from the chosen subpopulation (wine region where the focus group was to be organized), and pathway two—academics, researchers, or wine industry representatives from regional associations with a sustainability program for viticulture in place. These two pathways were used simultaneously. As soon as influential individuals were identified and involved in the project, their help was requested to either use their names as a confirmed participant to invite others or to send a direct initial communication introducing the main researcher and the importance of having them in the research. There were also situations where former focus group participants suggested others from their personal network from wine regions in other countries.
A formal invitation was sent to all potential participants that were identified in the aforementioned process. Because focus group results rely on the spontaneity of the responses, the invitation was purposely vague, emphasizing only the overall research topic. Former participants or associations were requested to not provide more information than what was available in the standard invitation. To avoid refusals because of the lack of information on the specific objectives of the research, the location of the session became critical to help convince participation. A board meeting room or location from a respected influential participant or from a local wine growing association would help increase the credibility of the research. The session times varied according to local suggestions, following their cultural practices. In regions where more than one focus group was organized, participants were grouped by their roles in the organization. Similarity among participants helps minimize potential inhibitions among participants, leading to better discussions.
Focus group techniques emphasize the importance of reminders prior to the sessions (written or phone calls). We did not want to send excessive communication since the potential participants were unpaid and were from upper echelons in their organizations, as excessive communication could annoy participants leading to drop outs. A brief survey was developed through a web-based tool as part of the solution. The substantive purpose of the survey was to characterize attributes of participants and their organizations relevant to the research. The survey could be held immediately before the session started and serve as a gentle reminder of the session they had already committed to attend. Invitations were individual, but the reminder email with the survey link was sent to the group, listing all names. The same email emphasized that the session could not be held if the minimum number of participants were not met or if all participants were not there on time. The knowledge of who would be in the session helped increase commitment and confidence in the credibility of the research.
The Focus Groups
The first part of each focus group discussion was exploratory and self-contained—exploratory because of the approach of generating hypotheses from everyday thought (Calder, 1977) and self-contained because the result of this part of the investigation stands by itself (Morgan, 1996). In our study, a focus group is a video and/or audio-recorded discussion with a small group of 4 to 10 participants to explore a specific topic. An experienced moderator working from a predefined script (Table 1) conducted the focus groups. The moderator was assisted by the principal investigator over a 2-hour period (Morgan & Spanish, 1984). The first section lasted, on average, 1 hour. All sessions were double digital recorded (both audio-video and audio).
Focus Group Questions: Stage 1.
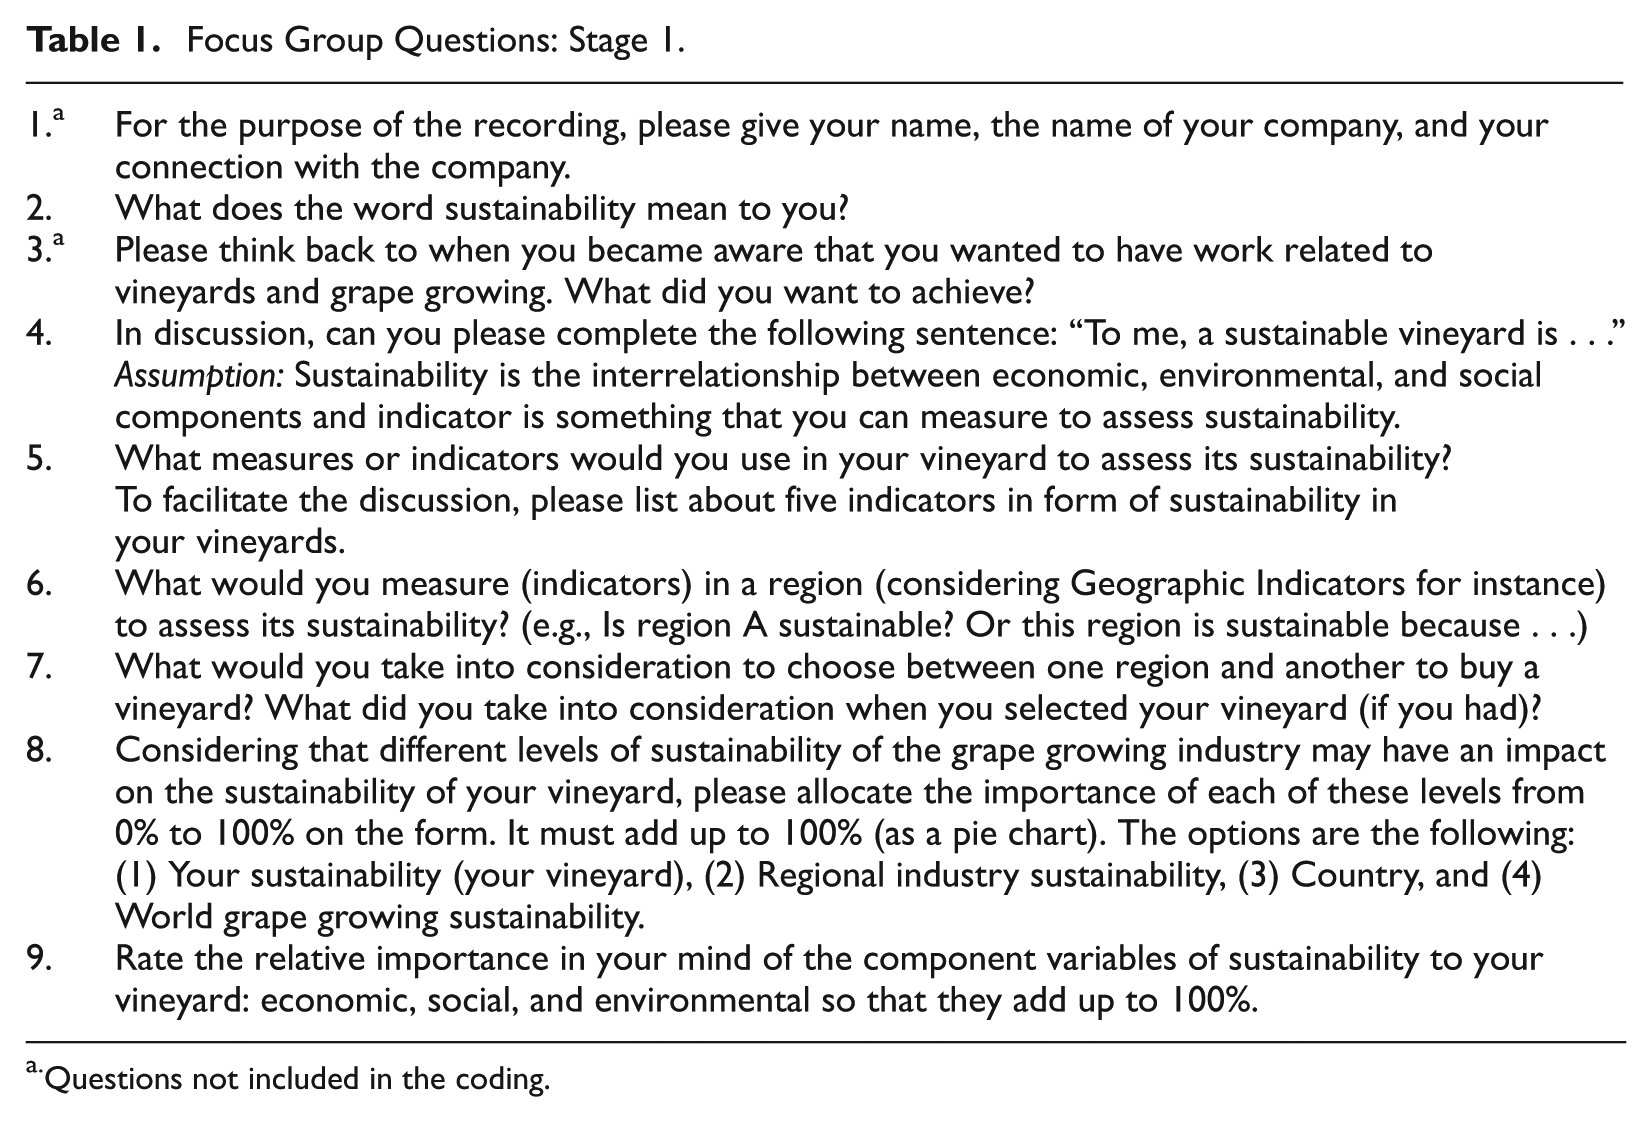
Questions not included in the coding.
In the beginning of the session, an overall explanation on how the section was going to be conducted was given. It was emphasized that there were no incorrect answers or a need to reach consensus. Focus groups aim to capture opinions and comments of different individuals that together benefit from each other’s thoughts. Different opinions should be perceived as contributions to a potential synergic session result. Participants were instructed that the research aimed to discuss sustainability at the farm-gate level. For this purpose, “vineyard” should be considered the farm unit. Questions were oral whereas rating question options were written on the flip chart while the questions were being asked. The flip chart sheets and video were part of the data.
The traditional Focus Group Method was considered insufficient for this investigation. An adapted version was created using a modified procedural method for Focus Groups as described below. We called it the “Assisted Focus Group Method of Enquiry” (AFGME). The AFGME creation had two main motivations: (a) promote equal participants’ contributions, avoiding potential inhibitions because of dominant participants; and (b) optimize session time by providing tools to facilitate participant’s expression within the limited time of a focus group session.
The AFGME was developed and conducted with 14 distinct groups. The sessions included a technique where participants were requested to write down some of their answers on a preprinted form, presented as a set of blank tables, prior to sharing their answers with the group. These answers also included some responses to numerical and rating questions. The purpose of the form was to capture individual spontaneous answers from all participants for further group discussion. There is vast literature on dominant expert or influential participants and how they can influence focus group results (De Ruyter, 1996; Krueger, 1997). The written answers from individuals before the discussion seemed to improve the chances that all participants would be equally heard. The written answers were collected at the end of the session, which included participants’ identification.
The choice of not printing the questions on the form was made to avoid eliciting answers out of the context of the discussion. Printed questions or indications of the direction of the discussion would necessarily influence the session flow, compromising spontaneity. Furthermore, we wanted to avoid interruptions and interaction caused by forms distribution as it could lead to distraction among participants. Form distribution would also reduce useful discussion time. The principal purpose of the forms was to support participant answers. Nevertheless, the main researcher also used them to verify transcripts. None of the sessions exceeded the 2-hour period agreed upon with participants.
To summarize, the objective of the study is to develop a definition of sustainability for wine grape growers using expertise from fourteen focus groups in five countries. The accessible data are the following:
Survey for characteristics of participants and organizations (sent out before focus group session)
Audio and video-visual recording
Flip chart sheets
Questionnaire with responses from participants throughout focus group session, collected at the end
Data Analysis
Session recordings were transcribed verbatim using Express Scribe (NCH Software, 2012), a player software designed to assist the transcription of audio and video recordings. The principal researcher checked transcripts against the original audio and/or video for accuracy. Two transcripts from Chile were translated to English from Spanish. The content analysis was done through a combination of exploratory techniques from two distinct computer-aided processes: NVivo 10 (QSR International, 2012; http://www.qsrinternational.com) and Leximancer 4 (Leximancer Pty Ltd, 2013). The content analysis enabled conceptual grouping of ideas and perceptions of winegrowers and empowered analysis of strength of weighting (e.g., between importance of economic, environmental, and social components of sustainability). Results from the content analysis could then form a basis for more in-depth interpretive coding and analysis.
Transcripts were uploaded and coded in NVivo, a qualitative data management software package, to extract relevant data from them. The coding process proposed by Saldaña (2012) was followed. Questions and moderators’ interventions and comments were not coded as the aim of the investigation was to capture participants’ viewpoint (Saldaña, 2012). An a priori code list was developed from concepts, topics, and notes identified in the sessions by the principal researcher. This first cycle of coding was performed by an assistant researcher using the a priori code list. The principal researcher conducted the interpretive-inductive second and third cycles of coding using iterative axial coding and pattern identification to generate elaborative and theoretical coding. A report containing all coded references to economic, environmental, and social sustainability was used to generate a concept map and a tag cloud from spoken comments from focus group participants.
Concept maps or word/tag clouds are pictorial heuristic representations of text. Heuristics provide a sufficient and simplified pathway to find solutions to a given problem (Shah & Oppenheimer, 2008). Different software produces different illustrations based on chosen algorithms. Font sizes or color palettes are commonly used to indicate frequency of word or concept co-occurrences (weight): the bigger or brighter the fonts of the word in relation to the others, the more frequently the word or concept in the source document is used to generate the illustration. The software also determines the positioning and/or clustering of the words/concepts in the illustration. Concept maps are hierarchical representations of ideas to facilitate knowledge (Novak, 1990).
The most frequently occurring exact words produced a tag cloud displayed in larger fonts NVivo. The same coded references became the input source for Leximancer, an automated text content analysis software. Leximancer was used to generate a concept cloud, displaying clusters of concepts (themes), as well as toggled pathways between pairs of chosen concepts. An automated co-occurrence matrix of concepts displaying x, y coordinates and weights and a concept rank of frequency of occurrence were then exported from Leximancer to generate a bubble chart of the main concepts in Excel (Microsoft, 2011). The weight, which is the sum of concept co-occurrences compared with how frequently they occur elsewhere, was used to determine the bubble sizes. Excel was also used to generate all graphs.
Results
Demographics and Organization’s Characteristics
The sample comprised 83 participants from Australia, Chile, New Zealand, South Africa, and the United States (Table 2). The number of participants from each country is given in the top row. A cross-tabulation between participants from each county, their demographic data (role and education), and participants’ organizational characteristics (business ownership, wine producer, exporter, size, and certifications) is presented as a percentage of the total of each country. The percentage display was chosen to facilitate comparison between countries. In our adapted snowball sample, 59 of the 83 participants’ organizations belonged to a sustainability program, although all 24 of the other organizations are located in a wine grape region that had one available to join.
Focus Group Participants and Their Organizations’ Characteristics.
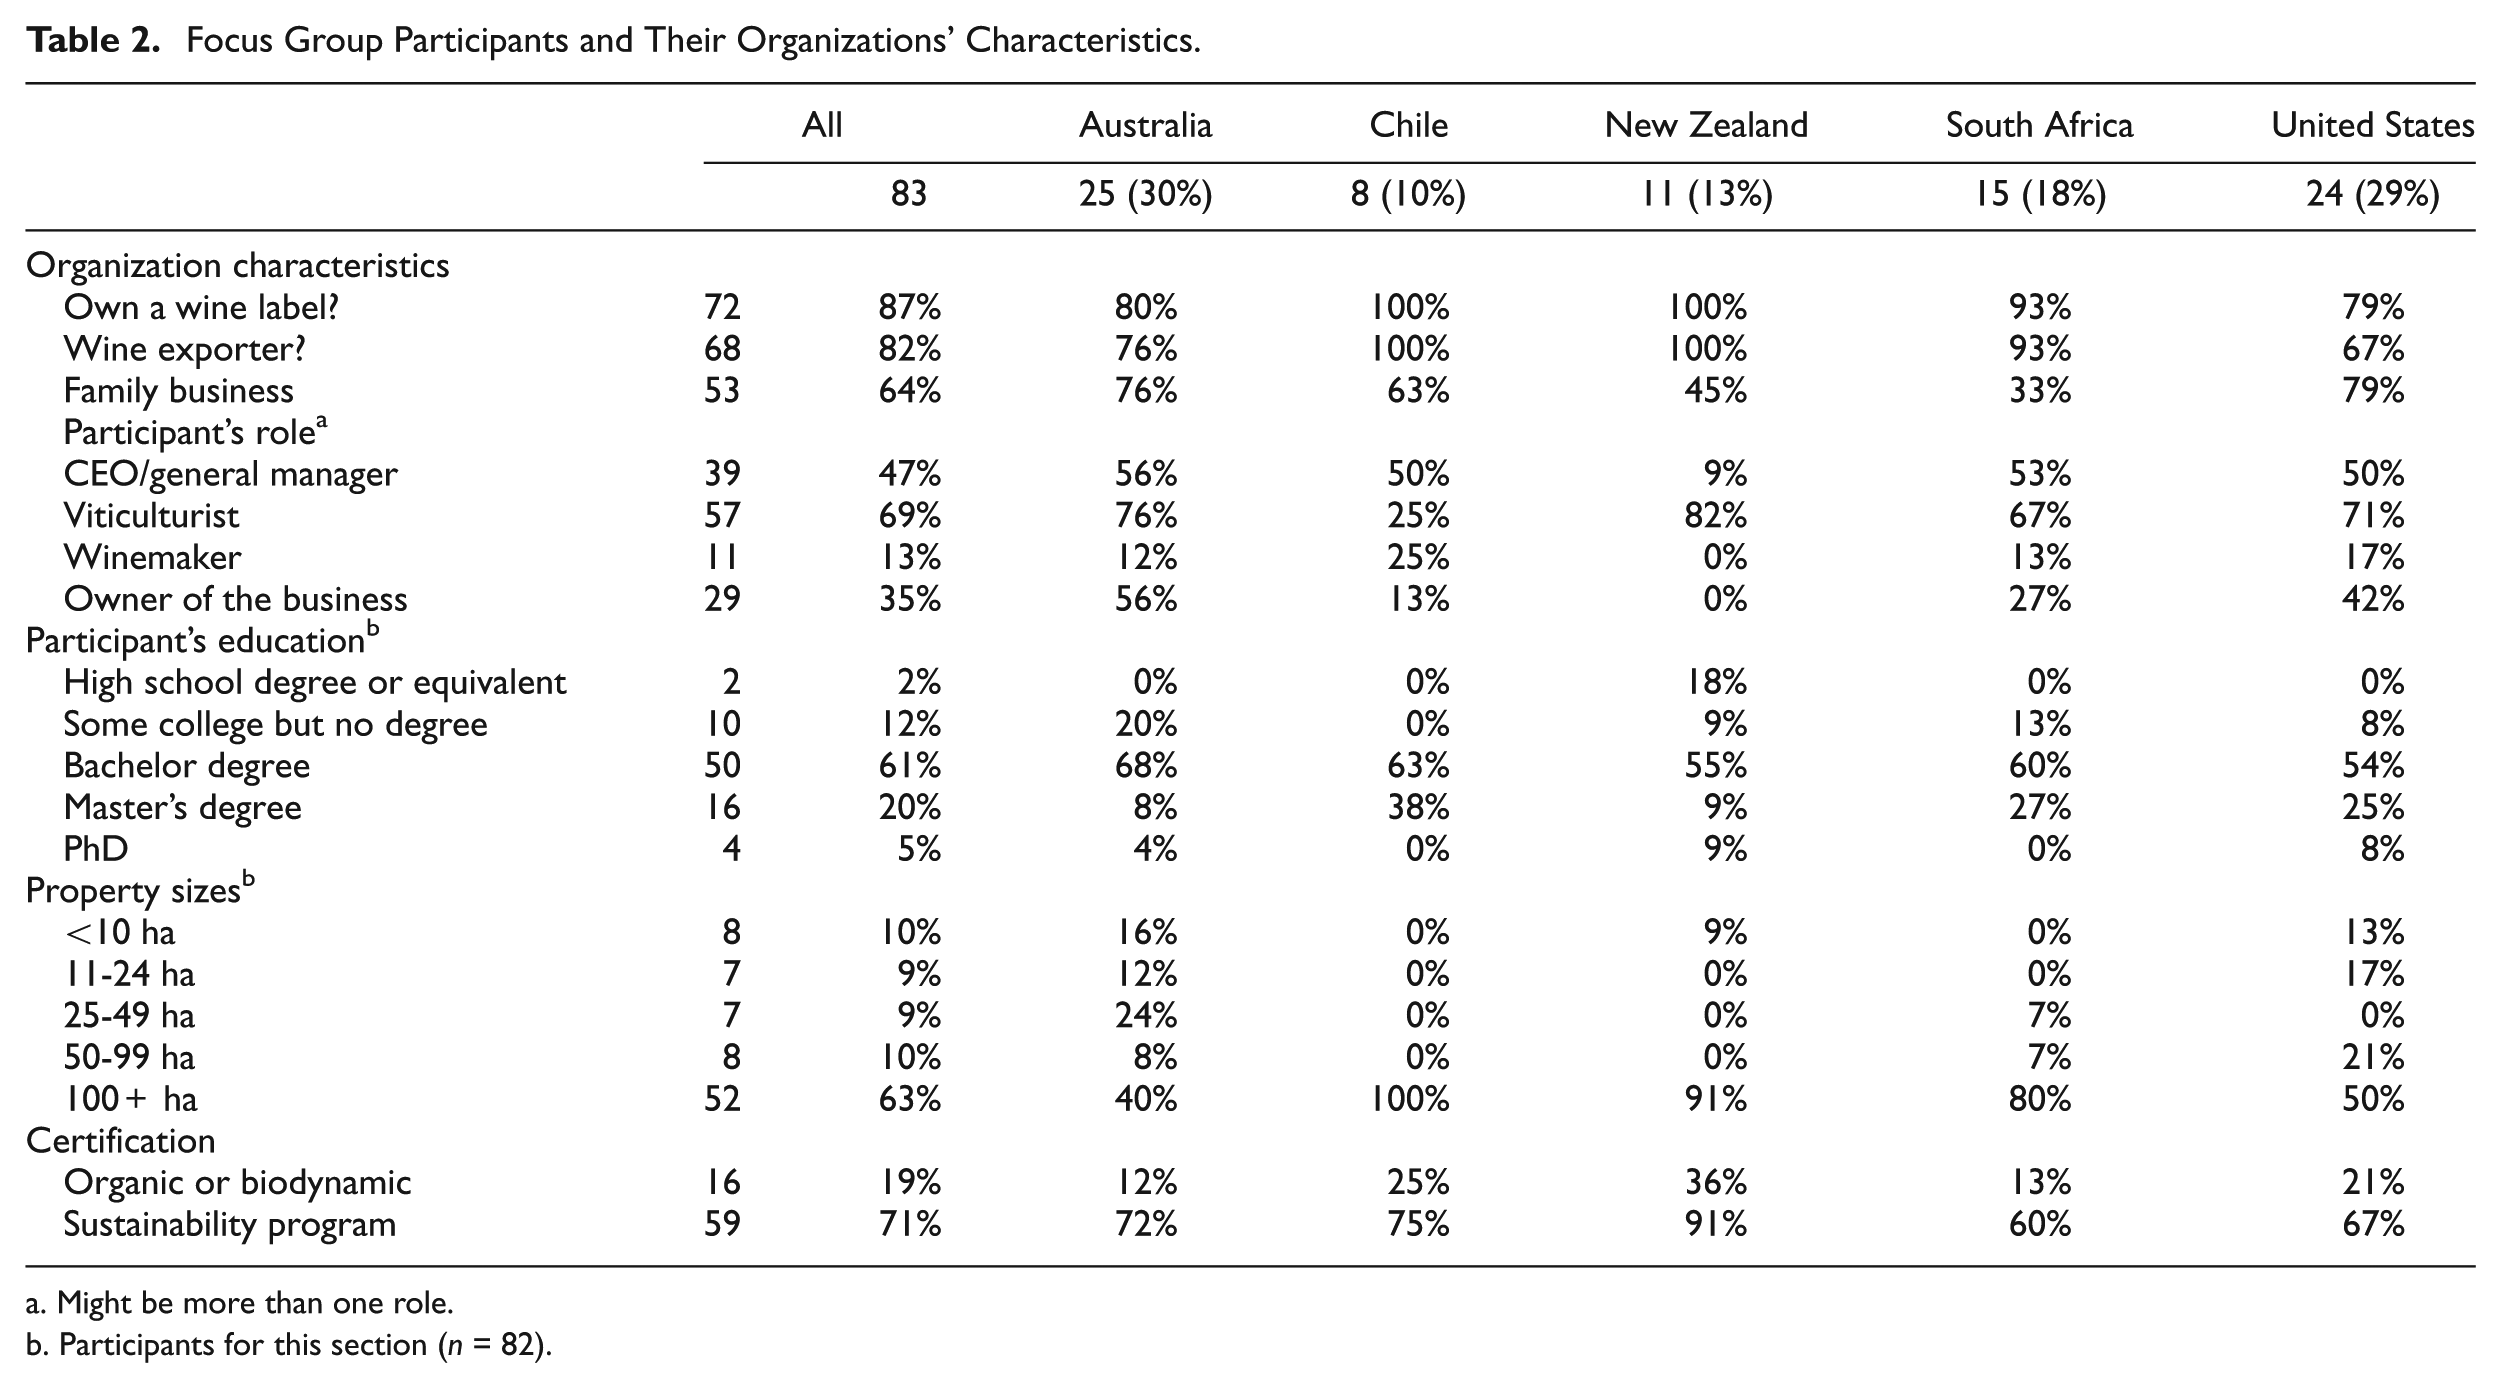
Might be more than one role.
Participants for this section (n = 82).
Sustainability Components and Spheres of Influence: Participant’s Perspective
Participants were asked to attribute an importance score, summing to 100%, to the economic, environmental, and social components of sustainability of their vineyards, at the end of the session. Their responses indicate that economic (41%) is followed by environment (35%) and the social is the least important component among the three representing 24% (pie chart [Figure 1A] and parallel coordinate plot [Figure 1B]). These results need to be interpreted cautiously as individual answers are spread over a wide range (Figure 1B). Attributed importance to economic sustainability responses varied from 15% to 80%; environment responses varied from 20% to 70%; and social responses varied from 0% to 50%.
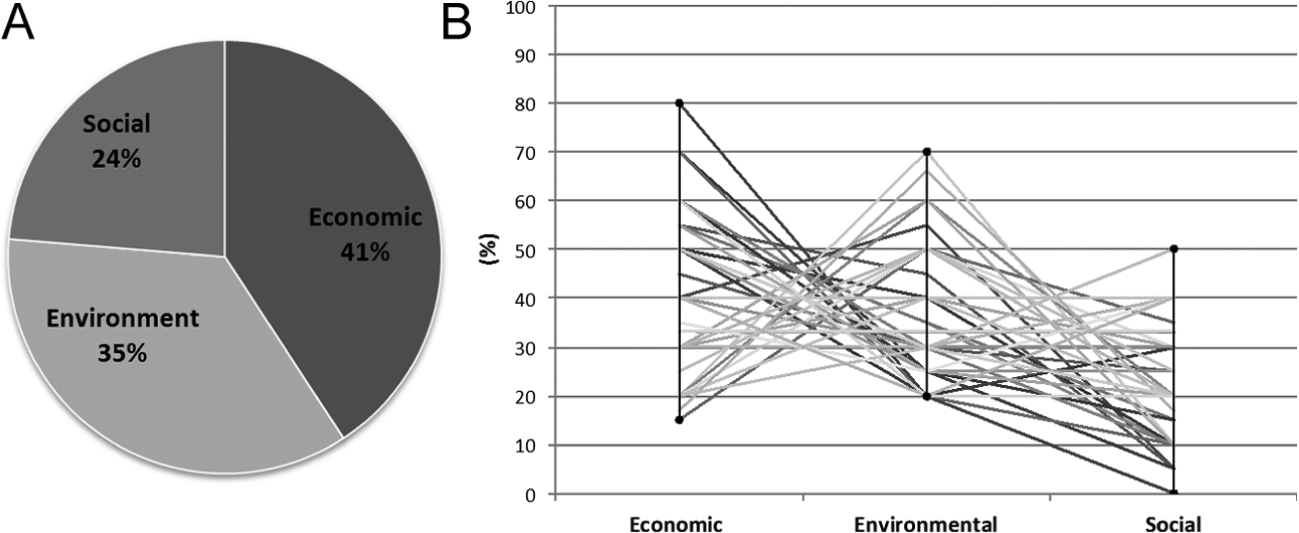
Average attributed importance to components of sustainability by the 83 participants: (A) pie chart, (B) parallel coordinate.
The semantically significant words in participants’ utterances were coded into three main categories: economic, social, and environmental. From 14 focus group transcripts, 3,416 references were coded. The number of references for each one of the three code groups was used to generate Figure 2. Qualitative data were transformed into quantitative to compare number of references from utterances with the questionnaire results. The results are 45% to economic, 31% to environment, and 24% to social, which are similar to the results from the participants’ attributed values from the questionnaire during the focus group session.
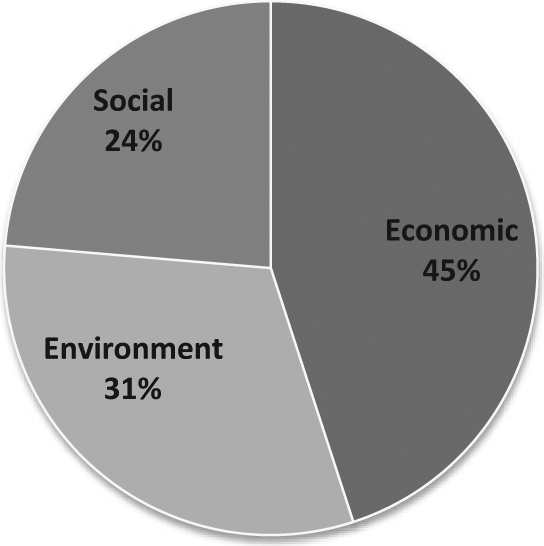
Percentage of 3,416 references coded in NVivo, attributed to the three components of sustainability.
A hypothetical set of spheres of influence or levels of sustainability within the wine industry was given to the participants to allocate, summing to 100%, the perceived impact of these spheres on their organizations: own vineyard sustainability, regional sustainability, country’s sustainability, and world’s sustainability. Participants’ attributed scores are shown in Figure 3. Their own sustainable practices were valued as most important (44%), followed by regional (27%), country where they are located (16%), and worldwide sustainability (13%).
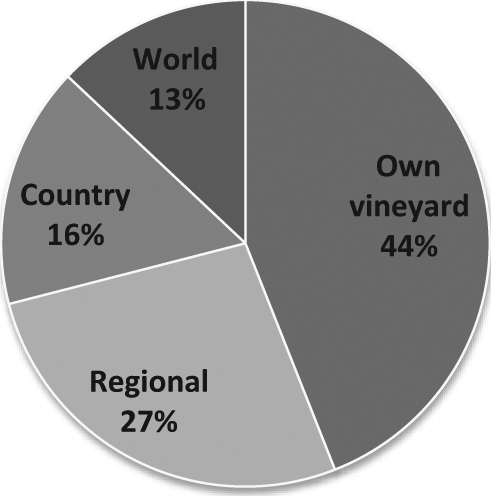
Relative importance of sustainability spheres of influence on sustainability of 82 vineyards (1 abstention).
Content and Concepts From Transcripts
An initial concept map was generated using the suggested Leximancer settings for focus group transcriptions. After viewing the first unedited result, a minimal intervention approach, to avoid bias, was chosen by the principal researcher to refine the results. The following default settings were modified in order to create a more stable and representative concept map: one sentence per block of analysis (the default is two) as there were many one-sentence utterances from participants. A topical (or linear) clustering algorithm was chosen over the social (or Gaussian) to display the map. A few semantically weak words, commonly used in informal spoken language, were excluded from the concept list generated automatically by the software (e.g., sure, probably, things). Those words were valued as “evidence” instead of being merely removed, as it was understood that they had an important role in the connectedness of the concepts. Some words with semantic similarity, in the context of this investigation, were merged manually by the principal researcher: (a) property and farm, (b) fruit and grape, and (c) area and region. Several concept maps were then generated and a visualization showing 100% of the top concepts and top 33% themes was chosen. These chosen settings produced the best representative concept map for this investigation. The data produced by Leximancer to generate the concept map were exported as spreadsheets to generate our own concept map (a black-and-white bubble chart).
A ranked bar chart was produced by Leximancer displaying the most relevant concepts (Figure 4A). Leximancer performs its own semantic analysis based on an auto-learning process in the context of the content source. Therefore, concept rank is not the same as a simple word frequency count. The rank displays concept relevance that is a “percentage representation of the count value of each concept divided by the single highest count value” (Leximancer Pty Ltd, 2013), representing the proportionality of concepts in relation to each other. In our investigation, “vineyard” was the most relevant concept found, followed by sustainable (63%), quality (61%), farm (59%), and so on down to water (3%).
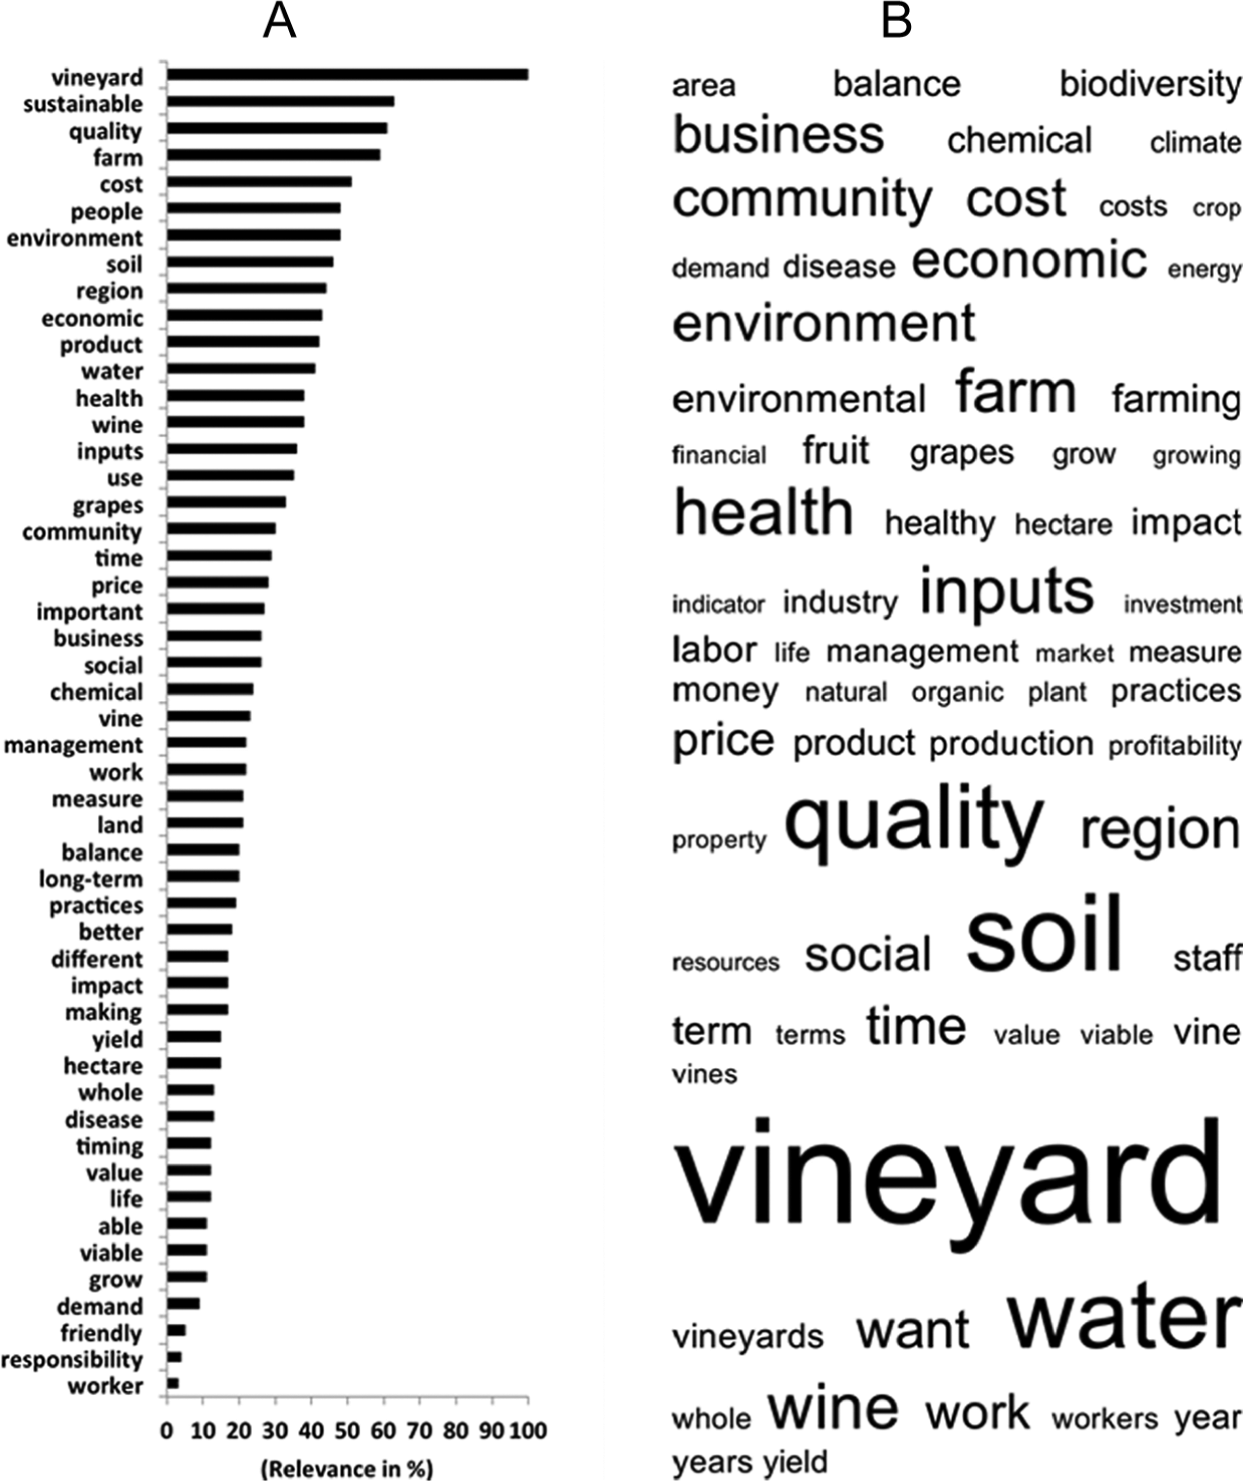
(A) Ranked concepts (Leximancer) and (B) tag cloud of word frequency (NVivo) from reference coding (total of 3,416 references).
A tag cloud was generated from a word frequency query from NVivo (Figure 4B). The combined analysis of outcomes from two distinct programs was used to minimize any potential bias in the analysis of the results. Furthermore, similarities between the results would increase confidence in our analysis. The 70 most frequent words are shown in the tag cloud in larger fonts and alphabetical order. The tag cloud was generated from participants’ exact words, from the references coded. In the NVivo query options, the “exact” word setting was chosen because some key words such as “product” that, in the context of this research mostly mean “grape” or “wine,” was wrongly merged automatically with the words “production” and “productivity” when either the “synonyms” or the “stemmed words” settings were used as query settings. NVivo does not allow editing of its automatically generated synonyms list. From the NVivo query, “Vineyard” was the most frequent word (642 counts), followed by soil (459), environment/environmental (217 + 147 = 464), and so on down to resources (73). A close similarity was found between the ranked concept list (Leximancer) and the tag cloud (NVivo).
A heuristic representation of the meaning of sustainability was created as a concept map from Leximancer outputs (Figure 5). The coordinates (x and y) provided by this content analysis software were used to position the concepts in this representation, as well as to indicate their relative importance (weight). The size of the circles around each concept represents each concept weight. The illustration also displays the three most relevant themes identified by the software in our sustainability investigation. In Leximancer, “themes” are autogenerated groups of strongly related concepts. The most relevant theme was labeled as “vineyard” and it clusters the group of concepts within the oval black continuous line (vineyard, sustainable, farm, economic, etc.). The second theme is “soil,” identified by an oval-shaped dashed-line, and third is “quality” (double-lined oval shape).
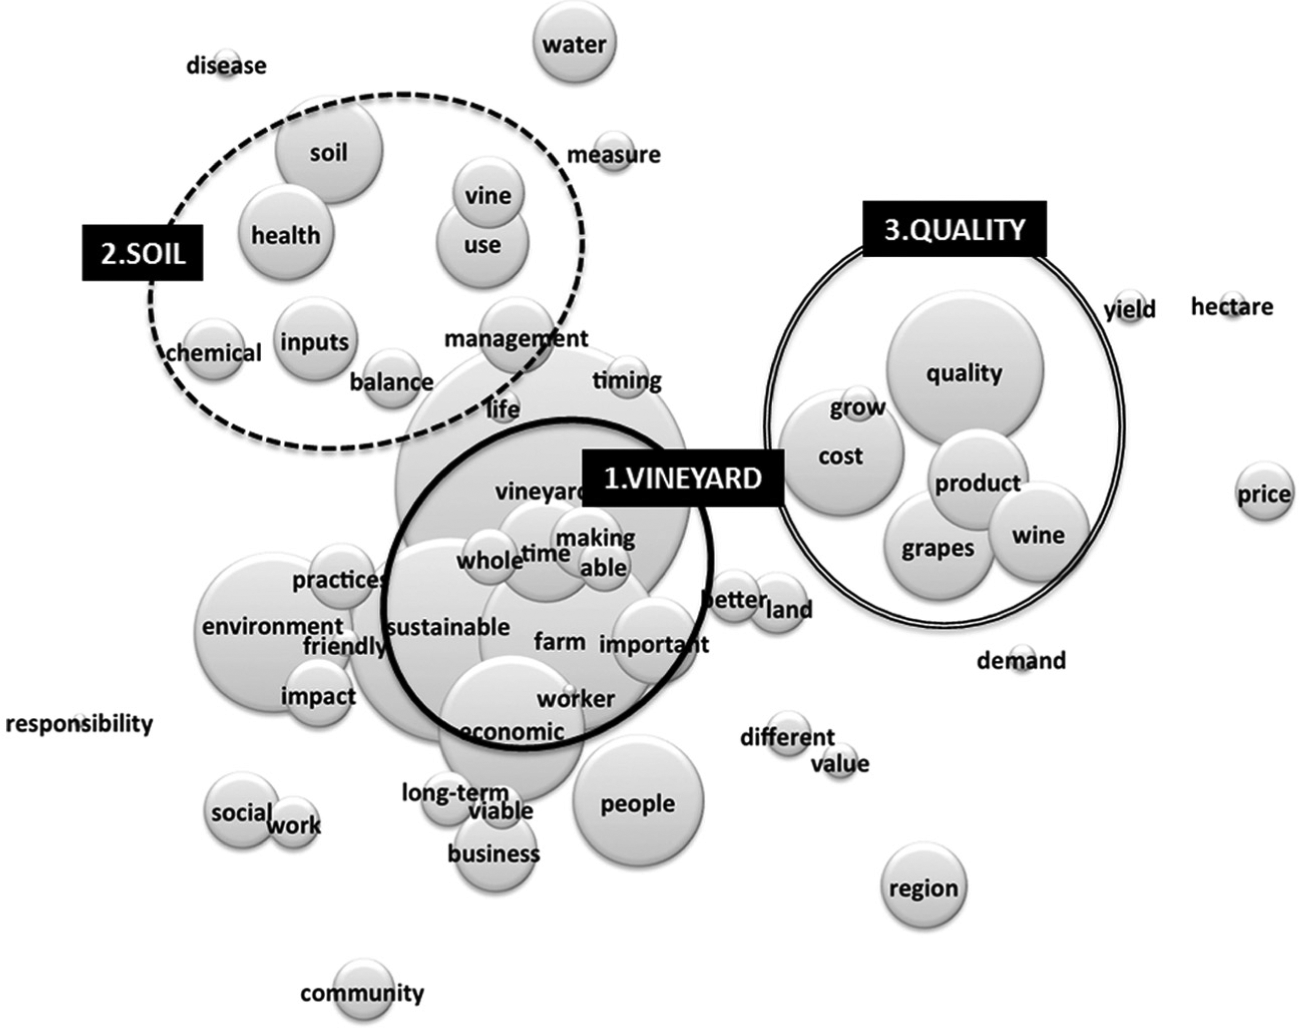
Sustainability automated concept map, showing the three main emergent themes: (1) vineyard, (2) soil, and (3) quality.
The soil theme (Figure 5) contains the soil concept that is closely related to the health concept. This second theme encompasses input management, including chemical usage. Management, inputs, and chemicals are closely related to balance that is directly related to soil and vines. Health emerged as a systemic concept not only related to soil but also to vines. Some other important concepts float around the soil theme such as measure and water. Water has its main connection with this theme through the “use” concept and therefore having an impact on the vines. The soil and vineyard themes are directly connected through the concepts of timing and life, which form themes themselves that for visualization purposes are not shown in the concept map.
The connection between the cost and the vineyard concepts links the first and the third displayed themes. Within the quality theme are the two main possible end products from a vineyard: grapes and wines. The concept map suggests a strong relationship between costs and the intended grape and/or wine quality. Grape yield per hectare seems to be closely related to quality (grapes or wine produced), but is not placed into the quality theme. It suggests that yield per hectare itself is not related to quality but it affects it. Price is placed outside the theme but it connects with quality through wine. Cost, on the other hand, is directly connected to grapes. The themes “quality” and “vineyard” are directly connected by the cost and vineyard concepts. Apart from this, the land is placed as a key concept in between these two themes.
Leximancer also features a tool where the strongest pathways between concepts can be revealed by selecting any of the two concepts in the map. Figure 6 displays a series of automated toggle pathways from the concept map. Each line represents a distinct pathway between pairs of chosen concepts from the concept map. The order in which these concepts are displayed indicates the order they connect with each other in that specific query. These connections can be used to expand the knowledge about the connectedness between concepts. As an example, the strongest pathways between the concepts “long-term” and “price” are the following: business, viable, economic, farm, cost, product, and wine, in this order. Concepts that were oppositely placed in the concept map were chosen to contribute to broader knowledge on the concepts’ connectedness.
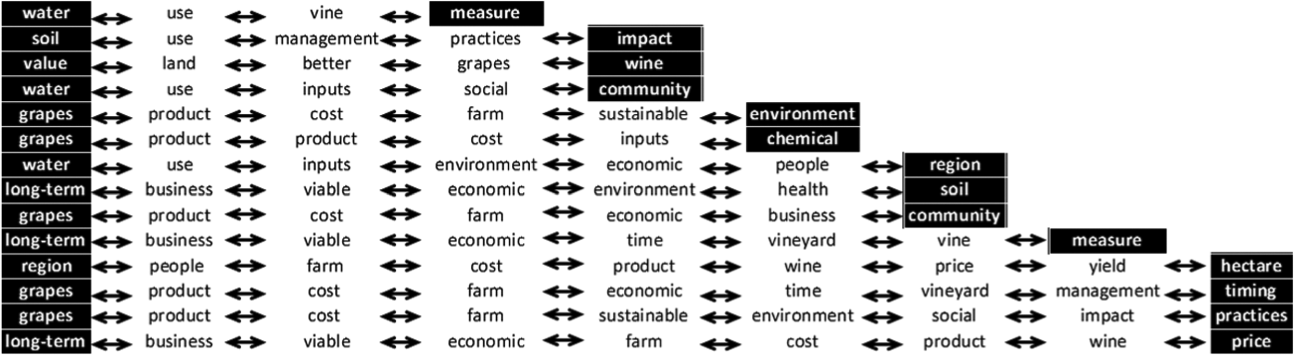
Automated toggle pathway from Leximancer between pairs of chosen sustainability concepts from concept map (Figure 5).
Discussion
The complexity of the sustainability concept seems to be the main cause of the lack of a consensual definition for the term. Assessments using the triple bottom line approach have become the most usual way to illustrate sustainability (Figure 7A). This illustration has great merit in driving us away from the narrow perception that sustainability is only about the environment. A sustainable system is environmentally friendly, economically feasible, and socially equitable (California Sustainable Winegrowing Alliance, 2006; United Nations, 1983). However, this illustration also promotes the perception that sustainability is only reached if these three components are of equal importance and interact evenly. Eighty-three focus group participants from the wine industry from five countries seem to agree that the three components are important, but not equally so. From the farmer’s perspective, the economic variables appear to have a stronger importance than the social and/or environmental components. This result was not surprising as our preliminary investigation suggested that environmental preservation and conservation, as well as social investments, are dependent on the economic performance of the vineyard. Nevertheless, the environmental and social components are also essential to the economic performance. Economic, social, and environmental components are intrinsically interdependent. Furthermore, Figure 7A seems to neglect both the time factor and trade-offs commonly seen in everyday farm management choices.
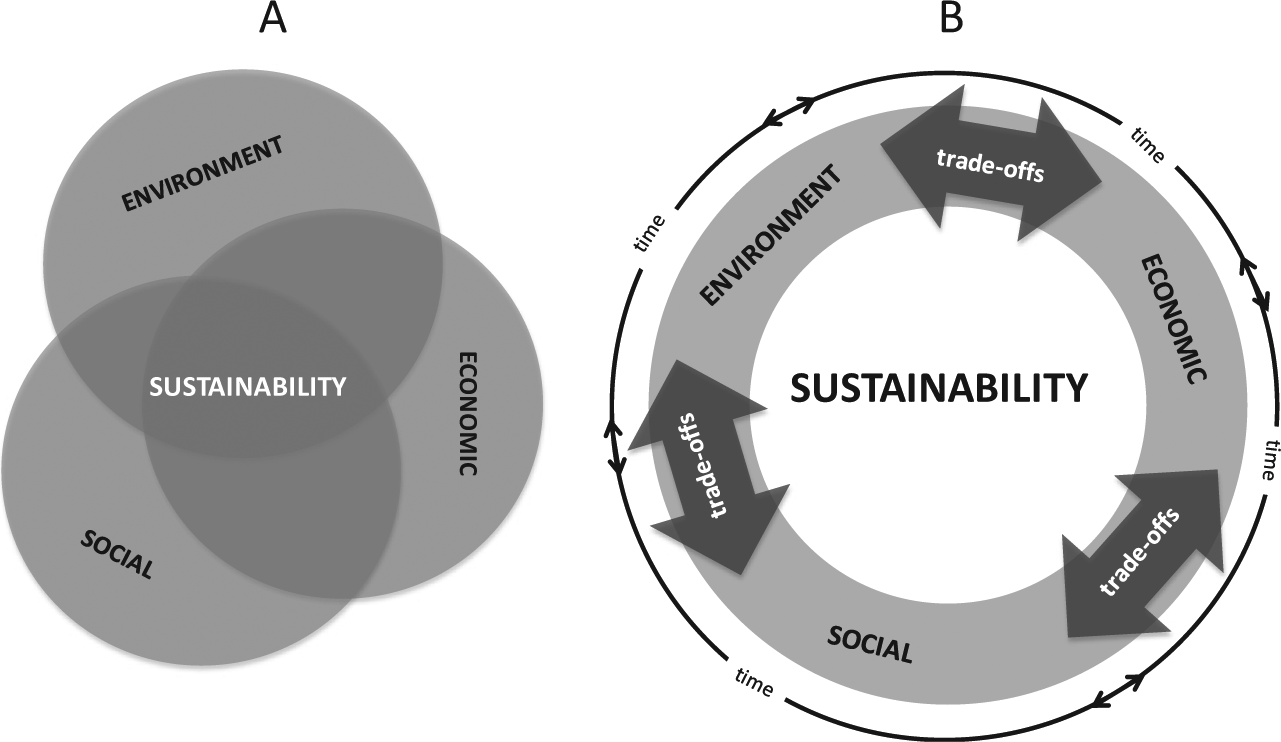
A sustainability definition: (A) classic triple bottom-line approach and (B) proposed representation emphasizing time and trade-offs.
As a result, traditional sustainability assessment using the triple bottom line approach, as presented in Figure 7A, does not encompass all of the important characteristics of the sustainability concept. The results achieved through the mixed methods research demonstrate that there are important and complex variables in sustainability, such as multiple time horizons of decision making, trade-offs, context, and the view point of the assessor. Furthermore, many of these variables might belong to more than one of the triple bottom line categories. These overlapping variables might overlap differently depending on the context of the sustainability assessment and analysis. The mixed methods research was essential to capture these subtle aspects of the sustainability concept that would be difficult to capture otherwise.
Just as different people are driven by different motivations, farm investment decisions are made for different reasons: new process implementation, purchase of new equipment, employee training investments, landscape improvement, and biodiversity increase among many others. For instance, in a vineyard, the need for a new tractor is likely to impact on something else of equal but different importance in that specific period of time. The farmer might even be giving up profit for that year. Trade-offs in farm management operations are difficult to capture through single point-in-time assessments. Improvements in specific areas might not compensate for a bad result in areas that did not receive the same amount of attention, investment, or improvement in that same period. Trade-offs over time promote continuous tension between the economic, social, and environmental components (Figure 7B). Moreover, these three components often overlap and an objective categorization of specific variables in each one of these three components seems to be context dependent. Thirty-six percent of the transcript references produced by using NVivo were coded in more than one component as the context of the discussion clearly indicated. In this way, sustainability should be redefined as follows: “The continuous pursuit of equilibrium between economic, social and environmental variables, and their trade-offs over time” (Figure 7B).
Such a definition still seems inadequate to ensure a common understanding of sustainability. The root of the problem is the direct, but nonobvious, link between the sustainability definition and the need for a commonly agreed assessment method. The above-proposed definition encompasses the social, economic, and environmental components over time and their potential trade-offs. However, it is still too broad and subjective to achieve a consensual understanding. What is meant by “environmentally friendly farm”? What is meant by “economically feasible” or “socially equitable”? The answer is at least partially dependent on the viewpoint of who is asking the question and the context and time frame of the analysis. This investigation brings attention to a need for a definition from farmers for farmers.
This investigation found out that the vineyards or farms themselves are seen as the center of the sustainability definition from the farmers’ viewpoint. The results from the content analysis software are consistent with the participant’s attributed rate for the levels or spheres of sustainability influence (Figure 3). Participants attributed 44% out of 100% to their own vineyard when asked about the weight of each one of the four hypothetical spheres of influence on their own sustainability. Winegrowers strongly relate their actions and overall consequences of these actions to direct impacts on their own sustainability. The theme “vineyard” encompasses the farm itself and its ability to produce over time. The concepts “making,” “whole,” “important,” “able,” “sustainable,” “economic,” and “worker” were placed within this theme by the content analysis software. Interestingly, the concept “worker” has a relative smaller weight than others within the set, but it is placed centrally in the concept map.
On average, regional sustainability was the second strongest sphere of influence on their vineyard sustainability. Regional sustainability can be related to the vineyard location, accounting for 27% of the weight attributed by participants. The community and/or region are listed among the most relevant concepts or recurrent words discovered by Leximancer and NVivo. In the concept map both terms are connected to the main theme “vineyard” through the concepts “people,”“business,”“viable,” and “economic.” Country and worldwide wine grape sustainability seems to be correlated to market forces, policies and regulation, and having a greater impact in higher volume wine export producers.
The automated toggle pathway from Leximancer linking pairs of chosen concepts in the map contributes to the emergence of a definition from the farmer’s viewpoint. The pathways suggest vine measures or vine health monitoring to determine water use. It also identifies that impacts on soil are directly related to the chosen practices and management. As indicated by the concepts placement in Figure 5, there is strong relationship between cost of grapes and products, which might also mean wine, and environment, through a sustainable farm. Vines and vineyard monitoring over time is necessary to achieve economically viable long-term businesses. Wine prices are connected to the wine itself or grape produced and it passes through the economics of the farm, again to drive long-term businesses or vineyards. In short, “a sustainable farm or vineyard is the one that is able to economically provide for the farmer while maintaining its ability to consistently produce and improve quality over time.”
Greene (2008) suggests that a mixed methods study should generate insights that would not have been accomplished with one method alone. Starting from 14 focus groups, mixed methods in the form of the quantitative lexigraphic software led to the above definition of sustainability and highlighted subtle relations between concepts that were not apparent from perusal of the transcripts.
We were able to demonstrate a good approximation to theoretical saturation, inasmuch as the last few focus groups did not generate any substantial new concepts. We do have some tests of consistency, or methodological triangulation (Guion, Diehl, & McDonald, 2011), such as the comparison between the relative importance attributed to economic, environmental, and social aspects of sustainability from the questionnaire and the automated count of utterances. The focus groups could be grouped by country, and hence by different culture, to provide some level of data triangulation (Guion et al., 2011), but the principal researcher considered that this would impede, rather than assist, the goal of establishing a generally accepted definition of sustainability for wine grape farmers. For the same reason, we have not considered viticulturists, wine makers, and managers as separate groups.
Conclusions
The use of mixed methods research is not usual in sustainability or scientific agricultural investigations. The results from this study demonstrate that mixed methods research has the potential to be used as the main pathway in sustainability investigations of individual organizations. The method captures nuances of the concept that would be difficult to capture using just a qualitative or quantitative method alone. These nuances are revealed as complexities of the sustainability concept that are difficult to be perceived in similar investigations not using mixed methods: time factor, trade-offs, or overlaps between variables used to assess sustainability, as well as the context and viewpoint of the assessment. These complexities, however, are essential to understand the concept and determine meaningful variables for sustainability assessments that can positively increase individuals’ understanding of their organizations and therefore influence their choices.
Individual organizations, in the context of this study—vineyards, need to be sustainable to endure over time. The pursuit of sustainability is the goal of any individual organization aiming to survive over time. To be able to keep producing over time, vineyards need to maintain and improve the quality of their products as the world is in constant change. These changes challenge the current productive processes. Over time, practices and processes need to be changed and adapted to meet the requirements of a changing environment. In farms, the land and the environment are directly connected to production. Environment preservation impacts directly on production. The social component is also critical to the sustainability of organizations: not only the direct workforce but the surrounding communities because often they are the main service and product providers for the farms and people that work or live on them.
Mixed methods research also minimizes the researcher’s bias by combining and analyzing multiple data sets, captured through different means. Moreover, it might shorten time in scientific research when common knowledge can contribute to select representative data sets or pathways. A bottom-up model, from the farm to industry bodies or government, as opposed to a top-down (from the industry bodies or government to farms), is proposed as the most viable pathway. The model seems to have a higher potential to increase the usefulness of sustainability investigations of companies, including farms. Similar models could be developed for sustainability investigation in any field. Such models can contribute to the development of sustainability assessments from the company’s viewpoint. The findings from this research create a working definition of sustainability that can be used as a model for other fields.
Footnotes
Acknowledgements
This research would not have been possible without the dedication and time of the main moderator of the focus groups sessions, Dudley Brown. The authors would like to express their gratitude to all focus group participants of the sustainability project for their generous acceptance to our invitation and time to be part of our research. We would also like to thank the organizations where the sessions were held and people involved in the grape growing industry that helped with introductions or interviews in Australia, Chile, New Zealand, South Africa, and the United States. We also gratefully acknowledge support and discussions with Gerardo Leal (main moderator in Chile), Ilona Box (coding), Ray Correll (statistical advice), and Joanna Kenny (transcriptions).
Declaration of Conflicting Interests
The author(s) declared no potential conflicts of interest with respect to the research, authorship, and/or publication with the following exception: Irina Santiago-Brown has participated in research collaboration with some of the informants in this study and also has managed and developed the McLaren Vale Sustainable Winegrowing Australia program.
Funding
The first author received financial support for the research from the University of Adelaide and the Grape and Wine Research and Development Corporation - GWRDC as part of her PhD research.