
Abstract
Keywords
Diabetes is now the commonest noncommunicable illness in the world and is associated with significant morbidity and mortality; more than 371 million people worldwide have diabetes (International Diabetes Federation, 2012a). It is associated with microvascular and macrovasular complications. As there is no diabetes registry in Ireland, it is difficult to establish the true prevalence rates. However, the International Diabetes Federation estimates that there are 191,380 people with diabetes in Ireland (with a prevalence of 6.1% in the population), approximately 7% to 9% of whom have Type 1 diabetes (T1D; International Diabetes Federation, 2012b).
Some of the longer term complications of diabetes can be avoided by maintaining good glycemic control. Glycosylated hemoglobin (HbA1c) is used to identify the average plasma glucose concentration over a period of approximately 3 months. Best practice (American Diabetes Association, 2013) would recommend testing HbA1c every 3 months if the person is trying to improve his or her glycemic control or every 6 months if glycemic control is already achieved and they want to maintain it. HbA1c goals usually determine how tight people with type 1 diabetes have to run their blood sugar, which is usually individualized to the person’s treatment needs. Current guidelines recommend a target HbA1c of between 53 mmol/mol (7%) and 59 mmol/mol (7.5%; American Diabetes Association, 2013). Landmark trials such as the Diabetes Complications and Control Trial demonstrated that poorer glycemic control (higher HbA1c) was associated with an increased risk of some of the complications of diabetes such as retinopathy; however, tighter control (lower HbA1c) was associated with an increase in the frequency of severe hypoglycemia (Kilpatrick, Rigby, & Atkin, 2008). Hypoglycemia can be very debilitating to those who experience it and can negatively affect people’s quality of life (Lawton et al., 2013). The challenge in day-to-day management of T1D is to find a balance between an acceptable low level of HbA1c without frequent hypoglycemia.
Literature Review
Self management is considered key to effective care for persons with diabetes (Mensing et al., 2007; National Institute for Clinical Excellence, 2003). Diabetes self-management supports informed decision making and collaborative partnerships and focuses on providing the person with the necessary knowledge and skills to manage his or her condition, enabling the person to monitor his or her symptoms, identify and solve problems, taking into account the person’s needs, goals, and life experiences (Haas, 2012). Many factors have been identified that influence self-management in persons with diabetes. These include helplessness and frustration from lack of glycemic control (Casey, Murphy, Lawton, Findlay-White, & Dinneen, 2011; Murphy, Casey, Dinneen, Lawton, Brown, 2011; Nagelkerk, Reick, & Meengs, 2006); perceptions of blood glucose monitoring/ testing (Peel, Parry, Douglas, Lawton, 2004); interpersonal conflicts and depression (Gazmararian, Ziemer, & Barnes, 2009); fear of hypoglycemia (Wild et al., 2007); the presence of comorbidities (Nam, Chesla, Stotts, Kroon, & Janson, 2011); diabetes knowledge (Brooker, Morris, & Johnson, 2008; Carbone, Rosal, Torres, Gorins, & Bermudez, 2007; Enwistle, Prior, Skea, & Francis, 2008; Howorka et al., 2000; Nagelkerk et al., 2006; Nam et al., 2011; Osborn, Bains, & Egede, 2010; Xu, Toobert, Savage, Pan, & Whitmer, 2008; Zhong, Tanasugarn, Fisher, Krudsood, & Nityasuddhi, 2011); and social support (Brooker et al., 2008; Glasgow, McKay, Piette, Reynolds, 2001; Nagelkerk et al., 2006; Osborn et al., 2010; Stamler, Patrick, Cole, & Lafreniere, 2006; Xu et al., 2008; Zhong et al., 2011). However few studies have explored the factors that impact on maintaing good HbA1c levels over time.
Motivation to self-manage has been linked with more acceptable HbA1c levels (Williams, Freedman, & Deci, 1998). Motivation is “the process whereby goal-directed activity is instigated and sustained” (Schunk, Pintrich, & Meece, 2008, p. 4) and goals are considered motivational triggers for action (Karoly, Boekaerts, & Maes, 2005). Motivators for behavior have also been found to influence self–management, such as self efficacy (Bandura, 1977; Bodenheimer, Wagner, & Grumbach, 2002; Glasgow et al., 2001; Norris, Lau, Smith, Schmid, Engelgau, 2002; Sousa, Zauszniewski, Lea, & Davis, 2005; Peyrot & Rubin, 2007; Funnell et al., 2008; Xu et al., 2008; Zhong et al., 2011; Qiu, Sun, Cai, Liu, & Yang, 2012); personal values (A. Williams, Manias, & Walker, 2008) and attitudes (Zhong et al., 2011). Self-determination theory focuses on the process through which individuals obtain the motivation to initiate and sustain behavior (Ryan, Patrick, Deci, Williams, 2008). Autonomy, competence, and relatedness are perceived to govern the extent to which a person self-regulates and maintains a behavior or not (Ryan et al., 2008). Ryan and Deci (2000) describe a continuum of extrinsic to intrinsic motivation. Intrinsic motivation is the “doing of an activity for its inherent satisfactions rather than for some separable consequences” (p. 56). In contrast, extrinsic motivation involves the person engaging in a given behavior because he or she seeks an external reward, such as approval from others or wealth and fame (Kasser & Ryan, 1996). Intrinsic motivation is associated with autonomous motivation, where the aim is to achieve personal growth, good physical health, and meaningful relationships (Kasser & Ryan 1996). A high level of autonomous motivation has been linked with improved quality of life, medication adherence, improvement in diet and cholesterol levels as well as improvements in HbA1c (Shigaki et al., 2010; Williams et al., 1998; Williams, McGregor, King, Nelson, & Glasgow, 2005; Williams, McGregor, Zeldman, Freedman, & Deci, 2004; Williams et al., 2009). Behaviors associated with extrinsic motivation are less likely to lead to sustained behavior change (Ryan et al., 2008). Environmental resources are important sources of motivation (Golay, Lagger, & Giordan, 2007). Social support is one environmental resource that has been identified as a key element influencing patients’ adherence to medical treatments (DiMatteo, 2004) and effective diabetes self-management (Jacob & Serrano-Gil, 2010; van Dam et al., 2005). Others conclude if the changes made during a diabetes educational program are to be maintained, then ongoing support is a necessary part of diabetes self-management (Funnell, 2010). Williams et al. (2009) found that persons with diabetes whose autonomy and competence was supported by health professionals reported improved quality of life and were more likely to adhere to their medications. However, access to specialist diabetes services where professional advice can be sought is not always available (Funnell & Siminerio, 2004; Tibbetts, 2006). Likewise, Casey et al. (2011) and Lawton et al. (2012) reported that participants with T1D often struggled to access responsive support from health professionals.
The Dose Adjustment for Normal Eating (DAFNE) program, which originated in Germany, has been introduced to equip people with T1D, with the knowledge and skills necessary to effectively self-manage their condition and to address the delicate balance between achieving good glycemic control to avoid long-term diabetes complications without increasing the incidence of hypoglycemia (Bott, Bott, Berger, & Mühlhauser, 1997; Sämann, Mühlhauser, Bender, Kloos, Müller, 2005; DAFNE Study Group, 2002; Dinneen et al., 2013). This structured education program is underpinned by empowerment and self-efficacy and the aim is to promote effective self-management skills, via goal setting and problem-based learning (McIntyre, 2006). DAFNE is delivered over 5 consecutive days by a multidisciplinary team (Oliver & Thompson, 2009). The curriculum focuses on how to live well with diabetes and emphasizes blood glucose testing, carbohydrate counting, and matching quick-acting insulin to food. The final session of the DAFNE curriculum takes place approximately 6 weeks after the 5-day course, where participants meet to review progress and goals. DAFNE first started in Ireland in 2003 and there are only six DAFNE centers, so not all people with T1D in Ireland are offered the program.
Studies evaluating structured education programs in diabetes have predominantly been quantitative, where the focus is on knowledge garnered by logical deduction and objective clinical measurements ignoring participants’ accounts of the self-management process, for example, why self-management does or does not work. No studies could be identified that employed a mixed methods design. These studies reveal that such programs have resulted in improvements in glycemic control in terms of HbA1c levels (Bott, Bott, Hemmann, & Berger, 2000; DAFNE Study Group 2002; Everett, Jenkins, Kerr, & Cavan, 2003; McIntyre, 2006; Mühlhauser et al., 1983; Norris, Engelgau, & Narayan, 2001; Oswald, Kinch, & Ruddy, 2004; Trento et al., 2002; van Dulmen et al., 2007); however, these improvements appear to diminish over time (Bott et al., 1997; Cooper, Booth, & Gill, 2003; Plank et al., 2004; Speight et al., 2010) and in some instances this occurs within 6 months of completing the programs (Piatt et al., 2010). The precise cause of this decline in HbA1c levels is not yet fully understood.
Aims and Methods
The aim of this mixed methods concurrent triangulation study is to explain the factors that affect glycemic control, measured by HbA1c, following the DAFNE program. The purpose of using a concurrent mixed methods triangulation approach was to provide a complete picture of the factors that affected HbA1c control and to more fully explain and understand the circumstances under which participants sought to control their HbA1c.
In 2007, a large 5-year multicentered randomized controlled trial (RCT) was initiated to introduce and evaluate the effectiveness of two different methods of follow-up/support after participants completed DAFNE training on the island of Ireland (Dinneen et al., 2013). Ethical approval for the study was obtained from the National University of Ireland Galway Research Ethics Committee (Ref: 06/MAY/04) and relevant local hospital Research Ethics Committees. Written consent was obtained from all participants and confidentiality was ensured by the removal of all identifying material.
Participants
Inclusion criteria for the larger DAFNE RCT included a diagnosis of T1D for at least 12 months, be able to read and speak English, be willing to engage in regular blood glucose self-monitoring, and have a glycated hemoglobin (HbA1c) level less than 119 mmol/mol (13%) at recruitment. Participants were excluded if they had advanced diabetes complications, were pregnant or planning pregnancy within 2 years, were currently using an insulin pump to manage their diabetes, or had significant comorbidities likely to negatively affect their ability to participate in the study.
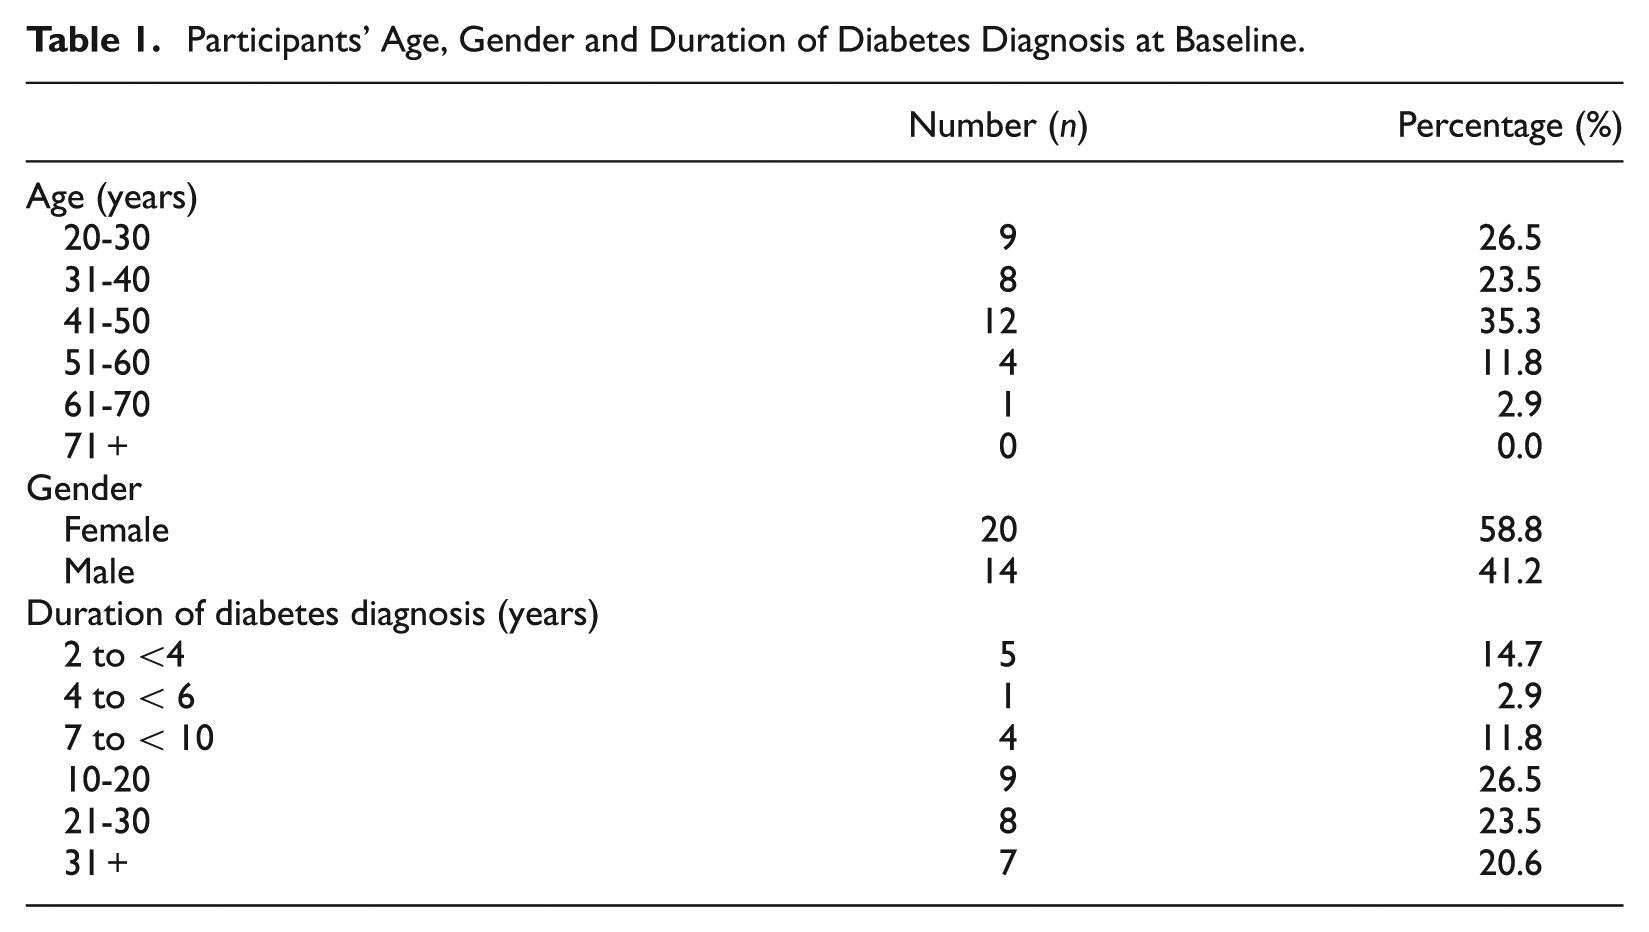
Initially, a list of all participants from five DAFNE centers across the island of Ireland who met the inclusion criteria were obtained (n = 437). Using maximum variation to ensure a diversity of perspectives, a purposive sample of 40 participants, approximately 10% of the total sample, were invited to participate in the mixed methods study. Qualitative and quantitative data were collected from participants at three different time periods in the form of semistructured interviews and various quantitative measurements. Quantitative data were collected at baseline, and at 6 and 12 months post DAFNE, and qualitative data were collected at 6 weeks, and at 6 and 12 months post DAFNE. Six participants were lost to follow-up (reasons outlined below). Therefore, the total number of participants included in this mixed methods study was 34. Participant age, length of time since diagnosis, and gender are provided in Table 1.
Participants’ Age, Gender and Duration of Diabetes Diagnosis at Baseline.
The qualitative semistructured interviews were conducted by two researchers using an interview guide over a 36-month period from 2006 to 2009. First round interviews (at 6 weeks post DAFNE) explored initial experiences of participating in DAFNE. The interview guide included questions, such as “Can you tell me about your experiences of participating in the DAFNE program? Since participating in DAFNE can you tell me about any factors that have helped you in self-managing your diabetes? Can you tell me about any factors that have hindered you in self-managing your diabetes? Second and third round interviews (at 6 and 12 months post DAFNE) focused more on how participants were using the DAFNE principles over time. The interview guide at this stage included questions such as “Since we last met can you tell me how you have been managing your diabetes?; What changes to the management of your diabetes, if any, have you made as a result of participating in DAFNE ?; What has helped you stay motivated to adhere to the program. Concurrent with the collection of the qualitative data, quantitative data on participants’ anxiety and depression were collected using the Hospital Anxiety and Depression Scale ([HADS]; Bjelland, Dahl, Haug, & Neckelmann, 2002; Zigmond & Snaith, 1983), quality of life using the Diabetes-Specific Quality of Life Scale (DSQOLS; Bott et al., 1998; Cooke et al., 2013), their diabetes-related distress using the Problem Areas in Diabetes (PAID) questionnaire (Polonsky et al., 1995; Welch, Jacobson, & Polonsky, 1997) and clinical data on HbA1c were also collected. The HbA1c levels were measured centrally using a DCCT-aligned HPLC assay (ADAMS-A1c HA-8160). Unfortunately, quantitative measurements were not available at all three time points for five participants, and one participant commenced an insulin pump and was therefore no longer eligible to participate in the study. Therefore, the total number of participants included in the mixed methods study was 34. Both data sets were initially analyzed separately and then merged.
Data Analysis
The qualitative longitudinal analysis was guided by the work of Holland, Thomson, and Henderson (2006), Saldana (2003), and Lewis (2007). Initially, a within-time analysis was completed. This involved analyzing each data set at 6 weeks, 6 months, and 12 months. All data were open coded using thematic analysis and then axial coding was used to identify categories (Strauss & Corbin, 2003). The next stage was a cross-sectional analysis of the data investigating changes between the different time points for individual participants. The final stage involved a thematic analysis investigating the changes over time. NVivo (Version 8), a qualitative software indexing package was used to support the analysis in terms of managing and organizing the data, managing ideas, querying data, graphically modeling ideas and concepts, and reporting the data (Bazeley, 2007).
Maintaining Rigor
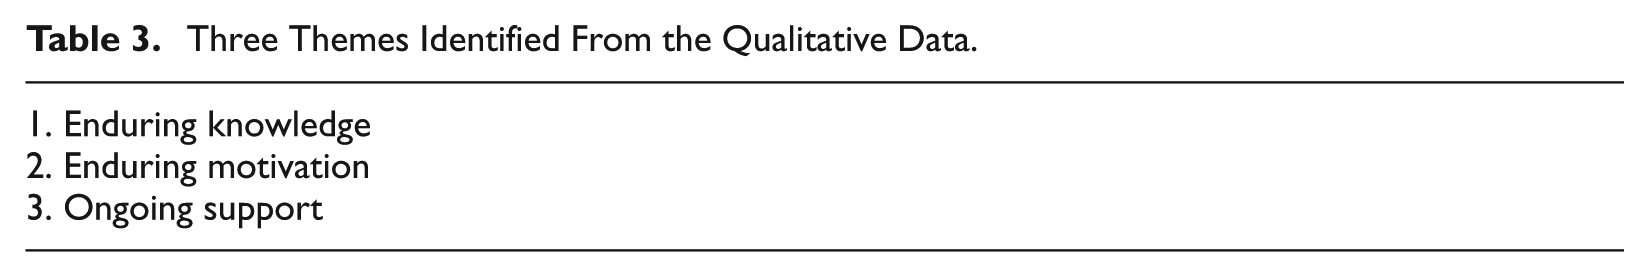
Four criteria—credibility, auditability, confirmability, and applicability—were used to ensure the rigor of the qualitative data. A sample of transcripts was analyzed independently by the two researchers who collected the data and codes; categories and themes were then compared and agreed. Participants were also sent a copy of their transcripts and asked to confirm accuracy of same. Peer debriefing was also undertaken whereby feedback about data quality and interpretative issues from medical and nursing experts in the field of diabetes was obtained by presenting and defending the study at a research conference, all confirmed the robustness of the data analysis process and also commented that the findings were consistent with their experiences. Three relevant themes were identified from the qualitative longitudinal analysis; enduring knowledge, enduring motivation, and ongoing support.
In terms of quantitative data analysis, a linear mixed model was used to identify predictors of improvement in quality of life (PAID and DSQOLS). Missing data were dealt with by multiple imputations using a bootstrap based method (Welch et al., 1997), where each missing value was replaced by five imputed values. Continuous responses were transformed for normality as necessary. The details regarding the data analysis and findings specific to these psychological variables are reported elsewhere (Byrne et al., 2012; Dinneen et al., 2013). The focus of this article is on the clinical outcome of the DAFNE program, namely glycemia control (assessed by HbA1c levels). Quantitative data from participants involved in the RCT (n = 437) comparing two different methods of follow, namely structured (curriculum-based) group follow-up (intervention arm centers) and a return to traditional one-to-one clinics follow-up (control arm centers) following DAFNE training, including HbA1c were collected at baseline, 6 months, and 12 months post DAFNE. These data were then inputted into a quantitative database and analyzed. No significant difference in HbA1c was observed between the intervention or control arm centers and no difference was observed over time (Dinneen et al., 2013). However, individuals with a baseline HbA1c >7.5% (59 mmol/mol) showed a statistically significant decrease in HbA1c over time (mean difference −0.16%, 95% confidence interval = [−0.27, −0.06]; p < .001). Individuals with a baseline HbA1c less than or equal to 7.5% (59 mmol/mol) showed a statistically significant increase in HbA1c over time (mean difference 0.61%, 95% confidence interval = [0.48, 0.74]; p < .001).
Integration/Merging of the Data
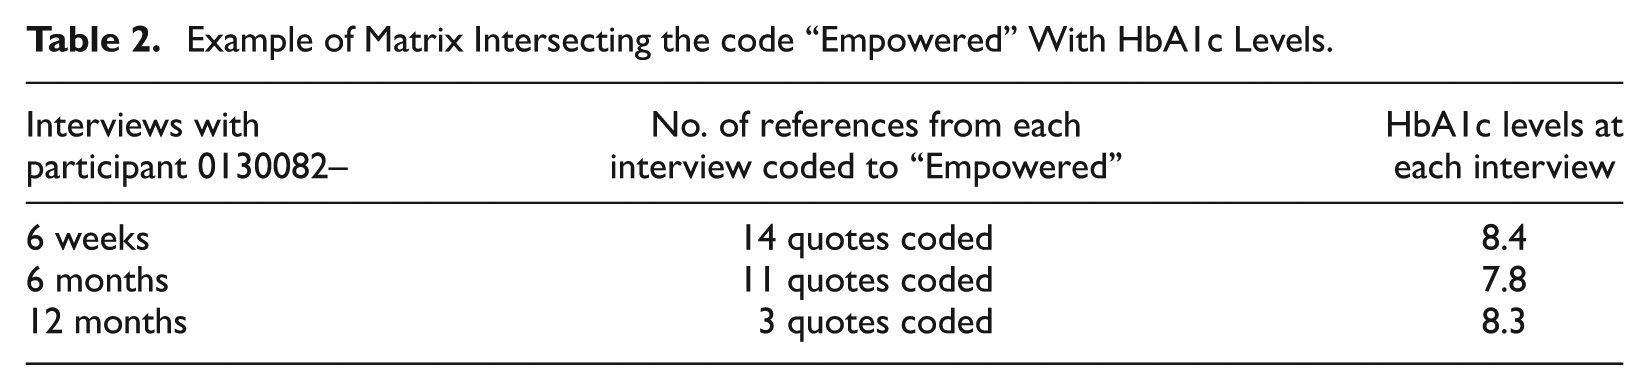
Both qualitative and quantitative data sets were then merged into a single database for the subgroup of participants who were enrolled in the quantitative and qualitative aspects of the study (n = 34) to offer a more holistic and integrated view of their diabetes experience and self-management. This new integrated database enabled the research team to filter previously created thematic codes against the clinical (and other quantitative) data in a single database environment using queries. For example, content coded against the node “Empowerment” contained qualitative comments from participants who cited being empowered. Running a matrix coding query against these codes cross-referencing the recorded results of HbA1c offered two discrete views of the data that could be described as form and content. The “form” view offers a tabular and more strategic view of the coding patterns to show the extent to which participants who felt empowered were gaining glycemia control or not (lowering their HbA1c levels, Table 2). This view also shows how many quotes (in each cell in column 1) were coded to empowerment from each of the three interviews and the background HbA1c levels (at that time shown in the same row). This query allowed us to correlate improvements/disimprovments in HbA1c levels and what participants were saying/feeling at the time based on their qualitative coding. The “content” view, allowed the researchers to drill down and see qualitative comments contained in any cell in the table to gain a deeper understanding of possible reasons behind these patterns and relationships between feeling empowered and having improved glycemia control (lower or higher HbA1c levels; Figure 1).
Example of Matrix Intersecting the code “Empowered” With HbA1c Levels.
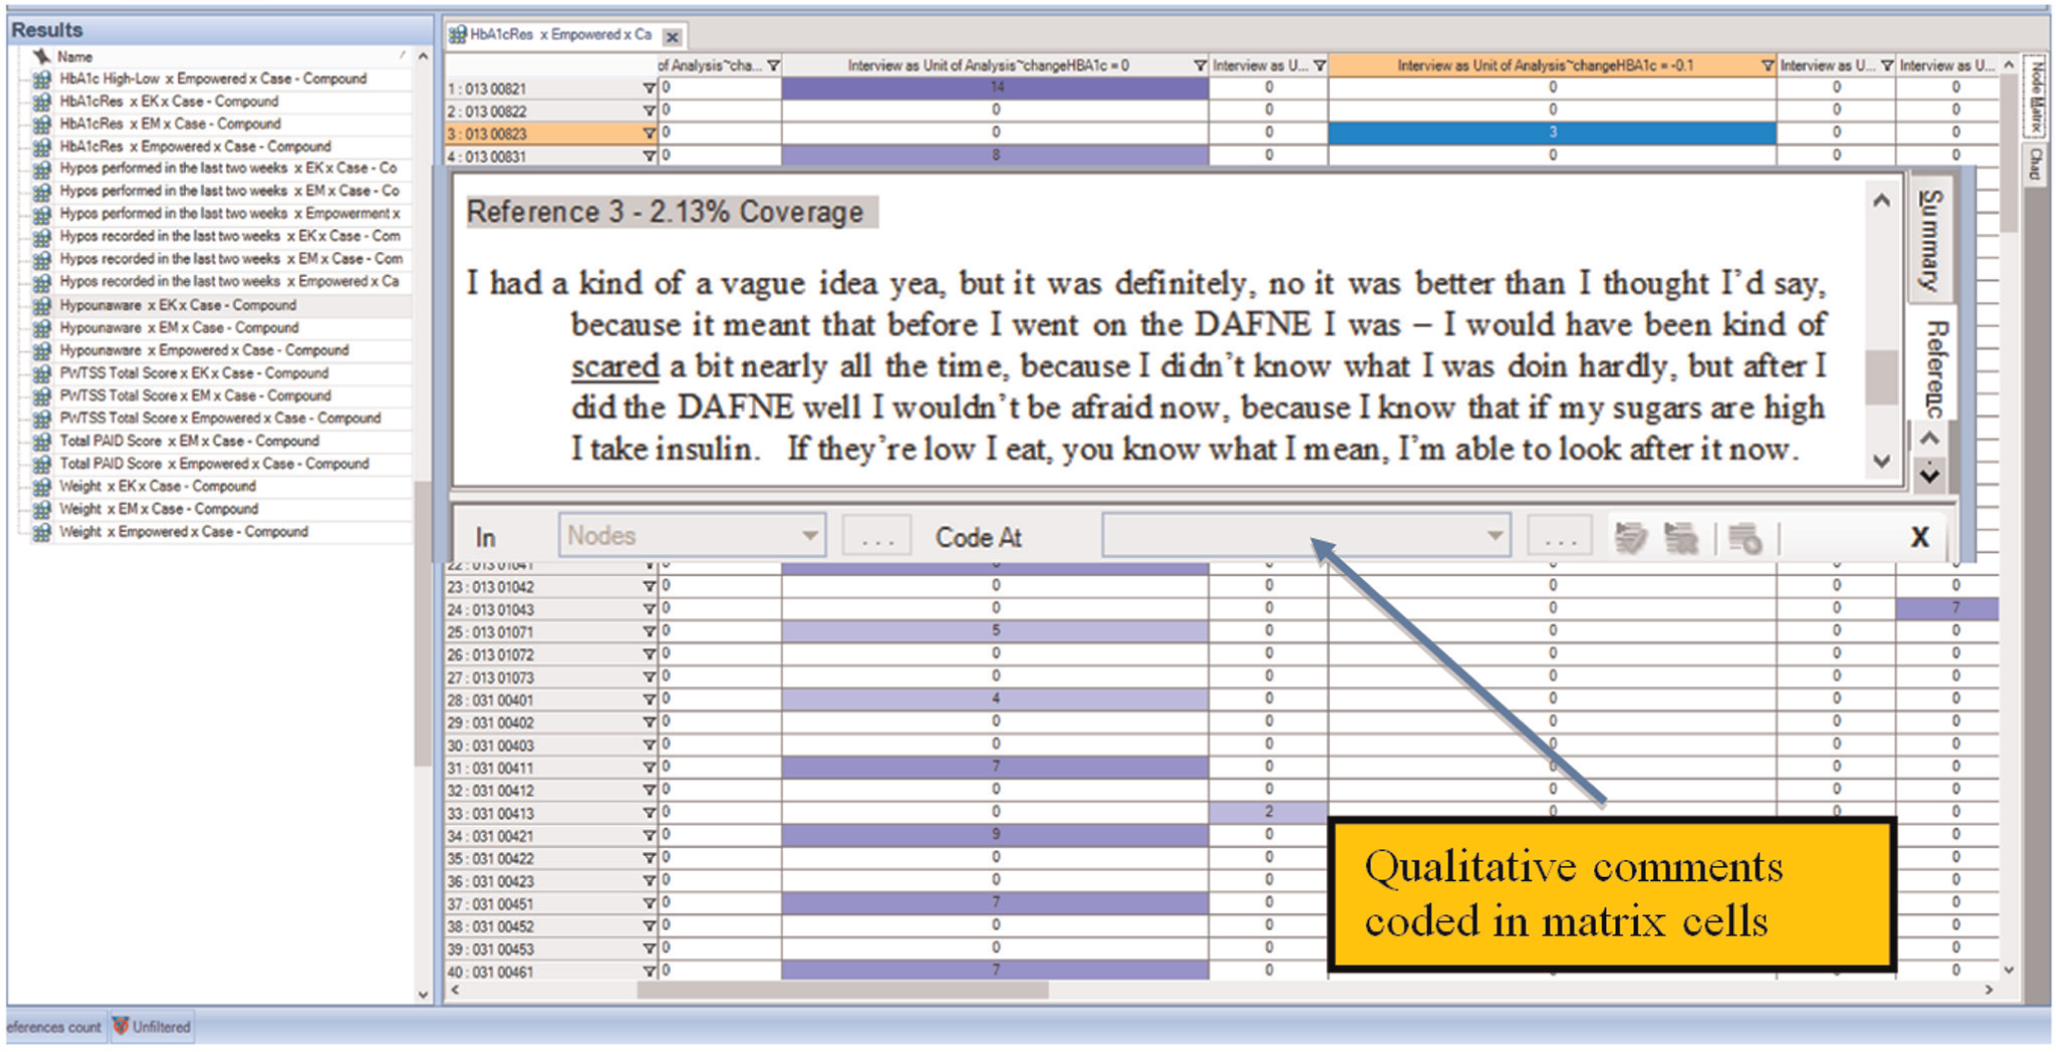
Example of drilling down on qualitative data for deeper insights to explain patterns.
Being able to view the qualitative data, correlated with the quantitative data, assisted researchers in classifying participants into three categories; out-of-control (participants whose HbA1c remained >8%/64 mmol/mol); out-of-control but getting into relative control (participants whose HbA1c at commencement was >8%/64 mmol/mol but came down to less than or equal to 7.9%/63 mmol/mol) and in relative control and remained there (participants whose HbA1c remained at less than or equal to 7.5%/58 mmol/mol).
Separately, each data set provided an answer to a piece of the puzzle, the qualitative data informed us as to the factors that influenced overall self-management while the HbA1c results told us whether participants were or were not attaining an optimal HbA1c or in clinical terms whether they were actually in control or not. It was only by using a concurrent mixed methods approach that involved merging and integrating the findings from each data set, linking the quantitative and qualitative data for each participant, that allowed the exploration of attitudes, beliefs, and behaviors across and between these groups leading to explanatory accounts of human responses to support the numeric quantitative data so that a clearer picture emerged. This unique picture provides a more comprehensive understanding of glycemic control (HbA1c levels) and illustrates more clearly why some participants were better able to attain control while others were either maintained or worsened their control.
Findings
The merged and integrated data for participants (n = 34) was reanalyzed and interrogated in relation to HbA1c levels using a framework composed of the three qualitative themes; “enduring knowledge,” “enduring motivation,” and “ongoing support” (Table 3). The findings from this integration will be presented under the three categories of participants, mentioned earlier, and within these categories the three qualitative themes will be used to add structure to the findings.
Three Themes Identified From the Qualitative Data.
Out-of-Control (HbA1c >8.0%/64 mmol/mol)
Of the 34 participants included in the mixed method study, 17 had a HbA1c level greater than 8.0% (64 mmol/mol) at baseline and at 12 months. Of these participants, 10 reduced their HbA1c levels over the duration of the study, 5 had their HbA1c levels increase, and 2 reported no change. At 12 months, 5 participants recorded an HbA1c levels greater than 10% (86 mmol/mol), 2 were between 9.0% and 9.9% (75-85 mmol/mol), and 10 were between 8.0% and 8.9% (64-74 mmol/mol; Figure 2).
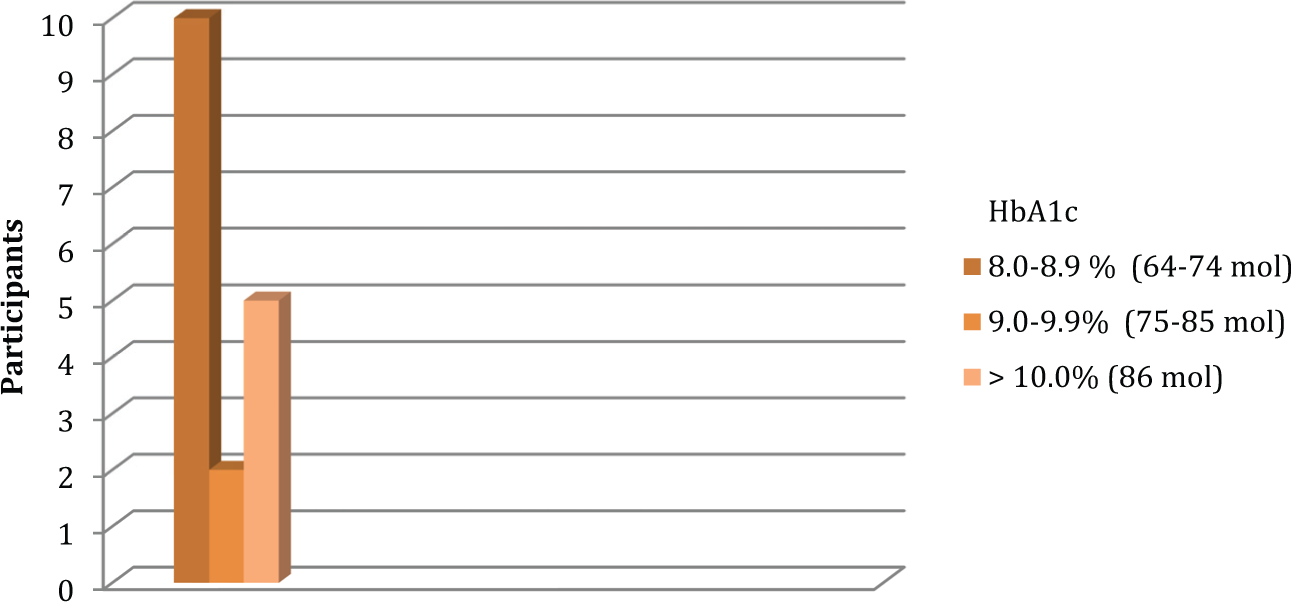
Number of participants with HbA1c greater than 8% (64 mmol/mol) at 12 months.
Enduring Knowledge
The integrated data were analyzed to see if there was any explanation related to knowledge as to why participants HbA1c level remained higher than 8.0% (64 mmol/mol). It was evident from the data that participants perceived that they had the knowledge required to manage their blood glucose levels. They reported that their knowledge of carbohydrates portions (CP) and insulin requirements were at a level where they knew what to do to manage blood glucose levels. One participant with HbA1c level of 11.8% (106 mmol/mol) at baseline that reduced to 10.9% (96 mmol/mol) at 12 months stated that the most useful part of DAFNE was
the understanding of blood sugars, knowing why they have gone up and the CP counts. (P-050)
This participant acknowledged however that it was his lifestyle rather than knowledge that contributed to his erratic HbA1c levels:
Like I was out every weekend and I know, I know it sounds silly but I was out every weekend and I might eat 2 meals today and I might eat one meal tomorrow, I might just take only one insulin. Like I might forget to take one or I’d be out messing and just go home and forget to take insulin . . . I was sort of just enjoying life. (P-050)
Another participant with an HbA1c of 10.3% (89 mmol/mol) at baseline rising to 10.7% (93 mmol/mol) at 12 months described how she had developed celiac disease. She stated that her knowledge after DAFNE was good:
I was getting’ more confident with the DAFNE, I knew how to adjust the things, and I tend to remember the results from the day before or two days before and if I felt they were high you know I would have known how to readjust the Lantus you know. (P-048)
However, she had to develop new knowledge about CP related to gluten-free foods because of developing this new condition. She reported that:
The diet has changed and you are cutting out pasta, lucozade and its taken me quite a while . . . its just the way it is with gluten free products and that disappoints me . . . with DAFNE because I was just trying (starting) to try new foods. (P-048)
She also felt that all her vigilance and knowledge were to no avail, as she found at times that DAFNE principles just did not work for her and she found the variability in blood glucose levels, despite eating the same foods and injecting the same amounts of insulin, very frustrating:
No matter how much I follow all the . . . points of DAFNE it still didn’t help, but it was just that I was at a loss, you know, my blood sugars were still very high readings, you know, and there was no answer for the high readings, you know. It wasn’t like I hadn’t taken enough insulin, or I was eating anything more sugary, you know, or the portions weren’t being counted right, and I suppose that’s why I felt at a loss. So I suppose I found it frustrating. (P-048)
This frustration was also evident for another participant whose HbA1c at baseline was 8.3% (67 mmol/mol) but rose to 8.6% (70 mmol/mol) at 12 months:
I couldn’t keep them balanced (blood sugar levels). You know they were . . . they were . . . I was going high, I was going high when . . . and I was convinced I was doing things right, you know I was looking after . . . I was weighing my . . . I was doing my food, I was reading the CPs on the back of it. In my own head I was doing everything right. (P-064)
It was the lack of explanation for the variance in HbA1c levels that these participants found most difficult. They believed they had the knowledge to manage their blood glucose levels and were doing what they should, but their HbA1c levels remained high and for both of these participants their HbA1c levels increased over the duration of the study.
Enduring Motivation
The integrated data were next reanalyzed in relation to motivation to identify any explanation for the continued high levels of HbA1c. This revealed that issues related to testing, fear of hypoglycemia, and setting targets were factors that influenced HbA1c.
Some participants found the constant monitoring of blood glucose levels difficult and intrusive. One participant described how demotivated and fed up she became with all the testing,
I said to them I have had enough of all the (testing) I was doing all my testing but not writing it down. I just felt it was non stop. (P-048)
Another participant who had an HbA1c at baseline of 9% (75 mmol/mol) that did not change over the course of study also found the counting and monitoring too much:
The constant monitoring, and watching, and counting has taken over. My life is not as free as it used to be in so far as you took 4 injections a day, and you just went about your business. But now every morsel of food over 10 grams of carbohydrate requires an injection. (P-035)
Fear of hypoglycemia was also a concern for some participants in the out-of-control group, particularly if they had taken alcohol. One participant who commenced the study with a HbA1c of 11.4% (101 mmol/mol) at baseline improved to 10.8% (95 mmol/mol) at 12 months, described how he would deliberately keep his blood glucose high after a nights drinking in order to avoid hypoglycemia:
In general Saturday night would be the only night I would go a bit over the normal, as they say. I’d inject a certain amount but there is no way I’d try to get it 100%. I’d be afraid I might go (hypoglycaemic). I would rather get up on Sunday morning with a big high and bring it back down to normal and its not a problem after that. (P-040)
It was also evident that while participants in this category were motivated to maintain good glycemic control for fear of developing complications, there was little evidence that they set individualized glycemic targets. Some of these participants seemed satisfied as long as their HbA1c levels were reducing, even when the overall level was unacceptably high. One participant whose HbA1c never fell below 10.9% (96 mmol/mol) described his perception of his glycemic control:
its going very good now . . . I am not getting as much high sugars as I was getting . . . they are coming down to 8 or 9. (P-050)
When the data between groups was compared, there appeared to be a difference between participants’ perceptions of acceptable HbA1c targets across groups. In contrast to the out-of-control participants, the in-control or getting-into-control participants usually set HbA1c targets below 7.9% (63 mmol/mol).
Ongoing Support
Support of health care professionals (HCPs), support from family, and support from the DAFNE patient group were all explored to identify any explanation for continued high levels of HbA1c.
Participants described how their relationships had changed with HCPs over the DAFNE program and follow-up. Most participants described the relationships they developed with the DAFNE HCP as collaborative, helpful, and supportive. The data of the five participants who had an HbA1c of greater than 8.0% (64 mmol/mol) at baseline and whose HbA1c at 12 months had increased, were analyzed with a particular focus on their perceptions of support. This revealed that many of these participants found controlling their blood sugar levels difficult, most had other health problems and often sought help from the diabetes nurse specialist. In addition, most reported that support was available and that HCP worked collaboratively with them to try and resolve problems. A participant with a baseline HbA1c of 10.3% (89 mmol/mol) and a HbA1c 10.7% (93 mmol/mol) at 12 months who was struggling with health problems and wide variations in blood glucose levels described her support as responsive and supportive:
Like having the diabetic nurse (name) and being able to ring her, you know when there are problems, I think to me that is a great help. (P-048)
A few participants however found it difficult to access support from HCP. These participants were frustrated by not being able to get direct expert help when they needed it to discuss unexplained highs and to get advice about what should be done. One participant who had an HbA1c at baseline of 8.4% (68 mmol/mol), 9.3% at 6 months (78 mmol/mol), and 8.2% (66 mmol/mol) at 12 months described his struggle to get help:
I had a few major problems there come February and March. I was always getting a very high result in the morning, and I was able to communicate with the hospital’s diabetic nurses there on two occasions, and they got me to do a 3.a.m blood test to see how things were going during the night, and then eventually all communication seemed to stop with emails, and there was no reply to my telephone calls. So eventually I just became proactive, and I came off the DAFNE system, and I went back on to my old system, which solved the problem for me. (P-104)
However, data comparison across groups revealed that there were no substantial differences in perceived levels of support as described by participants in the out-of-control category and the other two categories. For these out-of-control participants, there was also nothing different in their stories of family or group support that would help explain the differences in HbA1c levels. However for this out-of-control group, a lack of support compounded by a lack of motivation may be a factor in a person renouncing the DAFNE principles they acquired during the 5-day course.
Out-of-Control But Getting Into-Control (Hba1c >8%/64 mmol/mol But Reduced to ≤7.9%/63 mmol/mol)
Out of the 34 participants included in the mixed method study, 6 started with an HbA1c levels greater than 8% (64 mmol/mol) and finished the study with levels between 7.3% and 7.9% (56-63 mmol/mol). Of these, four started the study with a baseline of between 8% and 8.9% (64-74 mmol/mol), and two had a HbA1c of greater than 9% (75 mmol/mol; see Figure 3).
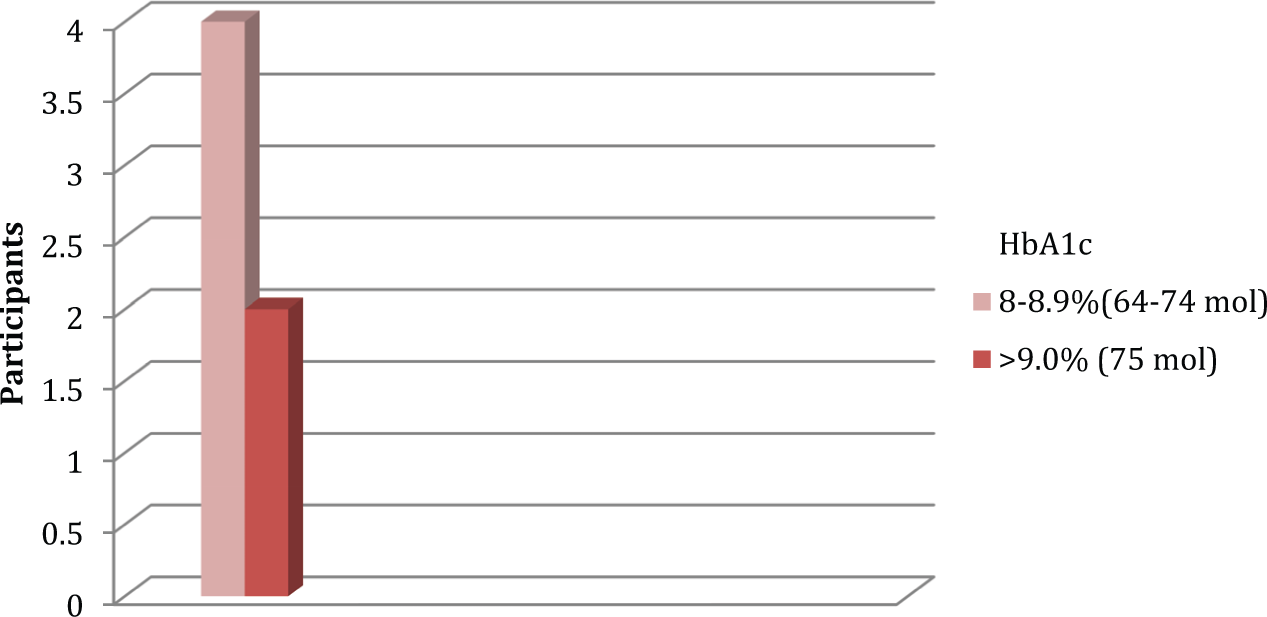
Baseline HbA1c of participants who reduced HbA1c to <8% (64 mmol/mol) at 12 months.
Enduring Knowledge
It was evident from the data that the participants in this category had the knowledge they required to manage their blood glucose levels. They felt they had learnt a lot from the DAFNE program and felt confident that they knew how to manage and adjust their insulin. One participant who had an HbA1c at baseline of 9% (75 mmol/mol) and 7.3% (56 mmol/mol) at 12 months explained that the DAFNE program had given him new knowledge:
Before DAFNE I would not know how much insulin to take to bring me down so I would take a guess and sometime that guess would bring me to a hypo . . . now I’m more aware of hypo’s, more aware of what food I am eating and what I need to do to counteract the CPs. (P-046)
It was clear also that at times he felt he was struggling to attain glycemic control and that lifestyle factors were affecting his control. Despite this, however, he managed to keep focused and get to control:
My wife had a baby so . . . everything was harder to control through that period, and I had . . . ah . . . the blood sugar test HbA1c test after that, you know coming into probably 2, 3 months after that, and I would put it down to that really . . . what I’m saying is if my wife wasn’t having the baby it would have been a lot easier do you know . . . My mind was in another place. (P-046)
Knowledge levels therefore did not appear to differ to those in the out-of-control category; however, differences were evident when motivation was explored.
Enduring Motivation
The integrated data were next analyzed in relation to motivation to identify any explanation for reduced levels of HbA1c. Motivational issues identified that appeared to influence HbA1c levels related to blood glucose level targets, tenacity, and vigilance.
Participants in this category set blood glucose targets below 8% (64 mmol/mol) and worked to reach these. One participant who had a HbA1c at baseline of 8.2% (66 mmol/mol), 7.6% (60 mmol/mol) at 6 months, and 7.3% (56 mmol/mol) at 12 months described how he was focusing on getting his HbA1c down because it was
running higher than I would like it to. (P-079)
Likewise, another participant with a HbA1c of 8.0% (64 mmol/mol) at baseline and 7.6% (60 mmol/mol) at 12 months reported how he was striving to reduce his HbA1c levels:
I am hoping my HbA1c will be down . . . it was always around 7.5 or 8.0 but obviously I want it to be in the 7s. (P-054)
In contrast to the out-of-control group participants suggested that while testing took more time if you were benefiting the extra time was not a factor. These participants described testing as a way of identifying patterns and that this information was essential for good control. One participant described how he had tested very frequently in the beginning to see patterns but as time went on he was able to reduce testing overall:
I do yea (test,) maybe not as much as I started with, but I still record. The way I do it is, if my reading start to run off, then I will really start recording do you know and get them back. (P-046)
This participant therefore remained vigilant and when his blood glucose readings start to rise, he tested and recorded more frequently until his bloods glucose levels were under control again.
Ongoing Support
Participants’ accounts of support in this category were comparable with those articulated in the out-of-control category. Some participants described support from HCP as responsive and helpful, while others described support as difficult to access when needed. These accounts therefore mirrored the experiences of the out-of-control participants and the in-control participants as described below.
In-Control and Remained In-Control (HbA1c Remained ≤7.5%/58 mmol/mol)
There were five participants who had an HbA1c level less than 7.5% (58 mmol/mol) at baseline and 12 months. Of these, three had an HbA1c of between 6% and 6.9% (42-52 mmol/mol), one between 7% and 7.4% (53-57 mmol/mol), and one between 5% and 5.9% (31-41 mmol/mol; please see Figure 4).
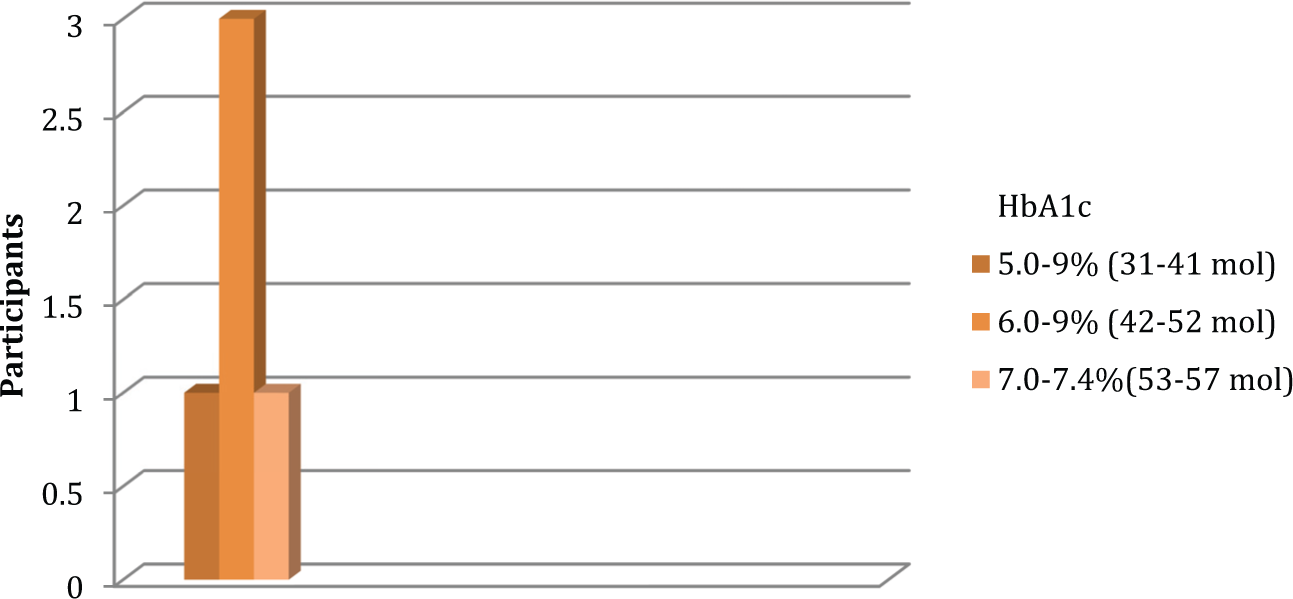
Numbers of participants whose HbA1c remained ≤7.5% (58 mmol/mol) at 12 months.
Enduring Knowledge
Participants in this category also reported that DAFNE had provided them with the knowledge they needed to manage their blood glucose levels. A participant who had an HbA1c of 6.9% (52 mmol/mol) at baseline, rising to 7.4% (57 mmol/mol) at 12 months described what she had learnt,
I think it’s the two nuggets knowing that 1 CP is going to raise your blood sugar by, 2-3, or that 1 unit of insulin for me will drop me by 2—to have that in the background all the time. I think, you know, you just relate to that when you’re out, and you kind of think—well I wasn’t sure about that sauce at dinner, so I know why I’m out. Because before—before DAFNE if your blood sugar was high you never knew why. (P-100)
Participant knowledge appeared to be comparable with the other two categories. Hence, it is unlikely that knowledge levels provide an explanation for differing HbA1c levels between categories.
Enduring Motivation
Motivational issues related to blood glucose target levels and the avoidance of complications were identified as important to participants within this category.
Participants who were in-control often set blood glucose targets below 7% (53 mmol/mol) and who worked to reach these were often very frustrated if they did not achieve their targets. One participant who had an HbA1c of 6.4% (46 mmol/mol) at baseline, 7.6% (60 mmol/mol) at 6 months, and 7.4% (57 mmol/mol) at 12 months described how dissatisfied she was when her blood glucose levels rose,
I had it tested 3 months ago, and it was 8.1, and prior to that it was 7.2, so I wasn’t happy with the 8.1. I changed my insulin to[ a different analogue} Apidra and it’s 6.8 now so I’m a lot happier with that. (P-100)
This participant had set herself a target of 6.5% (48 mmol/mol) and was very unhappy and demotivated when this was not reached,
I hate having a target that I can’t meet, and I just find it really frustrating . . . it affects your motivation then for the rest of the day . . . you go ah sure what’s the point . . . it’s the same thing as having a target and hoping to get to 6.5 and not being able to make it. (P-100)
Another participant explained,
As long as you strive to have your HbA1c between 6.0 and 7.0, then everything is going to be fairly decent. (P-073)
It was evident that these participants were very motivated to reach their targets and worked tenaciously to do this. For these participants preventing complications was also a large motivating factor:
Well, I suppose it’s the talk of complications of diabetes. And my biggest fear is losing my sight. You know people talk about toes and stuff. I think, should it happen, I could very well feel differently, but here I feel I could live without my toes, but I certainly couldn’t manage without my sight. And that alone for me is motivation to keep my blood sugar under control. (P-100)
Another participant who had a HbA1c of 6% (42 mmol/mol) at baseline and 6.2% (44 mmol/mol) at 12 months likewise reported,
You do not like your blood sugars too high, you know the problems it can cause and it’s not ideal you know. (P-073)
While another with a HbA1c of 6.2% (44 mmol/mol) at baseline and 6.5% (48 mmol/mol) at 12 months explained that her HbA1c:
was always below 7.0 (before DAFNE), because I was so regimented what I was doing I never deviated, ever, from what I was told, because I was too afraid of the risks, or what might happen if I got high blood sugars. (P-044)
Tight control was therefore important to avoiding complications and a real motivating factor for participants in the in-control category.
Ongoing Support
Participants in this category expressed more concern when their blood glucose levels were not meeting their individual targets. When they failed to meet their target they often sought help from a HCP but as with the other groups they were not always successful in obtaining it:
If I could spoken to somebody, because I think some times in your head that you know what the right thing to do is, but you need somebody else, mm . . . you know, be it a professional or whatever else to say “yes you’re right” . . . you know when you’re wary of the impact that it’s going to have . . . somebody else who knows to say “yes this is the right thing to do” or “maybe you should try this first.” I suppose its just the lack of confidence to do it by yourself in isolation without help—just touching base with somebody who knows. (P-100)
However, in contrast to participant (P-104) in the out-of-control group mentioned earlier, this participant stayed with DAFNE and worked the problems out herself:
No. I did try and phone here, and I couldn’t get through to anybody and I left a message, and they were supposed to phone back, and I never got a call back. So I suppose I felt quite alone in that then, and I suppose I just said I’m going to re-adjust my ratios and stuff myself. (P-100)
Overall, across the three categories there appeared to be little differences in knowledge or support. The differences that did emerge were mainly related to motivation, and in particular HbA1c targets and expectations of control, differences in how testing was perceived, and differences in how concerned participants were in relation to developing complications.
Discussion
It was evident from the findings of this study that setting appropriate targets and goals and overall motivation were important factors in explaining glycemic control behaviors of participants. Knowledge, while it was reported in the qualitative data to be valued and important to all participants, did not appear to be a determining factor in getting HbA1c levels into-control when the qualitative and quantitative data sets were analyzed concurrently. This finding is not surprising, however, given that researchers have consistently found that knowledge while a prerequisite of behavior change, does not in itself change behavior (Brooker et al., 2008; Enwistle et al., 2008; Osborn et al., 2010; Zhong et al., 2011).
Persons with diabetes, and in particular those engaged in a new method of self-management such as the self-management principles advocated by the DAFNE program, need access to expert advice and support when interpreting and responding to abnormal blood glucose readings so they can handle the problem at the time, feel reassured, and learn about what to do in the future. What is surprising is to find that although the participants in this study valued HCP support, the support provided or the lack of it, did not appear to explain participants’ behavior in relation to getting into control or being out of control; there were participants in all categories who perceived they had access to good or poor support. However, it was also evident that the lack of support may have a differential impact on those in the out-of-control category as it may bring a person, already demotivated, to a tipping point that results in them giving up when they perceive that they could not access support. Other studies highlight professional support as an essential factor that underpins a person’s motivation to self-manage (Enwistle et al., 2008; Murphy et al., 2011; Thorne & Paterson, 2001; Williams et al., 2009;). Therefore, lack of support for the out-of-control person may compound a lack of motivation. It is not known if there was a difference in the intrinsic or extrinsic motivation for the out-of-control and the in-control participants but it may play a role. Extrinsic motivation involves the person engaging in a given behavior because they seek an external reward, such as approval from others (Kasser & Ryan, 1996). Although extrinsic motivation is less likely to lead to sustained changes in behavior (Ryan et al., 2008), it may be that some of the out-of-control participants were more extrinsically motivated and therefore more dependent on HCP support to galvanize their motivation. The function and quality of social relationships is also a key element of social support. DiMatteo (2004), who carried out a meta-analysis of social support and patient adherence to medical treatment, found that social support has a sizeable effect on patient adherence and these effects vary depending on the type of social support. It was also concluded that social support may not always be beneficial and this will depend on a number of factors, including the type and severity of the condition and the complexity of the disease management process. The apparent limited influence, when provided, of HCP support on participants’ ability to attain optimal HbA1c levels in this study might be more fully explained by examining the type, structure, and function of the social relationships between HCP and participants, which was not in the remit of this study to measure. Future research is therefore needed to focus on these issues and to ascertain which type of HCP support works well for individuals with T1D and which approach best suits individual self-management behaviors over the trajectory of their chronic condition.
This current study identified the importance of setting ambitious HbA1c targets and having the motivation to work tenaciously toward achieving these. Motivation has been identified as essential to self-management in many other studies (Shigaki et al., 2010; Williams et al., 1998; Williams et al., 2004; Williams et al., 2005; Williams et al., 2009), but it is the linking of target and goal setting with motivation that is an interesting, if not novel, finding in this current study. Karoly et al. (2005) consider goals to be motivational triggers that enact action and this current study would support this. These findings also suggest that the time spent by HCP working with people to identify and agree appropriate goals for HbA1c levels is important, as participants in this study with T1D who set and worked toward achieving ambitious HbA1c targets were more likely to remain in control.
This current study also found that participants who were out of control were more likely than those who were in control to view testing blood glucose levels as intrusive and difficult. Likewise, Peel et al. (2004) found that participants who had good control of their diabetes were more positive about monitoring and self-testing their blood glucose levels than those who had poorer control. This finding suggests that it may be important for HCP to explore how a person with T1D feels about conducting blood glucose testing as it may indicate their underlying motivation to work to achieve HbA1c targets and may help identify those who need additional support.
Study Limitations
Analysis and merging of qualitative and quantitative data sets are not common techniques and are not reported frequently in the literature. Analytical approaches are therefore less structured and there is little guidance about how merging and interrogation of data should be conducted. It is not known if the approach taken was the best approach and therefore a detailed description of what was done is provided. With mixed method longitudinal research, there is also the challenge of maintaining a sample over time. In this study, six participants were lost to follow-up. This occurred at the 12-month stage and was mainly due to illness, or lack of a HbA1c result. It is not known if these participants’ experiences and results differed from those who were included in the sample. Participant’s knowledge levels were not objectively measured but were based on self-reports and is therefore only based on what they perceived. In addition, although a rigorous process of internal and external peer review of the education sessions were undertaken, it is possible that the teaching approaches used by the five DAFNE centers may have also influenced the education outcomes.
Conclusion
The use of a concurrent mixed method design within NVivo (Version 8) enabled the exploration, interrogation, and merging of the qualitative and quantitative data sets in ways that would not be possible if quantitative or qualitative data sets were analyzed and considered separately. This study provides a description of how these large mixed data sets can be managed and knowledge maximized. It is essential however to have in place the qualitative, quantitative, and technological expertise required to analyze and merge mixed method data sets rigorously.
Footnotes
Declaration of Conflicting Interests
The author(s) declared no potential conflicts of interest with respect to the research, authorship, and/or publication of this article.
Funding
The author(s) disclosed receipt of the following financial support for the research, authorship, and/orpublication of this article: This study was funded by the Health Research Board (HRB) in Ireland, through a Health Services Research and Development award (HS-200525).