
Abstract
Onwuegbuzie and colleagues proposed the Instrument Development and Construct Validation (IDCV) process as a mixed methods framework for creating and validating measures. Examples applying IDCV are lacking. We provide an illustrative case integrating the Rasch model and cognitive interviews applied to the development of the Transformative Experience Questionnaire (TEQ). TEQ measures student engagement with the content they are learning. IDCV process yielded a high degree of utility for informing the psychometric properties of the TEQ. The quantitative data yielded supportive content, construct, and concurrent-related validity evidence using a sample of middle (n = 115) and high school students (n = 81). The qualitative data revealed item rewording was needed. Moderate to strong test–retest reliability was found for both forms.
Keywords
Arguably one of the most recognized and widely applied frameworks in the evaluation of instruments is Messick’s (1989, 1995) theory on validation. While Messick focused on quantitative validity evidence, the Standards for Educational and Psychological Testing (American Educational Research Association, American Psychological Association, & National Council on Measurement in Education [AERA, APA, & NCME], 2014) acknowledges the importance of qualitative evidence for informing the instrument development and validation process. A number of quantitative and qualitative methods have been described and employed throughout the history of instrument development and validation. However, these methods are often used in isolation rather than fully integrated to inform validity evidence for an instrument.
Onwuegbuzie, Bustamante, and Nelson’s (2010) Instrument Development and Construct Validation (IDCV) process addresses this limitation by outlining 10 phases for how to collectively employ quantitative and qualitative methods in instrument construction and validation. Commonly applied mixed methods data integration techniques such as data transformation, consolidation, correlation, and integrated display and reduction (e.g., Caracelli & Greene, 1993; Plano Clark, Garrett, & Leslie-Pelecky, 2010) are adopted in the IDCV. Additionally, the IDCV process integrates the meta-validation model outlined by Onwuegbuzie, Daniel, and Collins (2009) where multiple forms of evidence are collected to inform the three overarching validity types. Furthermore, the IDCV process integrates a framework for debriefing researchers (Onwuegbuzie, Leech, & Whitcome, 2008) whereby an external expert familiar with the area under study interviews researchers to provide an objective evaluation of the accuracy of the decisions made and fidelity of the process.
The 10 IDCV phases include conceptualizing the construct to be measured (Phase 1), describing behaviors representing the latent trait (Phase 2), developing and pilot testing the instrument (Phases 3 and 4), redesigning and field-testing the revised instrument (Phase 5), and validating the instrument applying a quantitative dominant analysis phase and qualitative dominate analysis phase (Phases 6 and 7; Onwuegbuzie et al., 2010). Phases 8 and 9 are similar to Luyt’s (2012) instrument development framework in that the instrument is further validated through a mixed analysis phase using one or a combination of data integration techniques. Again, the qualitative is dominant in the crossover analyses in one phase, while the quantitative is dominant in the crossover analyses in the other phase. Evaluating the construct and measure developed, as well as the fidelity of the process is the final stage (Phase 10).
The IDCV process is described as “an iterative, cyclical process that promotes rigor to the process of instrument development and construct validation” (Onwuegbuzie et al., 2010, p. 67). Furthermore, the stages are not necessarily sequential but rather “blended, allowing for movement among the stages as new findings emerge” (Onwuegbuzie et al., 2010, p. 61). Phase 10 is particularly blended with the other phases in that the researcher engages in ongoing reflection throughout the process for the purpose of considering the “progress related to each phase and to identify and address experienced emotions” (Onwuegbuzie et al., 2010, p. 61). This reflection process seems to call for a degree of reflexivity similar to qualitative research where there is “ongoing questioning of one’s place and power relations within the research process” (Hesse-Biber & Leavy, 2011, p. 13). The notion of debriefing the researcher can occur in Phase 10, but Onwuegbuzie et al. (2010) recommended debriefing throughout all phases.
Although Onwuegbuzie et al. (2010) provided an explicit example of applying the 10 phases to the development of an instrument, since the inception of this framework, additional exemplars are lacking. Such illustrations are essential for demonstrating mixed methods and to promote understanding how such a framework and associated methods can be implemented in a variety of contexts. The purpose of this study was to address this void and illustrate an application of the IDCV process integrating the Rasch model (1960, 1980) and Cognitive Aspects of Survey Methodology (Alwin, 2001; Sudman, Bradburn, & Schwarz, 1996; Willis, 2004).
The Rasch model is increasingly applied in the development of measures in science education (e.g., Sondergeld & Johnson, 2014; Boone & Scantlebury, 2006; Boone, Townsend, & Starver, 2011; Eggert & Bögenholz, 2009). This measurement model is used in the construction of instruments to assess whether the scores fit the set of specifications of the model. The Rasch model is advantageous to classical test theory approaches because scores are converted onto an interval level scale in log odd units called logits (Bond & Fox, 2007). Fit indices are estimated for the items and respondents, which can be used to inform the content-related and construct-related validity evidence by indicating the degree of item, sampling, and structural validity as defined by Collins, Onwuegbuzie, and Sutton (2006). It is beyond the scope of this article to overview the Rasch model and related analyses. We direct the reader to Bond and Fox (2007) for an overview of applying the Rasch model to construct measures.
Cognitive Aspects of Survey Methodology applies the information-processing model (Shiffrin & Schneider, 1977) to conceptualize respondents’ thought processes to identify potential measurement errors. A number of factors such as poor item wording and an inappropriate response scale can cause measurement errors. Cognitive interviewing is a method commonly applied to evaluate the quality of survey questions to minimize these errors from occurring (for a review, see Tourangeau et al., 2000). One type of cognitive interviewing is a concurrent think-aloud task where respondents are asked to talk aloud while they complete a survey. A researcher verbally probes or questions respondents for elaboration on their thoughts during the task. Respondents’ verbalizations are analyzed to determine how closely aligned respondents’ interpretations were with what the item was intended to assess. A variety of methods exist for analyzing the resultant data (e.g., DeMaio & Landreth, 2004; Hughes, 2004; Karabenick et al., 2007). An array of issues with the survey format, item wording, response scale, among other design concerns, might be illuminated during the cognitive interview and analysis of data.
The Rasch model and cognitive interviewing are both commonly applied in the instrument development and validation process across fields. An illustration of how to systematically integrate evidence produced from both methods to inform score validity is lacking. Accordingly, we present an illustration of how the Rasch model and cognitive interviewing were integrated to evaluate score reliability and validity using the case of the Transformative Experience Questionnaire (TEQ; Pugh, Kleshinski, Linnenbrink, & Fox, 2004; Pugh, Linnenbrink-Garcia, Koskey, Stewart, & Manzey, 2010b).
We illustrate using the two methods for the complementarity benefit of “[seeking] elaboration, enhancement, illustration, and clarification of the results from one method with the results from the other method” (Greene, Caracelli, & Graham, 1989, p. 259). Also, for the purpose of informing the instrument fidelity and significance enhancement (Collins et al., 2006) in that the quantitative and qualitative data were inspected “side-by-side” to enhance our interpretation of any items significantly misfitting or scale points not functioning as expected. To this end, the quantitative and qualitative data were weighted equally throughout the process.
In this illustrative case, when the quantitative Rasch analysis results indicated an item did not fit the model, the cognitive interview data provided information as to why the misfit might have occurred and direction on potential revisions. In this sense, the qualitative data were used for “peeling the layers of [the] onion” (Greene et al., 1989, p. 258) to determine what was at the root of the item misfit. Rather than only using the quantitative data to drive items inspection, we also considered which items potentially needed revision based on the qualitative data even if the item fit the Rasch model. To this end, the qualitative and quantitative data were weighted equally in identifying potentially problematic items and making decisions on further item revisions throughout the process.
The Case of Transformative Experience
Researchers have established the fundamental importance of engagement to educational outcomes (Fredricks, Blumenfeld, & Paris, 2004). Pugh (2011) conceptualized transformative experience as engagement extending beyond the classroom into everyday experience. In an effort to evaluate such experience, Pugh and colleagues (Pugh et al., 2004; Pugh et al., 2010b) developed the TEQ. This tool has been noted as a valuable contribution to engagement measures (Green, 2015). However, a published report on the development and score validity of the TEQ is lacking. Furthermore, although the TEQ is intended to be adapted to survey students regarding multiple topics, a report does not exist on the psychometric properties when modifying the items. As such, evaluating the psychometric properties of the TEQ was a secondary purpose of this study. We adapted the TEQ to develop two forms focused on two different science topics (properties of matter and genetics).
Figure 1 outlines the overall process of applying the 10 phases of the IDCV with the TEQ. Phases 1 to 5, including conceptualizing and defining the construct, developing and piloting the instrument, and designing and field testing the revised instruments, were completed for the TEQ over the past 10 years. Accordingly, we summarize past work representing Phases 1 to 5 below, and then fully report on Phases 6 to 10, which involved validating the revised instrument and evaluating the process for this research. Using the IDCV as a guide, and with a need to evaluate the process of TEQ development, three research questions guided this study:
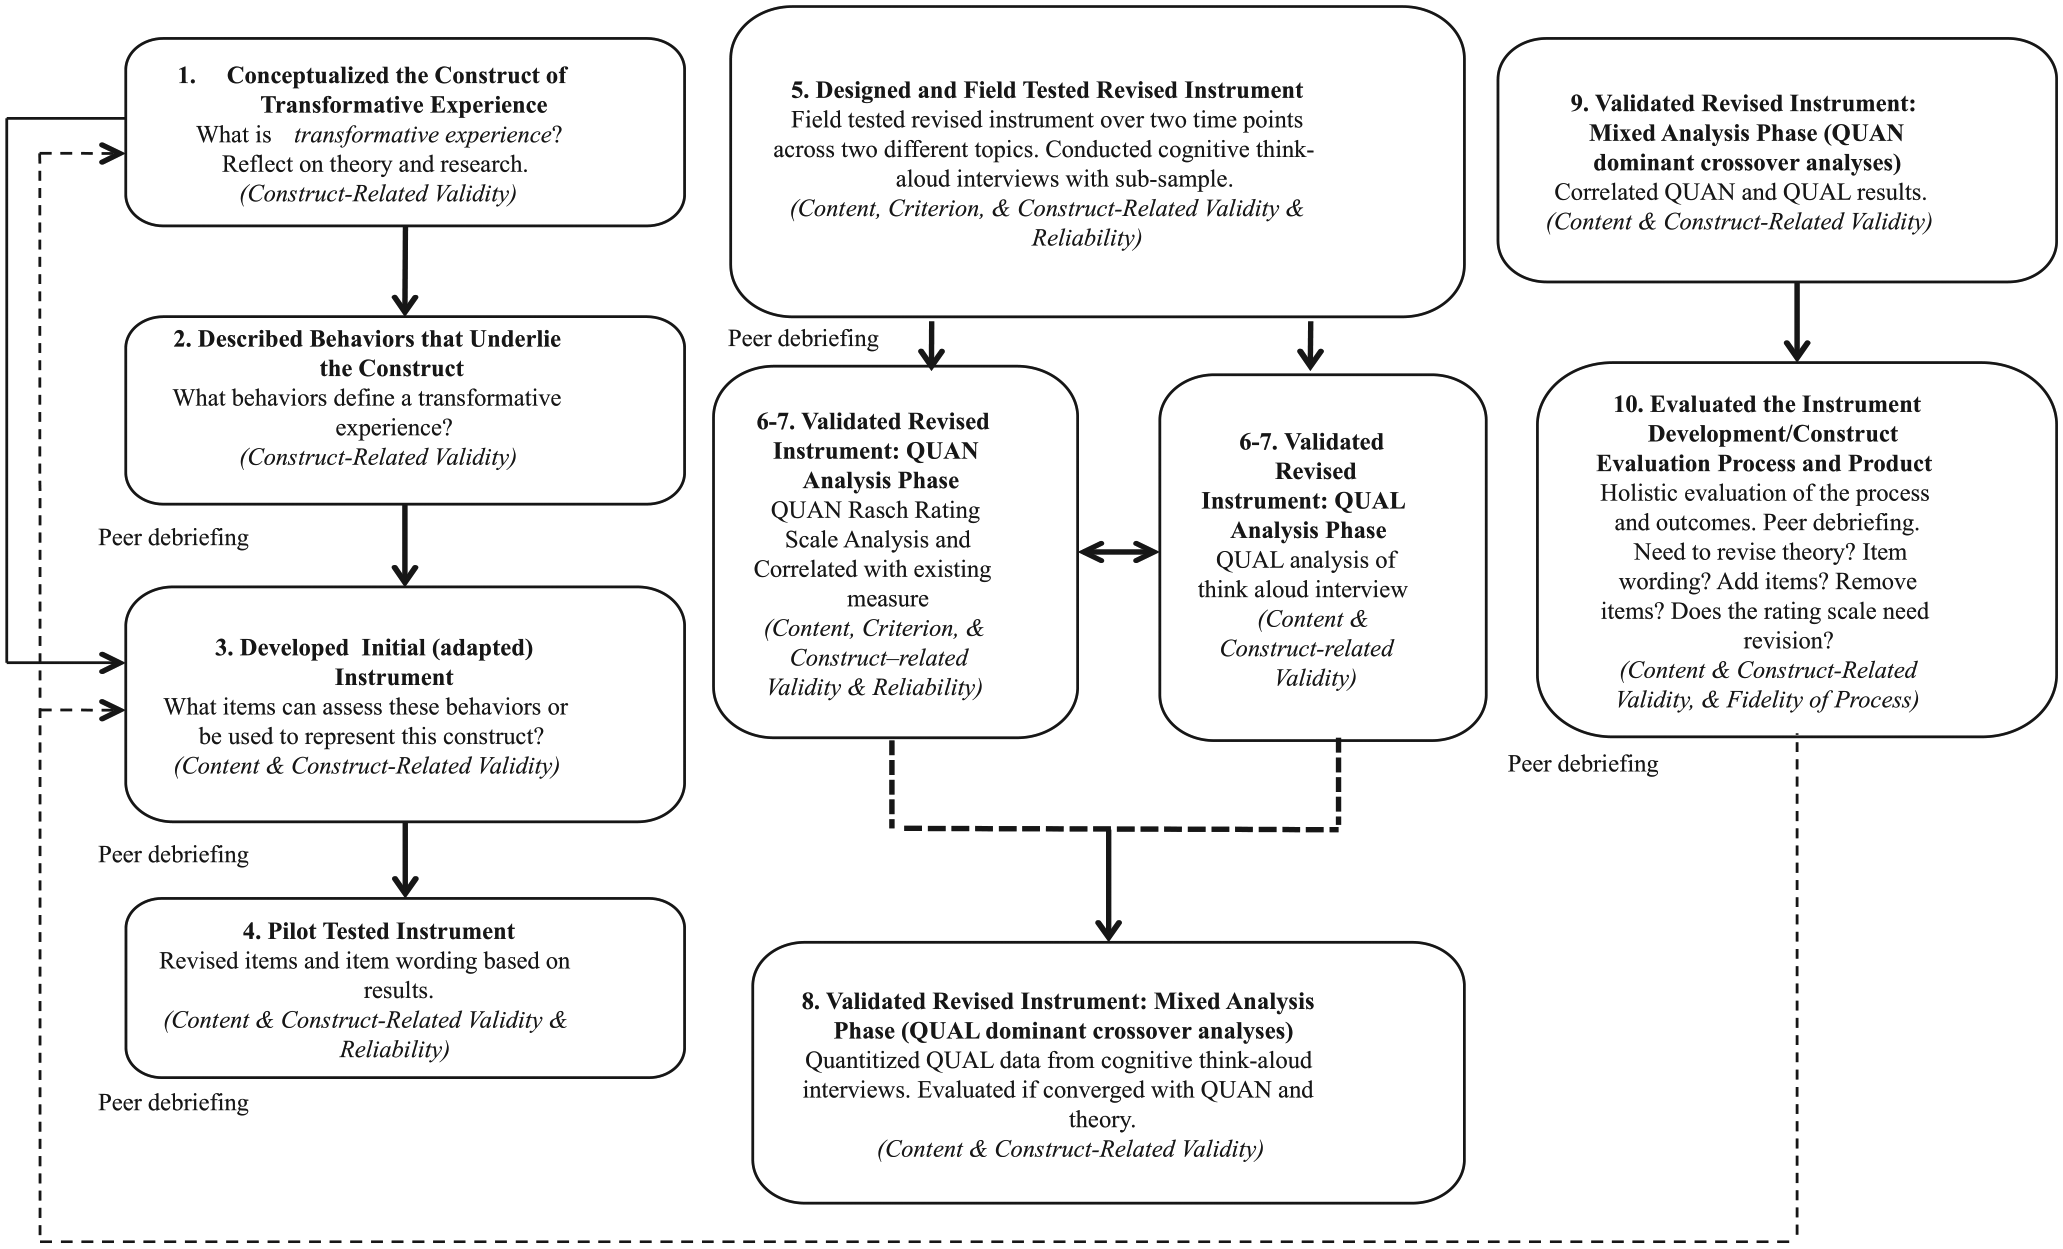
Onwuegbuzie et al.’s (2010) IDCV process adapted for the development of the Transformative Experience Questionnaire.
These research questions were selected to align with reliability and validity evidences outlined by the Standards for Educational and Psychological Testing (AERA, APA, & NCME, 2014).
Phase 1: Conceptualizing Transformative Experience
Pugh and colleagues developed the construct of transformative experience from Dewey’s theory of experience with particular focus on his work on aesthetics (Girod, Rau, & Schepige, 2003; Girod & Wong, 2002; Pugh, 2004, 2011; Wong, Pugh, & the Dewey Ideas Group at Michigan State University, 2001). One of the key assertions in Dewey’s (1934/1958) theory of aesthetics is that the arts have the potential to transform and enrich everyday experience by teaching individuals to see the world differently.
Drawing on these conceptions of aesthetics, Pugh and colleagues (Pugh, 2011; Wong et al., 2001) argued that science concepts have the same potential to transform students’ everyday experiences by functioning as a lens through which students perceive the world in their everyday lives. Pugh (2002, 2004, 2011) developed the construct of transformative experience as a representation of student engagement with academic content extending beyond the classroom to everyday life.
Transformative experience fits within a class of constructs representing deep engagement such as flow (Csikszentmihalyi, 1991), intrinsic motivation (Deci & Ryan, 1985; Ryan & Deci, 2000), and interest (Hidi & Renninger, 2006). These forms of engagement play an important role in supporting critical learning outcomes such as conceptual understanding (e.g., Grolnick & Ryan, 1987), conceptual change (Dole & Sinatra, 1998; Mason, Gava, & Boldrin, 2008), transfer (Pugh & Bergin, 2005), and creativity (Beghetto, 2010). Likewise, transformative experience is associated with valued educational outcomes such as enduring understanding (Girod, Twyman, & Wojcikiewicz, 2010; Pugh, 2002), conceptual change (Heddy & Sinatra, 2013), transfer (Pugh et al., 2010a, 2010b), and academic and career choice (Pugh, Phillips, Bergstrom, Sexton, & Riggs, 2014).
Phase 2: Describing Behaviors that Underlie Transformative Experience
Transformative experience is conceptualized as consisting of three qualities corresponding to three dimensions of engagement (behavioral, cognitive, affective; see Connell, 1990). Pugh (2011) argued that transformative engagement includes motivated use (behavioral), expansion of perception (cognitive), and experiential value (affective). Motivated use is defined as the free-choice application of content in an everyday context. That is, individuals choose to or spontaneously apply learning even when not required. Expansion of perception refers to understanding and perceiving the world in a new way, through the content learned. Finally, experiential value is defined as appreciating content for the way it enriches everyday experience.
For example, a transformative experience would be exemplified by a student who learned about weather in class and then began to watch weather reports and analyze the weather she experienced (motivated use), came to perceive weather events (e.g., wind) in terms of the ideas she was learning in class (e.g., air pressure), and developed a value for the immediate usefulness and a greater interest in weather (experiential value).
Phases 3 to 5: Initial Development and Field Testing of the TEQ
A few descriptive studies were conducted using the framework of transformative experience (Girod & Wong, 2002; Pugh, 2002, 2004). Interviews, observations, work samples, and context-specific assessment tools were used in these studies to gain insight into what it means to engage in a transformative experience and contrast transformative experience with other forms of engagement. Accordingly, a set of survey items was developed for assessing the three qualities defining transformative experience.
During the initial survey construction, a measurement expert practicing under the Rasch model continuously debriefed the survey developers. The expert reviewed with the survey developers the items and rating scale to verify that the items and scale were constructed to align with the specifications of the Rasch model. During initial discussions with the expert, items were conceptualized as being interrelated. Through debriefing with the measurement expert, it was learned that to align with the Rasch model, the items must be constructed to progress on a continuum from less to more of the trait being measured to represent a unidimensional construct. The resultant set of survey items were based on the theory that transformative experience is part of an engagement continuum ranging from in-class to out-of-class engagement with the out-of-class engagement end representing a higher degree of transformative experience.
The following description of the TEQ is given on the basis of Pugh et al. (2004). In the first phase of pilot testing, the TEQ was administered to two individuals who fit the target population (10th-grade biology students). These individuals were interviewed and the survey was revised according to their feedback. In the second phase of pilot testing, the revised survey consisting of 39 items rated on a 4-point Likert-type scale ranging from strongly disagree to strongly agree was administered in six 10-grade biology classes taught by three different teachers in a suburban high school. The scale progressed from strongly disagree to strongly agree to align with the specification of the Rasch model that measures must be additive (Wright & Masters, 1982). A total of 49 students, predominately females in Grade 10, completed the survey. To assess the reliability of students’ scores on the measure and unidimensionality of the pilot measure, a Rasch rating scale analysis (Andrich, 1978; Rasch, 1960, 1980) was applied.
Poorly fitting items as indicated by the Rasch results and redundant items as indicated by a qualitative review of the items were removed resulting in a more parsimonious item set. The measurement expert debriefed the survey developers again at this point in the process. Survey developers explained their rationale for removing items guided by the Rasch indices and theory guiding the construct of transformative experience.
Phases 6 to 9: Validating the Revised TEQ
Sample
A total of 196 middle school and high school students from Northeast Ohio participated in Phases 6 to 9. Institutional review board approval and permission from each school’s administrator was obtained. Purposeful and convenience sampling were combined in this study. At the time of the study, students were learning about properties of matter or genetics for which the questionnaire was structured (purposeful) and were accessible to the researchers (convenience). The TEQ was initially developed to assess transformative experience after being exposed to an intervention unit targeted at scaffolding transformative experiences and addressing common misconceptions. As such, it was assumed that this sample would yield a range of responses along the continuum with at least a portion of these students would have experienced the phenomenon under study. Genetics and properties of matter are two topics where common misconceptions exist. Middle school students (n = 115) from a rural area completed a Properties of Matter form while high school students (n = 81) from a suburban area completed a Genetics (i.e., heredity and variations of living things) form. Demographics for students are provided in Table 1.
Demographics for Middle School and High School Subsamples at Time 1.
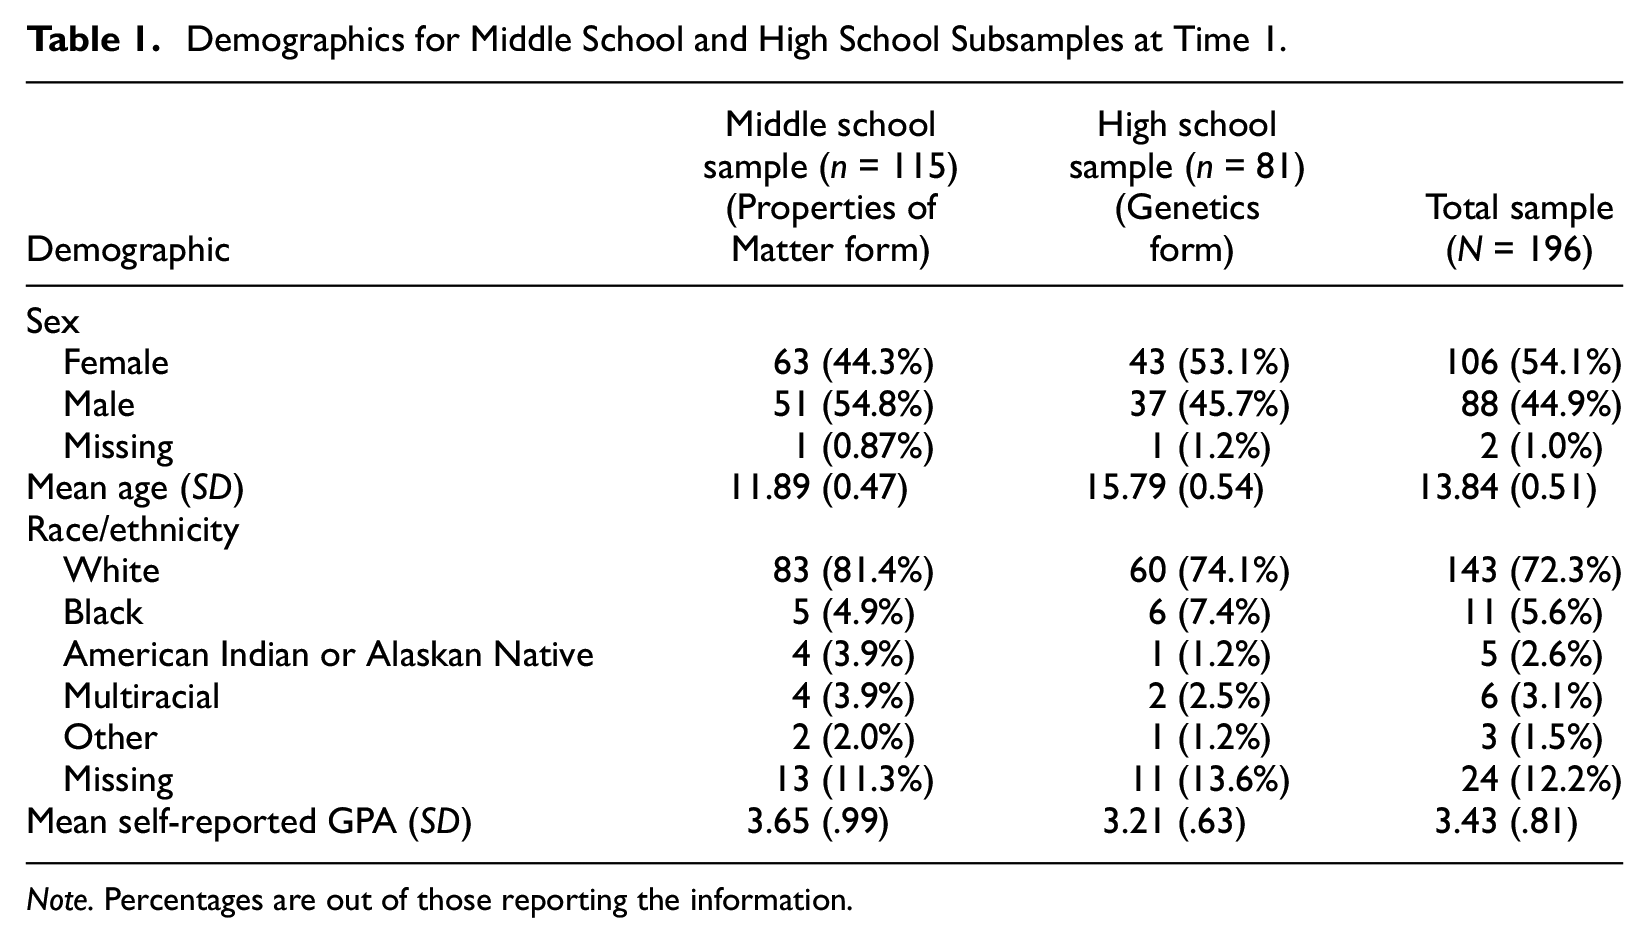
Note. Percentages are out of those reporting the information.
Instrumentation and Procedures
Transformative Experience Questionnaire
After removing redundant items and based on the initial piloting of the instrument (see Pugh et al., 2004), the TEQ consisted of 28 items rated on a 4-point scale ranging from strongly disagree to strongly agree, assessing the three qualities of transformative experience: motivated use (11 items), expansion of perception (7 items), and experiential value (10 items). The Rasch model transformed the raw scores to yield a composite score for each student on an interval scale in log-odd units called logits.
One middle school and one high school science teacher were sent an electronic copy of the survey to review the item wording for face validity and readability level. Both teachers responded that they found no revisions necessary. The original author was sent the modified survey items to verify that the adaptations made at the item level maintained the underlying concept each item was intended to measure. No major revisions were noted.
The research team administered the modified TEQ to students during their science class to test the stability of the construct and psychometric quality of the measure when modified for different science topics (Time 1). The teachers administered the TEQ survey at Time 2 two to three weeks later during science class and placed the survey in a sealed envelope for the first author to pick up. Retention rate for Time 2 administration was 87.83% (101 of 115 students) for the Properties of Matter form and 92.59% (75 of 81 students) for the Genetics form.
Motivated Strategies for Learning Questionnaire
The students also completed the 6-item task-value subscale from the Motivated Strategies for Learning Questionnaire (Pintrich, Smith, Garcia, & McKeachie, 1993) at Time 1 for the purpose of assessing concurrent validity evidence for both forms of the TEQ. Task-value relates to the experiential value component of transformative experience (see Pugh, 2011, for details). Reliability and validity evidence for the Motivated Strategies for Learning Questionnaire and task-value subscale is documented in prior research with Cronbach’s alpha yielding in the .90 range (see Duncan & McKeachie, 2005). The items were rated on a 7-point scale ranging from not at all true of me to very true of me. Student ratings were averaged across the six items to yield a total composite score ranging from 1 to 7.
Think-Aloud Protocol
A subsample of middle school (n = 11) and high school (n = 6) students were randomly selected from those who volunteered to complete a concurrent think-aloud at Time 1. The interview was planned to take approximately 30 minutes based on prior experience conducting cognitive interviews. The number of students selected was based on the amount of time the researchers had access to the students and the number of researchers available to conduct the interviews during that time frame.
To mirror the experience of completing a survey for the first time, we chose to collect quantitative and qualitative data concurrently. That is, the larger sample completed the quantitative survey, while during the same time the sub-sample completed the think-aloud task as they rated the survey items. This concurrent design was adopted to minimize an order effect. If students completed the survey prior to the think-aloud task, the task no longer would have captured their initial interaction with the survey items.
Two of the authors trained in conducting cognitive think-alouds met with each student in a separate setting within the school (e.g., library study room) while the other students completed the surveys during class time. Prior to beginning the think-aloud task for the TEQ, each student practiced the task using a sample item to become comfortable with thinking aloud. Students then read each item out loud, were asked what the item was trying to find out from them, and which response category would they choose and why. Students were given a $10 gift card for their participation in this task. Think-alouds were audio-recorded and transcribed.
Karabenick et al.’s (2007) approach to coding the think-aloud responses was used as a framework. This approach has been successfully applied with school-age samples in the past and provides for a systematic approach to analyzing the resultant data (Karabenick et al., 2007). Three criteria were coded including (a) item interpretation (did the student initially interpret the item as intended when asked, “What is this item trying to find out from you?”); (b) coherent elaboration—content (did the student interpret the main concept of the item as intended when elaborating on the item meaning and answer choice?); and (c) coherent elaboration—context for items having a context specified (did the student refer to the correct context as either inside or outside the classroom when elaboration on the item meaning and answer choice). Criteria were coded as congruent or incongruent with the intended meaning, or insufficient prompt when the interviewer did not provide a follow-up question to further clarify a student’s response.
Results
Findings are organized by the type of reliability or validity evidence examined, as well as by research question. Quantitative and qualitative results are integrated in this section to provide a comprehensive picture of findings and allow for holistic interpretations. Where appropriate, quantitative data are used to answer a research question or components of the research question requiring quantitative analysis (e.g., test–retest reliability). Crossover analysis was implemented “represent[ing] the highest form of combining quantitative and qualitative data analysis techniques—referred to as mixed analysis” (Onwuegbuzie et al., 2010, p. 58). For example, the Rasch rating scale results and qualitative think aloud interview data were both used to inform if the rating scale functioned as intended. Table 2 depicts the various analysis techniques used to examine validity and reliability evidence addressed in Phases 6 to 9. Although quantitative results were emphasized at times to address particular research questions (test–retest reliability), the quantitative and qualitative data were weighted equally in each phase and when drawing inferences to inform decision making regarding instrument revisions. This process is illustrated by the integration of the results when answering the research questions.
Study Component and Analysis Type.
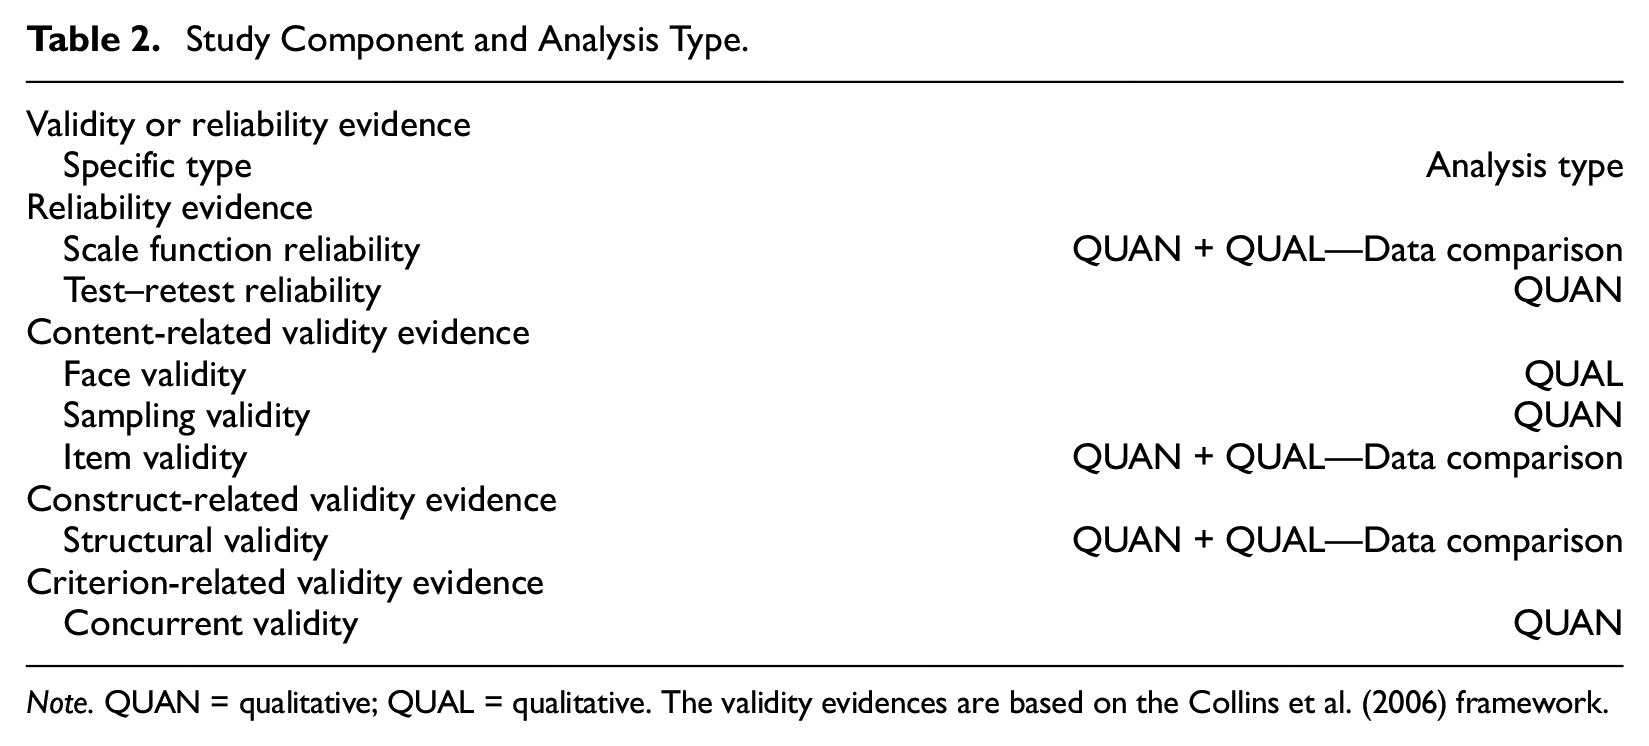
Note. QUAN = qualitative; QUAL = qualitative. The validity evidences are based on the Collins et al. (2006) framework.
Reliability Evidence
Rating Scale Functioning (Research Question 1)
Rasch rating scale analysis (Andrich, 1978; Rasch, 1960, 1980) using Winsteps (Linacre, 2006) was conducted to examine the compatibility between the predefined scale ranging from strongly disagree to strongly agree and students’ actual use of that scale. Rasch rating scale diagnostics provided evidence that students used all four-response categories as expected progressing from less (1) to more (4). Frequencies of the category endorsements increased monotonically, with step logits of at least 1.41 between categories, but less than 5.0 logits, as recommended by Linacre (1999, 2002). This implies that each rating scale category represented a distinct progression along the variable with the higher categories indicating a higher measure on the variable of transformative experience.
Figure 2 illustrates the thresholds for the rating scale providing the intersection of the item probability curve for both forms at Time 1. Each category has a distinct peak, indicating each category is the most probable response category for a distinct and large portion of the measure. Finally, there was sufficient coherence between what was estimated by the Rasch model and observed data, with over 40% (minimum criterion; Linacre, 1999) of the measures in the expected category.
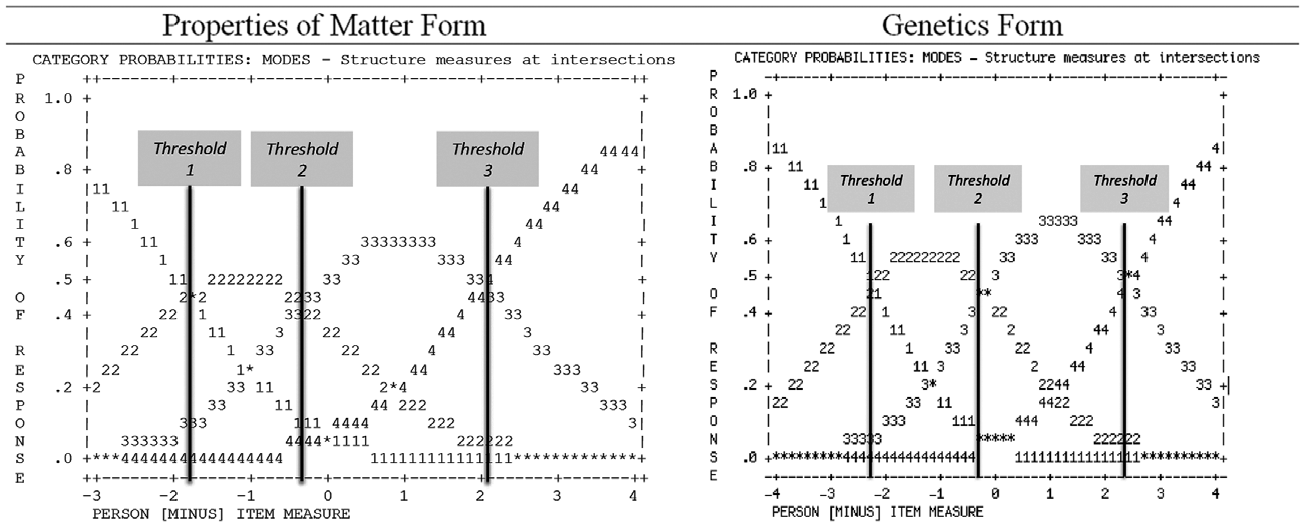
Structure of the categories for the 4-point scale on the Transformative Experience Questionnaire (TEQ) for both forms at Time 1. Each category has its own distinct peak.
Using the think-aloud responses to corroborate the quantitative results provided additional support that, overall, the students used the 4-point scale as intended for both forms. An interrater reliability analysis indicated moderate, statistically significant agreement between the two raters when coding for answer congruency across the items for the Properties of Matter form (Kappa = .478, p < .001) and Genetics form (Kappa = .501, p < .001). Although the interrater reliability was moderate, it was lower for these ratings compared to other criteria rated. We hypothesize these reliability indices were lower because at times a student would vary within his or her think-aloud to an item as to whether he or she was agreeing before selecting a final answer choice.
For the Properties of Matter form, 100% of students’ responses were coded as indicating a congruent answer choice for 13 (46.43%) of the items. The students were able to distinguish correctly among the four scale points for these items. For example, Student #176 selected agree for Item 22, which was coherent with rationale that he now finds the topic more interesting: “I agree. It’s more interesting now when I see like a cube of ice turning to water because I know why it happens. So it makes my life outside of school more interesting . . .” Similarly, this student selected disagree to express that he “rarely” thinks about the topic outside of school and supports this lower rating with a coherent rationale: “It’s rarely. It’s not like I see my mom cooking and think oh she’s probably doing a chemical change to that toast” (Student #110).
Eight (28.57%) of the items had one student response coded as having an incongruent answer choice, a finding that was not revealed by the quantitative results alone. Two of the same eight students were also coded as having an incongruent answer choice for four (7.14%) of the items. Three (37.5%) students’ responses were coded as incongruent for the item, I look for chances to use my knowledge of properties of matter in my everyday life (Item 11); however, this item as a whole did not function as expected, as will be reported in a later section.
The students’ responses coded as having incongruent answers tended to rate themselves too low for the elaboration they provided when thinking aloud for Item 11. In other words, they were being too hard on themselves when it came to selecting a higher rating in that they did not select agree or strongly agree if they did not engage in the behavior every single day. For example, this student (#120) selected a rating of 2 (disagree) because he does not use his knowledge on this topic every day but gives an example suggesting he does use the knowledge in his everyday life (I = Interviewer, S = Student):
And what would you put as your answer:
Sometimes when I’m like, when I come home from school or whatever, um, I try to find like a different example of the properties of matter, but not like every day, just when we’re on that unit.
As presented in the next section, students interpreted the item as asking if they use their knowledge of properties of matter on a daily basis. Thus, when responding, they tended to rate themselves lower even if reflecting that they do look for chances to use their knowledge but not every single day.
For the Genetics form, 100% of students’ responses were coded as indicating a congruent answer choice for 21 or 75% of the items. Depending on the item, students were able to use the scale in a monotonic fashion in that they selected either strongly disagree or disagree aligning with their elaboration that they do not use, think, or talk about the content in or outside of school; or agree or strongly agree when elaborating they use, think, or talk about the content in or outside school. For instance, Student #53 selected disagree to indicate he does not talk about the content just for the fun of it: “I’d strongly disagree because I’ve never brought it up in a conversation, like never talked about it outside of class.” While Student #75 selected agree which aligned with his elaboration that he does talk about the topic just for the fun of it, but provides an exception for why he did not choose the highest rating of strongly agree:
I would say yes, actually I do umm when I find an individual . . . like my grandfather . . . We just did a resolution about genetic engineering and we spoke about that after the debate and it was interesting so I guess I would give that say a three because I don’t often find people to talk about that with.
Five of the 6 (83.33%) students’ responses were coded as congruent for the remaining 7 items. The responses coded as incongruent were for the same student (#229) across 5 of these items. A similar pattern to with the Properties of Matter form was observed with this student rating himself lower than what his elaboration indicated. For example, in this response to whether he thinks about the topic when he is outside of school, he verbalized that he does think about it when he is outside of school but selected disagree because “not all the time”:
I’ll go out and I’ll start thinking about that stuff and certain things.
And what would you put as your answer?
I chose 2 because I sort of do, yet not all of the time I do.
This same student responded in a similar fashion for the other items. For instance, he verbalized, “I do think a lot about the variation and complexity of living things, what genes are made of, various organisms” when responding to item 6, but again selected disagree because he does not “ponder on things all the time.”
Test–Retest Reliability (Research Question 2)
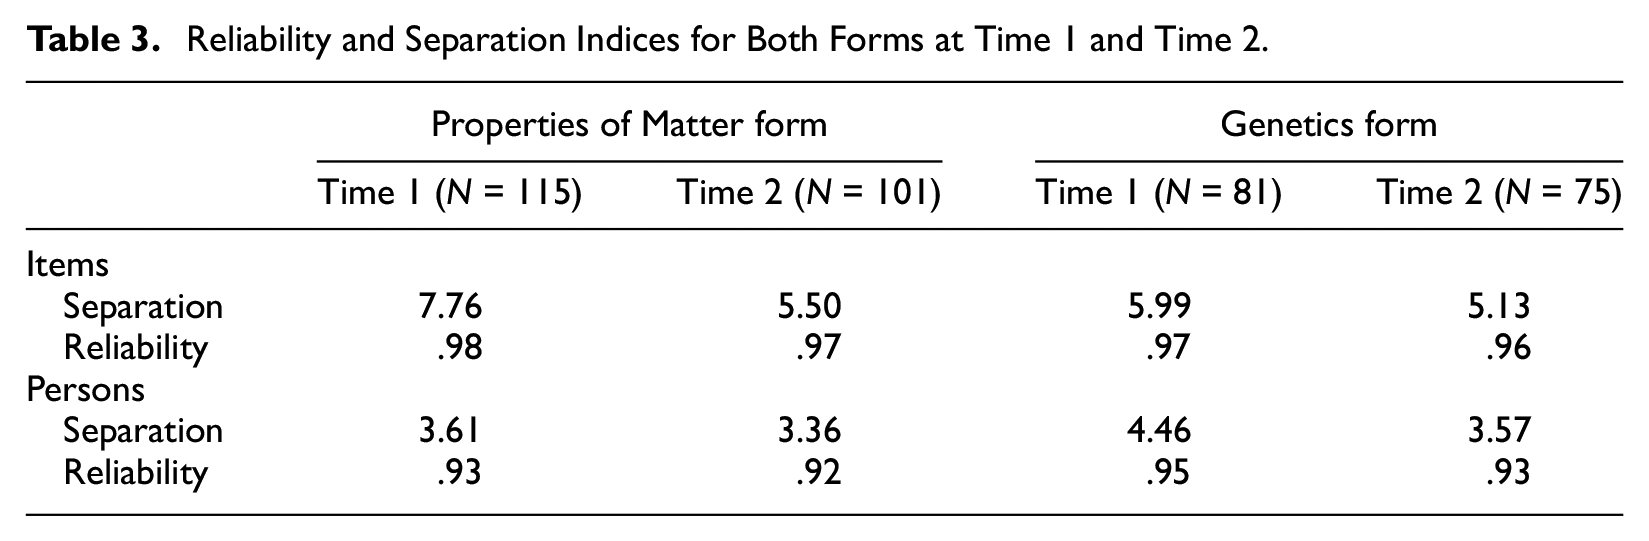
Test–retest reliability was .83 (p < .001) for the Properties of Matter form and .58 (p < .001) for the Genetics form. As reported in Table 3, item reliability and person reliabilities were in the .90 range, indicating that the item ordering and person measures would remain highly consistent if the TEQ were administered to a similar sample (Bond & Fox, 2007). Differential item functioning analyses indicated the Rasch item measures for each form was consistent over time. Specifically, there was no statistically significant difference in item ordering between Time 1 and Time 2 for the Properties of Matter form or Genetics form, p > .05.
Reliability and Separation Indices for Both Forms at Time 1 and Time 2.
Content-Related Validity Evidence (Research Question 3)
Sampling Validity
Item and person separation indices were computed, which indicated how many statistically significantly distinct groups of items and students could be distinguished. Separation indices for both time points across the two forms are reported in Table 3. For the Properties of Matter form at Time 1, the item separation was 7.67 and person separation was 3.61, indicating that more than 10 statistically significantly distinct strata 1 of items and over 5 statistically significantly distinct groups of students with varying degrees of engagement were discriminated along the measure, above the minimum criteria of two.
Figure 3 provides an illustration of the distribution of items and persons along the continuum for both forms at Time 1 assisting in the inspection for sufficient sampling validity. Items are fairly evenly spread along the continuum for both forms indicating that the items are assessing lower to higher levels of engagement.
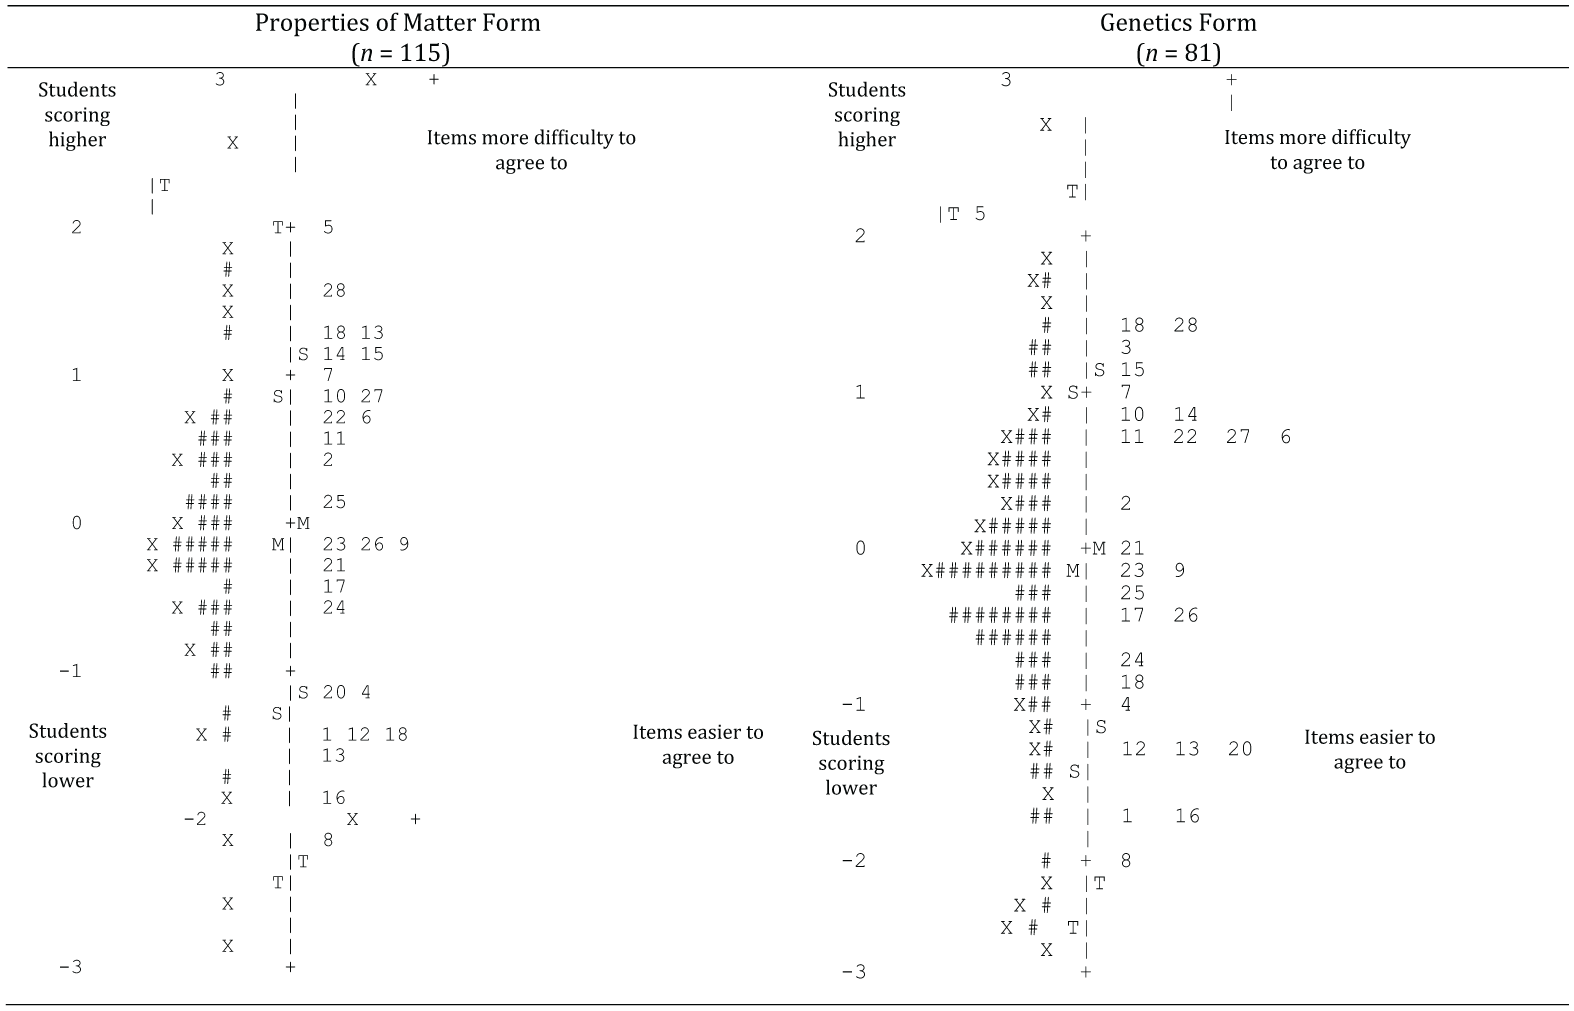
Item and person distribution map for surveys at Time 1 in logits.
Item Validity (Research Question 3)
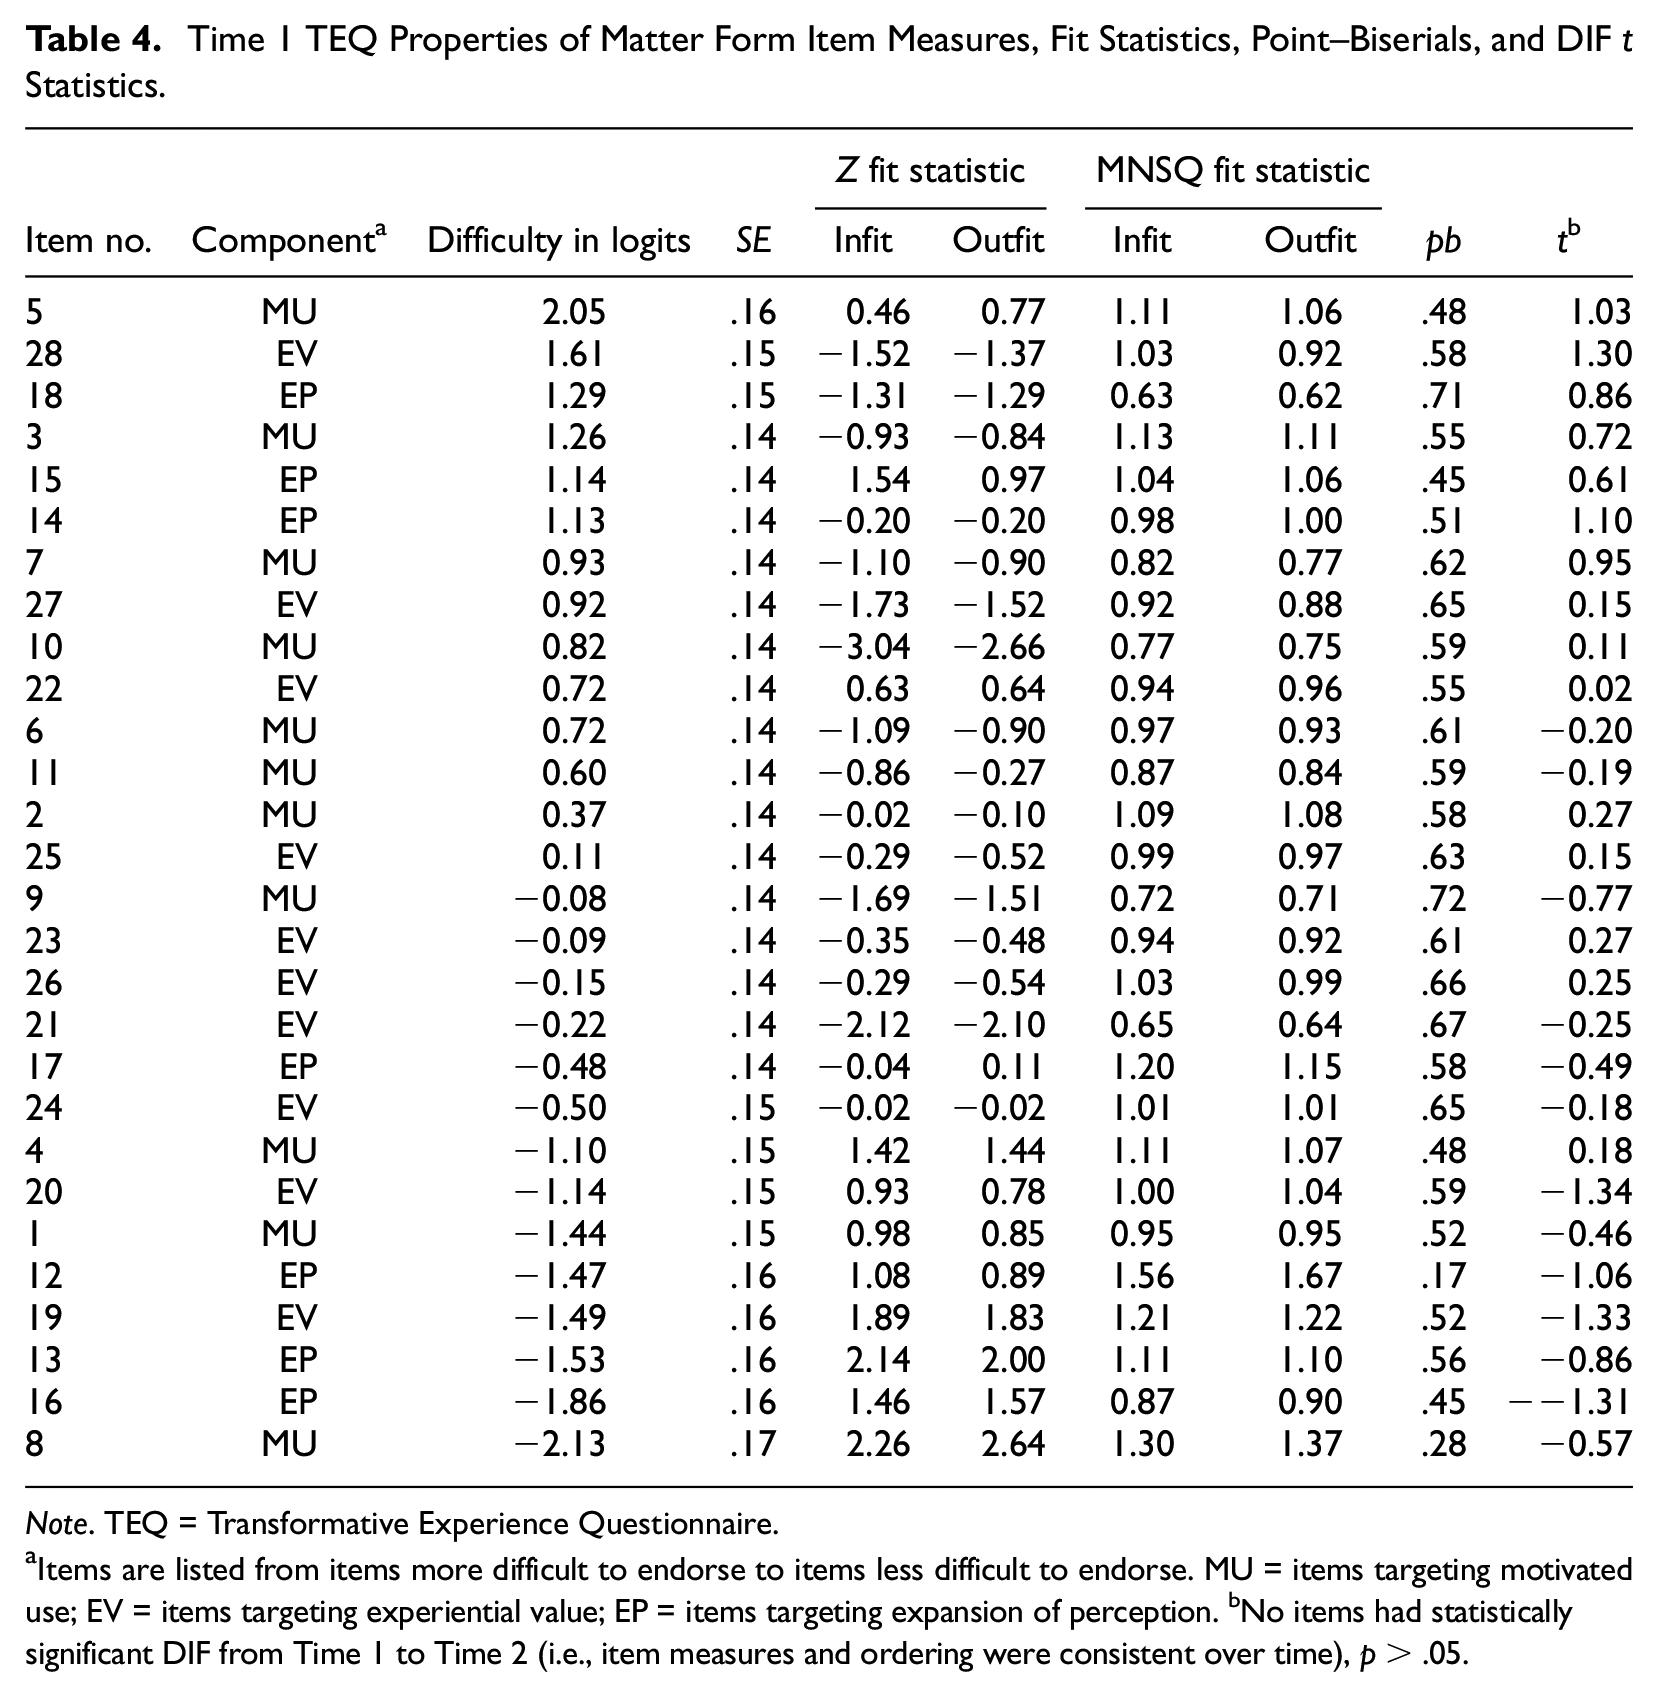
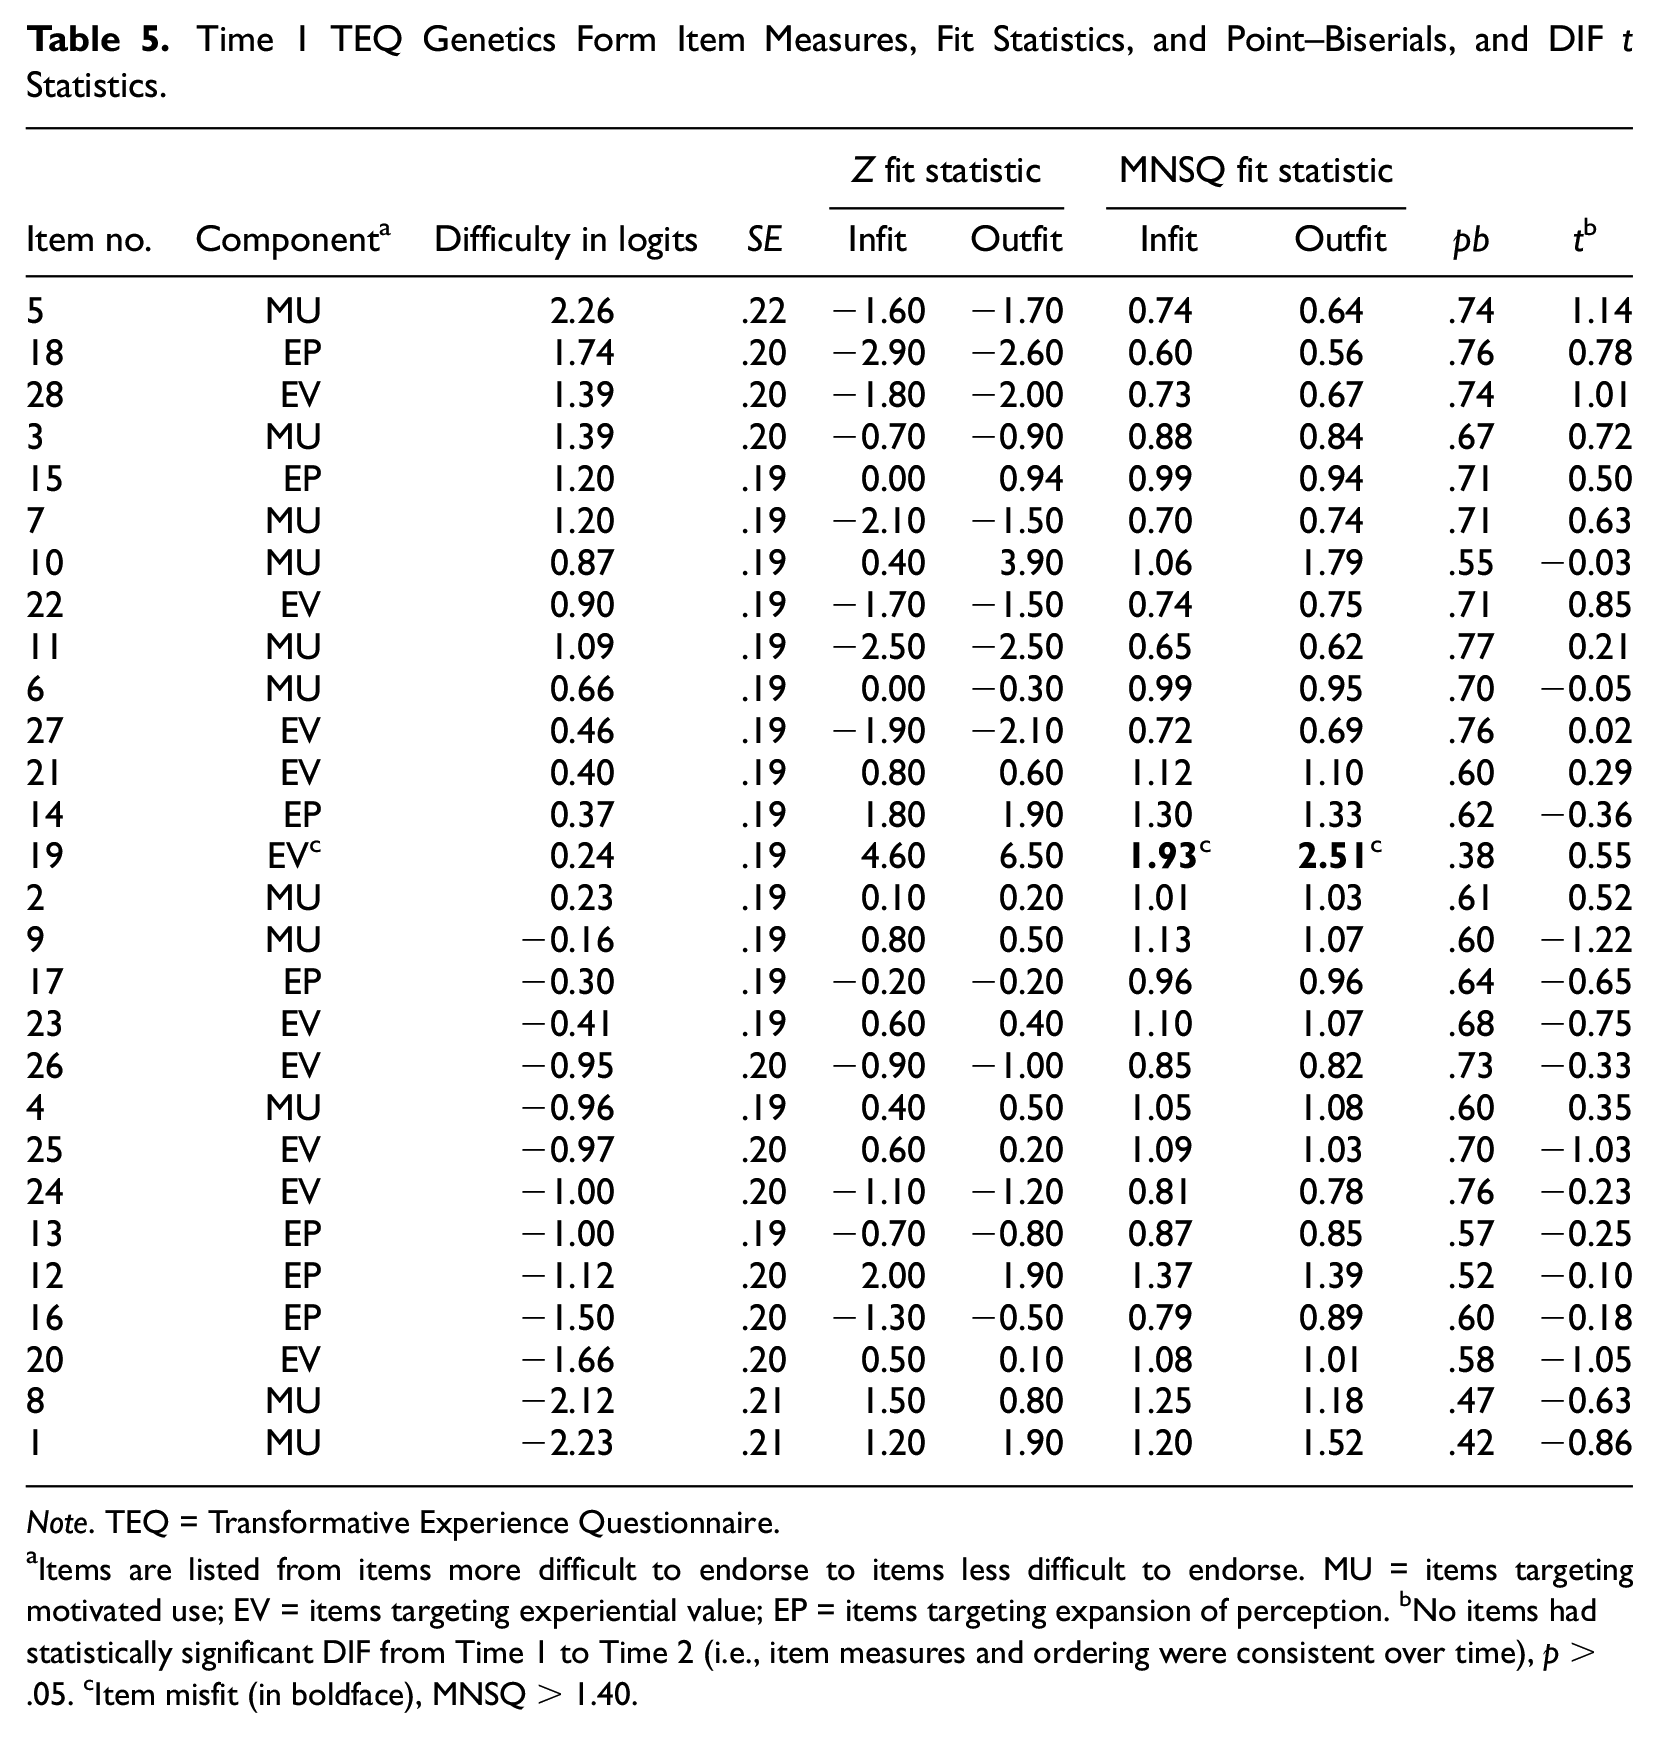
Tables 4 and 5 provide the item measure from the most difficult item to endorse to the easiest item to endorse for each form at Time 1. Fit indices were examined for the items and students to indicate how well the data fit the Rasch model and are also reported in Tables 4 and 5. The fit statistics for each item are provided in Tables 4 and 5 in mean-squares and standard Z score units. A total of 100% of the items on the Properties of Matter form and 96.35% (27 out of 28 items) on the Genetics form had appropriate infit mean-squares values between 0.60 and 1.40, indicating the data had a sufficient amount of stochasticity (i.e., variability and were adding sufficient information to the measure and fit the Rasch model).
Time 1 TEQ Properties of Matter Form Item Measures, Fit Statistics, Point–Biserials, and DIF t Statistics.
Note. TEQ = Transformative Experience Questionnaire.
Items are listed from items more difficult to endorse to items less difficult to endorse. MU = items targeting motivated use; EV = items targeting experiential value; EP = items targeting expansion of perception. bNo items had statistically significant DIF from Time 1 to Time 2 (i.e., item measures and ordering were consistent over time), p > .05.
Time 1 TEQ Genetics Form Item Measures, Fit Statistics, and Point–Biserials, and DIF t Statistics.
Note. TEQ = Transformative Experience Questionnaire.
Items are listed from items more difficult to endorse to items less difficult to endorse. MU = items targeting motivated use; EV = items targeting experiential value; EP = items targeting expansion of perception. bNo items had statistically significant DIF from Time 1 to Time 2 (i.e., item measures and ordering were consistent over time), p > .05. cItem misfit (in boldface), MNSQ > 1.40.
The one exception was Item 19 on the Genetics form (Learning about heredity and variation of living things is useful for my future studies or work), which had an outfit value of 2.51, indicating unexpected responses for students with lower measures on this item. All other items fit the Rasch model, providing supportive evidence that the items form a unidimensional measure. All of the items had positive point–biserials, including Item 19 (see Tables 4 and 5), which further supported that the items are likely measuring the same underlying construct. As such, the statistics supported a decision to retain all of the items as part of the measure for both forms.
However, cognitive think-aloud responses indicated some items needed modification in item wording to increase the degree of item validity evidence. Interrater reliability indices indicated moderate to substantial agreement 2 between the two raters across the five criteria for both forms with Kappa’s ranging from .478 to .858, p < .001. Items identified as potentially needing revision are indicated in Tables 6 and 7, with at least two students having an incongruent rating for one or more of the criteria. The ratings for coherent elaboration content, coherent elaboration context, and answer congruency guided what misinterpretations of the intended meaning of the item or scale were identified for each item based on the students’ think-alouds.
Items Identified as Needing Quantitative and Qualitative Review for Properties of Matter Form.
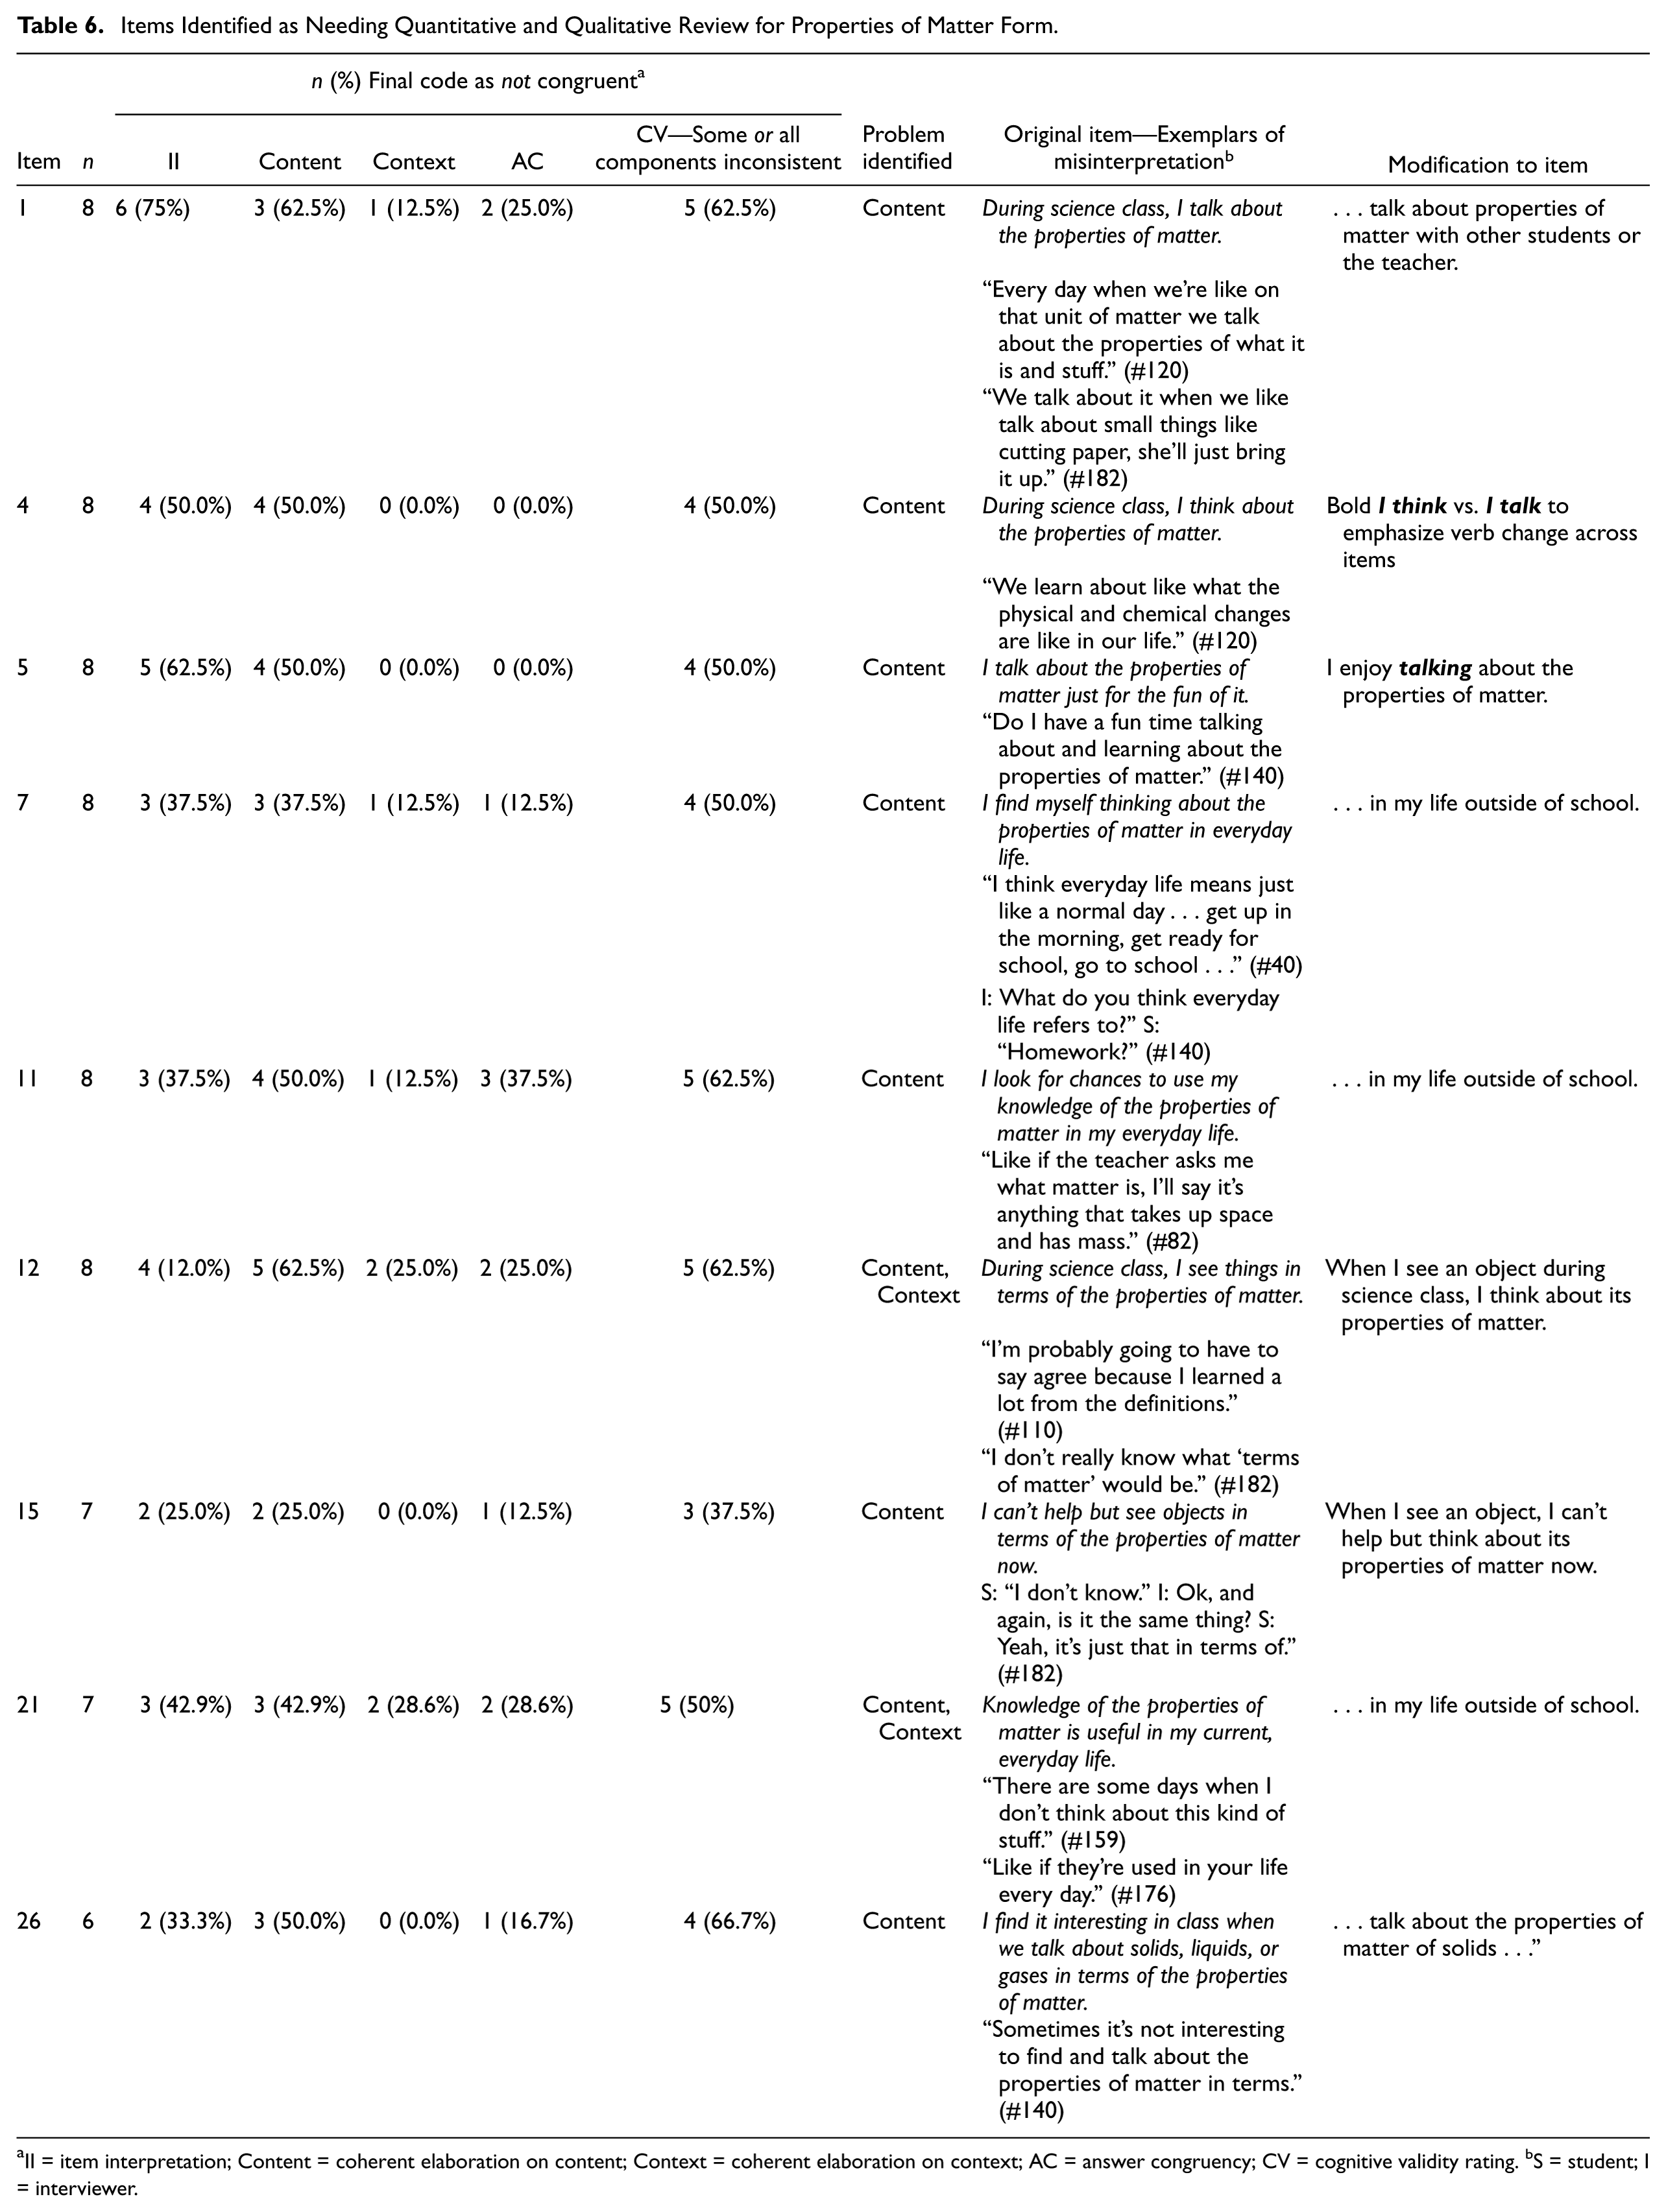
II = item interpretation; Content = coherent elaboration on content; Context = coherent elaboration on context; AC = answer congruency; CV = cognitive validity rating. bS = student; I = interviewer.
Items Identified as Needing Quantitative and Qualitative Review for Genetics Form.
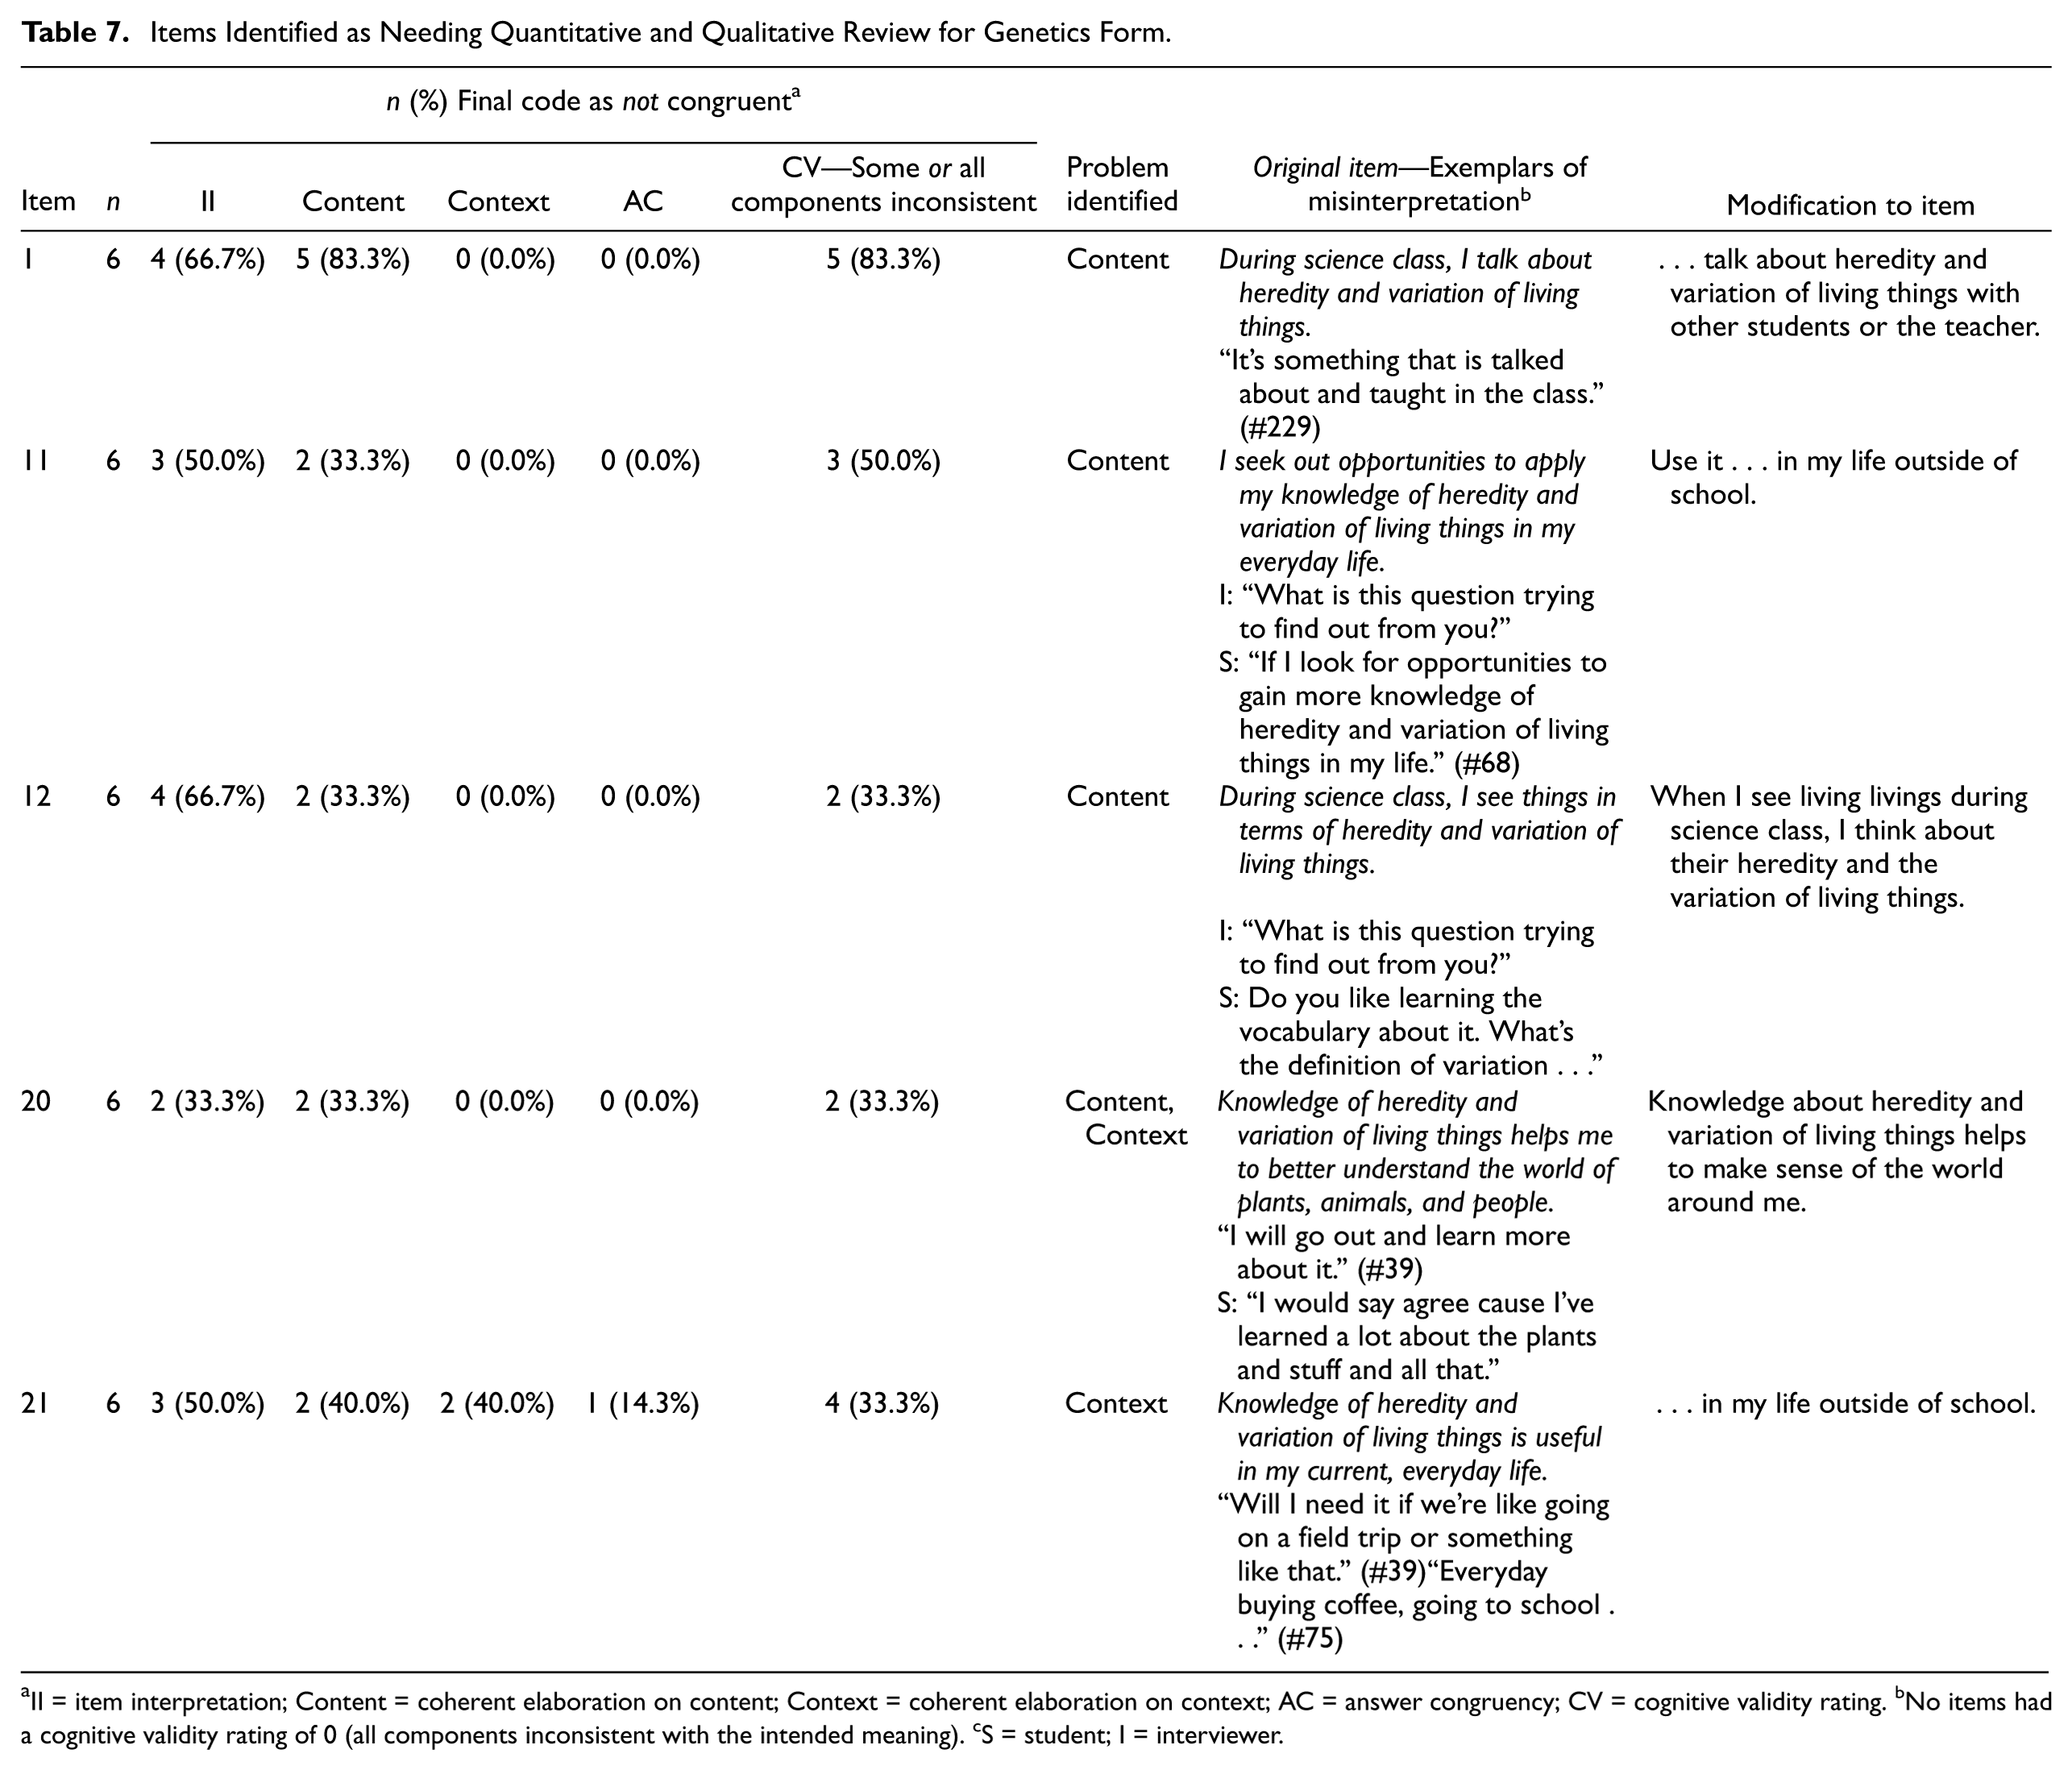
II = item interpretation; Content = coherent elaboration on content; Context = coherent elaboration on context; AC = answer congruency; CV = cognitive validity rating. bNo items had a cognitive validity rating of 0 (all components inconsistent with the intended meaning). cS = student; I = interviewer.
Exemplars are provided to illustrate the misinterpretations for each item. Recommended modifications to each item based on the misinterpretation identified are noted for each item across forms. The modifications recommended were slight and were guided by three resources: (a) the descriptions of the item meaning on the criteria validity sheets created by the author of the TEQ, (b) transcripts of students who were coded as having congruent ratings for the item, and (c) debriefing electronic exchanges with the author of the TEQ discussing the revisions and rationale for revisions. At times, the students’ words from the cognitive interview data were adopted to provide more developmentally appropriate and simplistic item wording.
A total of 20 (71.43%) of the 28 items on the Properties of Matter form yielded an overall cognitive validity rating of 2 (all components congruent) for at least seven of eight students. Content of the items was the main issue identified for all eight of the items in addition to reflecting on the appropriate context (inside or outside of class) for two of the eight items. Three students’ think-alouds were rated as incongruent for During science class, I talk about the properties of matter (Item 1) because students were reflecting on whether the topic was covered in the classroom rather than on their own engagement with the topic.
A common misinterpretation was evident for items including the term everyday life such as for I think find myself thinking about the properties of matter in my everyday life (Item 7) and I look for chances to use my knowledge of the properties of matter in my everyday life (Item 11), and Knowledge of the properties of matter is useful in my current, everyday life (Item 21). As seen in Table 7, the students rated as having an incongruent coherent elaboration interpreted everyday life as either meaning they engaged in the behavior every single day or included their school life in their interpretation. Part of students’ everyday life is school and thus they were reflecting on their in-school experience or when they worked on homework rather than the intended meaning of out-of-school experiences.
Another misinterpretation related to items including the phrase in terms of such as the items During science class, I see things in terms of the properties of matter (Item 12) and I can’t help but see objects in terms of the properties of matter now (Item 15) Students misinterpreting this item either expressed they were not sure what in terms of meant or interpreted the phrase as meaning vocabulary words or “definitions” (#110). Interpreting the phrase as meaning having an understanding of the vocabulary lowers the difficulty level of this item and might explain why this item was easier to endorse than items such as talking about the topic in class. That is, it is more difficult or a higher level of engagement to see things through the lens of the content versus understanding the vocabulary words.
A total of 23 (82.14%) of the 28 items on the Genetics form yielded an overall cognitive validity rating of 2 (all components congruent) for at least five of six students. Noteworthy is that the quantitative and qualitative results differed for item 19, which had a significant outfit mean-squares of 2.51 but received an overall cognitive validity rating of 2 (all components congruent) for all six students.
Four of the five items identified as needing review on the Genetics form were the same items as the Properties of Matter form. For Item 1, the same pattern of misinterpretation was evident as students reflected on whether the content was “taught in the class” (#229). The same patterns existed for Item 21 which also used everyday life as with the Properties of Matter form in that students’ think-alouds, rated as incongruent in coherent elaboration, were including their school life rather than focusing on everyday life outside of the classroom. Furthermore, as with the Properties of Matters form, the students’ think-alouds rated as incongruent for items including the phrase in terms of was problematic in that students were reflecting on their learning vocabulary words (terms) or the definitions instead of thinking of the phrase through the lens of heredity and variation of living things.
Construct-Related Validity Evidence (Research Question 3)
Structural Validity
TEQ items targeting in-class engagement are located at the lower end of the continuum in Figure 3 and below the item mean of 0 logits for both forms. These items relate to how students think, talk, or apply concepts in the classroom context. Items with lower item measures were easier for students to endorse. Also spread along the lower end of the continuum of transformative experience were items targeting students’ general experiential value for the topics. For example, items such as I find that my knowledge of the properties of matter makes my current, out-of-school experience more meaningful and interesting.
Directly below and above the item mean of 0 logits are items targeting students’ out of class engagement with the concepts (e.g., I think about the properties of matter when I see things like people cooking, grass being cut, leaves changing color, or ice melting). Items related to intentionally applying, talking, or thinking about the concept when not required to (e.g., I look for examples outside of class of the properties of matter) have item measures located at the upper end of the continuum of items representing transformative experience and thus were more difficult for students to endorse, as expected.
In addition to these findings, a paired samples t-test revealed the students’ Rasch person measures statistically significantly decreased over time on the Properties of Matter form (t = −6.27, M Time 1 = −.21 ± 1.12, M Time 2 = −0.65 ± 1.19) and Genetics form (t = −4.32, M Time 1 = −0.21 ± 1.51, M Time 2 = −.97 ± 1.61), p < .001. These results further support the structural validity as it is expected that students’ engagement with the content is likely to decline after the instructional unit is complete.
Concurrent-Related Validity Evidence (Research Question 3)
The Properties of Matter form shared a significant positive correlation (r = .711, p < .01) with the scores on the task-value measure (α = .85) at Time 1. The Genetics form shared a significant positive correlation with the scores on the task-value measure (α = .920) at Time 1 (r = .467, p < .001).
Phase 10: Evaluation of Product and Process
Product Evaluation
Quantitative and qualitative data were weighted equally in drawing inferences regarding the functioning of the rating scale and score validity for the TEQ. The Rasch results and cognitive interview data provided supportive evidence of the validity of the inferences drawn from the TEQ in this study for both forms, indicating the potential to adapt the TEQ to assess a variety of science concepts. First, the 4-point rating scale fit the Rasch model and was used in a meaningful way by students as evidenced by the answer congruency ratings used to code the cognitive interview data. Specifically, students used the scale from less to more as intended and the scale provided for sufficient discrimination along the continuum. This conclusion was evidenced by the rating scale analysis and answer congruency ratings for the cognitive think-alouds. Based on this finding, we recommend future practitioners and researchers use the 4-point scale labeling as strongly disagree, disagree, agree, and strongly agree when administering the TEQ.
Second, the data from the 28-item measure fit the Rasch model, supporting that the TEQ assesses a unidimensional construct, indicating the scores can be used as a composite representing degree of transformative experience. The person mean approached the item mean, indicating the measure is targeting the respondents, providing a range of items that are not too easy or difficult for the respondents. Interestingly, as previously noted, it is around the item mean where items begin assessing out-of-class engagement. This finding is important in that one purpose of the TEQ is to differentiate between students reporting in-class from out-of-class engagement, with those agreeing to out-of-class engagement moving toward a higher degree of transformative experience.
Third, the ordering of items along the continuum revealed a qualitatively meaningful hierarchy consistent with the theory of transformative experience as a unidimensional construct. Items targeting engagement with properties of matter or genetics inside the classroom were easier for students to endorse than items targeting engagement with the concepts outside the classroom. This finding is consistent with Pugh et al.’s (2004, 2010b) assumption that students would find it easier to agree that they engage with the content in the classroom than with the content outside of class.
With respect to the three qualities defining a transformative experience, motivated use, experiential value, and expansion of perception, no clear pattern was revealed. Although Pugh et al. (2004) proposed earlier that expansion of perception might occur as a result of motivated use, the results in this study do not support this notion. Rather, all three qualities were spread along the continuum rather than in clusters or a clear hierarchy. In addition, a number of items assessing motivated use included item measures toward the top of the continuum (i.e., more difficult to endorse). This finding suggests motivated use is not necessarily a precursor to expansion of perception, rather items associated with this are more difficult to agree to experiencing.
During the evaluation of the product component of Phase 10, the original author of the TEQ served as the debriefer. As a result of discussing the findings with the author, we learned that the results do lend support to Pugh’s (2011) later description of the theory of transformative experience explaining that the three qualities share an interrelated relationship rather than a hierarchical relationship in terms of defining the construct of transformative experience. Another reason these qualities were not revealed as subcomponents might be attributed to item wording. For instance, the item I look for examples of adaptation outside of class theoretically assesses students’ expansion of perception of the content. However, this particular item clusters with items assessing motivated use and does not ask if the student “uses a concept to see some aspect of the world in a new way” (Pugh et al., 2004, p. 4), which defines expansion of perception. This reflection on how the findings align or misalign to the original conceptual framework of the construct under study illustrates the cyclical process in applying the IDCV process.
Fourth, and finally, supportive evidence was found that the meaningfulness of the construct was fairly stable across administrations of the TEQ for both forms. The test–retest reliability for the scores produced was moderate to high and the differential item functioning analyses revealed no significant shift in item ordering over time for either form.
Despite that all but one item fit the Rasch model, the cognitive think-alouds indicated slight modification in wording of some of the items was needed across forms. Items using phrases such as everyday life and in terms of were not interpreted as intended. When students’ interpretations vary from what is intended, then the degree of reliability of their scores and validity of the conclusions we draw is threatened. These results highlight the importance of maintaining the core item wording when adapting the measure to target other concepts in science. Also, these results demonstrate the need for weighting qualitative and quantitative findings equally for informing instrument quality. If qualitative methods were not used in the instrument evaluation process, then misinterpretations of item wording could go undetected, ultimately threatening the validity of the inferences drawn from the survey scores. Final versions of the two TEQ forms are available online as supplemental materials at http://mmr.sagepub.com/supplemental.
As with any self-report measure, a number of errors such as response-bias could affect the results. A concern more specific to the TEQ is that students might not be able to accurately reflect on the degree of engagement either because they do not recall, or perhaps recognize the extent that they think, talk, or apply the content they are learning. Furthermore, misinterpretation of item wording influenced students’ ability to respond to the items as expected. Future research should investigate whether students’ self-reports on the TEQ corroborating with other data sources such as observational data of students engagement inside the classroom, cognitive interviews probing students about their experiences with the content, or perhaps students’ journaling their engagement with the content outside of the classroom.
Process Evaluation
Three critical evaluations were evident in our reflection on the fidelity of the process. First, debriefing mainly occurred during the instrument development phase and when verifying the revisions to item wording. The need for debriefing might vary depending on the size and areas of expertise of the research team. Our research team consisted of multiple researchers with expertise in psychometrics, science education, curriculum, and/or motivation. Capitalizing on the strengths of the different research team members, certain researchers took the lead on different components of the process. We found it necessary to have experts in quantitative, qualitative, and mixed-method inquiry on the team to implement the IDCV process. The research team members served to objectively debrief different components of the research, addressing and providing for complementarity when the team came together as a whole. In this sense, debriefing took place within and across the research team.
As one example, the first author conducted the Rasch analyses for one form and the second author for the second form. The two researchers then debriefed by discussing the results to verify accuracy in interpreting the Rasch output and interpretations from the results informing the score validity. The full research team then discussed the results as a whole to make decisions on the instrument revisions. In this case illustration, the research team continuously engaged in debriefing to justify decisions made regarding the instrument construction and validation. A limitation of this approach is the degree of objectivity of the research team in this process.
Furthermore, we had access to the original author of the instrument being evaluated. This access provided for the team to have the author of the instrument, the expert on the construct, to serve as the debriefer when discussing interpretations of the item meaning when developing criteria to code think-aloud transcripts to evaluate item validity, verify the interpretation of the item ordering and how it compares to the original theory of the construct being measured, and justifying the modifications to item wording based on the quantitative and qualitative results. Involving an expert on the construct under study increased the fidelity of the process when evaluating the meaning of the quantitative and qualitative results, corroborating consistency between the final measure and the original theory guiding the construct. Reflecting on the debriefing process, it would be advantageous to more systematically analyze the data produced (e.g., interview data, electronic exchanges, meeting minutes, etc.).
A second critical evaluation of the fidelity of the process was the identification of the qualitative sample. We were limited by accessibility to a student sample, which drove the sampling technique and size used for the cognitive interviews. Because In reflecting on the sample selection, an alternative method could be to purposefully sample the think-aloud participants based on a criterion or set of criteria depending on the research purpose. For example, a researcher might purposefully sample by gender, socio-economic status, reading ability level or ethnic/racial affiliation to examine if item interpretation differs by these groups. In another example, using a larger sample, participants’ might first complete the survey to obtain their scores. These scores could then be used to determine the sub-sample of respondents with scores in the lower, middle, and higher ranges to represent the array of respondents in the cognitive interview sample. Literature (e.g., Creswell, 2007; Guest, Bunce, & Johnson, 2006) guiding sampling schemes and sizes for qualitative interviews could be consulted to strengthen the sampling method.
Finally, a third critical evaluation of the fidelity of the process was the importance of the crossover analyses emphasized in the IDCV process, particularly when evaluating content and construct-related validity evidences. If we did not conduct crossover analyses, the conclusions, inferences we drew from the findings for the sample in this study, and modifications made to the items would have differed. For instance, when consulting the quantitative findings, all but one item fit the Rasch model. At this point in the analysis, a researcher might conclude there was sufficient evidence for the content-related validity and perhaps only investigate the qualitative think-aloud interview data for the one misfitting item.
On the other hand, if we only considered the qualitative findings, evidence would be lacking if the results (i.e., item ordering, rating scale functioning, item fit) would likely replicate for other similar samples. Also, quantitative evidences outlined as necessary to inform reliability and validity according to the Standards for Educational and Psychological Testing (AERA, APA, & NCME, 2014) would be lacking. Furthermore, if we conducted either the quantitative or qualitative analyses sequentially rather than concurrently in Phases 6 to 10, crossover analyses would not have been possible to inform the instrument quality. If quantitative analyses first, then a number of revisions needed to item wording would not have been detected until later conducting the qualitative analyses. Conducting qualitative and quantitative analyses concurrently provides for a more efficient and meaningful process for informing necessary instrument revisions.
We recognized the importance of analyzing the qualitative and quantitative data concurrently rather than sequentially. Also, allowing both the quantitative and qualitative data to drive decisions regarding score validity. Although only one item was identified as problematic by the quantitative findings, the qualitative data revealed a number of students’ interpretation of items using every day and in terms of differently than intended. If these items were not identified through applying the IDCV process, the degree of validity of the inferences would have been threatened.
Footnotes
Declaration of Conflicting Interests
The author(s) declared no potential conflicts of interest with respect to the research, authorship, and/or publication of this article.
Funding
The author(s) disclosed receipt of the following financial support for the research, authorship, and/or publication of this article: This research was supported in part by an internal grant awarded to the first author by the College of Education at the University of Akron.
Notes
References
Supplementary Material
Please find the following supplemental material available below.
For Open Access articles published under a Creative Commons License, all supplemental material carries the same license as the article it is associated with.
For non-Open Access articles published, all supplemental material carries a non-exclusive license, and permission requests for re-use of supplemental material or any part of supplemental material shall be sent directly to the copyright owner as specified in the copyright notice associated with the article.