
Abstract
Despite the utility of applying mixed methods research to understand complex phenomenon, few studies have applied this approach to health policy and in Africa. This article illustrates the application of mixed methods research to inform health policy in Ghana with the intent of complementarity. Through an exploratory sequential mixed methods research design involving 24 focus group interviews and 417 household surveys, we developed criteria for identifying very poor households for health insurance premium exemptions in Ghana. The qualitative procedures identified communities’ concerns regarding being very poor: food insecurity, lack of seeds to sow, compromised access to education, financial insecurity, and status as unemployed widows with children. The survey findings illustrated the distribution and predictors of poverty in the Kassena-Nankana District. Based on these findings, the authors proposed a four-question survey for the Kassena-Nankana District Health Insurance Scheme to administer to determine extreme poverty. Based on these recommendations, the local government has a unique opportunity to increase the very poor’s access to and utilization of health care services.
Introduction
This article illustrates the application of mixed methods research (MMR) to formulate health policy in Ghana. The article includes the following sections: MMR and its use in Africa, health insurance and the challenge of identifying the very poor in Ghana, conceptual and theoretical rationale for MMR, research methodology, results, discussion of the results, policy implications, methodological implications, and conclusion.
Mixed Methods Research and Its Use in Africa
MMR focuses on collecting, analyzing, and mixing both quantitative and qualitative data in a single study or series of studies with the aim of providing a better understanding of the research problem than either a qualitative or quantitative approach alone (Creswell & Plano Clark, 2007; Tashakkori & Teddlie, 2010; Teddlie & Tashakkori, 2011). The use of qualitative and quantitative viewpoints in data collection, and analysis allows for the broad purposes of breadth and depth of understanding and corroboration (Johnson, Onwuegbuzie, & Turner, 2007).
Ngulube and Nuglube (2015) indicate that MMR has gained currency in social science research since the 1990s. Despite the growing popularity of MMR in social science, most research articles using MMR have thus far emanated from developed countries. The results of a search of the literature of MMR use in African countries, however, revealed very little evidence that MMR has been used. In sub-Saharan Africa in particular, there is limited discourse around the use of MMR in the social sciences (Ngulube, 2010). For example, Ngulube (2010, p. 257) reviewed 685 peer-reviewed articles to establish the prevalence and use of MMR in library and information science in sub-Saharan Africa. Of these, only 48 (7%) used MMR, while 272 (40%) and 365 (53%) used quantitative and qualitative methods. According to Teye (2012), the use of MMR in social research is limited in sub-Saharan Africa because of problems associated with integrating research findings across methods and conflicts in data interpretation. Recently, Ngulube and Ngulube (2015, p. 6) carried out a content analysis of 332 articles published in The South African Journal of Economic and Management Sciences from 2003 to 2011 to determine the proportion of articles using MMR in economic and management sciences in South Africa. Their analysis revealed that MMR designs accounted for only 4 (2%) of the 332 articles published.
As the studies above show, the application of MMR in health policy and poverty-related issues in Africa is relatively sparse and is new (Ridde & Olivier de Sardan, 2015). A small number of studies, however, have deployed MMR and have underscored the importance of MMR in health policy research in Africa (Brenner et al., 2014; Chirwa, Kazanga, Faedo, & Thomas, 2013; Ridde & Olivier de Sardan, 2015). In policy evaluation, for example, Brenner et al. (2014) argue that for developing countries MMR allows to comprehensively capture the complexity of the impact measures and to yield sufficient credibility and validity of the resulting impact estimates. Indeed, Hargreaves et al. (2007) suggest that the integration of qualitative and quantitative methodologies is essential in generating data for health policy formulation in developing countries. Further, in an MMR study in Zimbabwe, Mushongah and Scoones (2012) argue that this approach illuminates our understanding of the complex dynamics of poverty and helps in identifying and exploring the processes of policy change over time. Accordingly, Ridde and Olivier de Sardan (2015) call for an increased application of MMR in public health policies in Africa—for improving program design and implementation. In an attempt to draw from the affordances of MMR and contribute to the small, but growing literature, this article seeks to develop criteria for identifying very poor households for health insurance premium exemptions.
Health Insurance and the Challenge of Identifying the Very Poor in Ghana
The backdrop of this study is the National Health Insurance Scheme (NHIS), Ghana’s key social intervention policy. The NHIS was implemented in 2003 by an Act of parliament to replace the out-of-pocket payment medical care system (known as “cash and carry”), where patients in need of health care had to pay cash at the point of demanding health care. The core mandate of the NHIS is to ensure equity in access to health care for the poor and vulnerable groups, and protect them against financial risk (Government of Ghana, 2012).
The NHIS covers 38% of the population and has increased the utilization of both outpatient and inpatient services. The National Health Insurance Authority ([NHIA] 2013) reports that outpatient utilization of health care services increased from 23.9 million in 2012 to 27.35 million in 2013, while inpatient admissions increased from 1.43 million in 2012 to 1.61 million in 2013. However, one drawback of the NHIS is that the increased utilization of health care services disproportionately benefits the better-off in society. For example, research shows that 72% of insured people consulted a medical doctor when ill, whereas 28% of uninsured consult either drugstores or traditional birth attendants (National Development Planning Commission, 2009). For the very poor who are uninsured in Ghana the treatment of ailments is done at home and include visiting unqualified drug dealers and risking childbirth at home without professional health care (Oxfam International, 2011). Estimates suggest that 24.2% of the population is poor, while 8.4% is extremely poor (Ghana Statistical Service, 2014).
Importantly, the NHIS policy exempts the very poor from paying annual health insurance premiums with the aim of attaining universal health coverage. Nevertheless, after 10 years of implementation, the NHIS has struggled to include the very poor—defined as “those whose standard of living is insufficient to meet their basic nutritional requirements even if they devoted their entire consumption budget to food” or those people with a sustained incapacity to pay for minimum health care (Ghana Statistical Service, 2014, p. 9; Ridde et al., 2010). Available statistics from NHIA show that the very poor are not adequately covered by the NHIS. For example, the NHIA annual reports for 2009-2011 indicate that only 2.3%, 1.4%, and 4.2% of the very poor were covered by the NHIS (NHIA, 2011). These reports attribute the low coverage of the very poor to the difficulty in identifying them for health insurance premium exemptions. To address this issue, this article uses MMR to establish criteria for identifying very poor households for insurance premium exemptions in Ghana.
Conceptual and Theoretical Rationale for MMR
According to the literature, MMR are used in studies for five reasons: triangulation, development, initiation, expansion and complementarity (Bryman, 2006; Greene, Caracelli, & Graham, 1989; Hesse-Biber, 2010). Triangulation refers to the use of both qualitative and quantitative methods in studying the same research question in order to examine the same dimension of a research problem (Bryman, 2006; Greene et al., 1989; Hesse-Biber, 2010). In triangulation, the researcher looks for convergence of the data collected by all methods in a study to enhance the credibility of the research findings (Hesse-Biber, 2010).
Development is the second reason for using MMR. Development “seeks to use the results from one method to help develop or inform the other method” (Greene et al., 1989, p. 259). Fetters, Curry, and Creswell’s (2013) concept of building is similar to the concept of development explained here. Initiation “seeks the discovery of paradox and contradiction, new perspectives of frameworks, the recasting of questions or results from one method with questions or results from the other method” (Greene et al., 1989, p. 259). Hesse-Biber (2010) explains that in initiation, a study’s findings may raise questions or contradictions that will require clarification, thus initiating a new study. Expansion “seeks to extend the breadth and range of inquiry by using different methods for different inquiry components” (Greene et al., 1989, p. 259). The fifth reason for using mixed methods is complementarity—using the strengths of one method to enhance the performance of the other (Morgan, 1998). When focusing on complementarity, mixed methods are used to measure not only overlapping but also different facets of a phenomenon, allowing the researcher to gain a fuller understanding of the research problem and/or to clarify a given research result (Greene et al., 1989; Hesse-Biber, 2010).
Among these different affordances, the major driving force for adopting an MMR for this study is complementarity. Complementarity is important because poverty—defined as the deprivation of basic capabilities and necessities, including food, income, access to health, and access to education (Sen, 2009), can only be understood by taking into account multiple perspectives (Alkire, 2011). For this research, MMR can support the exploration of the following objectives:
To understand community perspectives used to identify the very poor in the Kassena-Nankana District
To understand what patterns characterize the very poor
To assess the distribution and predictors of households affected by poverty in the district.
The first and second objectives address issues of identifying the very poor based on the local residents’ perceptions or definitions of poverty in light of their existential experiences. In this regard, these objectives are more exploratory, as there are no fixed answers to them. This makes qualitative techniques more readily applicable to this study as they are often used to explore specific issues (Merriam, 2009). The third objective seeks to quantify or estimate the number of the very poor, and quantitative research techniques such as surveys offer better insights in this regard (Creswell, 2014).
Research Methodology
An exploratory sequential mixed method research design was deployed to gain a comprehensive understanding of communities’ perceptions about poverty and to empirically establish criteria for identifying the very poor. Methodological integration occurred through building and merging.
Qualitative Data Collection Strategies
Purposive sampling was used to select opinions leaders/key informants and very poor people from three communities from different zones in the Kassena-Nankana District for focus group discussions. The Kassena-Nankana District is located in Northen Ghana and is zoned into five geographical areas—South, North, East, West, and Central zones. The selected communities—Kologo, Pungu-Nyangua, and Nogsenia are located in the Southern, Northern, and Central zones, respectively. While Kologo is a rural community, Pungu-Nyangua and Nogsenia are peri-urban and urban communities. On average, the focus group discussions consisted of 6 to 10 members which enhanced group interaction, yielding both variety of opinions and good participation. Key informants were used in the various communities to recruit people they perceived to be very poor to participate in the focus group discussions. A total of 24 focus group discussions were conducted with 8 held in each community. These 8 were then further divided into male only and female only groups (a total of 12 male and 12 female groups). Separate focus group discussions were conducted with men and women since in Ghana, older men tend to dominate younger women in decision making. For example, in social gatherings, such as focus group discussions younger women may not freely express themselves on issues of importance. For this reason, the gender-specific focus group discussions offered all the participants a comfortable setting to freely express their opinions with respect to the subject matter. In terms of group dynamics, most of the participants in both the male and the female focus group discussions took turns to express their viewpoints on the subject matter. The rationale for holding focus group discussions with the key informants/opinion leaders and the very poor groups separately is guided by the idea that key informants’ ideas about priorities for communities may not reflect the views of ordinary community members, particularly the very poor (McKenna & Main, 2013). By engaging the different groups, the authors believe that it was possible to learn about a particular research context through the ongoing collaboration and participation of local residents. This contextual learning by researchers not only lends credibility to the research results more but also validates the research findings and their significance for specific communities (McKenna & Main, 2013).
The focus group discussions were first recorded and transcribed. The authors read through all the transcripts and identified the key issues of interest in line with the research questions—six themes emerged from the transcriptions, which yielded a diversity of viewpoints and a large quantity of detailed information, as illustrated in Table 1.
Communities’ Views of Indicators for Identifying the Very Poor.
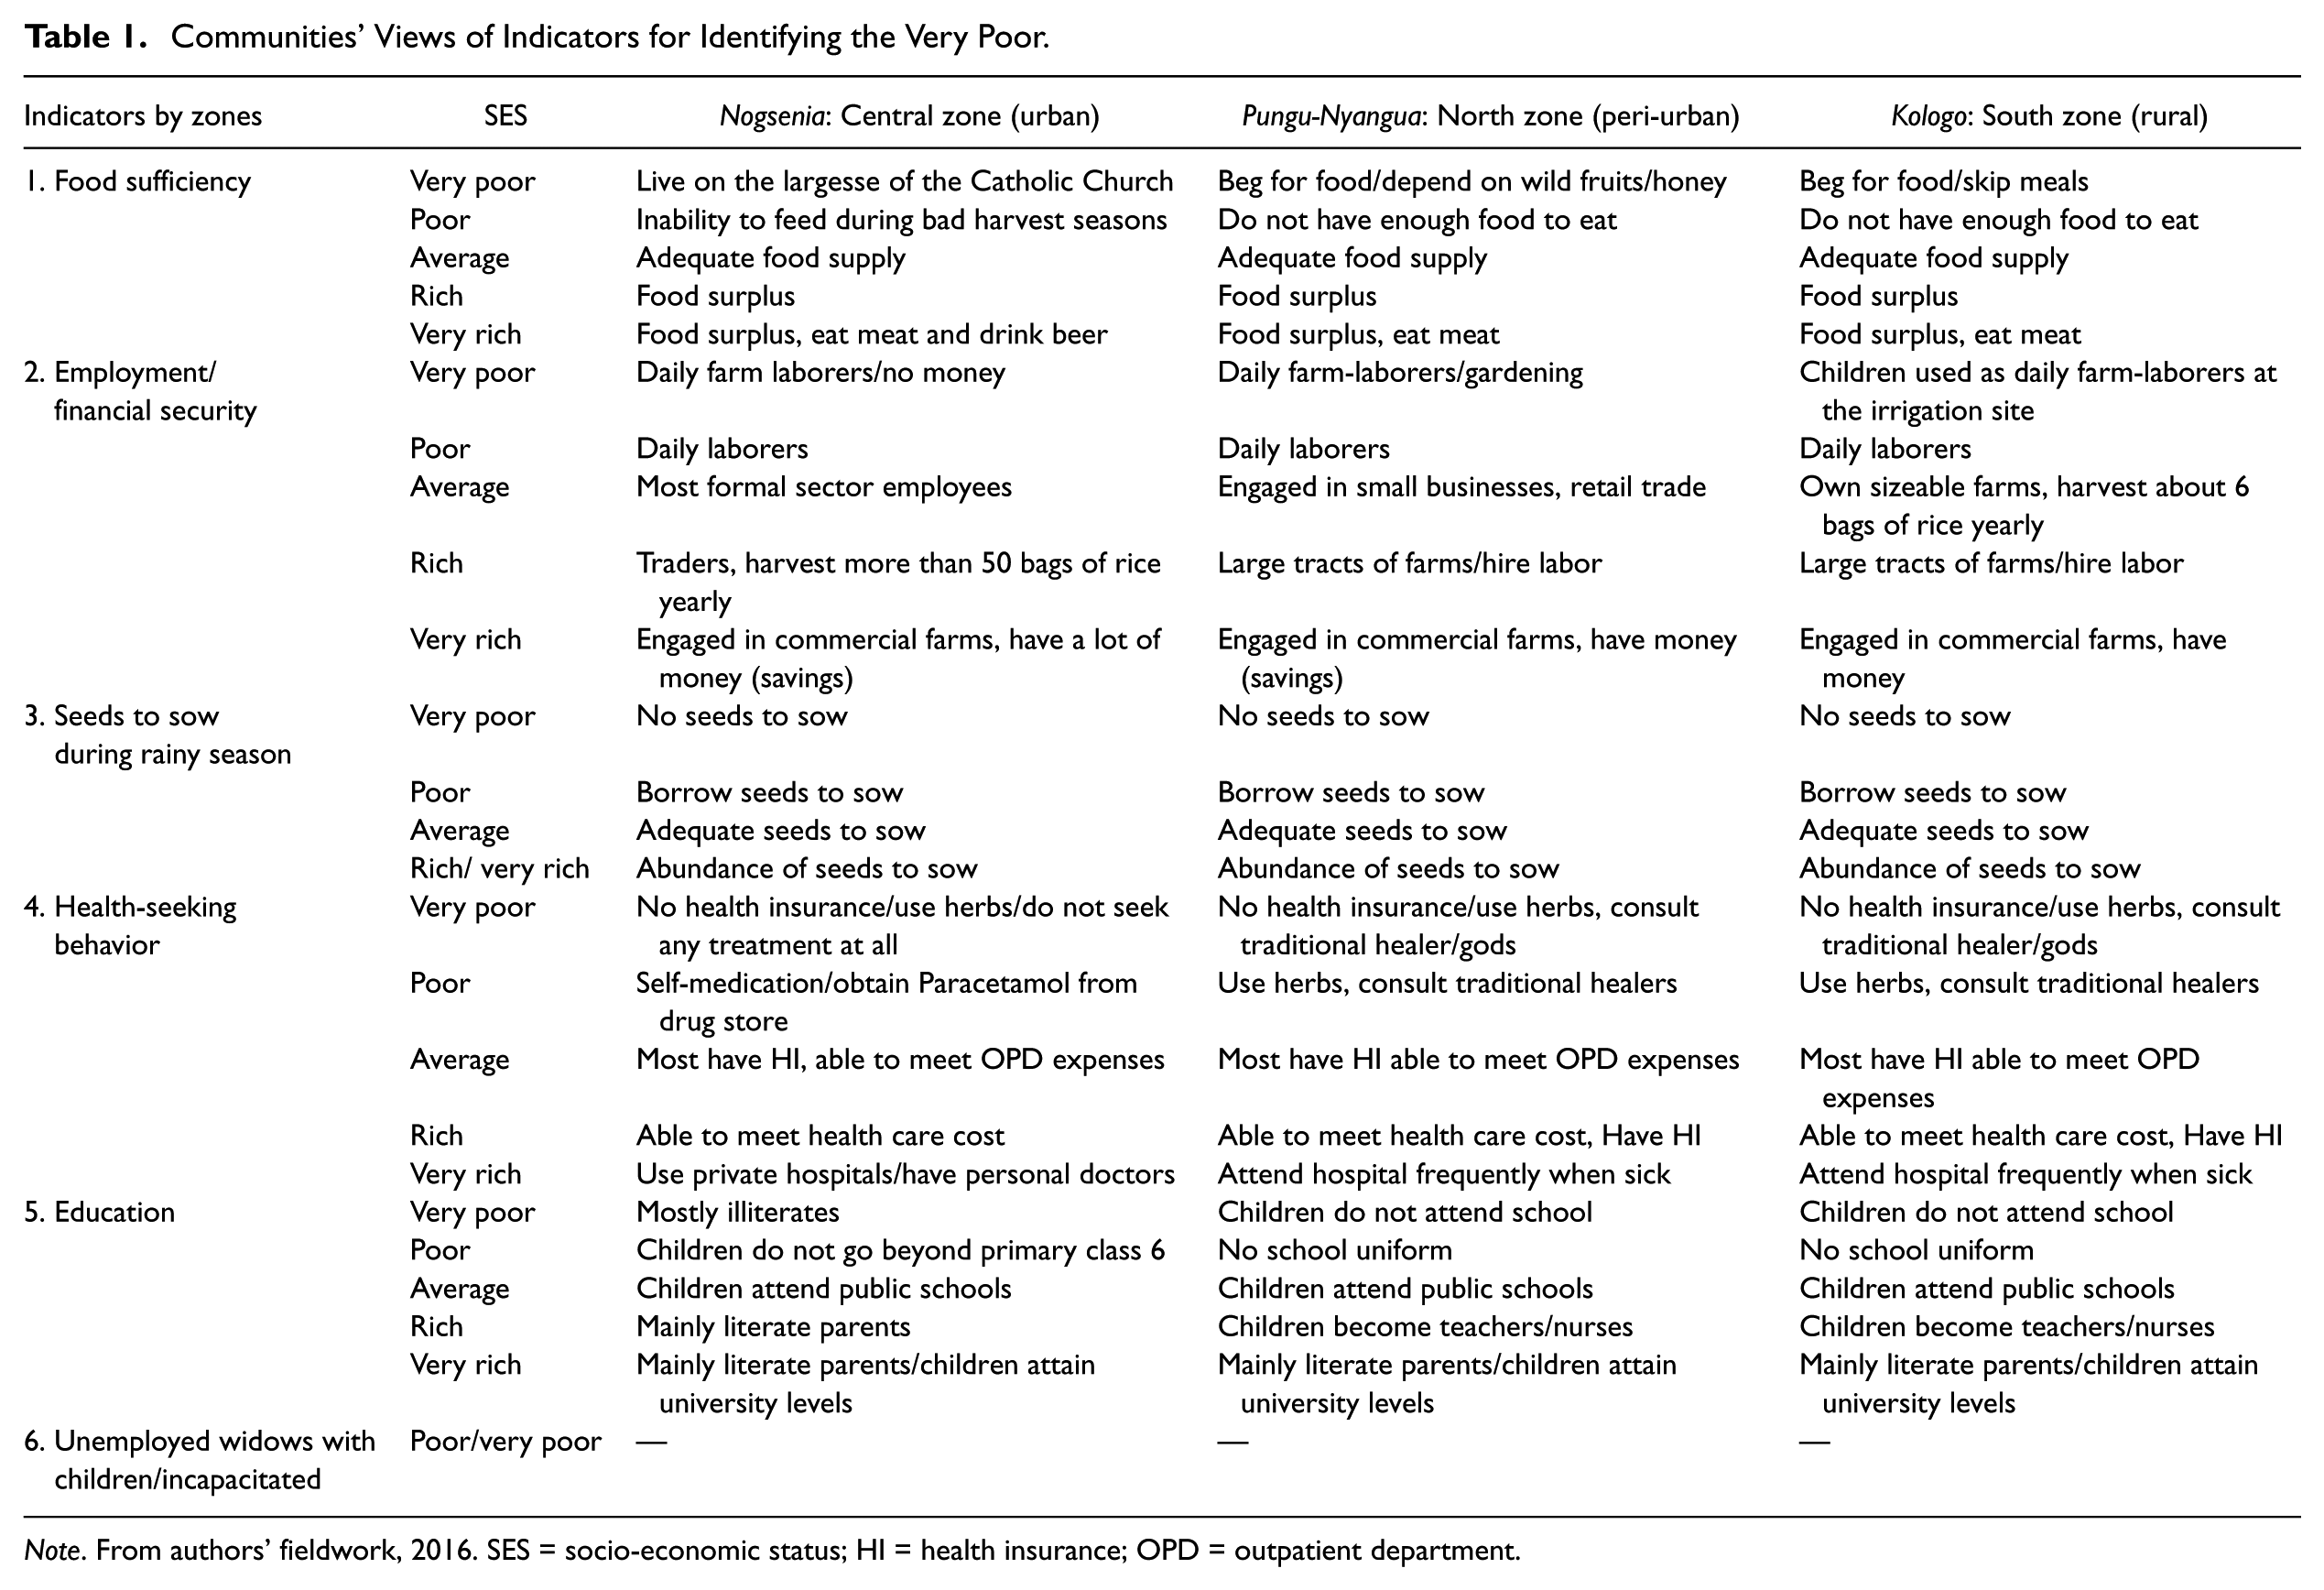
Note. From authors’ fieldwork, 2016. SES = socio-economic status; HI = health insurance; OPD = outpatient department.
Quantitative Survey Procedures
The information obtained from the context-specific themes in the qualitative data set was used to build a quantitative questionnaire and administered in a cross-sectional study of 417 household heads or adults in the household who are responsible for the household welfare and make financial decisions about whether or not the household enrolls in health insurance. The questionnaire covered 56 items, which were designed to capture information on the socio-demographics of the respondents, the health insurance status of their households, the health expenditures, assets and possessions of the households, and the predictors of household poverty status. The questionnaire was pilot-tested to minimize response bias in the data collection process and to establish the content validity of the study (Creswell, 2014). A multi-stage sampling procedure was deployed. This procedure resulted in the random selection of three out of the five zones in the study area. At the end of the survey, 417 questionnaires were completed, representing a 95% response rate for all the three areas sampled, yielding information for a total population of 2,173 individuals.
The household data were entered into a database using Epidata. Double entry was done to minimize errors. The data were analyzed using STATA Version 12.0. A poverty index was generated using principal component analysis (PCA) to determine the socio-economic status of the households. PCA is a statistical procedure which is used to determine weights for a linear index of a set of variables (Filmer & Pritchett, 2001).
Using the poverty or socio-economic status index generated by the PCA, the sampled population was dichotomized into poor and not poor categories, based on the household possessions and assets. The sample was dichotomized because an initial division into quintiles was unproductive due to a lack of heterogeneity between the different categories. The dichotomization also allowed for a logistic model specification.
To predict or identify the very poor households, the predicted probabilities of being poor were used, based on the fitted logistic model. In view of the different probabilities of being poor generated for different households, coupled with the fact that there had not been any prior statistical guide to identify very poor households, a cut-off point had to be determined. The authors decided that households would be considered very poor and thus eligible for exemption from paying health insurance premiums if their predicted probabilities of being poor were 75% and above. The 75% and above probabilities cut-off point was chosen because the poor households were divided into quartiles with the upper quartile (75%) representing the very poor among the poor. Based on this cut-off point, a new variable “exempt” was generated in an effort to determine the number of households, which should or should not be exempted from paying insurance premiums.
To compare exempt and non-exempt categories, integration through merging was done to bring the qualitative and quantitative results together. In the merging process, the quantitative statistical results were supported by the qualitative quotes from the focus group discussions. Integration of qualitative and quantitative data at the interpretation and reporting stage of the study occurred through a contiguous approach. The MMR design deployed in the study is illustrated in Figure 1.
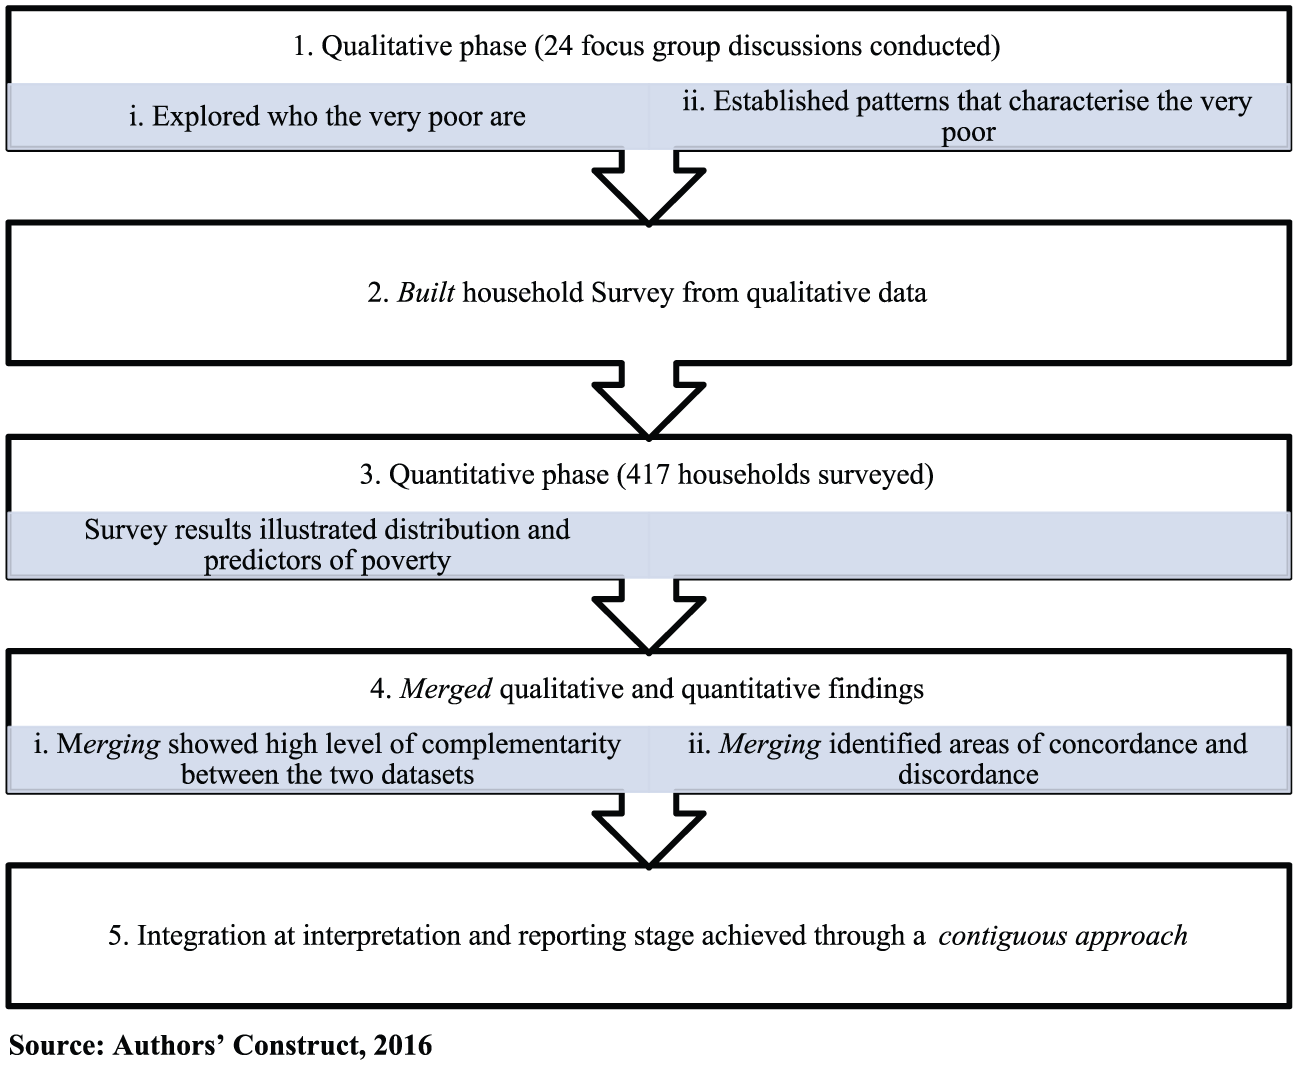
An illustration of an exploratory sequential Mixed Methods Research design deployed in the study.
Results
Qualitative Results
Communities’ Views of Indicators for Identifying the Very Poor
During the focus group discussions, a number of indicators of poverty emerged from the communities’ perceptions. The indicators highlight the material differences between the very poor and the other seemingly more well-off socioeconomic groups. Some of these indicators are summarized in Table 1.
As illustrated above, the communities provided five of the suggested indicators for the purposes of identifying very poor households: food insecurity, lack of seeds to sow, compromised access to education, inadequate income, and status as unemployed widows with children.
Food Insecurity
Food insecurity appeared to be the most consistent descriptor of poverty in almost all the communities surveyed. Both the key informants/opinion leaders and the very poor groups of people highlighted hunger as a classic experience of poverty resulting in a threat of starvation on a daily basis. One woman decried her huge responsibility of providing food for her children in graphic terms:
For poverty, it is we women who suffer a lot. As I talk, I don’t have anything but my children are many. When my husband wakes up, he doesn’t care whether the children have eaten or not, that’s my responsibility. (Focus group discussions with very poor women in Pungu-Nyangua, North zone, Authors’ fieldwork, 2016)
Another participant narrated his experience as follows:
As I sit, I have eight children to take care of. None of us has health insurance. I can’t even get food for them, let alone talking of their school fees. (Focus group discussions with very poor men in Pungu-Nyangua, Authors’ fieldwork, 2016)
Similarly, two residents from Kologo in the Southern zone supported food insufficiency as a key descriptor of poverty as follows. The first resident stated:
We did not know money in the past because when we farm we get good yield. Our land has become so infertile that, when we farm, we don’t get anything [food]. All this is poverty.
The second resident remarked:
Money has spoiled everything because everyone wants to have more money. In those days, when you entered a house, everything belonged to the landlord and so things in the house belonged to everyone. It was not easy for you to know who was poor and who was rich. (Focus group discussions with key informants/opinion leaders, 40 years and older in Kologo, Authors’ fieldwork, 2016)
A crucial point from the four narratives above is that money and assets are not the best way to identify very poor individuals or households.
Lack of Seeds to Sow
One of the most striking indicators of very poor households is their lack of seeds to sow during the rainy season. According to participants in the focus group discussions this lack arises among the very poor because they consume everything at their disposal. Consequently, some of the very poor beg for seeds from their neighbors and others just watch helplessly while their neighbors carry out their farming during the rainy season, as borne out by the following statements from two participants:
When the rains set in, everybody gets busy on his/her farm and I just sit and watch, not because I am lazy but because I don’t have the seeds. (Focus group discussions with very poor men in Pungu-Nyangua, Authors’ fieldwork, 2016)
The second participant remarked:
The pain of having to go and beg for seeds when everyone is busy sowing, is more deadly than physical illness. (Focus group discussions with very poor men in Pungu-Nyangua, Authors’ fieldwork, 2016)
The two quotes above also illustrate the importance and self-esteem individuals or households attach to having their own seeds to sow rather than going to beg for them.
Access to Education
Access to education was also highlighted as a key descriptor of household poverty status. The focus group discussions revealed that the very poor could not afford to keep their children in school beyond primary class 6 as the quote below reveals:
School is for the rich people because they touch money every day. A very poor person like me cannot afford school fees. Because our children don’t go school to become big people in future, we remain in poverty. You know, poverty is like fire. Every day, the fire burns you but you won’t die. You know when you die; it is better than when you are suffering. (Focus group discussions with very poor people at Pungu-Nyangua, Authors’ fieldwork, 2016)
Parents who do manage to keep their children at the public local authority school until primary class 6 are often not able to afford the local school uniform. These parents then clothe their children in patched dresses of variegated textiles. Unfortunately, these children are often driven away from school because they are not wearing the prescribed school uniform. The quote below attests to this claim:
That is my son sitting over there. He didn’t go to school. The other day he went to school and he was driven away because he was not wearing the uniform. Look at what he is wearing, these are “rags.” He can’t wear these rags and attend any function not to talk of school. (Focus group discussions with very poor people at Pungu-Nyangua, Authors’ fieldwork, 2016)
Inadequate Income
Inadequate work and hence income was also reported as a sign of household poverty status, as revealed in the statement below:
Poverty is when there is no work for you to do and get money. We don’t have work. That is why the poverty is worrying us here. (Focus group discussions with key informants/opinion leaders, men 40 years and older in Kologo, Authors’ fieldwork, 2016)
Status as Unemployed Widows With Children
The focus group discussions further indicated that marital status was an important indicator of poverty in the study context. Unemployed widows with children were highlighted in particular as a key predictor of poverty, as borne out by the following statements from two women:
We are all suffering from poverty. If you don’t have a husband but you have children it means you are going to suffer. I am actually suffering with my children. There is no one to help me pay for health insurance. (Focus group discussions with very poor women at Pungu-Nyangua, Authors’ fieldwork, 2016)
The second woman also remarked:
I am also in the same situation. My husband is not there (dead) and he has left with me children. How to feed them alone is a problem, getting their school fees and dresses is not easy for me at all. All this is poverty. (Focus group discussions with very poor women at Pungu-Nyangua, Authors’ fieldwork, 2016)
All of the indicators were ranked by the study participants in the three zones, the results of which are presented in Table 2. Importantly, if the staff of the health insurance scheme are aware of this set of five indicators they may easily conduct poverty assessment.
Communities’ Suggested Indicators for Identifying the Very Poor.
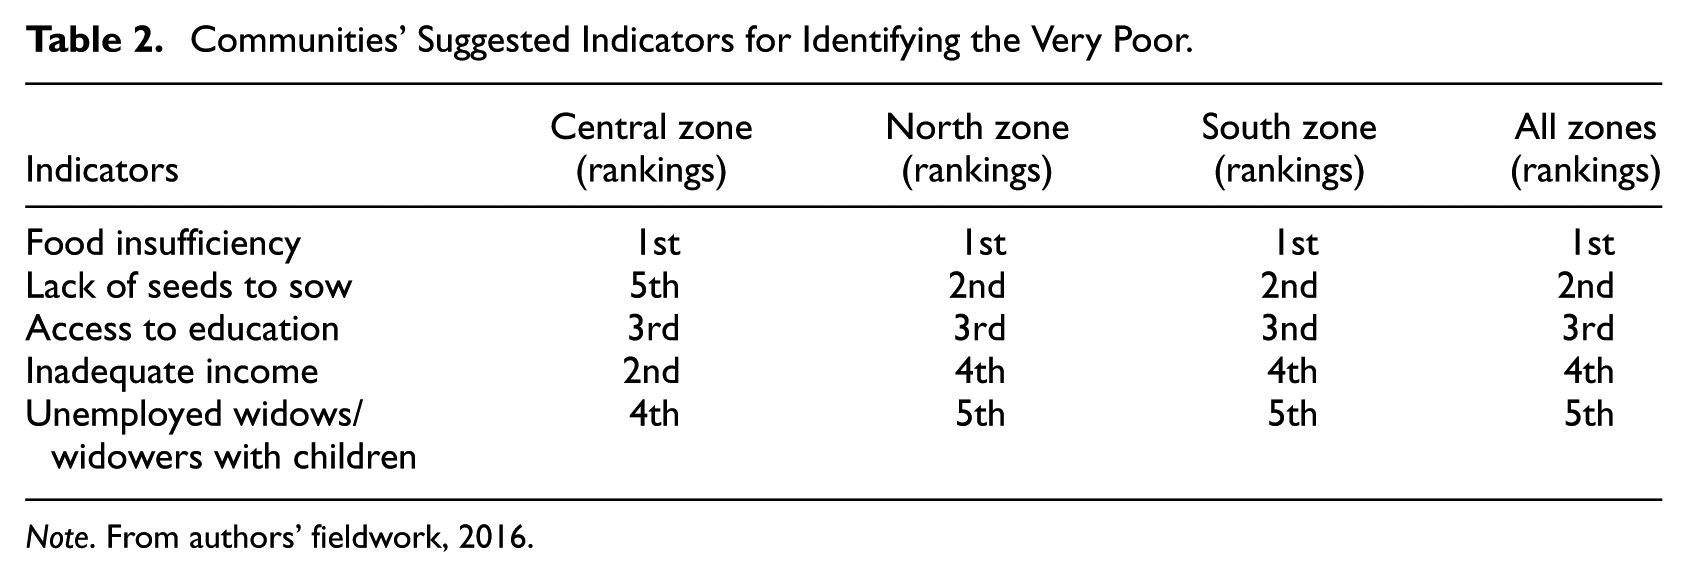
Note. From authors’ fieldwork, 2016.
Quantitative Results
Descriptive Summary Characteristics of Respondents
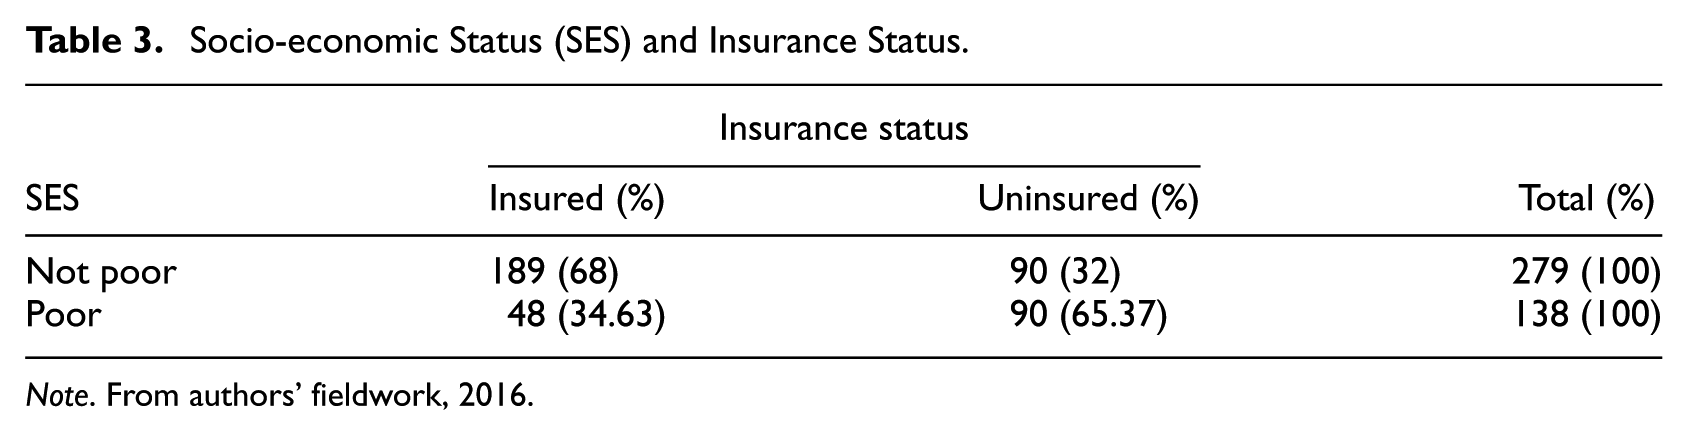
In the questionnaire study males and females constituted respectively 72% and 28% of the household heads. Additionally, 74% of the study population was married, whereas 19% had been widowed. The majority (55%) of the study population had never been to school, whereas 8% only had reached the tertiary level of education. Sixty percent were farmers, whereas 7% were unemployed. Within the group 67% were covered by health insurance. The study established that socio-economic status was associated with insurance status provided in Table 3.
Socio-economic Status (SES) and Insurance Status.
Note. From authors’ fieldwork, 2016.
As Table 3 shows, households that were not poor were far more insured than poor households. Nearly two thirds (65%) of poor households are not insured because they cannot afford the cost of the health insurance premiums. This study further showed that 30 households, representing 58% of the 52 very poor households were located in the Southern zone; 14 (27%) of the households were located in the Northern zone, while the remaining 8 (15%) of the households were located in the Central zone.
Model for Identifying the Very Poor: A Logistic Model Specification
The results of the logistic regression presented in Table 4 show that income, access to education, gender of household head, marital status of household head, and food insecurity are good predictors of household poverty status.
Logistic Regression Model of Predictors of Household Socio-economic Status (SES).
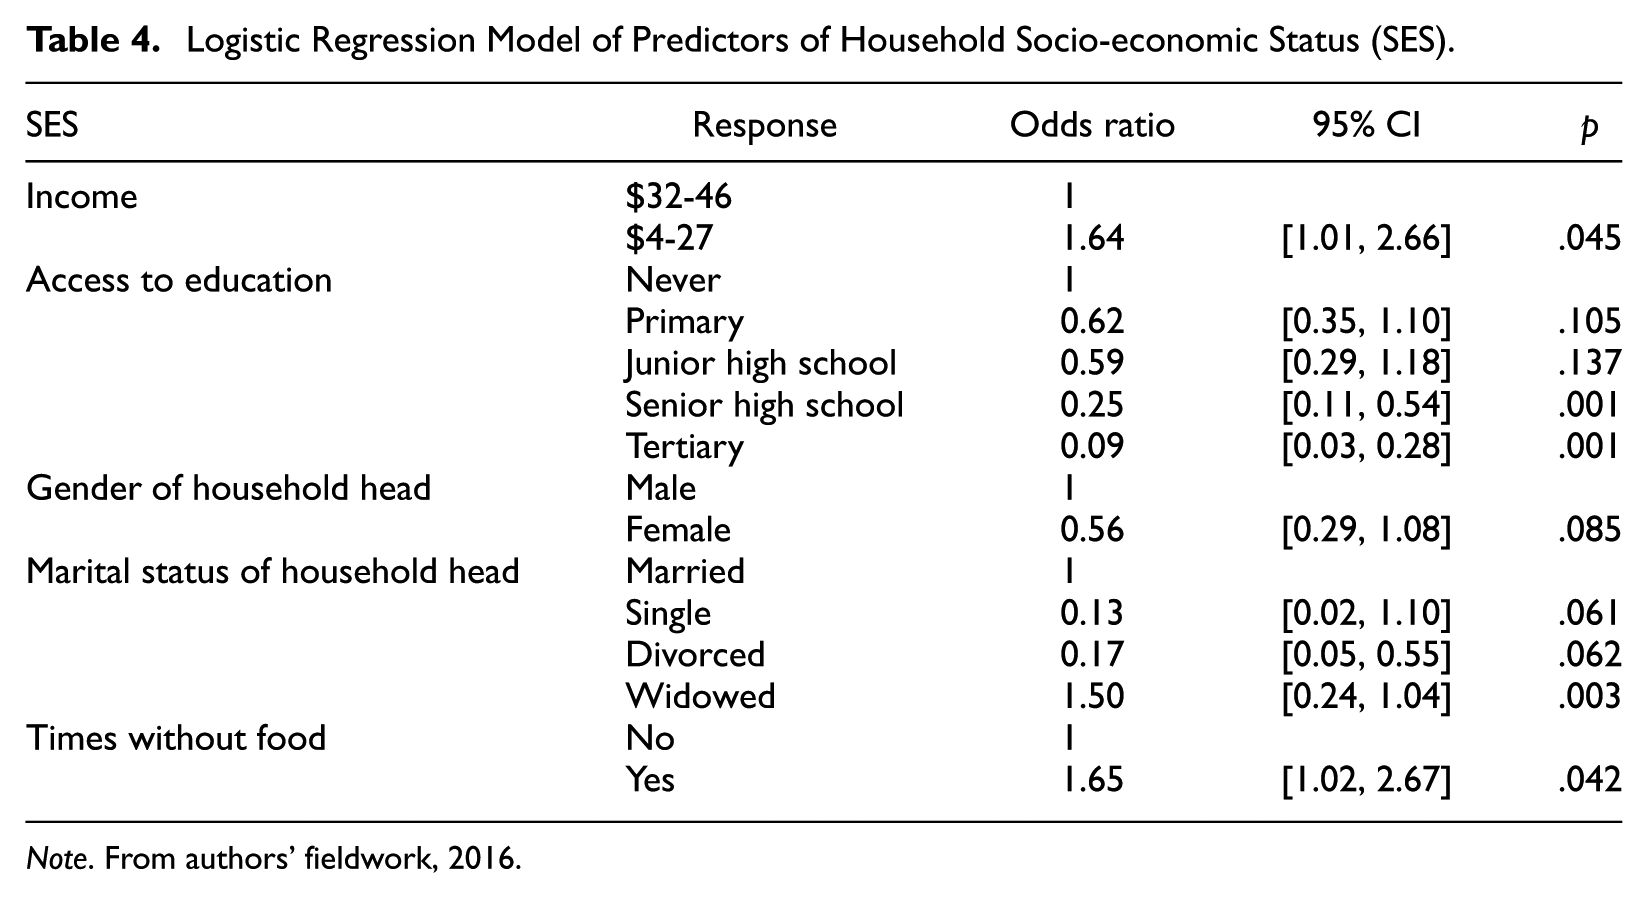
Note. From authors’ fieldwork, 2016.
Inadequate income
Like the qualitative results, inadequate income is found to be a good predictor of poverty. Table 4 shows that households that earn a monthly income of between $4 and $27 are more likely to be poorer as compared with households that earn between $32 and $46. The odds ratio of 1.64 indicates that households that earn between $4 and $27 a month are approximately twice as likely to be poorer as compared with households that earn $32 and $46. The odds are also statistically significant (p = .045)
Access to education
Similarly, the explanatory power of education as a predictor of household poverty status is quite glaring as illustrated in Table 4. As shown in Table 4, as the level of education of household heads increased, so the odds of being poor decreased greatly. The odds of being poor for household heads with tertiary levels of education were only 9% as compared with that of household heads with no education at all. The odds ratio is statistically significant (p = .001).
Gender of household head and marital status
Additionally, the quantitative results suggest that gender was an indicator of poverty. The logistic regression in Table 4 illustrated that female-headed households were 44% less likely to be poorer as compared with their male-headed counterparts. The quantitative results further highlighted marital status as a predictor of poverty. Table 4 established that households headed by widows were almost 2 times more likely to be poorer as compared with households where the household heads were married. This result was highly statistically significant (p = .003).
Food insecurity
The quantitative results also highlighted food insecurity as a predictor poverty. The results in Table 4 illustrate that households that had been without food at least 3 times in the last 30 days preceding the survey were more likely to be poorer as compared with households that had not. In fact, the reported odds ratio of 1.65 suggests that households that had been without food were nearly 2 times more likely to be poorer than those that had not. This ratio is statistically significant (p = .042).
The results presented in Table 4 do not reveal the actual number of households among the poor households that were very poor and deserving health insurance premiums exemptions. Thus, the authors sought to determine the actual number of households that are very poor. Using the 75% probability of being poor cut-off point explained earlier, the logistic regression model predicted that 52 (12.5% of the households as shown in Table 5) in the sampled population were very poor. This means 52 households should be exempted from paying health insurance premiums.
Exempt Households and Insurance Status.
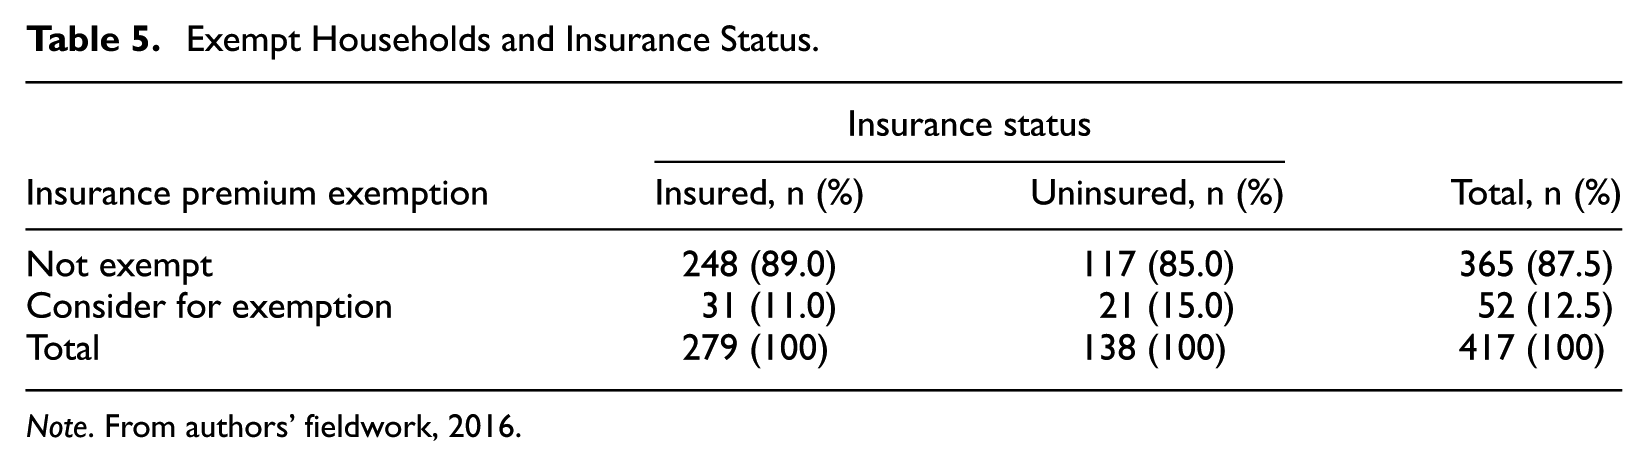
Note. From authors’ fieldwork, 2016.
Discussion
Concordance of Qualitative and Quantitative Data
The merging of the data allowed us to identify areas of concordance and discordance between qualitative and quantitative results. The two measures agreed in terms of food insecurity, access to education, inadequate income, and marital status as predictors of poverty in the study area. The finding of food security as a predictor is consistent with previous studies. Ezeoke, Onwujekwe, and Uzochukwu (2012) argue that apart from selling household assets and borrowing, one critical way in which poor households manage their poverty is reducing household consumption, although this impacts negatively on their health status. The finding of access to education as a predictor is in line with extant theory. For example, knowledge in the form of education acts as a catalyst for both individual civic participation and for higher levels of household well-being (Sen, 1999). Thus, education leverages knowledge in the households in the form of acquired skills and innovative ideas—heads of households with tertiary levels of education are more employable in better paid jobs as compared with the heads of households with no such education. The finding of inadequate income as a core predictor of household poverty status supports earlier findings. Sen (1999) argues that low income contributes to poverty in the form of hunger and undernourishment. Remarkably, the qualitative and quantitative results complement each other with respect to marital status and poverty status with both indicating that widows deserved health insurance premium exemptions. This finding makes sense because a couple is probably better placed to pool resources to manage household poverty as compared with a widow or widower especially, should either the widow or widower be unemployed. The concordance or complementarity between the indicators that emerged from the qualitative data and those from the quantitative data reflect a high degree of credibility in the MMR design.
Discordance of Qualitative and Quantitative Data
The merging of the data also highlighted areas of disagreement or discordance. Discordance occurs “if the qualitative and quantitative findings are inconsistent, incongruous, contradict, conflict, or disagree with each other” (Fetters et al., 2013, p. 2144). The first area of discordance is that while the qualitative data suggested that women or female-headed households are poorer as compared with their male counterparts, the household survey suggested otherwise. Corroborating this finding, the Ghana Statistical Service (2014, p. 19) indicated that, between 2012 and 2013, 26% of male-headed households were poor, whereas 19% of female-headed households were poor. Remarkably, all the 52 households identified as very poor in this study are headed by males. Despite our finding, Matsa (2011) suggests that poverty in Africa is feminized because female-headed households lack access to and control over resources, such as land, as compared with their male counterparts. Isangula (2012) concurs with this viewpoint claiming that women are naturally disadvantaged in Africa while more women than men live in poverty in Africa.
The second area of discordance is that while the indicator lack of seeds to sow was ranked second in the focus group discussions, it did not even appear in the logistic regression model in the quantitative analysis. This indicator is very revealing and interesting because it again points out strongly that money and assets are not necessarily the best way to identify the very poor individuals especially in the rural setting. It underscores the powerful role of integrating both qualitative and quantitative methods in a single study as synergy between the two methods is enhanced and the additional work of doing MMR has “added value” to the overall research findings (Fetters & Freshwater, 2015).
When merging the criteria from the focus group discussions and the logistic regression model, the final proposed model or criteria for identifying the very poor contained the following variables:
Food insecurity
Status as unemployed widows with children
Lack of own seeds to sow
Compromised access to education
Inadequate income
This model is straightforward and can provide a means for the staff of the health insurance scheme to rapidly assess the poverty situation of a household during a short visit as the criteria are verifiable at the community level. However, because society is dynamic, these criteria need to be updated periodically to ensure that they reflect the realities of poverty based on societal changes and dynamics [on the ground and not based on ‘leadership’ opinions].
Health Care Policy Implications
This study allows us to derive some health care policy implications that should be considered by all spheres of governance in Ghana to identify very poor households for health insurance premium exemptions. By taking the results into account, the government can take transformative actions. First, the study proposes a four-question survey for the management of the Kassena-Nankana District Health Insurance Scheme to administer to determine extreme poverty namely: food insecurity, lack of seeds to sow, status as unemployed widows with children, and compromised access to education. These criteria may be easy to apply since they could be verified empirically at the community level. The study findings could be implemented on a pilot basis to determine their practicability and acceptability. Second, the findings imply that the Ministry of Finance should increase the financial budget for subsidizing the insurance premiums of the very poor, and ensure that the funds are released in a timely manner to the District Health Insurance schemes. Third, other District Health Insurance Schemes could carry out similar exercises to determine context-specific criteria for identifying the very poor by following the procedure used in this study. Fourth, the management of the Kassena-Nankana District Health Insurance Scheme and the National Health Insurance Authority should review these criteria periodically, at least every 3 years to ensure that they are working well, and that communities continue to accept them.
In summary, these findings imply that with these criteria, many more very poor households could be identified and exempted from paying insurance premiums. This may pave the way for the NHIS to increase access to health care for the very poor in Ghana.
Methodological Implications
Implications for MMR Integration
The application of the methods revealed a high level of “fit” of data integration—coherence of the quantitative and qualitative findings (Fetters et al., 2013). The fit of integration enabled the authors to make important methodological contributions. First, a synthesis of the qualitative and quantitative results showed that the findings were complementary. A comparison of the indicators suggested by the communities during the focus group discussions and predictors from the logistic regression showed great similarity, particularly, with regard to food insecurity, access to education, inadequate income, and marital status. This high level of complementarity in both the qualitative and quantitative results increases confidence in the research findings (Luyt, 2012). To verify the study’s conclusions and to make the conclusions robust in terms of both qualitative and quantitative methods triangulation was used to establish cross-validation between methods (Hesse-Biber, 2010). Second, the fact that the indicator lack of own seeds to sow arose in the qualitative data set but did not appear in the quantitative data set is referred to as “silence,” that is, describing a situation where a theme or finding arises from one data set and not another (O’Cathain, Murphy, & Nicholl, 2010). According to O’Cathain et al. (2010), “silence” might be expected because of the strengths of different methods to examine different aspects of a phenomenon, but surprise silences might also arise that help to increase understanding. This surprise silence fits in neatly with the concept of initiation because the discovery of “lack of own seeds to sow” as an indicator of poverty has added a new perspective to the discourse on poverty, and warrants further investigation by policy makers. Last, the issue of discordance or dissonance also came up strongly in this study. While the qualitative results suggested that female-headed households were poorer than their male counterparts, the quantitative results suggested the contrary. The mixed evidence from this study fulfills one of the key objectives of MMR integration. Teddlie and Tashakkori (2011) argue that an important result of combining information from different sources is divergence or dissimilarity and this, in turn, may provide greater insights into the complex aspects of the same phenomenon and/or the design of a new study. For this reason, the mixed evidence from this study is a positive occurrence because the findings provide an incentive for further research to ascertain whether female-headed households are, indeed, less likely to be poorer than the male-headed households. Initiating a new study of this nature again speaks to the concept of initiation. Methodologically this study demonstrates that the integration of qualitative and quantitative data is feasible despite the different epistemological and ontological assumptions associated with them.
Implication for MMR in Africa
These results demonstrate that MMR has the potential for increasing our understanding of complex policy issues such as poverty, equity, and access to health care in Africa. The study illustrates the relevance of MMR as a more innovative and comprehensive methodology for illuminating our understanding of these issues. Therefore, policy issues whether health or other domains are fertile ground for the application of MMR in Africa.
Conclusion
Data integration in MMR design has the potential of increasing our understanding of complex social problems such as poverty and access to health care in Africa where its application is still limited. In integrating qualitative and quantitative data sets through building and merging data, this study has expanded our understanding of MMR with respect to complementarity, silence, initiation, and discordance or dissonance. This study illustrates that the “value added” by the integration of the two methods is surely greater than the sum of the individual qualitative and quantitative parts in isolation.
When merging the results from the qualitative and quantitative data sets the study found that both data sets were complementary and dissonant. Five criteria listed earlier have been proposed for identifying the very poor for insurance premium exemptions in the Kassena-Nankana District in Ghana. The criteria are likely to be accepted as they are based on local communities’ definition of poverty. These criteria also speak to the fact that money and assets are not the best way to identify the very poor individuals especially in the rural setting. Finally, the study results have a great potential to help in identifying the very poor for social interventions in Ghana, Africa, and beyond. The results further suggest that policy makers must involve local communities in policy formulation and implementation.
Footnotes
Declaration of Conflicting Interests
The author(s) declared no potential conflicts of interest with respect to the research, authorship, and/or publication of this article.
Funding
The author(s) disclosed receipt of the following financial support for the research, authorship, and/or publication of this article: This article is a product of Dr. Kennedy A. Alatinga’s PhD research work. Funding for the PhD research was provided by the German Academic Exchange Services (DAAD). No financial support was received for the authorship, and/or publication of this article.