
Abstract
While health services researchers are using mixed methods research in large-scale studies with “big data” and incorporating data transformation for merging qualitative and quantitative data sets, these developments are not widely known to the broader mixed methods research community. Our purpose in this article is to introduce health services research to the broader mixed methods audience, to examine the potential for novel innovations in mixed methods research procedures, and to illustrate these points through a project on care management that used a convergent mixed methods design. In addition to traditional analytical procedures, we illustrate two qualitative to quantitative data transformation procedures, one using normalization process theory and a second, fuzzy set qualitative comparative analysis.
Distinct from qualitative and quantitative approaches to research, mixed methods has emerged as a third paradigm of research characterized by the integration of rigorously collected qualitative and quantitative data (Burke & Onwuegbuzie, 2004; Fetters, Curry, & Creswell, 2013). Since the publication of one of the early mixed methods textbooks by Creswell in 1994, “Research Design-Qualitative and Quantitative Approaches,” there has been an explosion of interest in mixed methods research. This has been illustrated by the growth in the number of books devoted to mixed methods research. Almost two decades later in 2012, Onwuegbuzie reported that there were 31 textbooks devoted to mixed methods research (Onwuegbuzie, 2012).
Despite many advances in mixed methods research across many disciplines, there remain relatively few examples of methodological issues experienced when investigators use mixed methods research in large-scale studies. Integration of qualitative and quantitative data remains challenging across all types of mixed methods studies (Bryman, 2006, 2007; O’Cathain, Murphy, & Nicholl, 2008), but provides particular challenges when both data sets are unique and very large (Voss et. al., 2015). Solutions to the methodological challenges of merging large qualitative and quantitative data sets are of interest across disciplines. One key procedure for merging involves transformation of qualitative data to quantitative data, or transformation of quantitative data to qualitative data (Pluye & Hong, 2014).
Health sciences researchers have been pushing the development of mixed methods research (Curry & Nunez-Smith, 2015), especially in nursing (Sandelowski, 2000) and family medicine (Borkan, 2004; Creswell, Fetters, & Ivankova, 2004). The attraction of mixed methods research and its acceptance by health sciences researchers are driven by the complexity of the problems that they seek to address (Creswell, Klassen, Plano Clark, & Smith, 2011; Creswell & Plano Clark, 2008). One important measure of the acceptance and legitimacy of any new methodology is whether it receives external funding. In 2010, Plano Clark reported that 23 different National Institutes of Health (NIH) institutes had funded mixed or multiple methods studies since 1996 (Plano Clark, 2010). In addition, the International Journal of Multiple Methodological Approaches published a theme issue on the health sciences in 2011 (International Journal of Multiple Methodological Approaches, 2011). In the same year, the Office of Behavioral and Social Sciences Research of the NIH released the very first NIH mixed methods best practices guidelines, further evidence that mixed methods research was making in-roads into the health sciences. The guidelines were targeted to assist both researchers submitting mixed methods projects, as well as reviewers on study sections who were charged with evaluating the quality of mixed methods proposals submitted for funding (Creswell et al., 2011). Under the broad umbrella of health sciences, mixed methods inquiry has emerged in the highly quantitatively dominated field of health services research (Curry et al., 2013; Plano Clark, 2010).
Mixed methods investigators are pushing the envelope of health services research through large-scale studies, theory development and testing, and the use of novel analytic procedures. The premier journal in the field, bearing the name Health Services Research, featured a special theme issue on mixed methods research in 2013 (Miller, Crabtree, Harrison, & Fennell, 2013). While there have been a growing number of empirical papers (Ivankova & Kawamura, 2010) and health services research grants (Curry & Nunez-Smith, 2015), few authors have explored mixed methods methodological issues in health services research (Curry et al., 2013; Plano Clark, 2010). The need for mixed methods in health services research has been recognized and is achieving growing acceptance (Albright, Gechter, & Kempe, 2013). However, there have been few discussions and examples of applications of mixed methods procedures in health services research targeting the broader mixed methods research community. A basic explanation of health services research and the challenges and opportunities health services research presents for mixed methods research should be of interest to the broader mixed methods community.
The purpose of this article is to provide an overview of health services research to the multidisciplinary audience of the Journal of Mixed Methods Research, to examine the potential for novel innovations in mixed methods research procedures, and to illustrate these points through a large-scale health services research investigation on care management implementation in primary care. This illustration includes an in-depth presentation of the problem, the use of a convergent design, the approach to integration of theory, and two data transformation procedures using large qualitative and quantitative data sets.
An Overview of Health Services Research
A specific subfield of the health sciences, health services research examines how people access health care practitioners and health care services, how much care costs, and what happens to patients as a result of this care (Academy Health, 2014). Studies in health services research investigate how social factors, financing systems, organizational structures and processes, medical technology, and personal behaviors affect access to health care, the quality and cost of health care, and the quantity and quality of patients’ life. A relatively young science in comparison with medical research, health services research developed through the bringing together of social science perspectives with the contributions of individuals and institutions engaged in delivering health services (Gilson et al., 2011).
The goals in health services research are to improve patient outcomes while increasing efficiency and managing the unsustainable growth in cost, a particularly compelling challenge in the United States, but increasingly a problem in many rapidly aging countries in Europe and Asia. Within the past 10 years in the United States, there have been many new initiatives in health care to achieve these goals, including payment reform (e.g., pay-for-performance), meaningful use of electronic medical records and data, and the patient-centered medical home (HealthIT.gov, 2014; National Committee for Quality Assurance, 2011; Peikes, Zutshi, Genevro, Parchman, & Meyers, 2012; Terry, Brown, Bestard Denomme, Thind, & Stewart, 2012). Additionally, the Affordable Care Act has given millions of new patients, mostly those previously uninsured, access to health care and has led to changes in how health care is organized (Davis, Abrams & Stremikis, 2011; Meek, 2012; U. S. Government, 2010). The need to know what forms of health care delivery work and what can work most effectively at the lowest cost has never been greater and accentuates the need for contemporary health services research.
Potential for Novel Innovations in Mixed Methods Research Procedures
Mixed methodologists have several reasons to take interest in health services research, as some of its features are relatively distinct from research in other fields and provide opportunity for novel applications and developments in mixed methods research procedures. First, health services research is often exemplified by the use of population level data from very large quantitative data sets. This “big data” can present researchers with analytical challenges such as clustering of patients within providers within practices, data being classified as missing (because the patient did not present for a health care visit and/or the data were not captured), or inaccurately entered data due to user error or because it was not collected for research purposes. Interpretation of these data challenges researchers as the true meaning of inputted data may not always be clear. For example, in medical record data, if a data field says “yes” under tobacco use, it may mean that the patient was asked about tobacco use or that the patient actually uses tobacco.
Second, health services research teams often include individuals who are not researchers. These teams may include not only practicing clinicians and their clinical and administrative team members but also health insurers and health organization administrative leaders. These individuals often have strong, pragmatic interests in the results of the research, and want the results on a much quicker timeline than a typical research project delivers. They may be willing to compromise methodological rigor for data and results that are reasonably valid, but are imminently needed and must be delivered in a narrow time frame for ongoing decision making. They also do not want to engage in research activities that compromise their day-to-day operations. As a result, some traditional study designs and data collection methods are problematic. For example, health system administrators and providers are often reluctant to randomly assign practices or patients to control conditions. Finally, costs and financial risk/benefit considerations often figure prominently for administrators.
Third, health care delivery must continue while the research is happening. This phenomenon has been referred to as “building the plane while it is flying in the air.” Highly rigorous research designs such as the randomized controlled trial are often infeasible or inappropriate to implement in health care organizations. It is difficult to provide potentially enhanced care to only some patients when the primary business is patient care.
Fourth, context is critically important (Tomoaia-Cotisel et al., 2013). Each health care delivery organization must continue to deliver care for its specific patient populations and continually make changes in response to local market demands and policy changes. As such, it is necessary to understand the variety of circumstances in which a given intervention is implemented (Stange, 2013). An intervention in one context may work well, but in another, it may need to be appropriately adapted to achieve similar success (Stirman, Miller, Toder, & Calloway, 2013). To more fully understand context, it is beneficial to collect and interpret both qualitative and quantitative data and integrate them.
Finally, applications of mixed methods research in health services research will be of interest to the mixed methods community for additional reasons. Social justice designs, particularly community-based participatory research, have gained considerable traction. Most health services research mixed methods research projects are implicitly driven by pragmatism with researchers opting to use quantitative and qualitative data collection most apropos for the research questions they endeavor to answer. Typically, study designs in the health sciences are highly complex, using multiple, diverse qualitative and quantitative data sources, and data collection methodologies. Health service researchers often use highly sophisticated quantitative modeling and statistics for the quantitative component of their studies. All these factors raise particular challenges in integrating the qualitative and quantitative data at the study design, methods, and analytical levels (Fetters et al., 2013). Due to the size of mixed methods research projects in health services research, the projects often require very large and diverse interdisciplinary teams. These may include clinicians, health economists, statisticians, and anthropologists. It is not unusual to have two coprincipal investigators, multiple coinvestigators, and multiple field workers simultaneously engaged in collecting, analyzing, and publishing data (Curry et al., 2012).
An Illustration of Mixed Methods Research Procedures in a Health Services Research Investigation on Care Management Implementation in Primary Care
Having presented the unique nature of the field of health services research and its potential for novel mixed methods research applications at the conceptual level, below we illustrate these ideas through an actual health services research investigation of care management implementation in primary care. We particularly focus on illustrating the complex data collection procedures, how integration was achieved through the design, the incorporation of a theoretical model, and two data transformation approaches. This illustration includes an in-depth presentation of care management as a complex intervention in health care, the funded Provider-Delivered Care Management Study mixed methods investigation to examine two models of care management, the details of the mixed methods data collection procedures, the approach to the integration of theory, and finally two data transformation procedures: a qualitative to quantitative transformation, and qualitative comparative analysis.
Care Management as a Complex Intervention in Health Care
Care Management as a Health Care Intervention
As the U. S. population is increasingly plagued by chronic disease, care management has become one avenue health leaders are using to improve outcomes. Care management is defined as Programs [that] apply systems, science, incentives, and information to improve medical practice and assist consumers and their support system to become engaged in a collaborative process designed to manage medical/social/mental health conditions more effectively. The goal of care management is to achieve an optimal level of wellness and improve coordination of care while providing cost effective, non-duplicative services. (Center for Healthcare Strategies, 2007)
This definition is broad and encompasses many different services and means for delivery targeted at different conditions and health care settings. Typically, care management involves a person in a role called a care manager, who works within the health care setting to assist patients with accomplishing self-management goals to improve their chronic diseases. For example, a care manager may work with patients individually and in conjunction with practice team members and other resources to help a patient lose weight, take his or her medications, and get regular monitoring. The care manager may also assist in transitioning patients between care settings, doctors, and other health care resources. She or he may assist the patient with learning more about his or her chronic condition and facilitate involvement with other services and programs.
Care management is considered a complex intervention because it entails several roles with multifaceted interactions, and critical changes in work flows, power relationships, and communication patterns, in a context of multiple competing demands affecting practices today. It is therefore very challenging to implement successfully. The mere availability of effective tools and resources like care managers do not assure successful implementation. Practices have few mechanisms to help them integrate new programs, which can exert major pressures on practice operations; even small changes can have substantial consequences that limit a practice’s effectiveness at delivering care (Baron, 2007; Crosson et al., 2008; Jaen, 2011).
Care Management Is Ripe for Mixed Methods Investigation
The implementation of care management has been studied in care delivery settings, and the results from studies examining the clinical effectiveness of improving patient outcomes and reducing health care costs are inconsistent. In some settings, care management is highly effective in improving patient outcomes while in others it does not prove more beneficial than usual care (Egginton et al., 2012; Hickam et al., 2013; Joo & Huber, 2012). The challenge is making the transition from efficacy studies to effectiveness studies. That is, tightly controlled research studies (efficacy studies) find care management efficacious, but studies of care management implementation in “real world” primary care (effectiveness studies) deliver inconsistent results. It is common for adoption and implementation of new care programs to vary across practices based on practice characteristics, including practice culture and change capacity, practice size, rural versus urban setting, previous change experience, and decision-making style (Baron & Desnouee, 2010; Solberg et al., 2000; Tallia et al., 2003). Here, it is suspected that the methods of selection, training, and use of care managers (i.e., the implementation process and program structure) as well as the implementation context, likely account for the gap in demonstrating efficacious results under typical care delivery conditions. This, however, is not clear without further study. What further complicates the issue is that care management can be evaluated on many levels—patient satisfaction and health outcomes, health care organizations and systems and their members, costs to those organizations, and the health care system overall. These factors make care management an ideal intervention to study using a mixed methods approach.
The Provider-Delivered Care Management Study: A Mixed Methods Investigation
To better understand this inconsistency of results in “real-world” care management implementation, our team sought to explore what conditions lead to effective care management implementation, and specifically examine the care management model, that is, how it is structured and organized within context. The complex nature of care management demonstrates clear need for the use of mixed methods research. In 2010, the Agency for Healthcare Research and Quality (AHRQ) released a call for proposals to conduct comparative effectiveness research. The funding opportunity announcement explicitly acknowledged the value of qualitative, quantitative, and mixed methods approaches. Our funded study (AHRQ 1 R18 HS020108-01) used mixed methods to compare the effectiveness of two models of care management delivery: health plan delivered care management (health plan) versus provider-delivered care management (provider-delivered).
Health Plan–Delivered Care Management
Health plan care management is a telephonic disease management program operated by the health plan as a benefit purchased by employer groups for their employees. Each month, the health plan uses claims-based algorithms to identify plan members who have at least one of the following five chronic diseases: congestive heart failure, chronic obstructive pulmonary disease (e.g., emphysema), ischemic heart disease, diabetes, or asthma, and to predict members’ future 12 months’ health care cost risk. Employer groups and the health plan decide what portion of the highest risk members within an employer group should receive outreach for telephonic disease management. Health plan nurses call members in this “targeted” group to offer the program and attempt to engage them in the disease management program. For members who participate in the program, the disease management program nurses use motivational interviewing and provide self-care support and health education via a series of telephone calls.
Rationale for the Study
The study involved five physician organizations in Michigan. The research study added an evaluation component to an already-funded pilot supported by a state-wide health insurance plan. The health insurer paid the participating physician organizations in a lump-sum fashion to deliver care management to patients in specific practices selected to be in the pilot. These organizations and the participating practices designed their own care management program to be delivered within their organizations. Within provider-delivered care management, there was great variation in the organizations’ contexts as well as care management programs (Table 1). We hypothesized that the inconsistent results found in the literature about the effectiveness of care management in practice were the result of multiple factors related to implementation such as lack of care manager training, difficulty incorporating care management into the patient flow, or inadequate financing. We used mixed methods to determine which factors were necessary for a care management program to be successful regardless of context and which success factors were dependent on the context of the setting or population.
Physician Organizations (POs) and Their Care Management (CMgt) Programs.
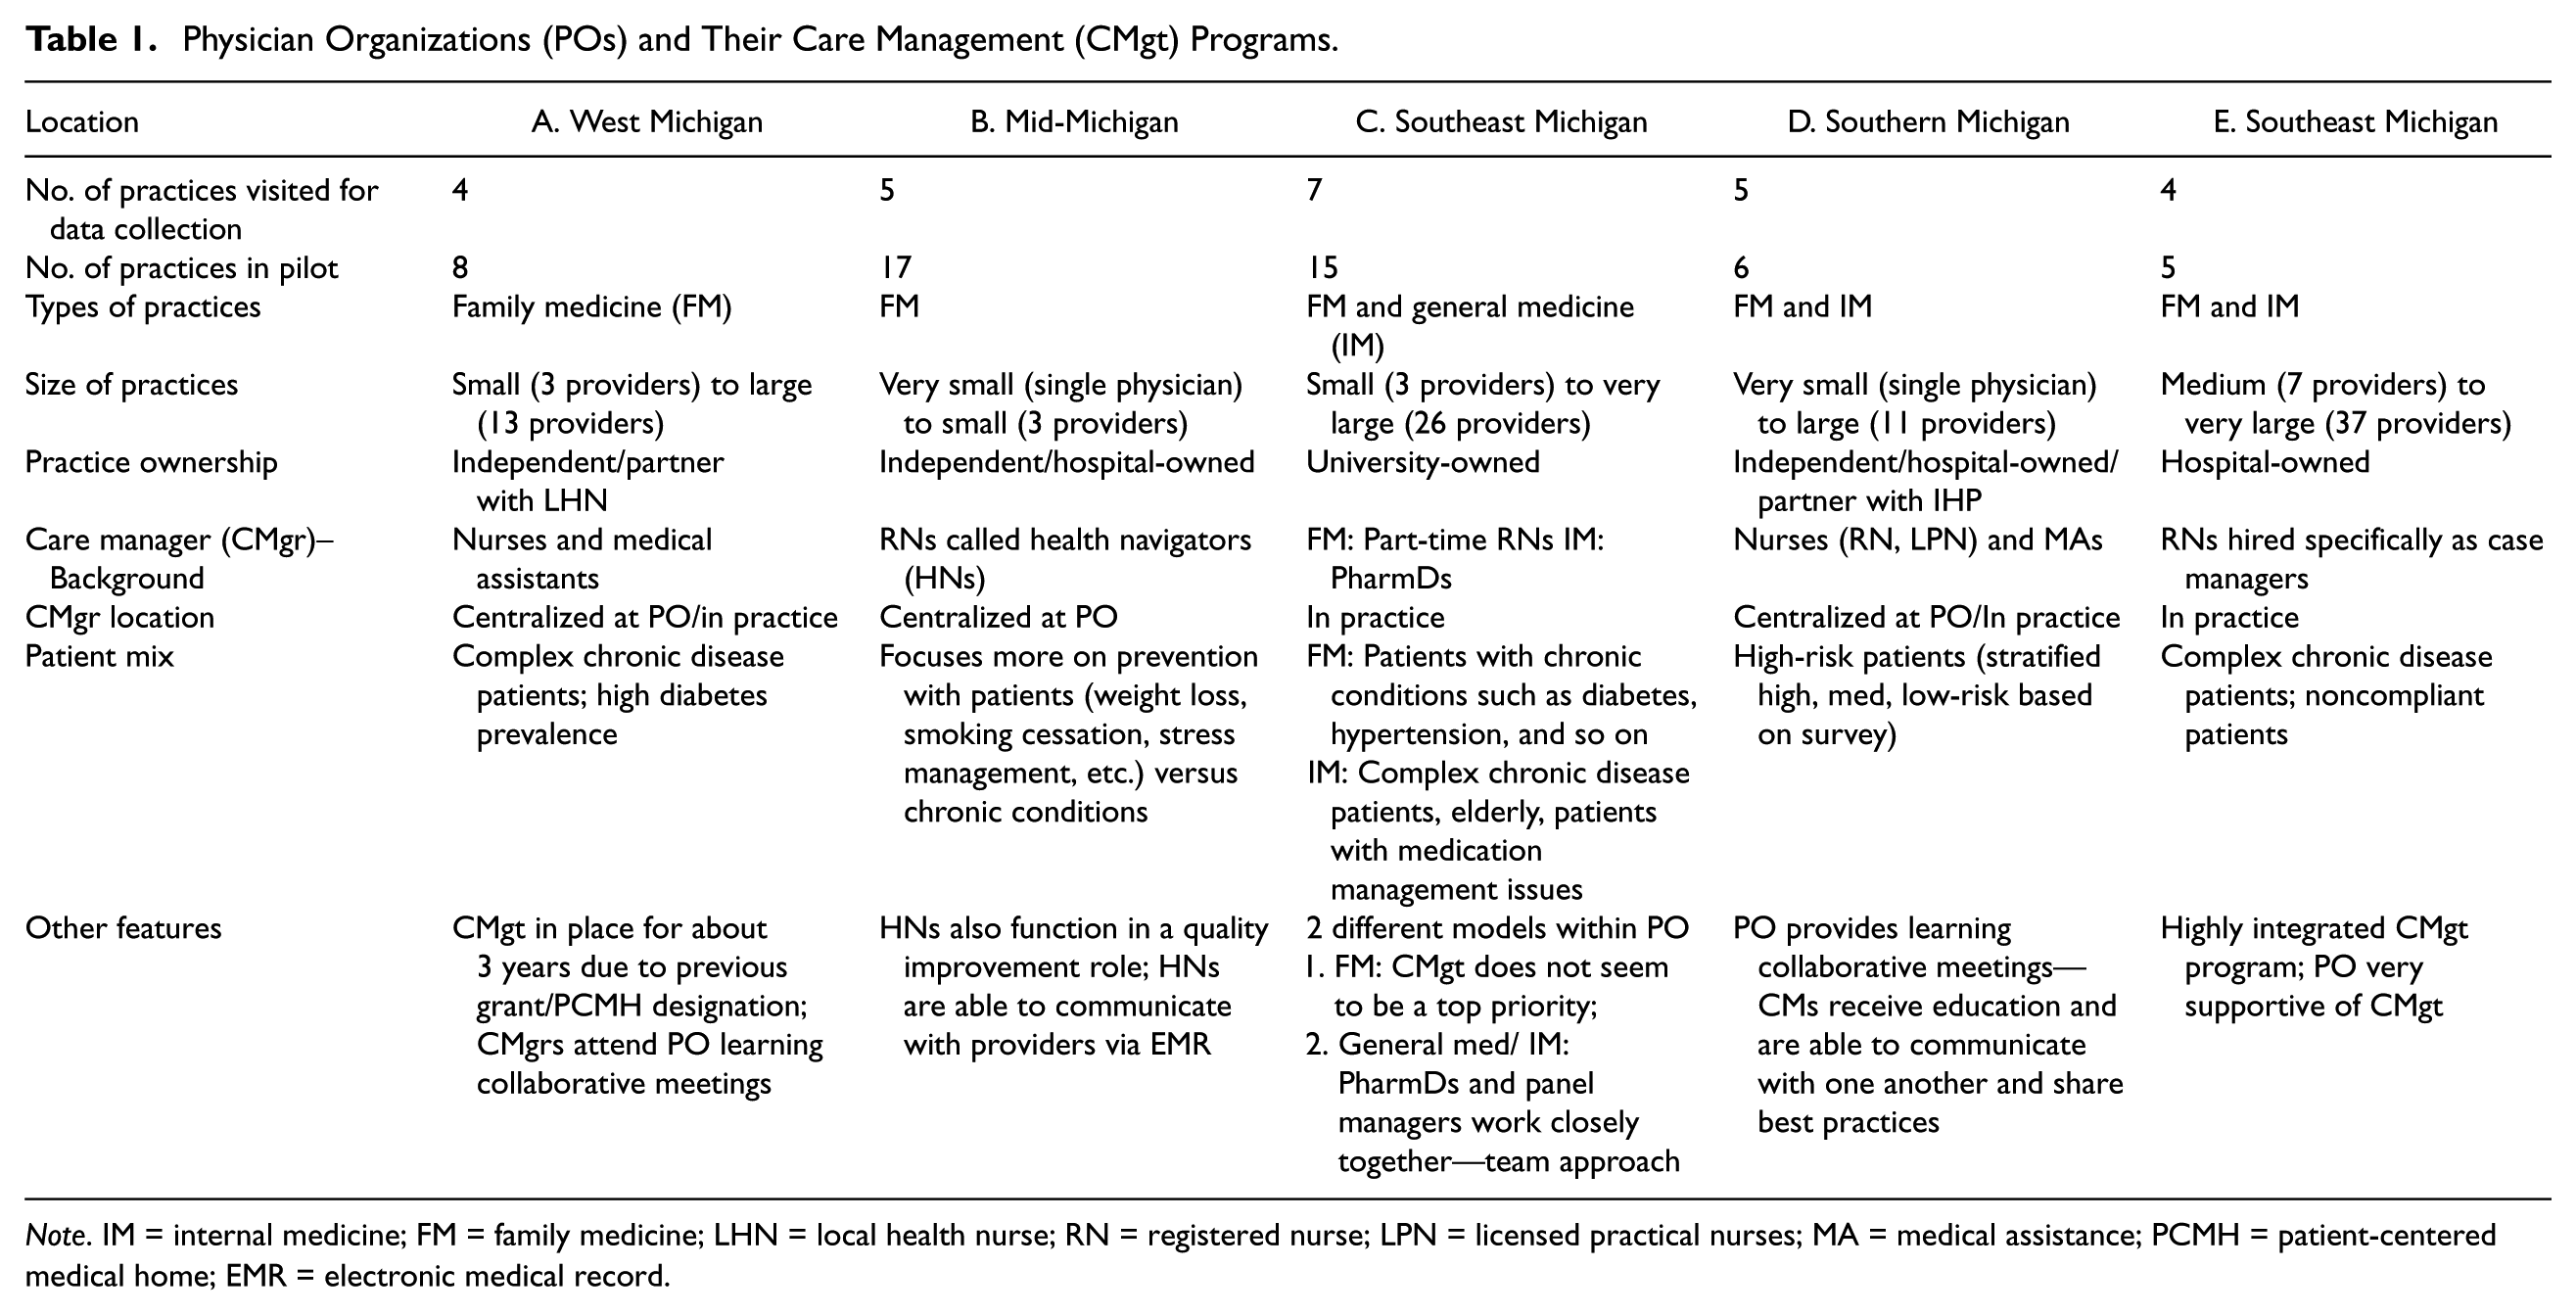
Note. IM = internal medicine; FM = family medicine; LHN = local health nurse; RN = registered nurse; LPN = licensed practical nurses; MA = medical assistance; PCMH = patient-centered medical home; EMR = electronic medical record.
Provider-Delivered Care Management
Provider-delivered care was organized by physician organizations. Some organizations had care managers who were located centrally at the organization and managed patients for multiple practices (i.e., centralized model), and others had care managers embedded into the team structure within the practices (i.e., practice-based). The organizations used a variety of information sources to target patients for care management. These methods included clinical data from patient medical records and registries, organization-developed health risk assessments, physician and practice staff knowledge of patients (including judgment on their likely participation and adherence in a care management program), and claims-based information provided by the health plan. Care management was delivered using a combination of communication methods, including telephone calls, face-to-face consultations, mailings, and occasionally emails. Care managers not only provided similar content and strategies as the health plan care management but also included coordination with the primary care team to address other broader issues of the patient.
Provider-Delivered Care Management Study Focus
A primary aim of the study was to compare two models of delivering care management and determine which provides comparatively better outcomes (1) care management delivered by the health care delivery organization, meaning the clinical practice or the organization that owns or to which the practice is affiliated or (2) care management delivered by the health insurance company, which is off-site and not connected to the clinical practice or their affiliated organization. A second primary aim of the study was to describe and evaluate the various implementations of provider-delivered care management and understand the factors associated with successful care management implementation. Below, we illustrate the methods used to address both of these aims.
Mixed Methods Data Collection Procedures
An overview of the Provider-Delivered Care Management Study can be seen in Figure 1. In this study, the design, methods, and analytics were integrated to address the two primary study aims. The data collection procedures therefore served multiple research topic purposes simultaneously. The investigators employed a mixed methods convergent design. While the thrust of this article focuses on a data transformation variation of a convergent design, we also conducted other analyses that are beyond the scope of this article. The purpose of a convergent design is to obtain different but complementary data on the same topic with the intent to bring together the strengths of both quantitative and qualitative methods. This design allowed all the data to be collected in the field simultaneously, and the qualitative and quantitative data analysis to be conducted first within each tradition using standard qualitative and quantitative procedures (Creswell & Plano Clark, 2011). Quantitative data sources included physician organization-provided monthly reports regarding care management participation, clinical data extracted from electronic medical records, and claims data from the health plan. Additionally, quantitative data included scaled responses on surveys from participating physician organization leaders, practice members, and selected patients. In total, the data were gleaned from 2,592 provider-delivered care management and 1,128 health plan pilot patients, and clinician and practice surveys. Qualitative data sources included 10 interviews with physician organization leaders from across five physician organizations, and 70 practice interviews with clinicians, practice managers, staff, and care managers from 25 practices, as well as three health plan care management program leaders. Additionally, qualitative data included field notes taken by research assistants shadowing selected care managers.
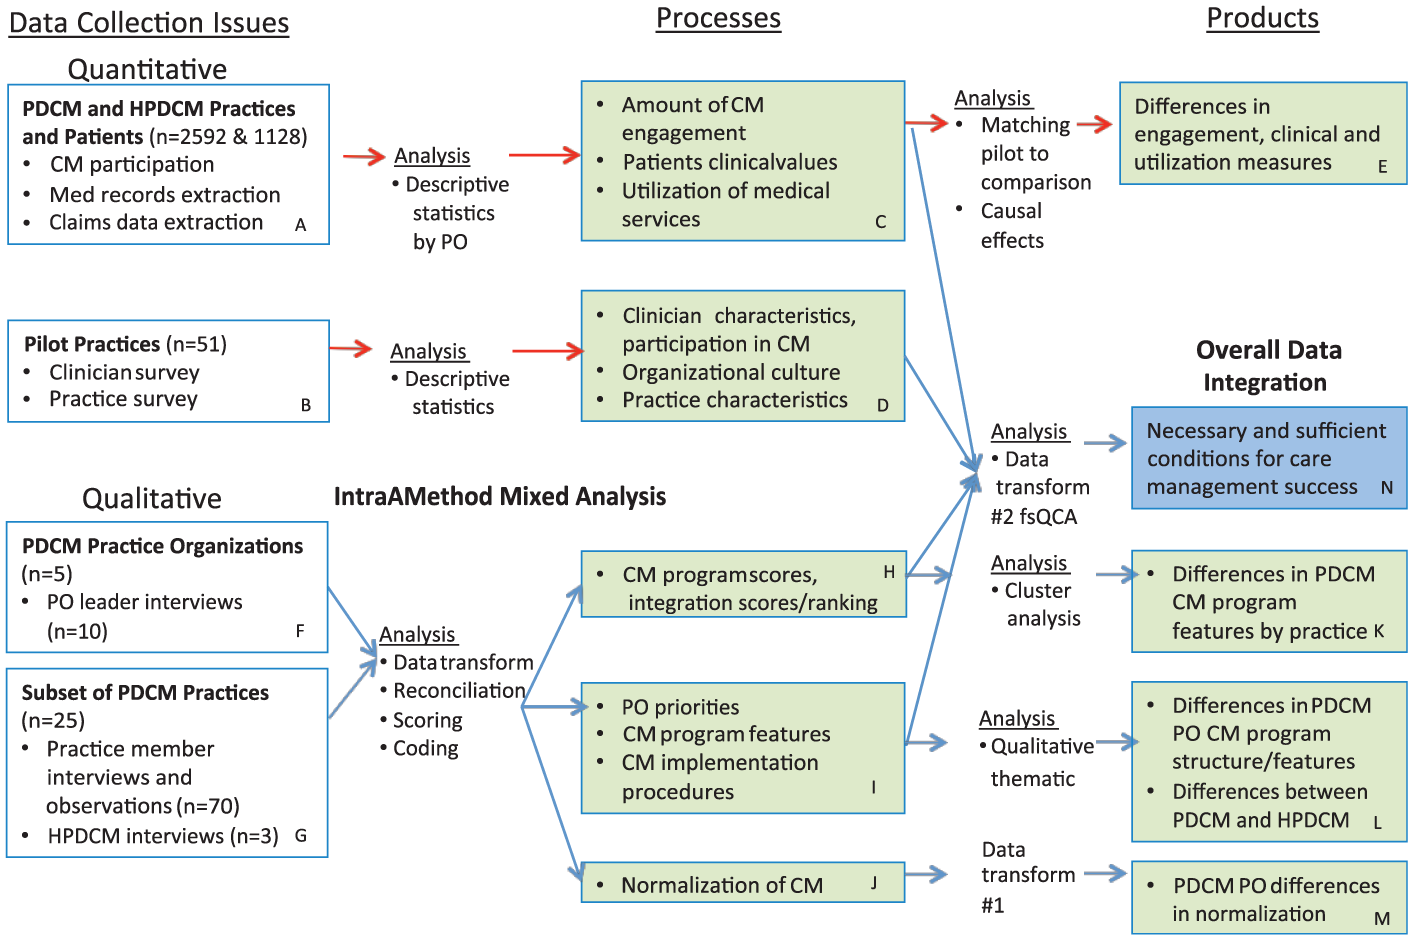
Mixed methods processes and products.
The three boxes along the top of Figure 1 (Boxes A, C, and E) outline the processes, products, and outcomes for the quantitative portion of this study. The quantitative methods are not our focus in this article, but will be described sufficiently to understand the overall procedures and in particular how the quantitative procedures contributed to the overall mixed methods research design. The quantitative data from the provider-delivered care management arm of the provider-delivered versus health plan-delivered comparison were used in the mixed methods analyses.
Starting on the left with Box A, the participants in the investigation were the patients eligible for the provider-delivered care management study. Comparison patients were eligible for health plan care management. Eligible patients were those who met four conditions: (1) they had the health plan’s health insurance and were a patient in a pilot-participating practice; (2) they were identified by the pilot practice as having one of more of the chronic conditions; (3) they were correctly attributed to the practice; (4) the practice could provide them with care management if the patient needed it.
The three quantitative outcomes described in Box C were (1) engagement—the extent to which patients participated with care managers in encounters (phone or in person visits) in which they were working toward health improvement goals. These data were collected via a monthly data file populated by the participating physician organization and sent to the health plan analysts; (2) clinical—clinical values contained within the medical record of the eligible patients and included values such as blood pressure, weight, and lipid values. These data were collected by a data query of the electronic medical records of the physician organization’s participating practices at one time for the entire period at the end of the study; (3) health care utilization—health care claims that resulted in costs to the health insurer. These data were available by partnership with the health insurer that owns these data.
The results of this portion of the study found differences in patient targeting, patient engagement, and cost savings across time, all favored the practice-based models of care management over health care plan management. However, clinical outcome differences (better blood pressure control, better lipid control, etc.) were not demonstrated (Annis, Tao, Cheng, Luo, & Holtrop, 2015; Cheng et al, 2016; Luo et al., 2016).
Descriptive Outcomes of the Two Care Management Programs
This aim used mixed methods and consisted of two parts (1) a process description of the implementation of care management within context and (2) a description of the features of the practice, physician organization, patient, or care management program associated with positive outcomes. The remaining boxes in Figure 1 (all those except A, C, and E) depict the methods, processes, and products in support of this goal. To begin development of a sense of context for each physician organization and practice, we collected quantitative data using written surveys of both the practice and the individual clinicians to describe the pilot practices and inform our understanding of those contexts in a standard way (Boxes B and D). Qualitative data collection began with interviews with physician organization leaders to understand the organizational context, priorities, and how care management fit within that overall context (Boxes F and G). Specific practices were selected intentionally to represent diversity in the participation and practice types for further interviews and observations. These data collection methods were used to inform our understanding of the processes of care, the participants involved, and the story of implementation.
Integration of Theory Into the Mixed Methods Study: Use of Normalization Process Theory
Understanding successful implementation can be challenging. The traditional way of measuring research implementation is to measure “fidelity.” Fidelity begins with determining the intervention’s key processes or features to be included and then examining the extent to which these processes or features were used in given implementations of the intervention. The ideal of fidelity, however, becomes problematic when they key set of processes or features to be implemented are unknown, or if different combinations of processes and features can be effective. In our study, the practices and their affiliated organizations were free to determine their own processes and features for their care management programs. This situation made fidelity assessment challenging, but, on the other hand, provided us an opportunity to determine what program processes and features within context were associated with more positive outcomes.
Thus, we wanted to know more how, regardless of care management features, the ability to implement care management affected the outcomes of routine use (i.e., normalization), patient engagement, clinical outcomes, and cost. We chose a theoretical perspective to guide our understanding. If an intervention in practice becomes routine, if it becomes a part of how the practice normally does business, then it has become normalized in the practice. This reveals how well it was “taken up” or how much the intervention was used. Normalization process theory (NPT) examines the underpinnings of normalization (May et al., 2007; May et al., 2009). It has four main constructs with four subconstructs within each that provide a framework for studying how a new intervention may or may not become routine in practice and why. We focused on the subconstructs of the “collective action” construct because we concluded these to be most appropriate to this study of implementation. Table 2 outlines these subconstructs and how they applied to our study. These constructs were used as part of the coding scheme for the qualitative data.
Normalization Process Theory Collective Action Components and How Applied to the Care Management Study.
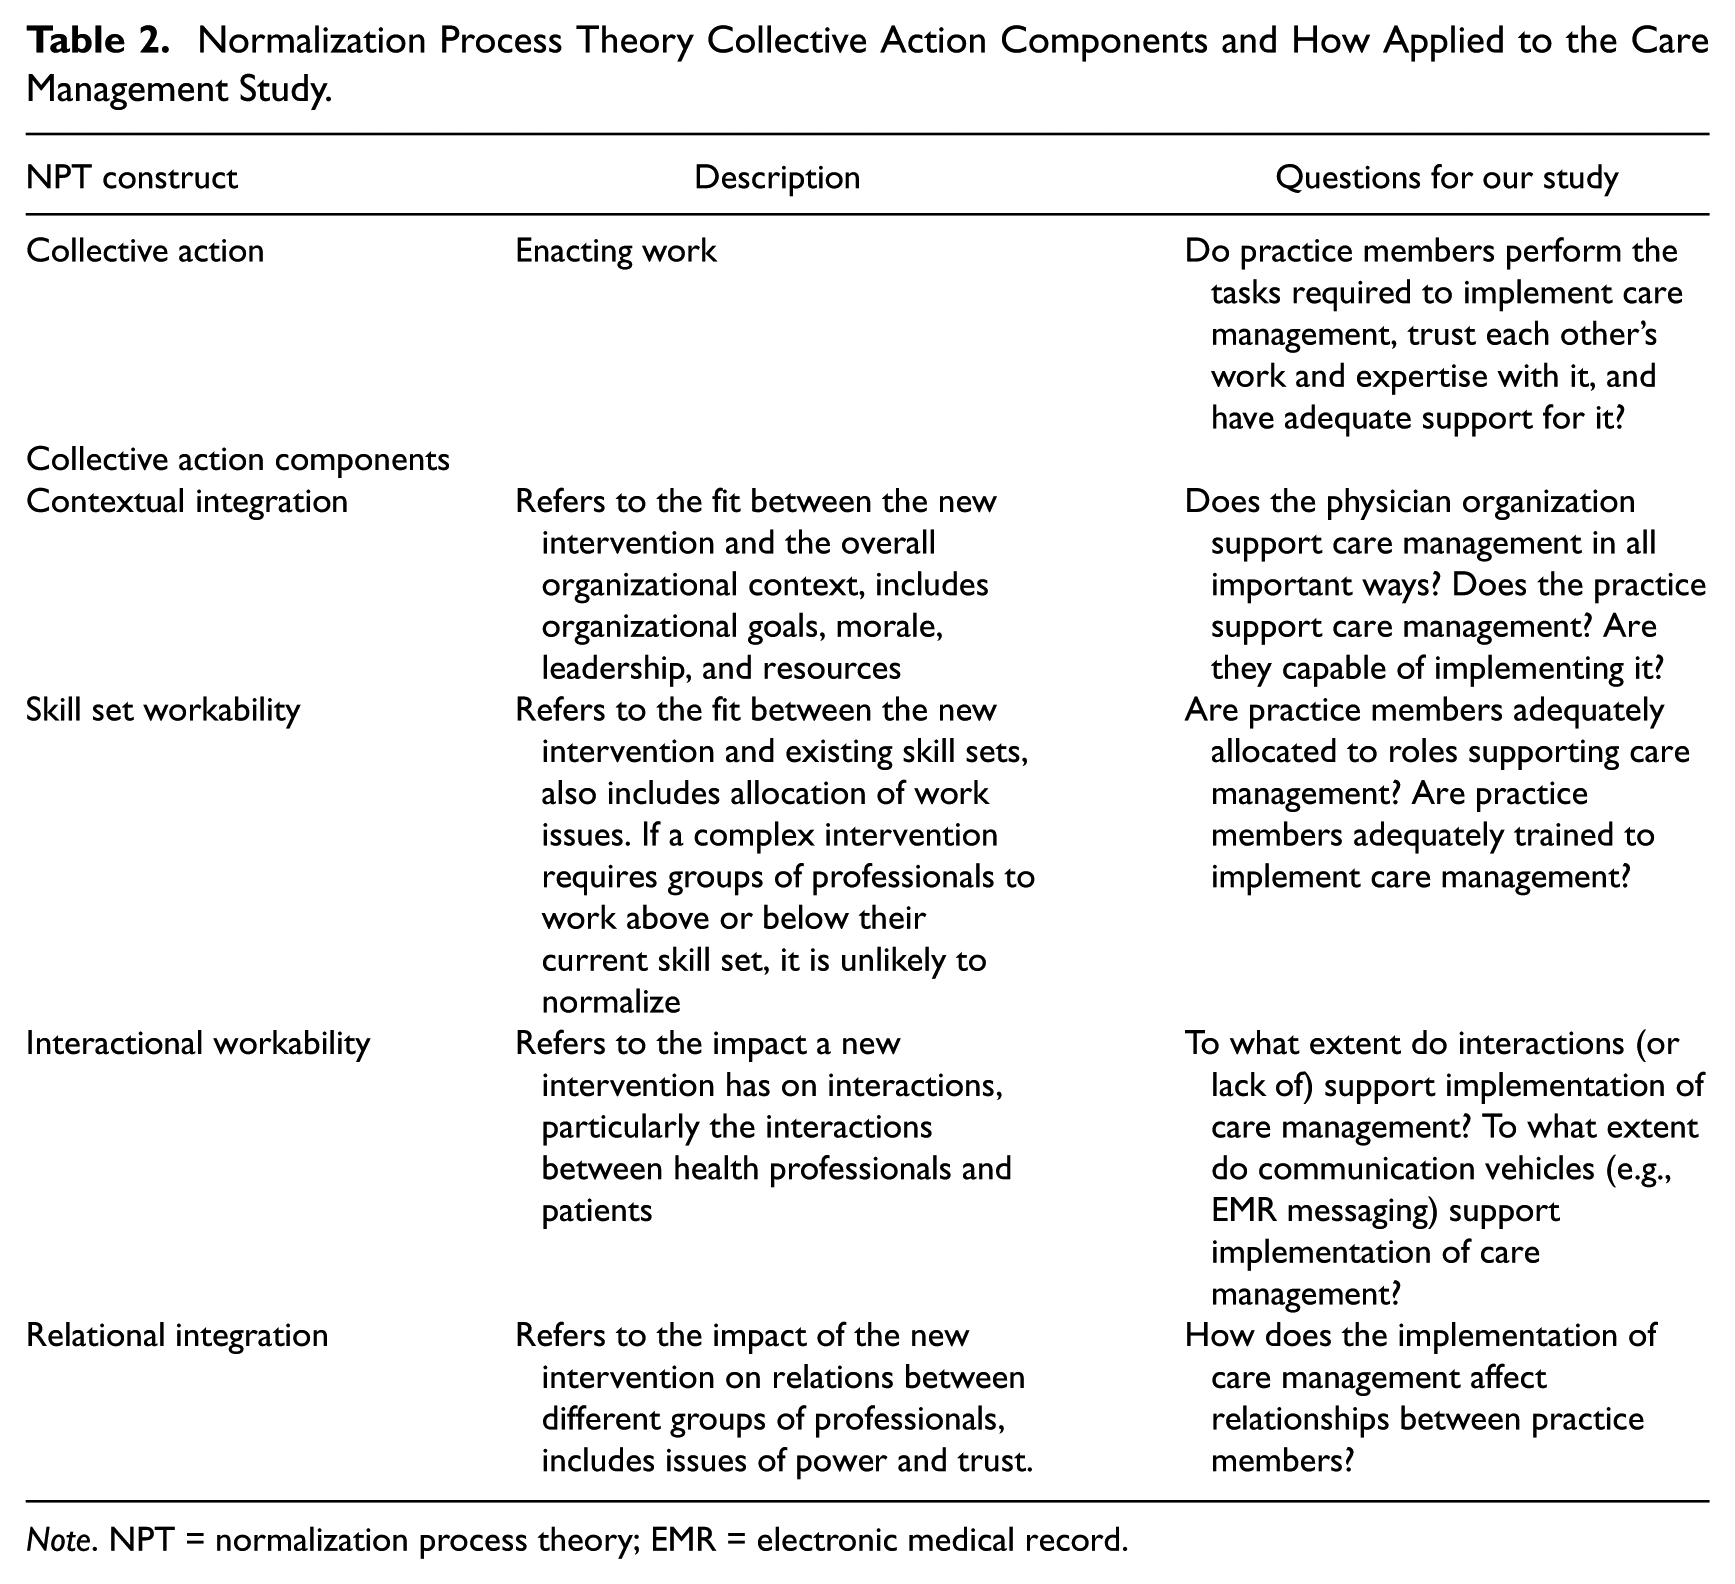
Note. NPT = normalization process theory; EMR = electronic medical record.
Overview of the Qualitative Analysis
Figure 2 illustrates in greater detail the data collection procedures of Boxes F and G from Figure 1. It also shows how these data were used to examine implementation processes using NPT, to gain overall insights about care management programs and processes, and to identify key features within each practice to complete the overall data integration using qualitative comparative analysis (described below). This process resulted in a reconciled, calibrated set of data that was comprehensive. The transparency of the process and multidisciplinarity of the research team helped reduce any potential bias or influence of any one investigator involved in data collection and analysis.
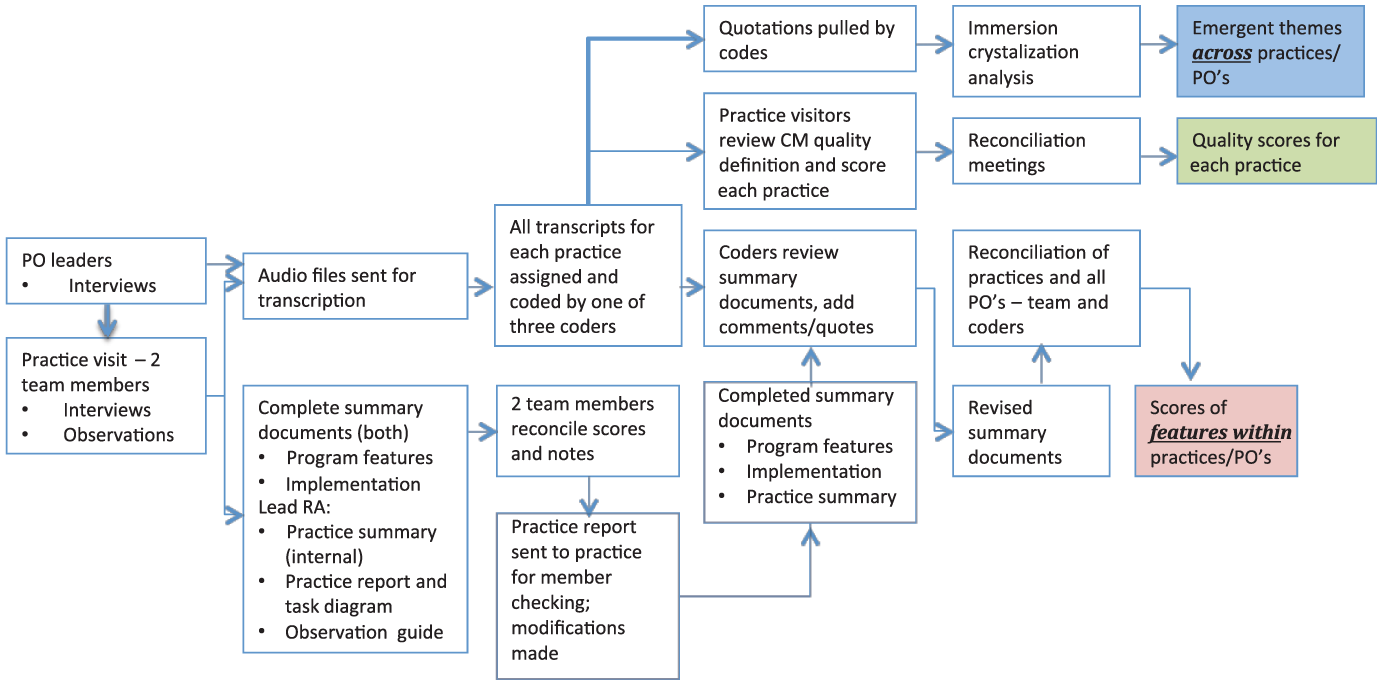
Qualitative data collection and analysis.
Iterative Data Collection and Qualitative Analysis Procedures Preceding Data Transformation
We began analysis of the semistructured interviews of physician organization leaders to describe the organizational characteristics and cultures as well as how the physician organization became involved in care management (Figure 1, Box F). We conducted two to five interviews of leaders per physician organization. Data from this step informed the assessment forms for delineating the care management program features as well as the implementation results that could be expected. This resulted in two assessment forms (1) a care management program features assessment (that was developed by experts in care management research along with the research team) to identify the factors that might determine differences in the care management program outcomes and (2) an implementation assessment driven by NPT. Each assessment included a 1-5 scaled score for each feature (care management program feature or NPT feature) with field notes to substantiate each number selected by the observer. Note that the use of qualitative observations to derive an ordinal score for each component is an established part of the NPT toolkit (http://www.normalizationprocess.org), not original to this study.
Next, we identified practices participating in the pilot program (Figure 1, Box G). From among the participating practices, specific practices were selected to maximize the overall variability in terms of implementation success and practice characteristics (size, type/discipline, and location). We selected 25 of the 51 participating practices for a site visit. A team of two researchers visited each practice and interviewed two to five practice members per practice using a semistructured interview guide and conducted a site observation. This produced four data sources per practice (1) a practice summary (narrative description of key findings), (2) an observation guide (field notes organized by a template of key areas of assessment), (3) a diagram outlining the key care management tasks in order (task diagram), and (4) a practice report (one-page report to be given to the practice). Both researchers independently completed the two assessment tools, namely, the care management program features assessment and the NPT assessment (these were later reconciled; see below). We sent the practice their one-page report and the task diagram of the care management process for review and member checking (the process of seeking participant input on the interpretation of the investigators). Based on their feedback, we revised the report and diagram. An example practice report is displayed in the Appendix.
To analyze the data from the 25 practices, a team of three qualitative researchers coded interview transcripts using the software program atlas.ti (www.atlasti.com). The coders worked together to code initial interviews. Initial codes were based on established a priori themes identified from the care management program features and NPT assessments, and other codes were added as they emerged from the data. The coders worked together on one interview for each physician organization (five total) and then progressed to completing the coding independently and then comparing and reconciling codes and examining conceptual interrater reliability. The decision was made to collapse some codes that represented similar concepts—thereafter reliability across coders improved. After another five interviews, the coders divided up their work by coder and created an assignment scheme to review and code all interviews. Coders then revisited the summary documents (care management program features, NPT assessments, and practice summaries) and based on the coded data from the interviews from each practices, revised the document, and added quotations from interviews to support or refute the score given. This resulted in a revised set of documents.
Two Data Transformation Procedures
To examine our qualitative data in additional ways beyond the qualitative analytics described above, we engaged in a group process to complete two different data transformation processes, one supporting each sub-aim.
Data Transformation Illustration 1: Qualitative to Quantitative Data Transformation Using Theory
To answer our process question, “What components are needed to make a routinely used (i.e., normalized) care management program?” the qualitative analysts as a group reviewed the qualitatively coded NPT components practice by practice within a physician organization and then across physician organizations (Figure 1, Boxes J and M). All analysts had participated in data collection/analysis as a member of the practice visit team and/or as coder for the entire physician organization review. As a group, they discussed the NPT components (namely, contextual integration, skill set workability, interactional workability, and relational integration as described in Table 2) for each practice within a physician organization. This exercise helped the group to establish a common meaning for and understanding of each NPT component and to calibrate a scoring category for each NPT component for each practice. The team completed this assessment for overall achievement of normalization as well as for each NPT component. Overall normalization was originally scored on a 1–5 scale to represent the qualitatively collected information as outlined in Table 3. This score was only assigned once it had been vetted with a qualitative rationale for that score. This effectively resulted in a ranking of practices based on the summative responses/scores to the qualitative data after review of the quotation reports for that component.
Data Transformation 1: Qualitative Normalization Data Into Quantitative.
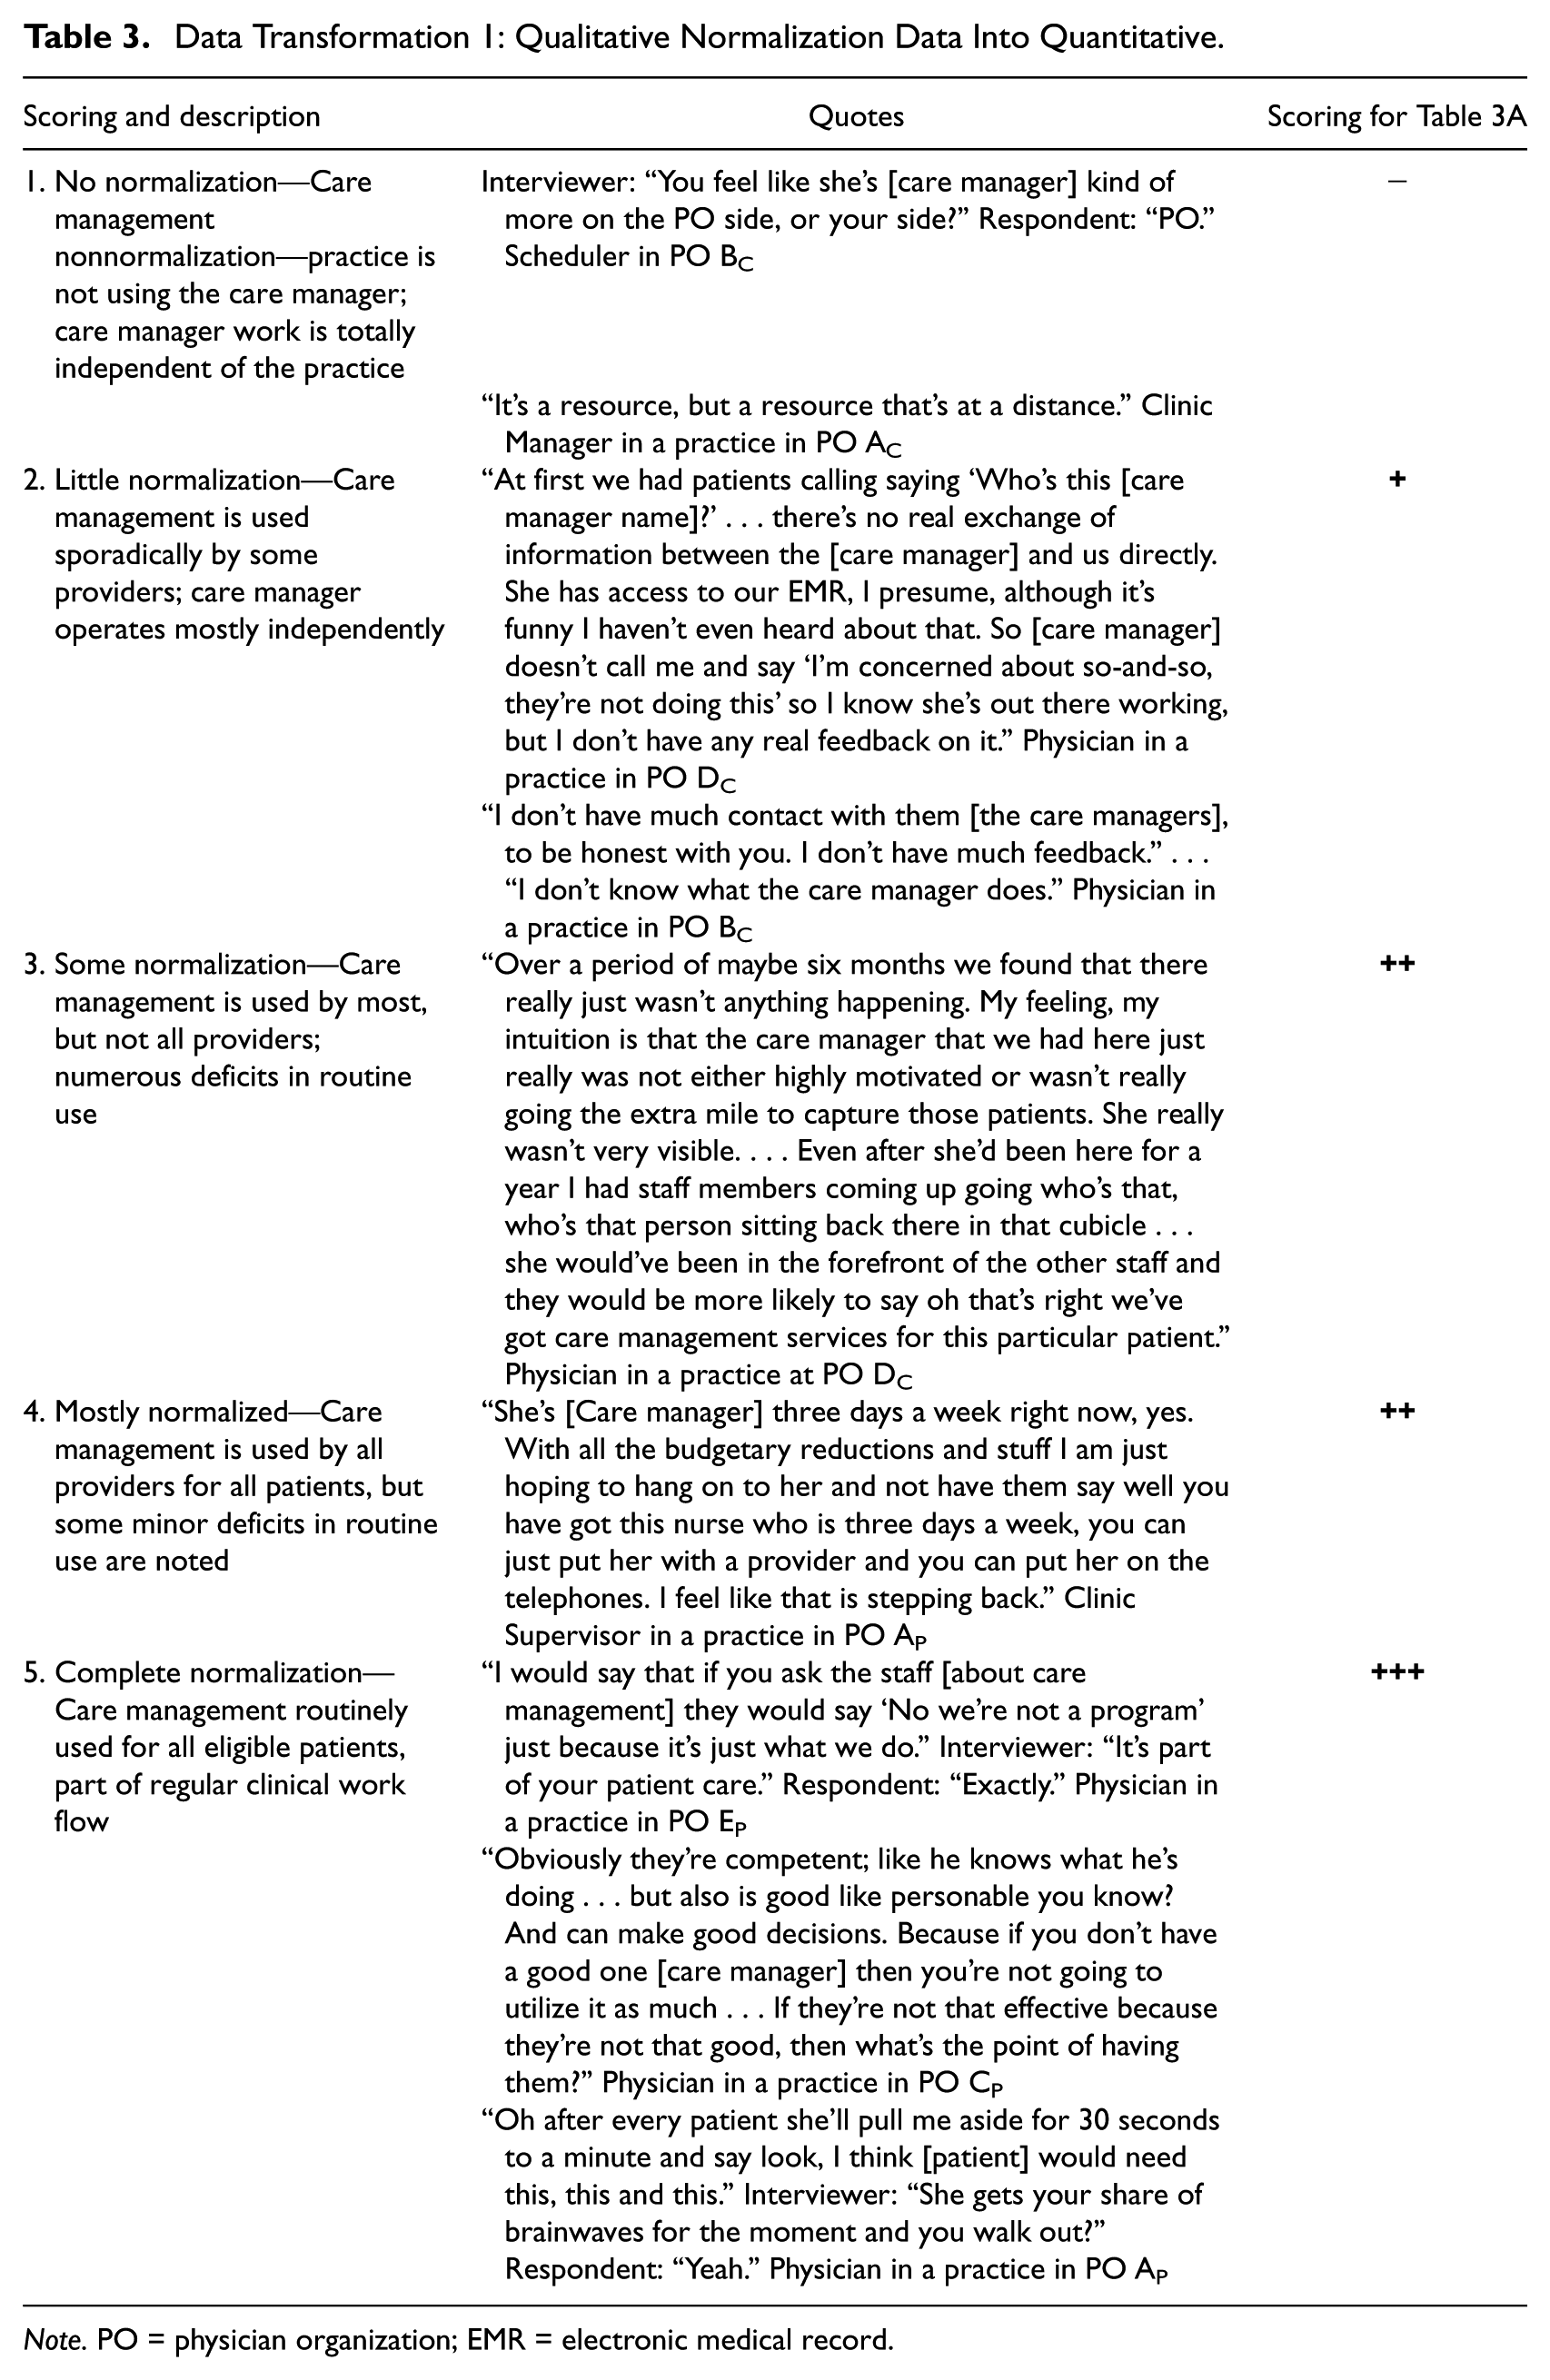
Note. PO = physician organization; EMR = electronic medical record.
The group then scored each practice individually on each NPT component and found that the 1–5 scale was cumbersome and, therefore, adopted a more categorical scale reflecting a low (+), medium (++), or high (+++) degree of each NPT component. In cases where the NPT components were present in some practices within a PO care management structure type, but not others, we assigned a +/− category. Since having a 5-point scale for degree of normalization and a categorical ranking for each NPT component was inconsistent, we converted the 5-point scale to the categorical ranking as outlined in the right column of Table 3.
We proceeded in this fashion through each practice and then to the next physician organization and again went practice by practice to determine scores for those practices. Since the physician organizations were able to make many decisions themselves about the features of the program, there was much variation in the representation of the NPT components and the degree of normalization by practice organization and by care management structure within practice organization.
We created a table to represent the categories of degree of normalization by NPT components to visually examine if the NPT components appeared to be related to degree of normalization (see Table 4). We organized our data into the groupings of physician organization and care management model within each physician organization since this is the way it was naturally occurring. This analysis found that normalization of care management fared better in the practice-based models as compared to centralized care management models. A more extensive explanation of the results and discussion can be found at Holtrop, Potworowski, Fitzpatrick, Kowalk, and Green (2016). The data transformation thus allowed us to gain more insight as well as create an overall score that we could use for modeling with other quantitative data.
Data Transformation Illustration 1: From Qualitative Data to a Quantitative Scoring Configuration to Examine the Relationship Between Degree of Normalization and Normalization Process Theory Collective Action Components by Care Management Structure Within Physician Organization.
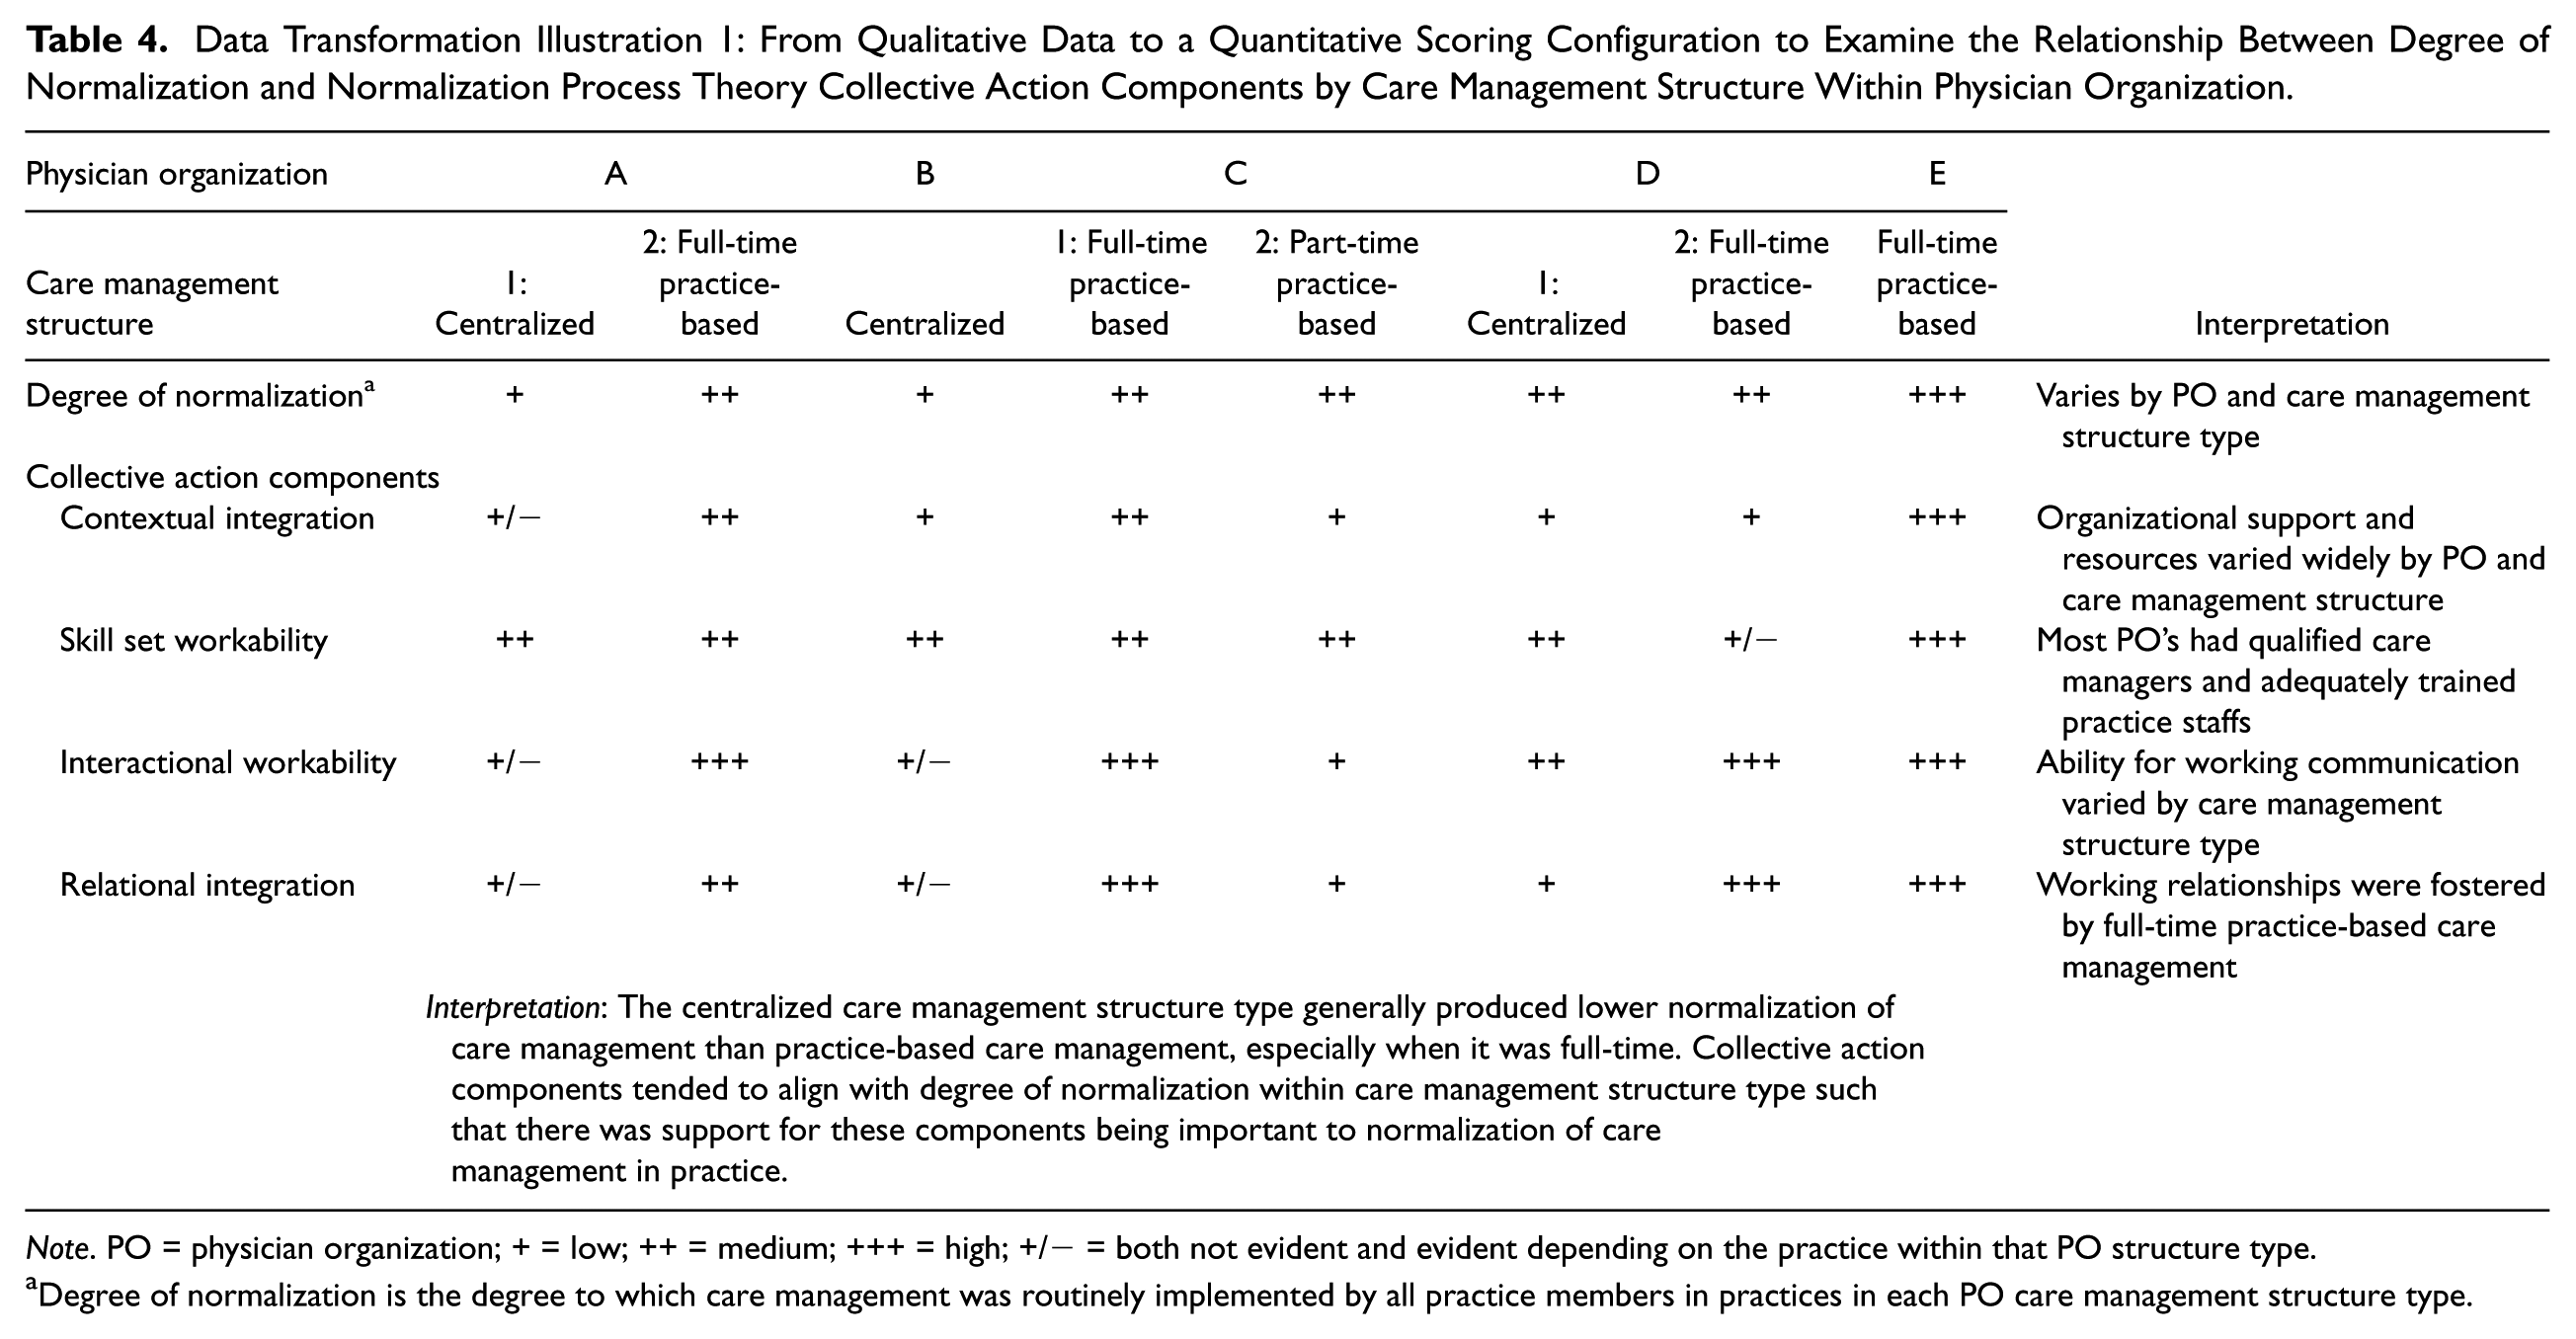
Note. PO = physician organization; + = low; ++ = medium; +++ = high; +/− = both not evident and evident depending on the practice within that PO structure type.
Degree of normalization is the degree to which care management was routinely implemented by all practice members in practices in each PO care management structure type.
Data Transformation Illustration 2: Qualitative to Quantitative Data Transformation Using Qualitative Comparative Analysis and Fuzzy Set Procedures
Our second sub-aim was to understand the important features of a care management program, that is, our outcome question, “What components are absolutely necessary to include to have a successful care management program?” The answer to this question could streamline programs and reduce waste. To answer this question, we needed a way to take our qualitatively collected data from interviews and observations and construct an analysis that would effectively reveal key care management program features. To achieve this, we used qualitative case analysis with a fuzzy set approach. Below we describe the methodology, and then illustrate how we used it in this study.
Transformation of Complex Cases Into Outcomes and Conditions Using Fuzzy Set Qualitative Comparative Analysis
We used fuzzy set qualitative comparative analysis (fsQCA) to combine the rich inductive processes of qualitative research with a mathematical Boolean algebra-based approach to identify components associated with specific outcomes (Rihoux & Ragin, 2009). A key advantage of this approach is that it allows researchers to study a small to intermediate number of cases and examine the key components, as well as the configuration of those components, that produce a positive outcome. This can include multiple paths to a successful outcome (a phenomenon called equifinality).
To conduct systematic comparative analysis of complex cases, those cases must be transformed into configurations. Configurations are simply combinations of factors associated with a given outcome of interest. fsQCA allows for identifying configurations that are necessary (always present in the outcome and the outcome cannot be obtained without the presence of the configuration) and sufficient (the outcome always occurs when the configuration is present, but the outcome could also result from other configurations).
In QCA, one must specify both an outcome and one or more conditions (variables) for the analysis to proceed. Both the outcome and the conditions must be quantified. There are two forms of QCA: crisp set QCA and fuzzy set QCA (fsQCA). In crisp set QCA, the conditions are binary and so are either not present (0) or present (1). In fsQCA, the conditions exist in degrees of set membership and so can range from 0 to 1.
Following calibration, data are analyzed using a QCA software program. The analysis requires importing a table of the calibrated data by case including the outcome condition. The necessity and sufficiency analysis are next conducted as individual steps using the software. Finally, a Quine–McCluskey set reduction calculated by the software identifies complex, parsimonious, and intermediate solutions (configuration sets that produce the outcome), as well as consistency (the extent to which the configurations always produce the outcome) and coverage (the extent to which the outcome only results from the configurations) of the solution sets. The output of this analysis results in configurations of necessary and/or sufficient conditions for the outcome.
Illustration of Data Transformation Through Qualitative Case Analysis With a Fuzzy Set Approach in the Care Management Project
As with the data transformation illustration 1 analysis described above, our research team worked together in a group process to determine how to convert the qualitative information into quantitative categories. As a first step, the two-person team had already created a scoring system at the time of the practice visits by having each member answer questions about the care management program features using a 1–5 Likert-type scale. We completed an extensive group calibration process to assure that the scores given were consistent across raters and across practices within and across organizations. Again, this score was only assigned once it had been vetted through a group process with a qualitative rationale for that score. This effectively resulted in a ranking of all 25 practices based on the summative responses/scores to the assessments. This transformation is depicted in Table 5 in rows A and B using two of the two cases.
Data Transformation Illustration 2: Mixing Qualitatively Collected Data to Create Quantitative Ratings and Quantitative Calibration Scores for Qualitative Comparative Analysis (QCA). Two Example Cases (Out of 25) Presented.
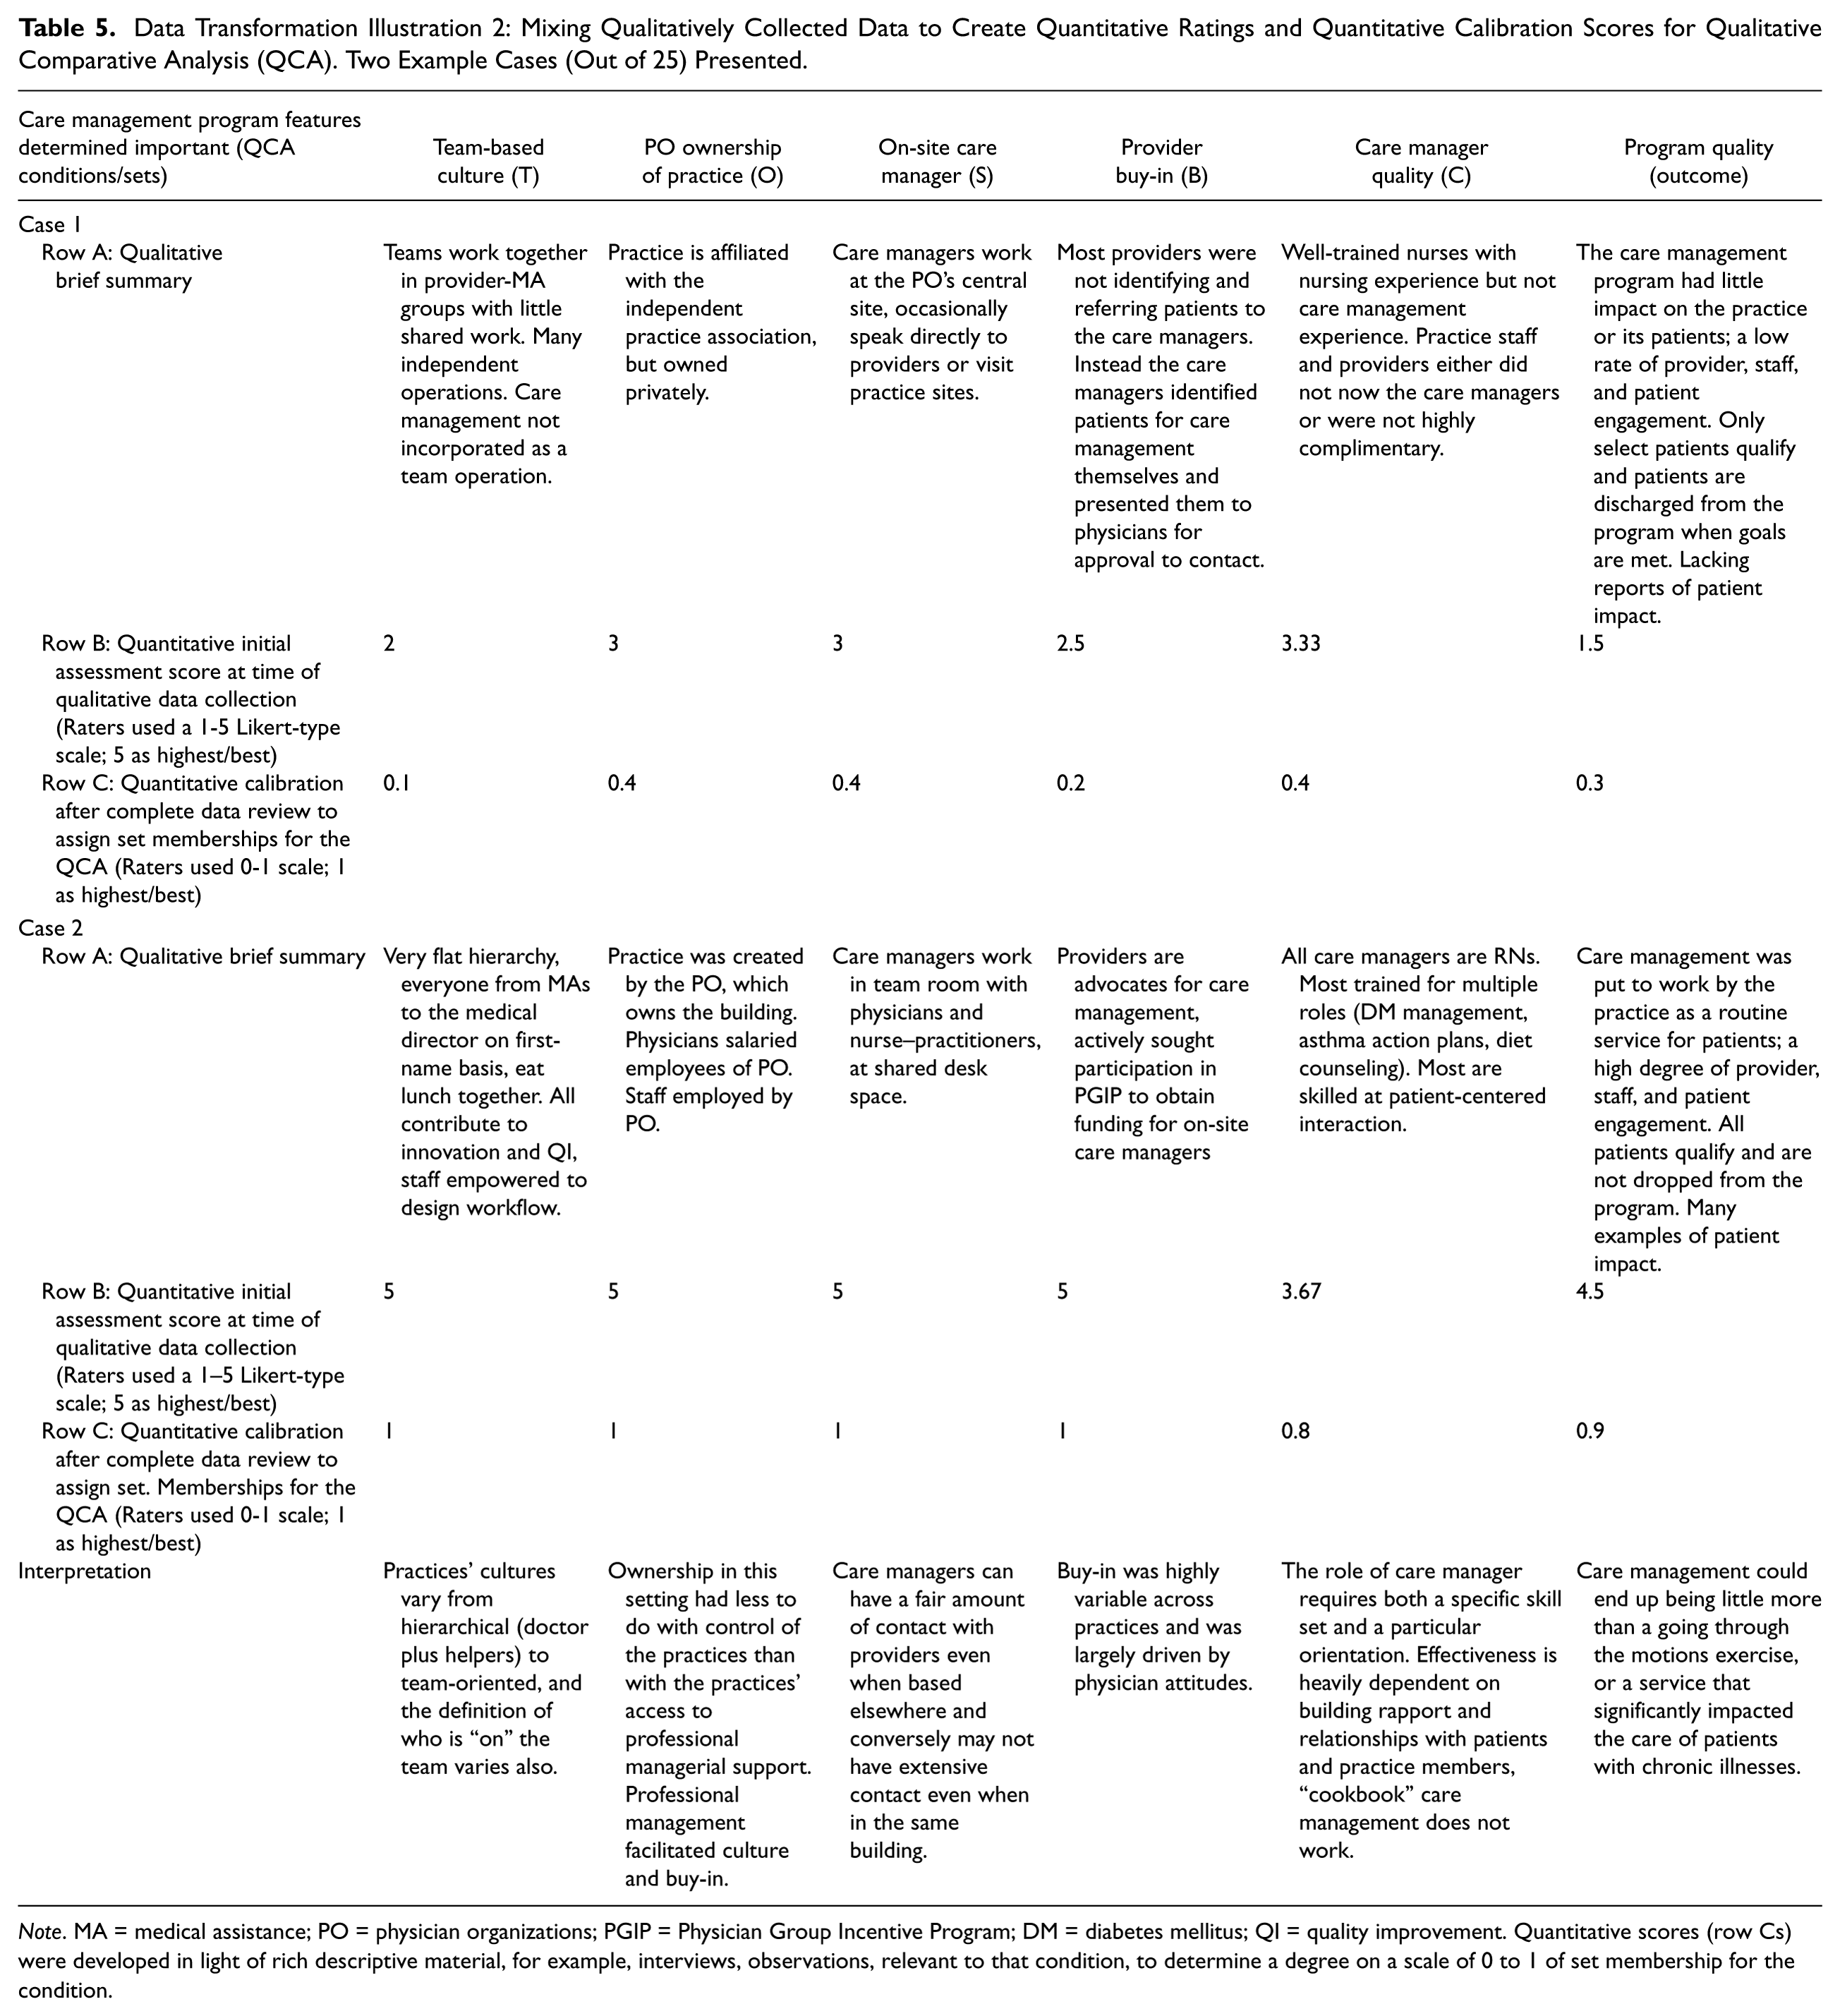
Note. MA = medical assistance; PO = physician organizations; PGIP = Physician Group Incentive Program; DM = diabetes mellitus; QI = quality improvement. Quantitative scores (row Cs) were developed in light of rich descriptive material, for example, interviews, observations, relevant to that condition, to determine a degree on a scale of 0 to 1 of set membership for the condition.
To rank and score these practices and organizations on their care management program, we first developed a list of attributes used to measure each program. Then a group of analysts, individually and then collectively reviewed and determined the responses to those attributes. Since one of the main aims of our project was to identify if there were features in the care management program that seemed to exemplify a quality care management program and impact on outcomes, and since no such measurement tool existed, we had to develop our own. These processes are noted in Figure 1 Boxes H and I, and produced the outcomes in Boxes K and L.
All quantitative practice scores created from both data transformation procedures were placed into an Excel file and analyzed using basic descriptive statistics (Figure 1, Box H). The scores for features within practices were listed and compared (Figure 2, pink box). Also, the scores were listed by care management model within physician organization and the scores for each item for each practice were listed on a spreadsheet (Figure 2, green box). Calculations were made to determine (1) which questions (denoting care management features and implementation) had the most and least variance, (2) which practices overall had high and low scores, and (3) how the scores varied or did not across physician organizations and models. Those features in which there was the most variance across practices were identified as worth examining more closely because they could be influencing the outcome of program quality. Since there are limits to the number of conditions to be examined in QCA, it is important to be selective about which conditions should be included.
The qualitative coders then met with the rest of the qualitative research team. Together they pulled quotations or segments of data by code and divided them up by model and read though all the quotations to determine how the interviewees discussed each of the codes or program features. These were summarized and themes emerged by category. The themes were identified as being alike across models or different across models (Figure 2, blue box). This process thus created qualitative descriptors of the transformed data.
The next step was to construct two analyses to determine what features were important. First, a traditional quantitative analysis was completed to analyze which program features were associated with specific outcomes. This analysis included quantitative scores from both of the data transformation procedures. Cluster analysis was used to determine patterns of the data in terms of which characteristics related to specified outcomes, or “clusters” of success. Second, we used fsQCA as described above.
To conduct the fsQCA, we needed to determine both the important program features of interest (or “conditions”), as well as the program outcome. For the outcome, we chose a quality program score. This score was determined based on our qualitatively collected information on the program quality discussions described in Figure 2. For the conditions, the group posed and answered the following questions: What program and contextual features are likely to have an impact on the outcome? To what extent are these conditions variable? Through the process of identifying variant scores on the scaled questionnaires as well as through the qualitative analysis, themes were identified as being likely to influence the outcome. These items were first put into a logic model to formulate how the factors were thought to influence one another. Essentially, the “conditions” in QCA language are those factors that are likely to affect the outcome. Some of these conditions are quantitative and some of these are qualitative. Therefore, the conditions that went into the QCA analysis were both from the top of Figure 1 (Boxes C and D) that were quantitative and from the bottom of Figure 2 (Boxes H and I) that were qualitative in nature. The conditions that emerged as important for the QCA are described in Table 6 and are also represented in the columns in Table 5. Our next step was to create a raw data table of the conditions and outcome (Figure 1, fsQCA analysis). A table was constructed for the outcome (program quality score), and inputs (or conditions which are the columns) were extensively considered for each outcome.
Data Transformation Number 2: Qualitative Comparative Analysis.
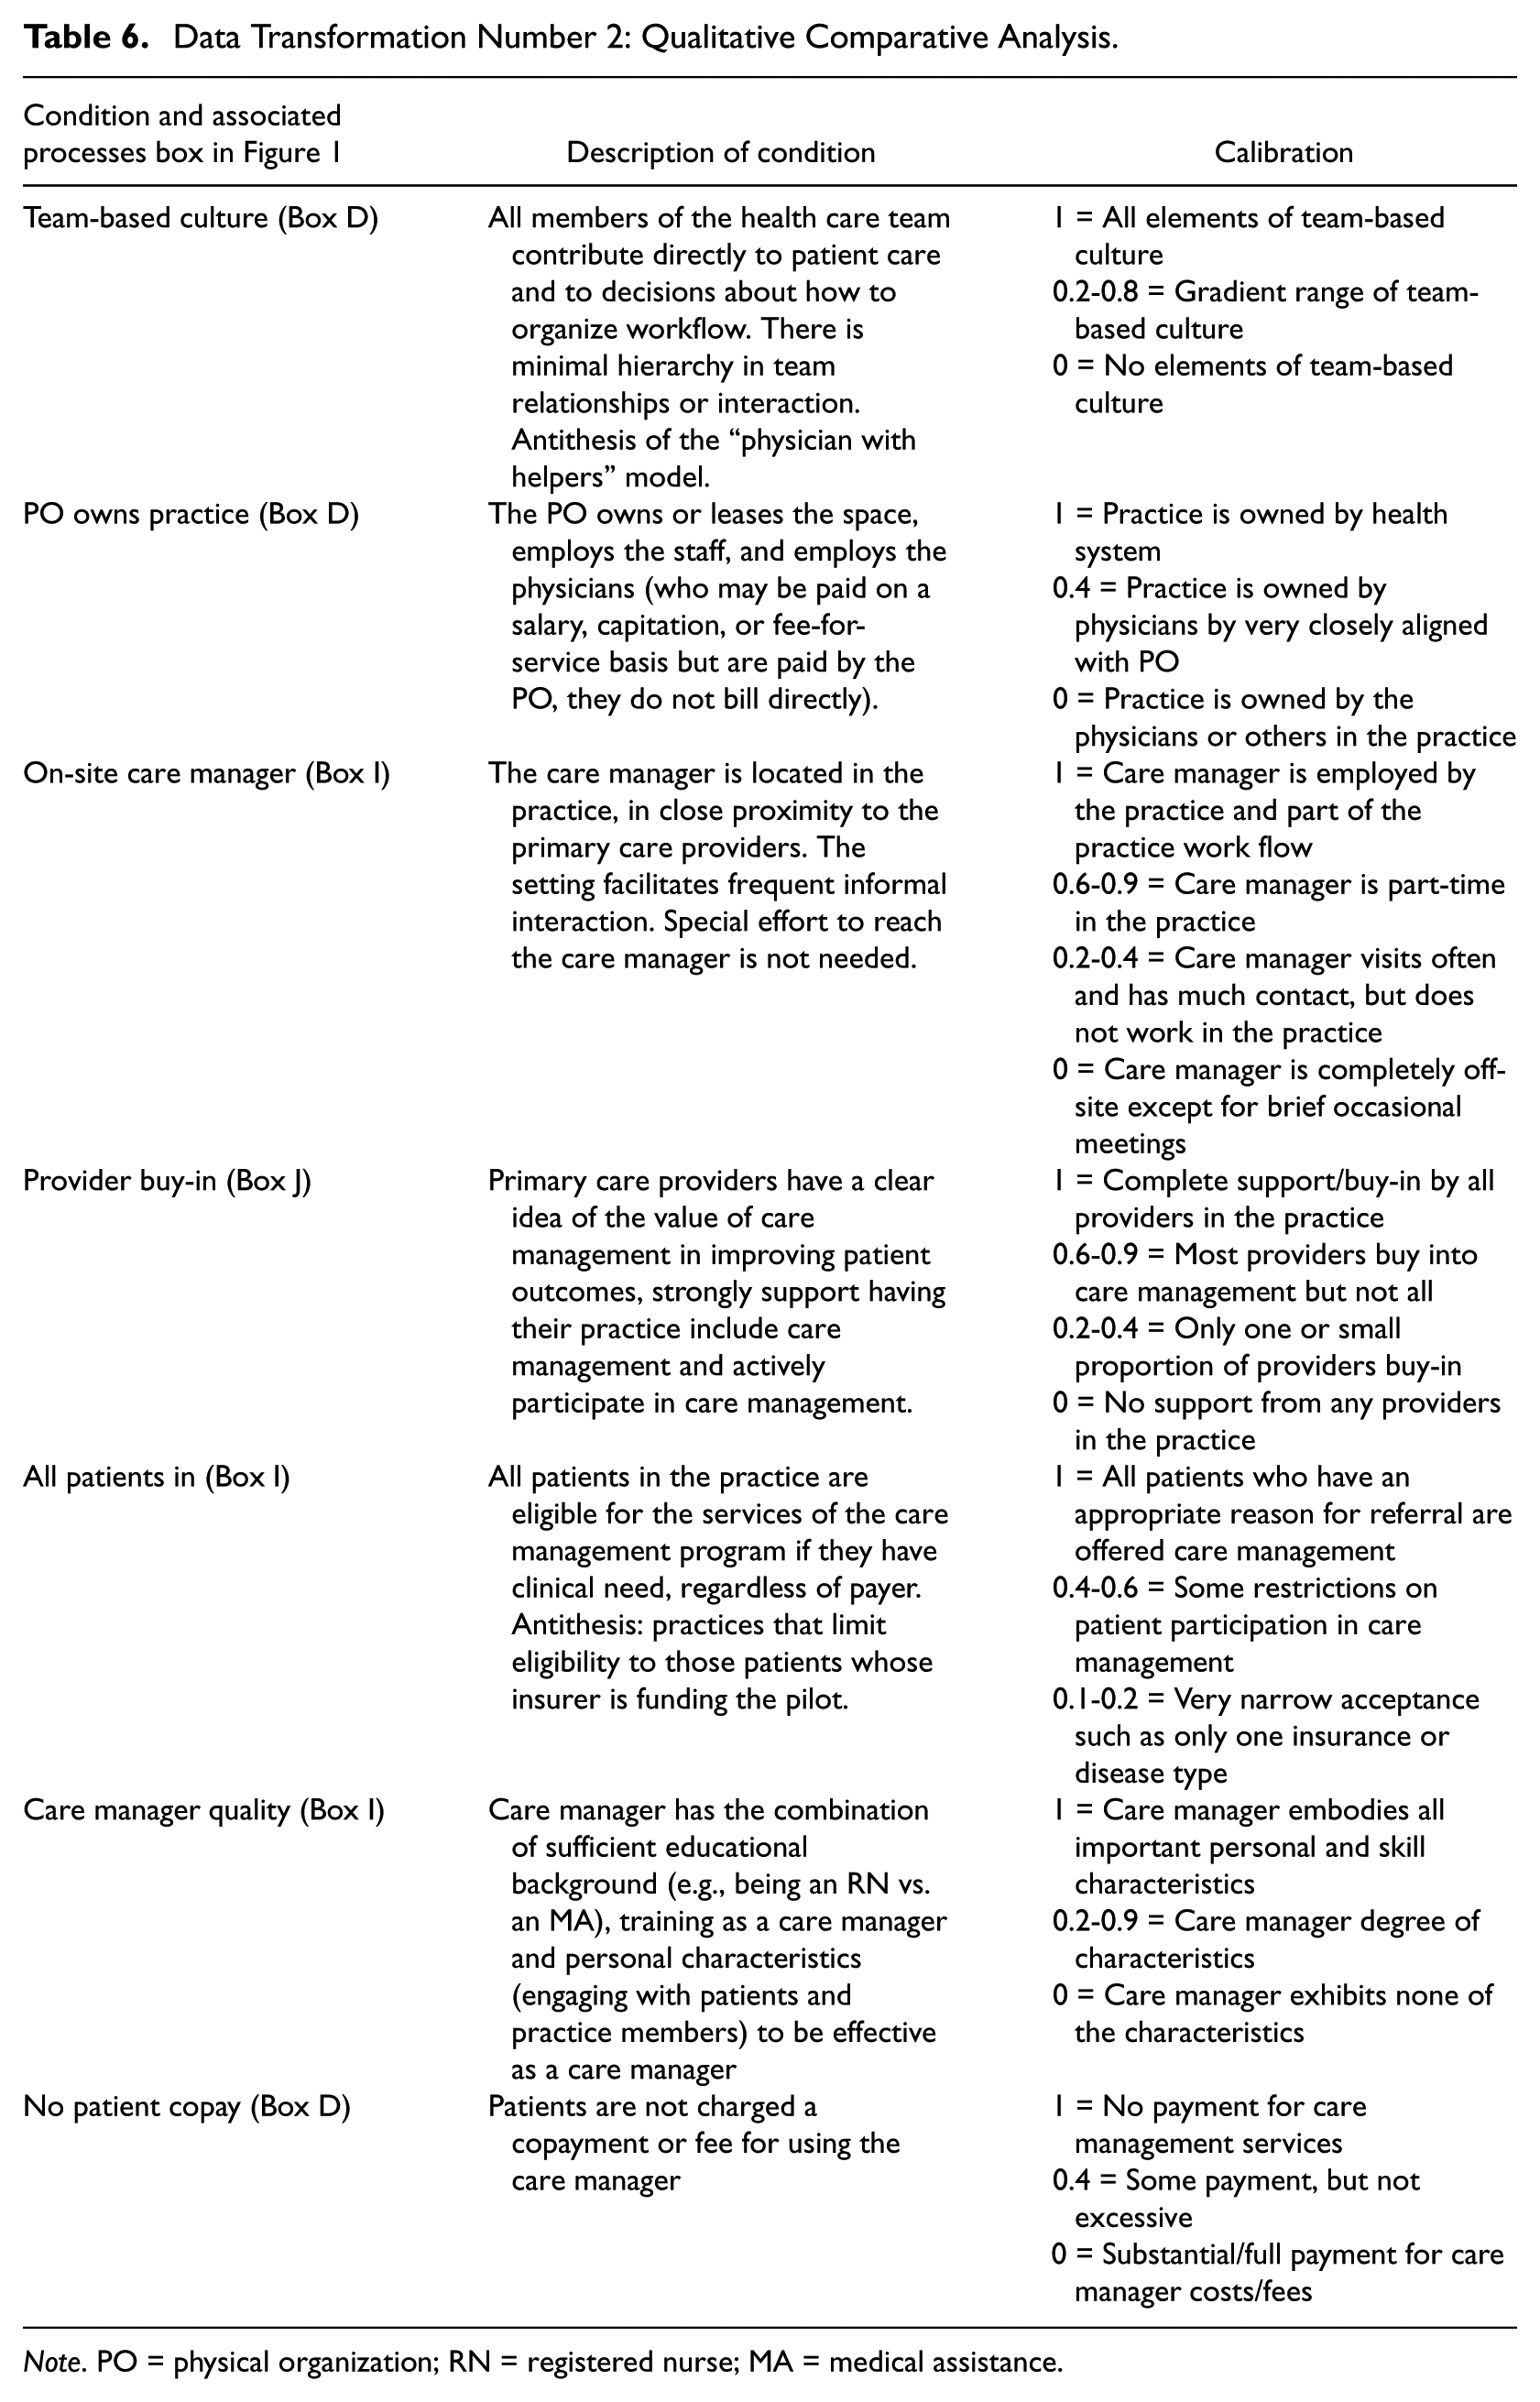
Note. PO = physical organization; RN = registered nurse; MA = medical assistance.
As mentioned, fsQCA requires conditions to be calibrated on a 0 to 1 scale, which requires taking qualitative information and converting (or calibrating) it to a quantitative score. This requires extensive knowledge about what conditions are important and to what extent they exist as a member of that condition set. Therefore, although they end up as quantitative data, extensive qualitative input is needed. Table 6 presents the list of conditions, an overall explanation of each condition and the calibrated score (on a 0–1 scale) given for each practice in relation to the degree to which they were in, partially in, or out of the set for that condition. The calibrations for the two example cases are also presented in the row Cs in Table 5. After the analysis and outputs are completed, qualitative explanations are needed. This displays a back and forth between numbers and the story of the intervention in question. Our in-depth analysis and thematic analysis of features and context proved invaluable for the process of determining key conditions to include and then calibrating the degree of set membership for each condition. Table 5 describes two case examples of how the qualitative information (illustrated in the brief summary in the row As) and the quantitative initial Likert-type assessment ratings (illustrated in the quantitative row Bs) informed the fsQCA calibrated rankings in the row Cs.
Following calibration, we analyzed our data using the fsQCA analysis module “fuzzy” in Stata 13 (Stata Corp, College Park, TX, http://www.stata.com) and the dedicated fsQCA program developed by Claude Rubinson, PhD. We conducted the necessity and sufficiency analysis as individual steps using the software. Finally, we conducted a Quine–McCluskey set reduction calculated by the software to identify complex, parsimonious, and intermediate solutions, as well as consistency and coverage of the solution sets. The output of this analysis (Figure 1, Box N) resulted in program conditions (both features of the practice, environment, care management program, and implementation) that were identified as necessary and/or sufficient for care management success.
Our fsQCA results found key ingredients to effective care management to be a high-quality care manager located on-site with provider support (Holtrop, Potworowski, Rubinson, & Green, 2016).
Through this analysis, we discovered how qualitatively collected information (interviews, observations) could be transformed to a procedure (fsQCA) that allowed us to view our data from another angle and help us to identify important program features. These data combined with the qualitative themes provide a richer understanding of what it takes to organize and implement effective care management in primary care.
Discussion and Conclusions
In this article, we demonstrate how large data sets, data transformation, existing qualitative theory (NPT), and new methods (fsQCA) can be used in a mixed methods research approach for addressing a complex problem in health services research. Care management is an important issue in health services research and one that genuinely requires mixed methods approaches. Both quantitative inference (hypothesis testing) and qualitative phenomenological and mechanistic understanding are needed. Each depends on the other to produce a realistic and usable understanding of this complex issue.
This article contributes to the field of mixed methods research in the following specific ways. First, it provides a detailed example of the highly complex mixed methods data collection and analysis procedures that can be employed to answer compelling health services research questions. In our example, we wanted to determine both comparative outcomes on the implementation of care management (health plan vs. practice-based models) as well as determine components necessary for care management to be successful overall. Without the application of a mixed methods approach, the robust assessment would not have been possible.
Second, this example illustrates some challenges and opportunities when researchers facile in mixed methods research have access to “big data,” very large qualitative or quantitative databases. This study included data on over 12,000 subjects, which allowed our research team to determine clinical trends and utilization trends, and compare our results across difference models of care to determine which had the most beneficial outcomes in the population.
Third, the project required a very large team, including investigators from two university medical schools, a research institution (to provide highly trained personnel to conduct the interviews and collect and analyze the qualitative data), and partnership with the health insurer who also provided several doctorally trained epidemiologists and statisticians very familiar with the insurer’s data sets and the ability to analyze large observational data sets. The researchers at the universities provided project leadership and proposed the study questions, but all operated in a team with everyone having input and opportunity to participate in shaping the study methods and analysis. In many cases, participating with industry (e.g., a health insurance plan) can be challenging due to diverse competing priorities, but in our case this went smoothly because the interests were well aligned. Contributing to the success of the project was the personal integrity of the people involved, but also the structures implemented at the study start such as agreement to all being eligible for authorship on publications and data use agreements regarding privacy and safekeeping of the data. The use of large teams with multiple subgroups and working with industry are common features in health services research. This illustrates the need for mixed methods researchers who can manage these relationships as well as project tasks over time.
Fourth, the large volume of qualitative data necessitated use of an organizing framework for analysis and two different data transformation procedures. We chose a theoretical framework, NPT, and the use of fsQCA. We collected qualitative data that we quantified and analyzed using fsQCA. This led to a narrative about the different configurations of successful care management delivery. We integrated this narrative with other qualitative and quantitative data from other sources.
Various strategies could be used to transform data, and this research illustrates two. For Data Transformation 1, qualitative to quantitative data transformation using theory, Step 1 is to assign Likert-style numerical rankings to the normalization characteristics we examined qualitatively. Step 2 then compares those results to the successful and unsuccessful implementation efforts, which were also assigned a numerical ranking to determine how the normalization components associated with the implementation outcomes. For Data Transformation 2 qualitative case analysis with a fuzzy set approach, Step 1 uses fsQCA by determining the important conditions thought to be associated with the outcome of successful care management quality. Step 2 calibrates those conditions on a 0 to 1 scale. Step 3 uses the QCA program to determine the degree of relationship of the conditions individually and in combination to the outcome of quality care management. Both methods were very useful in their own way in answering our different study questions.
This article further adds to the literature by illuminating the qualitative processes used in health services research, such as those displayed in Figure 2 and the detailed discussion and illustration (Tables 3 and 4) regarding the requisite data transformation (through fsQCA and a priori coding). A key challenge in this type of data transformation designs is how to integrate the transformed data with the quantitative outcome data. Engaging in an extensive discussion here is beyond the scope of this article. Interested readers can refer to the mixed methods literature that addresses understanding of the data transformation process and expected outcomes (Sandelowski, Voils, & Knafl, 2009) as well as the use of QCA and its expected benefits as compared to other analytic methods (Cragun et al., 2016; Haynes, 2014; Krohwinkel, 2015).
Although there are many assets to this study, there are also limitations. First, the real-world examination of a health system pilot study limited the selection of the sample and types of analysis undertaken. The study outcome results would have benefitted from a randomized design and more tightly controlled implementation of care management across settings. Likewise, the study would have benefitted from cleaner data collection regarding the patient participation and clinical data than what were available. Still, it was a large data set and the existence of variation also made other parts of the study worthwhile such that our qualitative work illuminated the benefits and drawbacks of program implementation across settings and model types. Both qualitative and quantitative analyses suffer from their own limitations, including the quality of the data and the interpretation of the data collected by the research team. Health services research would benefit from the most rigor applied as possible in the sampling, collection, and analysis of health care data for use in addressing research questions. Failing that, using the most advanced research methods that are most appropriate to the questions being asked should provide insightful for researchers and health care delivery decision makers.
As illustrated by this discussion, there are major opportunities for advancing mixed methodology through health services mixed methods research. We anticipate that health services researchers will continue to push the envelope of mixed methods integration, not only through qualitative to quantitative data transformations but also through quantitative to qualitative data transformations.
Footnotes
Appendix
Editorial Team Note:
Michael D. Fetters participated in this manuscript prior to becoming coeditor of the Journal of Mixed Methods Research and was blinded to the peer review and acceptance process of this article.
Declaration of Conflicting Interests
The author(s) declared no potential conflicts of interest with respect to the research, authorship, and/or publication of this article.
Funding
The author(s) disclosed receipt of the following financial support for the research, authorship, and/or publication of this article: This study was funded by the Agency for Healthcare Research and Quality (Grant No. 1 R18 HS020108-01).