
Abstract
Photograph analysis poses a novel methodological challenge for mixed methods researchers. In this paper, we argue that photographs are a valid data source that are not outside of the quantitative–qualitative binary and, hence, can be analyzed and used for integration, applying mixed methods principles. We summarize photograph analysis methods from different scientific fields and contribute to the field of mixed methods by proposing a mixed methods framework for analyzing visual data that allows the flexible application and integration of different quantitative and qualitative photograph analysis methods by focusing on data transformation. We use an illustrative example from consumer research.
Introduction
Integration in mixed methods research (MMR) means that quantitative and qualitative data are combined at one or more stages in the research process in such a way that they add up to more than the sum of their parts (Woolley, 2009). Greene et al. (1989) and Fielding (2012) identified justifications for MMR, such as triangulation, complementarity, development, initiation, analytical density, and expansion. The choice of data type and the timing and method of the integration of qualitative and quantitative approaches are key (e.g., Fetters et al., 2013; Fielding, 2012; Tashakkori & Teddlie, 2007, 2010). Fetters et al. (2013) differentiates integration at the study design level (e.g., exploratory sequential, explanatory sequential, and convergent), at methods level (e.g., merging two databases for analysis), and at interpretation and reporting level (e.g., data transformation). The present article focuses on integration within the data analysis and interpretation level. Studies have adopted many different data integration strategies, including data transformation, typology, the consolidation of findings, case analyses, and building matrices (Bazeley, 2009; Caracelli & Greene, 1993). Data transformation, which is the focal interest in this article, means that one type of data is converted into the other type of data (e.g., qualitizing quantitative data or quantitizing qualitative data) so that the transformed data can be integrated with other data sets. For example, qualitative data can be transformed into numeric data and variables using content analysis and creating quantitative variables (e.g., Vogl, 2019), or quantitative data can be transformed into a qualitative format by, for instance, grouping participants based on quantitative measures (e.g., van Velzen, 2018).
The use of visual methods in MMR is highly varied and not new. However, few studies have systematically reflected on the use of visuals for integration. Plano Clark and Sanders (2015) found that visual displays in MMR have been used to depict different types of integration information in the form of matrices, figures, and tables. Others have added visual methods to complement, confirm, elaborate on, or contradict data generated with other methods (O’Connell, 2013) or have investigated the effect of visual activities (e.g., collage creation) on participants without analyzing the produced visuals (Johnson et al., 2020). There are examples of integrating quantitative or qualitative photograph analyses with non-visual methods, for example, Shannon et al. (2021) (integration of quantitative photograph analysis with qualitative group discussions) and Ares et al. (2011) (integration of semiotic qualitative photograph analysis with a quantitative survey); however, they do not integrate quantitative and qualitative photograph analysis.
Shannon-Baker and Edwards (2018) investigated the integration of visuals into mixed methods studies, positioning visual methods outside the qualitative-quantitative binary. Although photographs or other visual data may have unique characteristics, we think that such a juxtaposition of visual methods and mixed methods is not useful for a theoretical grounding of visual methods in MMR. We appeal instead for consideration of visual methods as one of many (qualitative and quantitative) methods that can be used and integrated in MMR, within the qualitative-quantitative paradigm. Indeed, as shown later using an example of analyzing photographs, visual analysis methods can apply either quantitative or qualitative principles (or both).
Conceptual Framework: Photographs and Visual Methods
Photographs have become an important part of society due to developments in digital photographic technology, the emergence of smartphones with integrated cameras and large storage capacities, and social media. Products and services are typically first experienced visually by consumers (e.g., on websites, at the point of sale, or in advertisements). Personal experiences with products or services are often shared through photographs. In short, the social habit of producing, sharing, and looking at photographs has grown in importance in recent years (Kleih et al., 2020).
Scholars increasingly employ photographs in empirical consumer research. Photographs have been used to, for example, investigate consumer preferences and consumption processes regarding clothes (e.g., Vermaak & Klerk, 2017), food (e.g., Thompson et al., 2015), and tourism (e.g., Giglio et al., 2019). However, most research approaches have fallen at one of two ends of a spectrum. On the one end, some scholars have used photographs merely as supportive stimuli for interviews and disregarded them in the analytical process (e.g., Vermaak & Klerk, 2017). On the other end of the spectrum are studies that have focused on the quantitative aspects of photos (e.g., Vilnai-Yavetz & Tifferet, 2015). More broadly, visual methods in the social sciences are in a difficult position, even though interest in the visual is high; a common theoretical grounding is still missing (e.g., Pauwels, 2010). Depending on the discipline, the significance given to visual methods differs. For example, sociology has had longstanding reservations about the validity and representativeness of visual materials, giving superiority to analysis of text or statistics, whereas in ethnography, there is a long tradition of the use of visuals (Grady, 2008; Pink, 2013).
As far as the term “visual data” is concerned, we adopt the approach used by Grady (2008) and use it to refer to any visual object or artifact, including material culture, images, pictures, and photographs. While we focus on photographs herein, we believe much of what we say can be transferred to other visual data. It will be useful for our discussion to differentiate between methods that analyze the figurative and semantic content of photographs (the subject of this article) and other visual methods, such as using photographs for documentation, conducting interviews, arts-based approaches, etc. (not the subjects of this article). By “photographic analysis,” we mean the systematic analysis of the content/internal narrative of what is displayed or represented in the photograph. However, we do not mean to suggest that a photograph has meaning based on the photograph in itself/ontologically, but rather that a subject (researcher/participant) attributes meaning to a photograph in an interpretative act. Approaches analyzing the content of photographs, such as in the qualitative social sciences, were developed for a detailed analysis of individual photographs. Nowadays, photographs are used quantitatively, as on websites or social media, meaning that such methods must be used in conjunction with other approaches (Kleih et al., 2020).
Methodological Aim
The methodological aim of this article is to depict ways to integrate quantitative and qualitative photograph analysis methods in the theoretical terms of MMR. To do so, we analyze the principles of existing photograph analysis methods and suggest a procedural framework for integrating these. We argue for the advantages of mixed methods photograph analyses. We also consider the integration of photograph data with other qualitative data (e.g., text obtained from qualitative interviews, comments on websites, or social media), as well as quantitative survey data. Neither quantitative nor qualitative photograph analysis is new, and neither is the combination of both (e.g., Bell & Milic, 2002); however, we think a thorough discussion of implementing these in MMR is missing and would be beneficial for the practice of MMR.
The Use and Challenges of Photographs in Social Science and Consumer Research
In the following, we first discuss the challenges of using photographs in social science research in general; and second, as we are coming from a consumer research point of view, we explore how photographs have been used in consumer research to date.
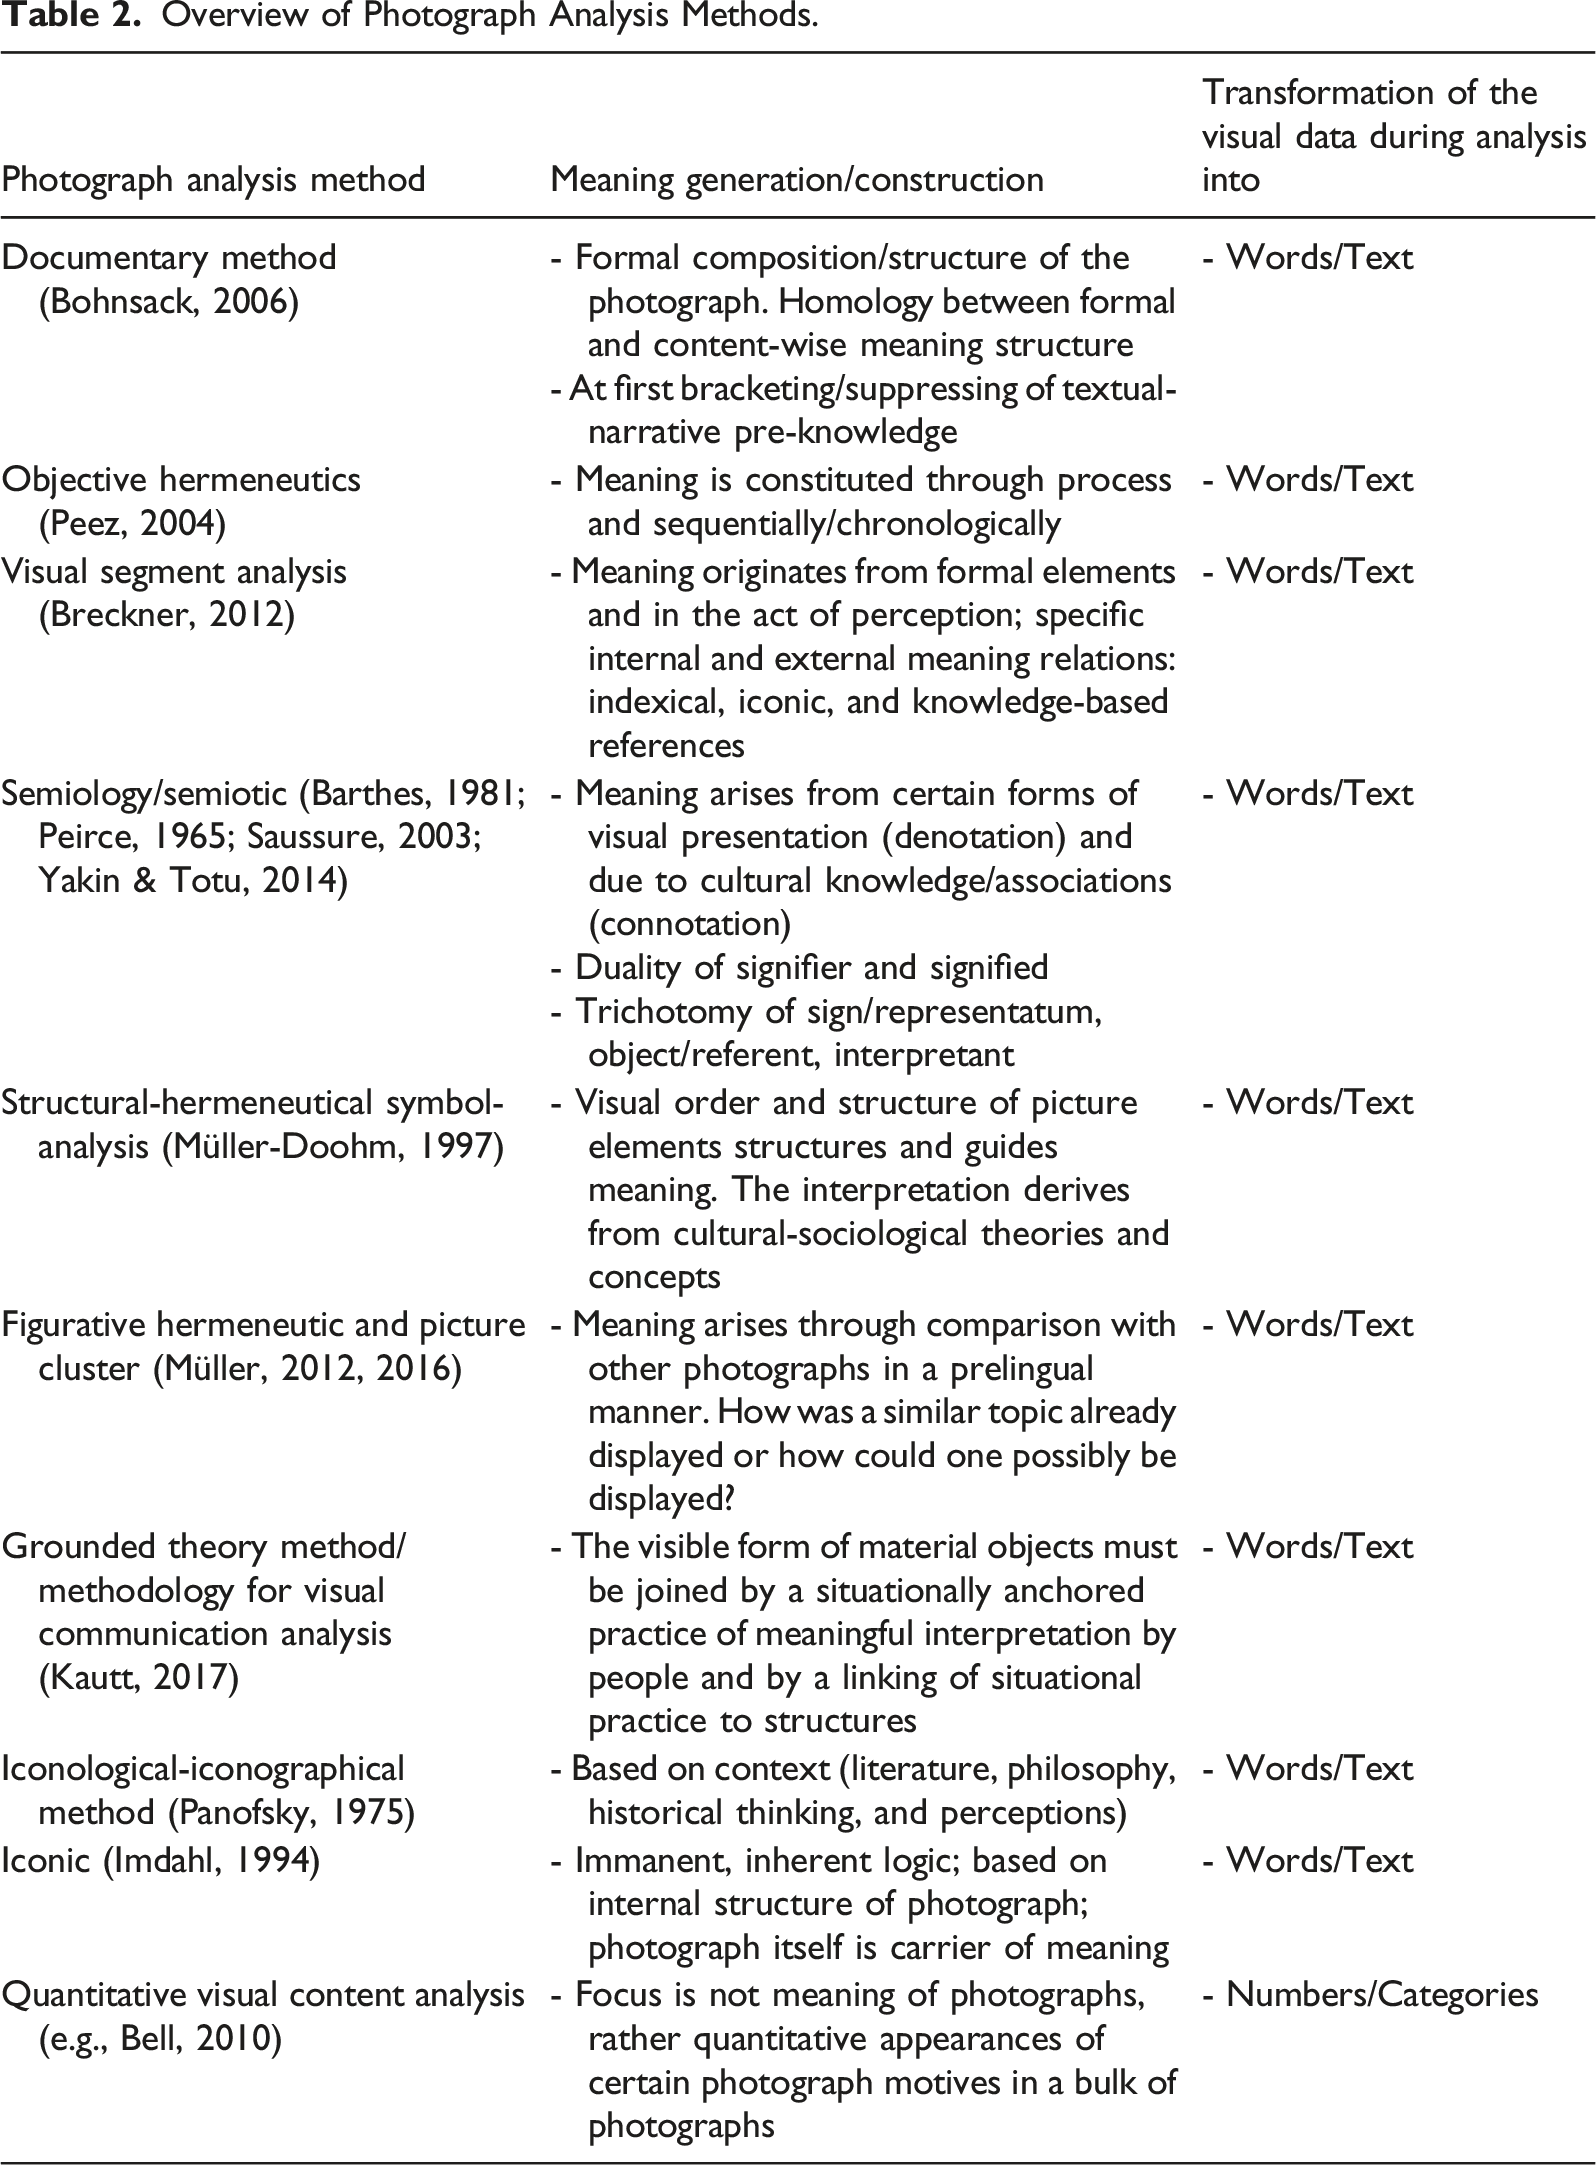
The Challenges of Using Photographs
Grady (2008) finds that some social science disciplines have reservations about visual data, for example, about how representative and valid such materials can be. The reasons for photographs’ undetermined role in some disciplines may be related to the challenges they pose for researchers due to their characteristics. In particular: • Science is often interested in generalizations. The display of abstract facts is linked with non-iconic signs, whereas photographs are iconic and display concrete things (Wuggenig, 1989).The conclusion from concrete to general applies to analysis of other data types as well. So far, photographic analyses have met this challenge by displaying the general hypothesis derived from the analysis of concrete photographs with non-iconic signs (words). • What photographs display is, on the one hand, obvious (e.g., a photo of a car shows a car) and, on the other hand, ambiguous (e.g., dependent on the viewer, cultural context, and interpretation process, a photo of a car may signify a prestige object or a means of transport). Furthermore, it is contested whether photographs have grammar (e.g., Forceville, 1999); everything is simultaneous. This polysemy and simultaneity make photographs difficult to use as scientific data (Fuhs, 1997). There are also complexities related to if, how, and when photographs should be translated into language (i.e., whether a transformation from iconic or presentative symbolization to discursive symbolization occurs), as well as questions related to whether photographs can be fully interpreted at all (see, e.g., Breckner, 2012; Müller-Doohm, 1997; Shannon-Baker & Edwards, 2018). To tackle these challenges, different photograph analysis methods have been developed (see Table 2). For example, the visual segment analysis (Breckner, 2012) draws on different ways of verbalization (e.g., physical, affective first impressions, and formal description) and analytical steps to articulate presentative symbolization of photographs. • Ethical questions concerning the privacy and anonymization of research participants apply more strongly to photographs (O’Connell, 2013). For example, photographs may show participants’ faces, their private homes, or their social fields. The protection of such sensitive data is paramount. Researchers have addressed this issue either by cropping, blurring and excluding (parts of) photographs, or by asking participants at the end of data collection for their consent, so that they can agree to the usage and publication of specific visual content (e.g., Wills et al., 2013). • Representation and power imbalance: The written word might be regarded as a superior medium of representation. Pink (2013) argues that there is no essential hierarchy of media. As with all other media, questions arise about how to represent participants and their experiences adequately (Banks & Zeitlyn, 2015). This is not just an epistemological matter, but also a matter of power (Galman, 2009). It directly concerns the analysis of photographs. The viewer of a photograph shares the experience of engagement with the photographer, but not necessarily the meaning (Grady, 2008). Hence, a researcher who performs an analysis should be aware of and make transparent the personal interpretative act, which is influenced by its disciplinary framing and other contexts. The result is a partial representation of the reality the researcher (in collaboration with the participant) perceived. The inherent power imbalance of representation has been addressed by replacing one voice (the researcher) with many, for example, through collaboration; shared reflection; and acknowledgment of the situatedness and cultural, historical, and contextual dependency of phenomena and constructedness of reality (Galman, 2009).
Visual methods encompass all sorts of involvement of visual data or visual work in the research process, not just the analysis of visual material. As we will see from the example of consumer research used below, the subject matter of research is often not the visual itself, but the reflective process or the effects of using visual methods.
The Use of Photographs in Consumer Research
In consumer research, using, and especially analyzing, photographs is still not very common, yet photographs are well-suited to consumer research. Consumer behavior is often studied for the purposes of improving existing or inventing new products and services (Naderer & Balzer, 2011). Thus, the research focus is usually a physical object or a service that has, in one way or another, a visual expression. According to sociology, physical objects do not only have instrumental functions; they also embody peoples’ emotions, personalities or lifestyles, and social statuses or goals (Wuggenig, 1989). Thus, photographs are capable of representing the material sides of consumers’ lives as well as the invisible values and meanings inherent in them. Just one viewing of a photograph immediately gives the viewer a sense not only of the content of the photograph but also of the atmosphere, context, and mood, which a mere written or verbal description would not be able to provide. In the following two paragraphs, we look at how photographs are used in qualitative and quantitative consumer research.
In qualitative consumer research, photographs are often used to capture consumers’ subjective perspectives and interpretations. Such methods include photovoice (e.g., Bibeau et al., 2012; O’Connell, 2013), photo-elicitation (e.g., Galvez et al., 2017), and photograph sorting (e.g., Lobinger & Brantner, 2020), which involves the integration of photographs into qualitative interviews. Photographs, which may be produced by either the researcher or the participant, are used during the interview process to activate memories, enhance communication and motivation, reduce stress, and provoke narratives (Collier, 1957). During the analysis, the main focus is on the transcribed interview text; the photographs themselves are not further analyzed (e.g., Bibeau et al., 2012; Galvez et al., 2017). In such cases, photographs are used to collect data, but are not viewed as data to be analyzed. The researchers’ interest lies not in what the photographs express, but rather on the participant’s reflection process and meaning making.
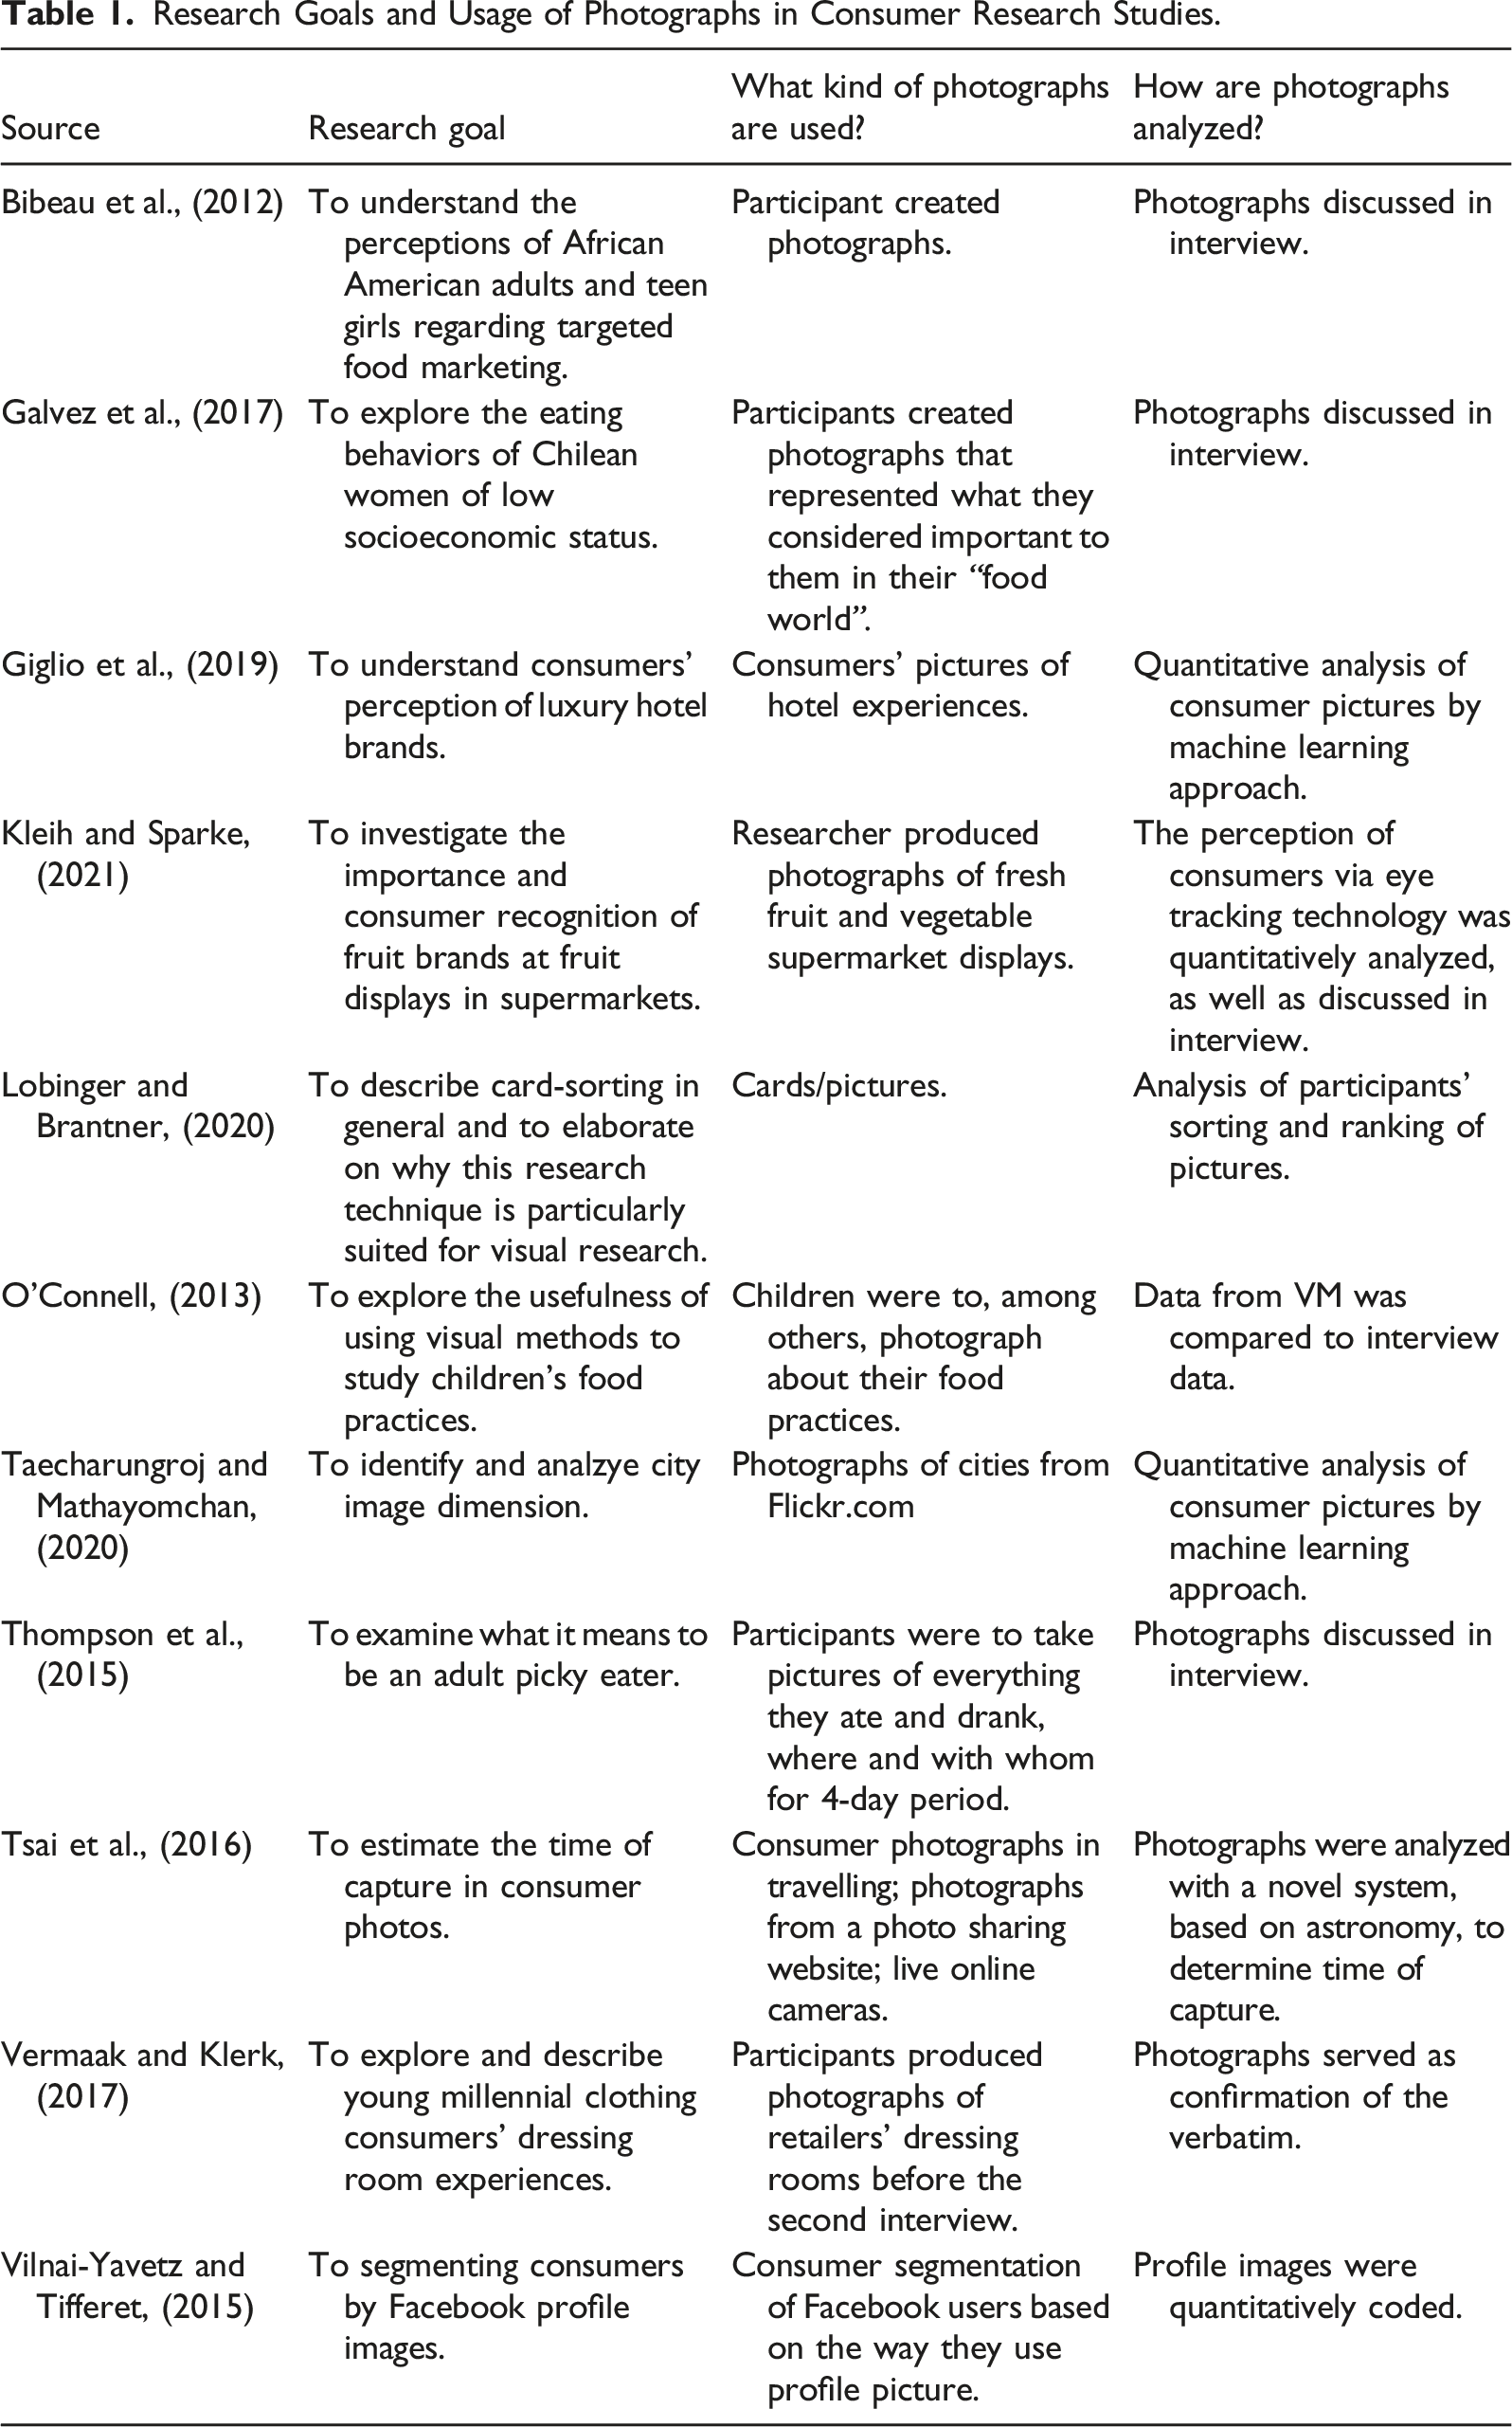
Quantitative methods and photographs have been used, for example, in e-commerce and advertising research (e.g., Taecharungroj & Mathayomchan, 2020), usability research, user-friendliness and consumer experience research (e.g., Vilnai-Yavetz & Tifferet, 2015), social media analysis (Tsai et al., 2016), and visual marketing (Kleih & Sparke, 2021). Photographs are sourced from consumers (e.g., Facebook and Instagram postings, and Flickr), the Internet, or existing advertising, and are analyzed using different software applications and deep-learning algorithms such as Google Cloud Vision API (e.g., Taecharungroj & Mathayomchan, 2020). Again, researchers consider the content of the photographs used to be less important than their effects on the consumers. The photographs’ obvious figurative meanings (e.g., the presence of certain objects, such as clothing) are also identified and quantified. Table 1 summarizes the research goals of the cited consumer research studies and how each uses and analyzes photographs.
Research Goals and Usage of Photographs in Consumer Research Studies.
Photograph Analysis Methods
Overview of Photograph Analysis Methods
Overview of Photograph Analysis Methods.
Visual Segment Analysis ‐ Example of a Qualitative Approach
Breckner (2012) suggests a symbol-theoretical approach to analyze photographs. Its starting point is the idea that symbolization processes generate meaning. Photographs emerge from symbolization processes and they connect to previous symbolization processes. By looking at photographs, visual perception processes emerge, which have photograph-specific dynamics that cannot be articulated verbally straightforwardly. During verbalization, photographs and their meaning change. The different modes of generating meaning between photographs and language/text are as follows: the meaning-generating elements (Breckner calls them “segments”) in photographs have no syntax and their perception follows no linear path. Visual perception takes place simultaneously and successively. While all elements are present at the same time, perception is a process, and focuses on different elements one by one and puts them into relation. Through this process, meaning is generated. The process of putting elements in relation is based on indexical, knowledge based, and iconic references in the photograph. The processes of perception, concept formation, and interpretation are closely and insolubly connected with each other. In other words, the meaning of a photograph and its perception are guided, but not determined, by the iconic structure of the photograph.
Quantitative Visual Content Analysis ‐ Example of a Quantitative Approach
Visual content analysis is a systematic method that examines visual patterns by categorizing and quantifying units of content, rather than examining individual photographs. A visual content analysis can identify which content is treated as important and which agenda is followed with which visual strategy. The research questions of such analyses focus on the priority given to certain content (e.g., how often, how large, or where in sequence is something shown), the frequency of certain topics, and historical changes in representations (Bell, 2010). Visual content analyses now frequently use computer deep-learning technology; for example, commercial picture analysis software and artificial intelligence can identify and count or measure objects and have been used to analyze visual content, particularly in social media (Giglio et al., 2019; Zhang et al., 2019). The analytical process requires, first, the definition of the visual content and the visual body to be analyzed (i.e., which visual unit or topic is in focus and in which media?) Second, the specified visual content is identified within the whole photograph body and is analyzed (e.g., by counting).
Combination of Quantitative Content Analysis and Visual Semiotic
Some studies have used combined approaches (e.g., Bell & Milic, 2002) to categorize and interpret a large volume of photographs. Bell and Milic (2002), for example, isolated semiotic variables and used them quantitatively as codes. Mortelmans (1997), proceeding in a similar manner, analyzed advertisements by decomposing advertisement’s signifier and signified (sign) into a form and a content each in order to apply this coding quantitatively. His analysis did not aim to construct the meanings of individual advertisements, but to identify the constructive process that results in a luxury signified.
Reflection on Photograph Analysis Methods
The qualitative approaches described in the section “photograph analysis methods” (see Table 2 and the section “visual segment analysis”) analyze in detail the composition of a photograph and investigate, either implicitly or explicitly, the question of how photographs convey meaning or how meaning can be attributed to the photograph. These methods differentiate between two levels of meaning: the obvious meaning that is depicted in the photograph (i.e., the immanent meaning, denotation, or manifest meaning) and the more subtle meaning that requires interpretation and reconstruction (i.e., the documentary meaning, connotation, or latent meaning). The qualitative approaches consider that photographs and their interpretation construct reality, whereas the quantitative approach captures their manifest meaning (e.g., the appearance of certain topics or their patterns in the majority of photographs) and treats them as real in and of themselves. Therefore, an integration of qualitative and quantitative analysis methods needs to answer research questions that address both levels of meaning.
Studies that quantify visual semiotics show how these levels of meaning can be addressed by combining quantitative and qualitative methods. We adopt this notion for a generalized theoretical discussion of how quantitative and qualitative photograph analysis can be integrated. The qualitative approaches translate the photographs into text in various ways and the quantitative approach quantifies their themes, similarly to the quantification of text through coding (data transformation). The resulting data, the text, codes, and numbers, are the connecting points for the integration of these methods. As stated above, the notion of “translating” photographs into text (and quantities) is contested, as is the possibility of and even need for analyzing photographic content at all. We do not take the stance that this is the only way of handling visuals in social research. Instead, we argue in favor of the pragmatic approach that this process offers the possibility of integrating quantitative and qualitative photograph analysis.
Using Photographs for Integration in Mixed Methods Research
Integration of Quantitative and Qualitative Photograph Analyses
Integration in MMR means that quantitative and qualitative methods are combined in such a way that together they add up to more than the sum of their parts (Woolley, 2009). The transformation of photographs into text (qualitative) and numeric (quantitative) material, and the levels of meaning (i.e., manifest and latent) are the starting points for integration in our framework. Figure 1 depicts our proposed procedural framework for integrating quantitative and qualitative photograph analysis methods. Procedural framework for integrating quantitative and qualitative photograph analyses.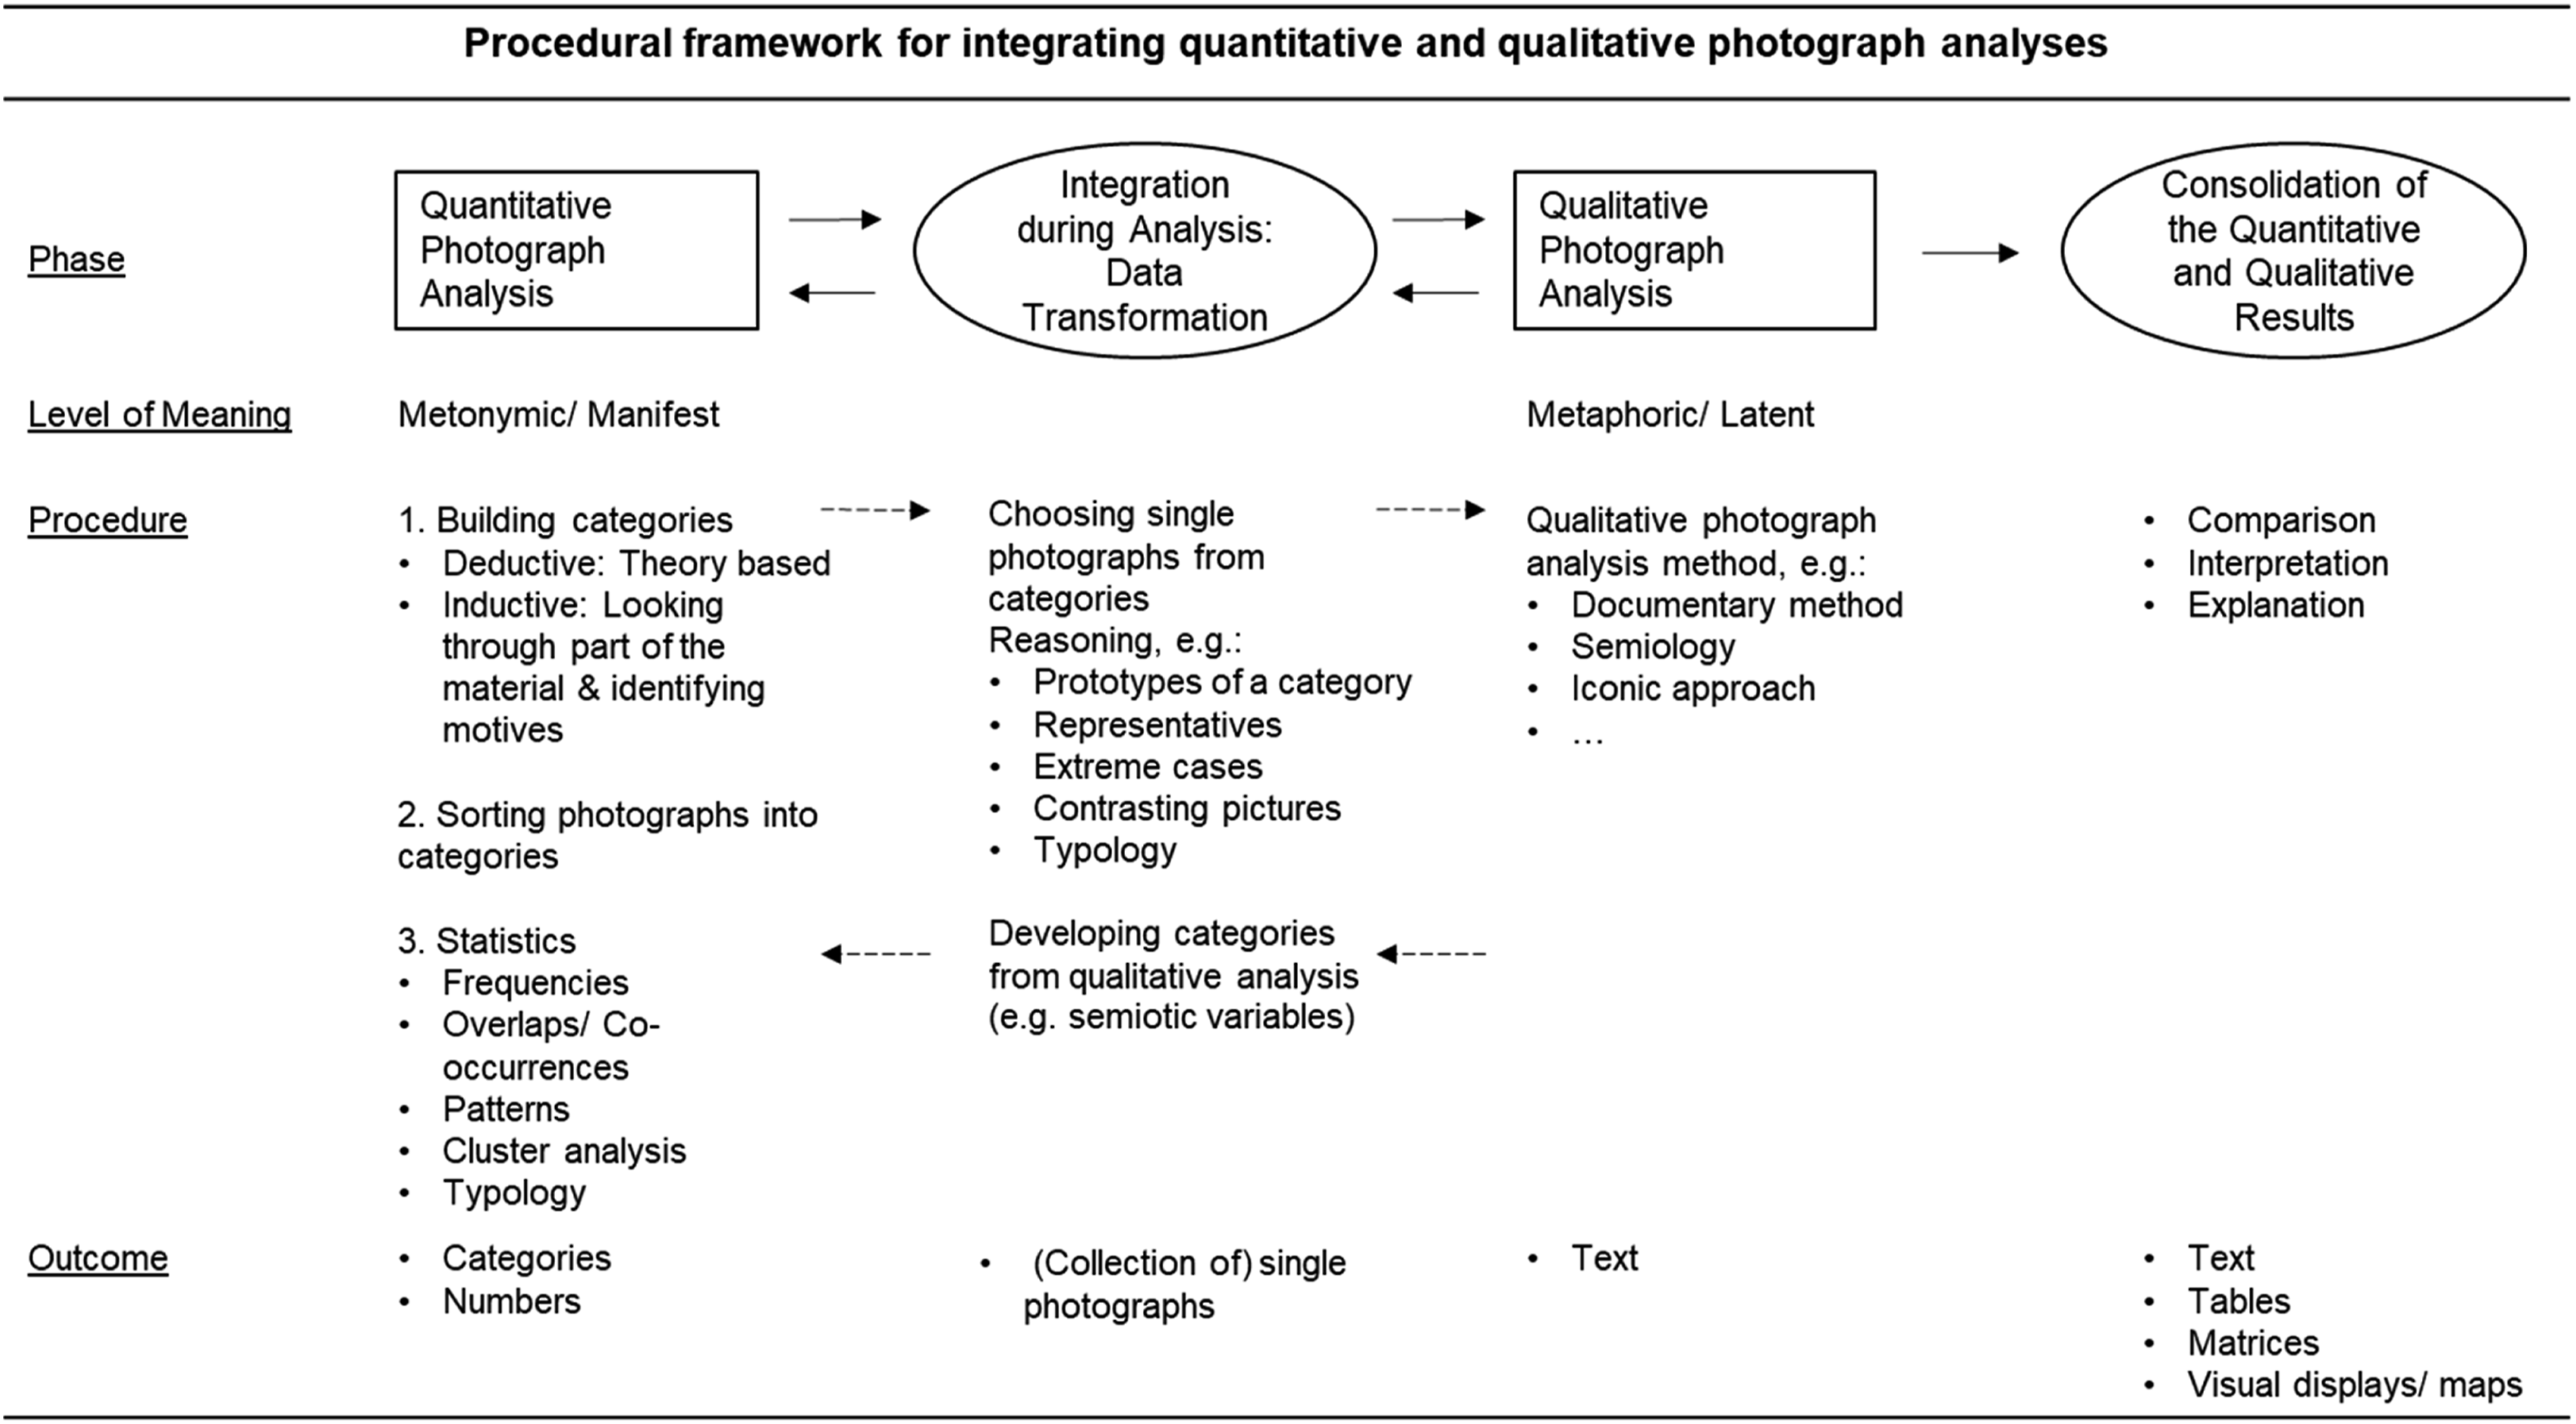
Our proposed approach is based on the assumption that a large number of photographs have been sampled as data to be analyzed. The analysis could start with a quantitative content analysis by defining categories and categorizing all of the photographs, possibly with the help of computer software. On basis of this categorization, frequencies, overlaps, and patterns can be statistically analyzed. The quantitative content analysis investigates the manifest meaning of the photographs on the metonymic level and forms the basis of the qualitative photograph analysis that follows. In the latter, individual photographs from each category can be selected based on specific qualities, such as being prototypes or representatives of a category, representing extreme cases, or showing contrast, or based on a typology. The selected photographs can be further analyzed using qualitative methods, investigating their latent meaning on the metaphorical level. The analysis could also start with a qualitative photograph analysis (e.g., identifying how certain connotations are constructed), then use this finding to guide the sampling of photographs by searching for and quantifying those elements (e.g., how often and in which context do they occur?). The results of the quantitative and qualitative analyses can be integrated through comparison, interpretation, explanation, and writing cases.
Empiric Example of the Procedural Framework in Consumer Research
To clarify the process depicted in Figure 1, we draft an empirical example. We take the data from a study in Germany, where we asked seven participants to take photographs of their consumer behavior regarding fresh fruits and vegetables. The participants were chosen based on their household situation (single, with partner, with children etc.), age, and gender. Figure 2 shows a selection from the 171 photographs we received. We printed the photographs and conducted an interview with each participant to talk about the photographs. For the analysis, we used an explanatory mixed methods research design. For the quantitative photograph analysis, we applied the quantitative visual content analysis, and for the qualitative photograph analysis, the visual segment analysis. Sample of participant photograph material.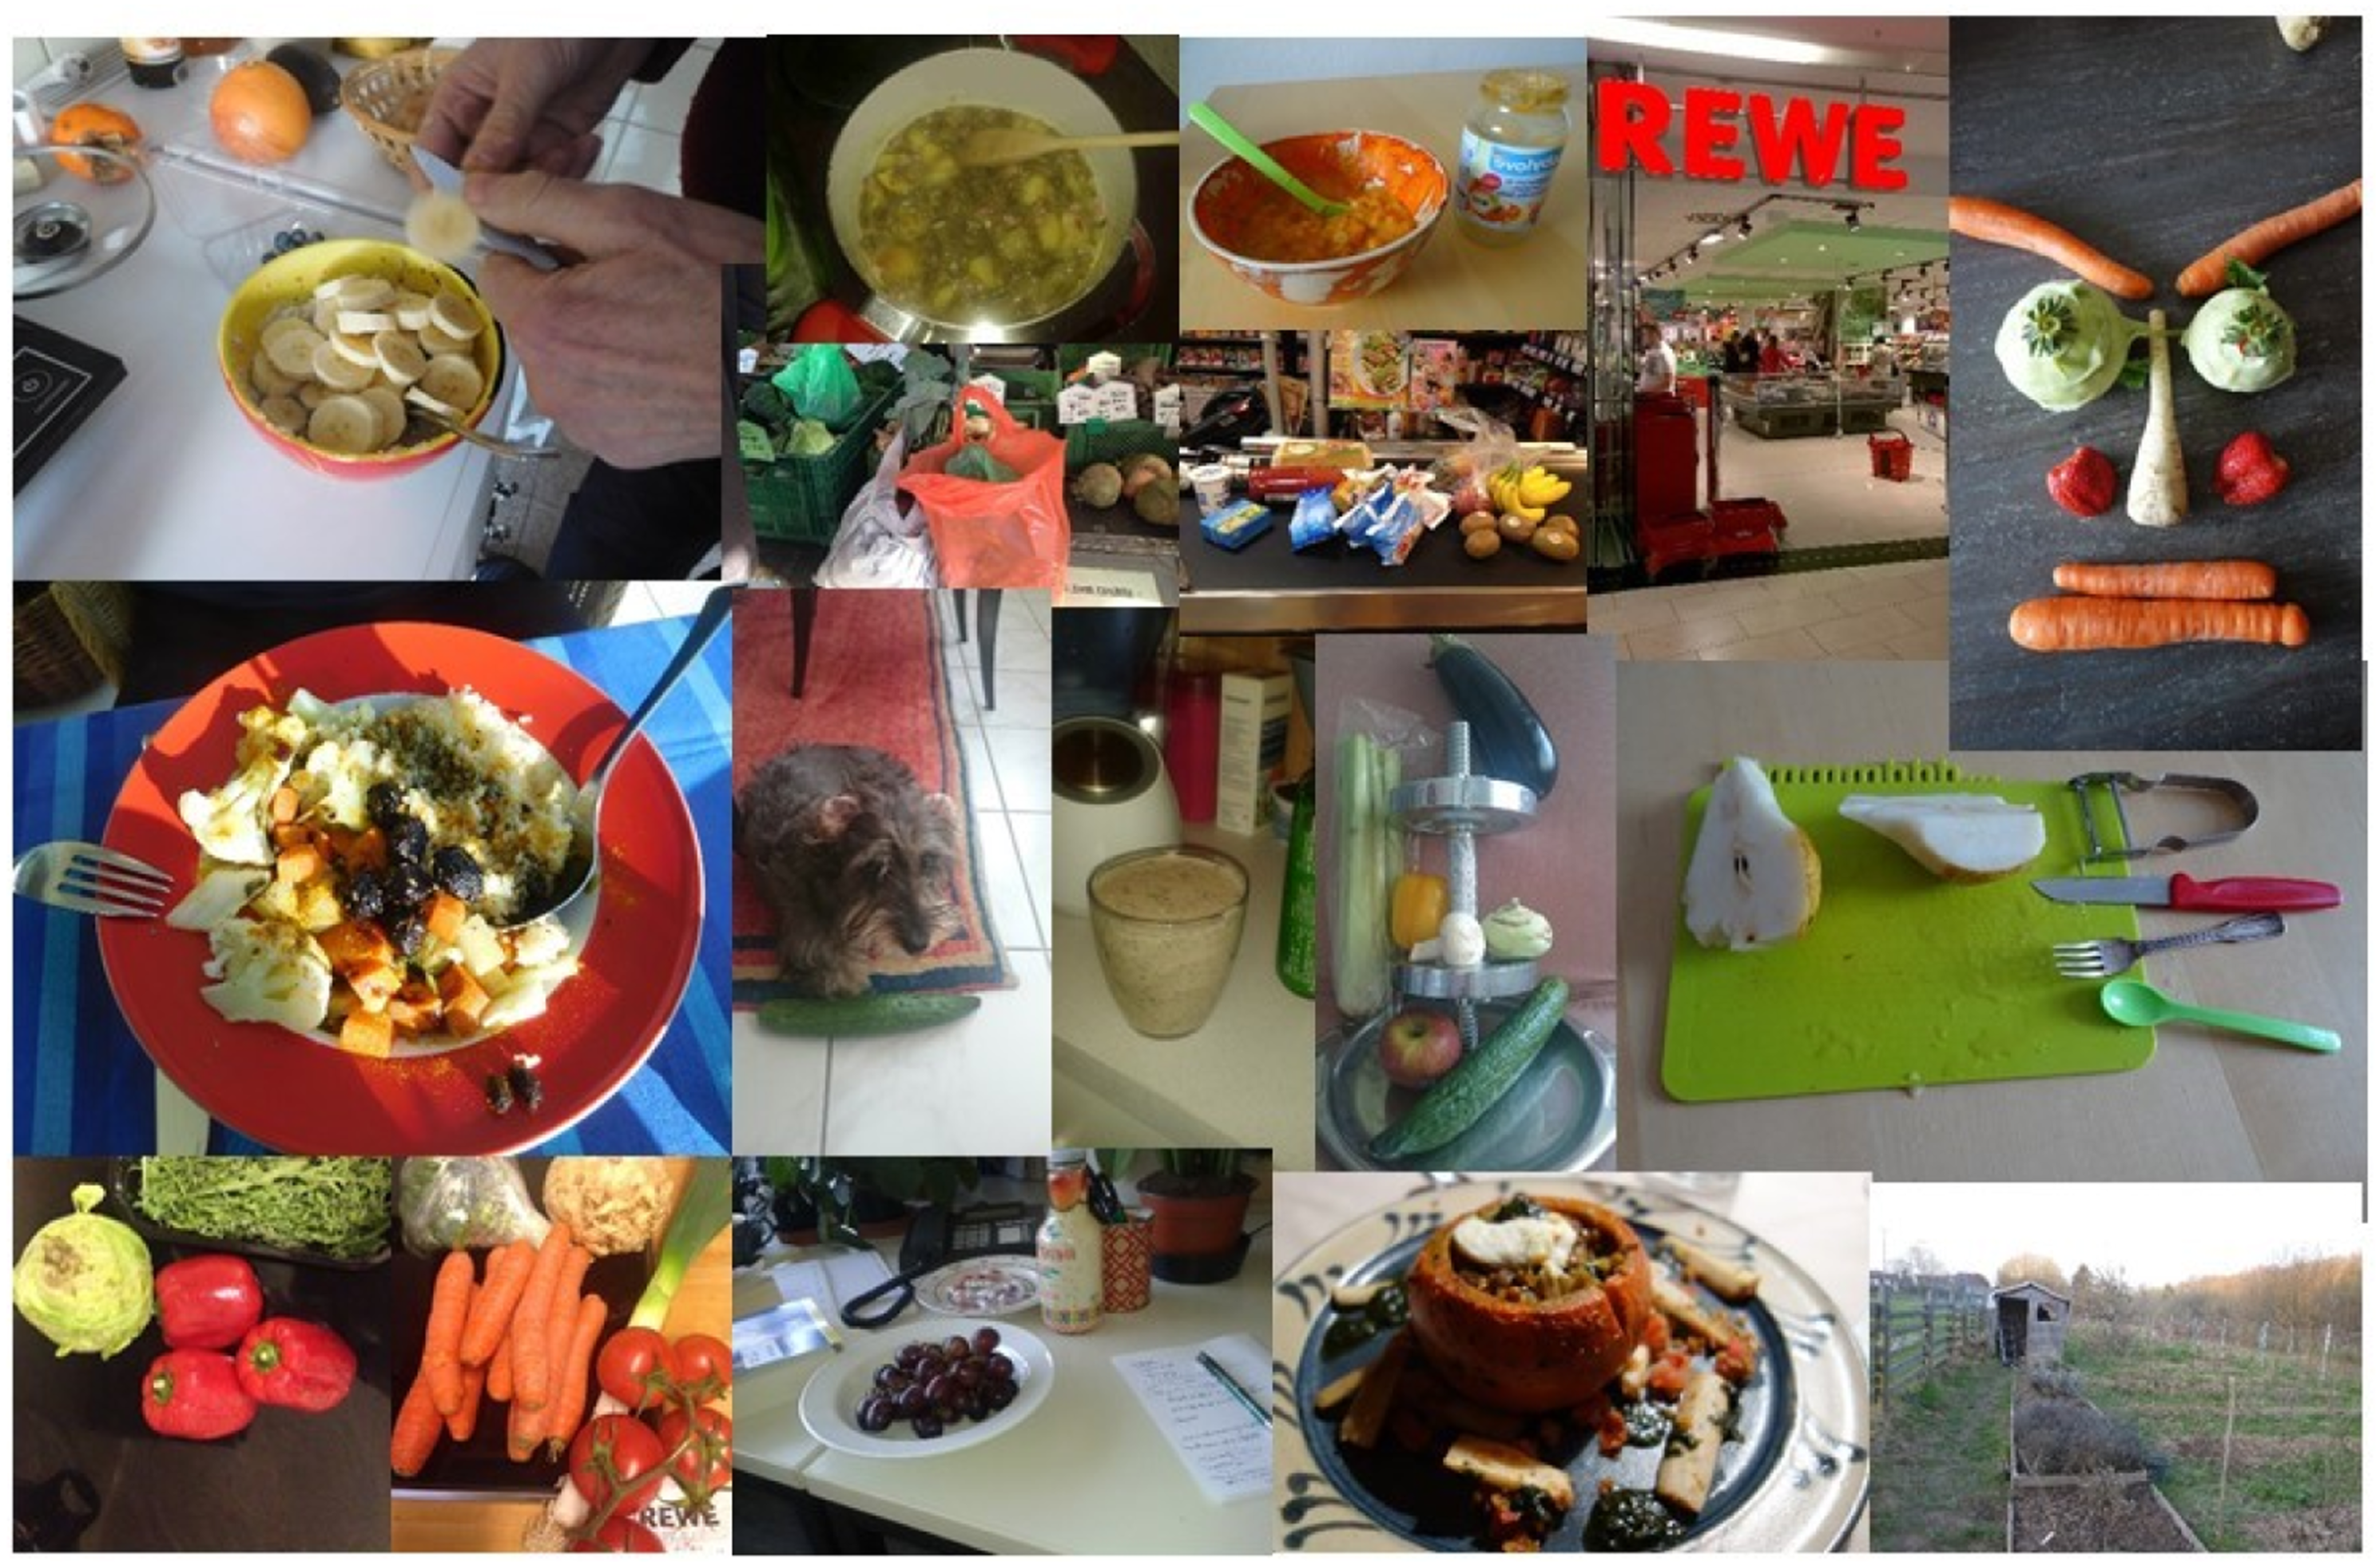
Quantitative Photograph Data Analysis Phase of the Empiric Example
Category-building process: Based on the theory of practice (see Reckwitz, 2002; Warde, 2005) and drawing from Halkier (2009), who applied the theory of practice empirically, we used activities, understandings, procedures, and engagements as the basic category framework, which we applied to both the photographs and the interview transcript (deductive category building). During the quantitative photograph analysis, we looked through the photographs to identify different kinds of fruit and vegetable consumption activities (inductive category building). We identified the following categories, understood as activities (frequencies): shopping (20), preparing/handling (56), eating (45), gardening (13), playing and making art (12), and reflecting (19), as well as residuals (6). During coding, we realized that the photographs included the material site of practices, the technologies involved, and “‘things’ and their use” (Reckwitz, 2002, p. 249). To define the categories, we considered the following questions: What is typical about the category and what do photographs belonging to this category have in common (internal homogeneity)? What is the difference between this and other categories (external heterogeneity)? Frequencies of each category were added. To identify the most common activities, we counted how often each activity was depicted. The results of the quantitative photograph analysis helped us to cover and describe the whole photograph corpus, to identify different kinds of fruit and vegetable consumption activities (e.g., preparing/handling), and to see how their performances are materially displayed (e.g., for “chopping” knives, chopping boards, half cut vegetables and fruits, and food processors).
Integration During Analysis Phase of the Empiric Example
In order to integrate the qualitative photograph analysis with the quantitative analysis during the analysis process, we selected, based on the above-described definition of a category, one photograph to represent each category in a typical way. For example, we chose the photograph depicted in Figure 3 for the sub-category “chopping” within the category “preparing.” Selected photograph for qualitative analysis.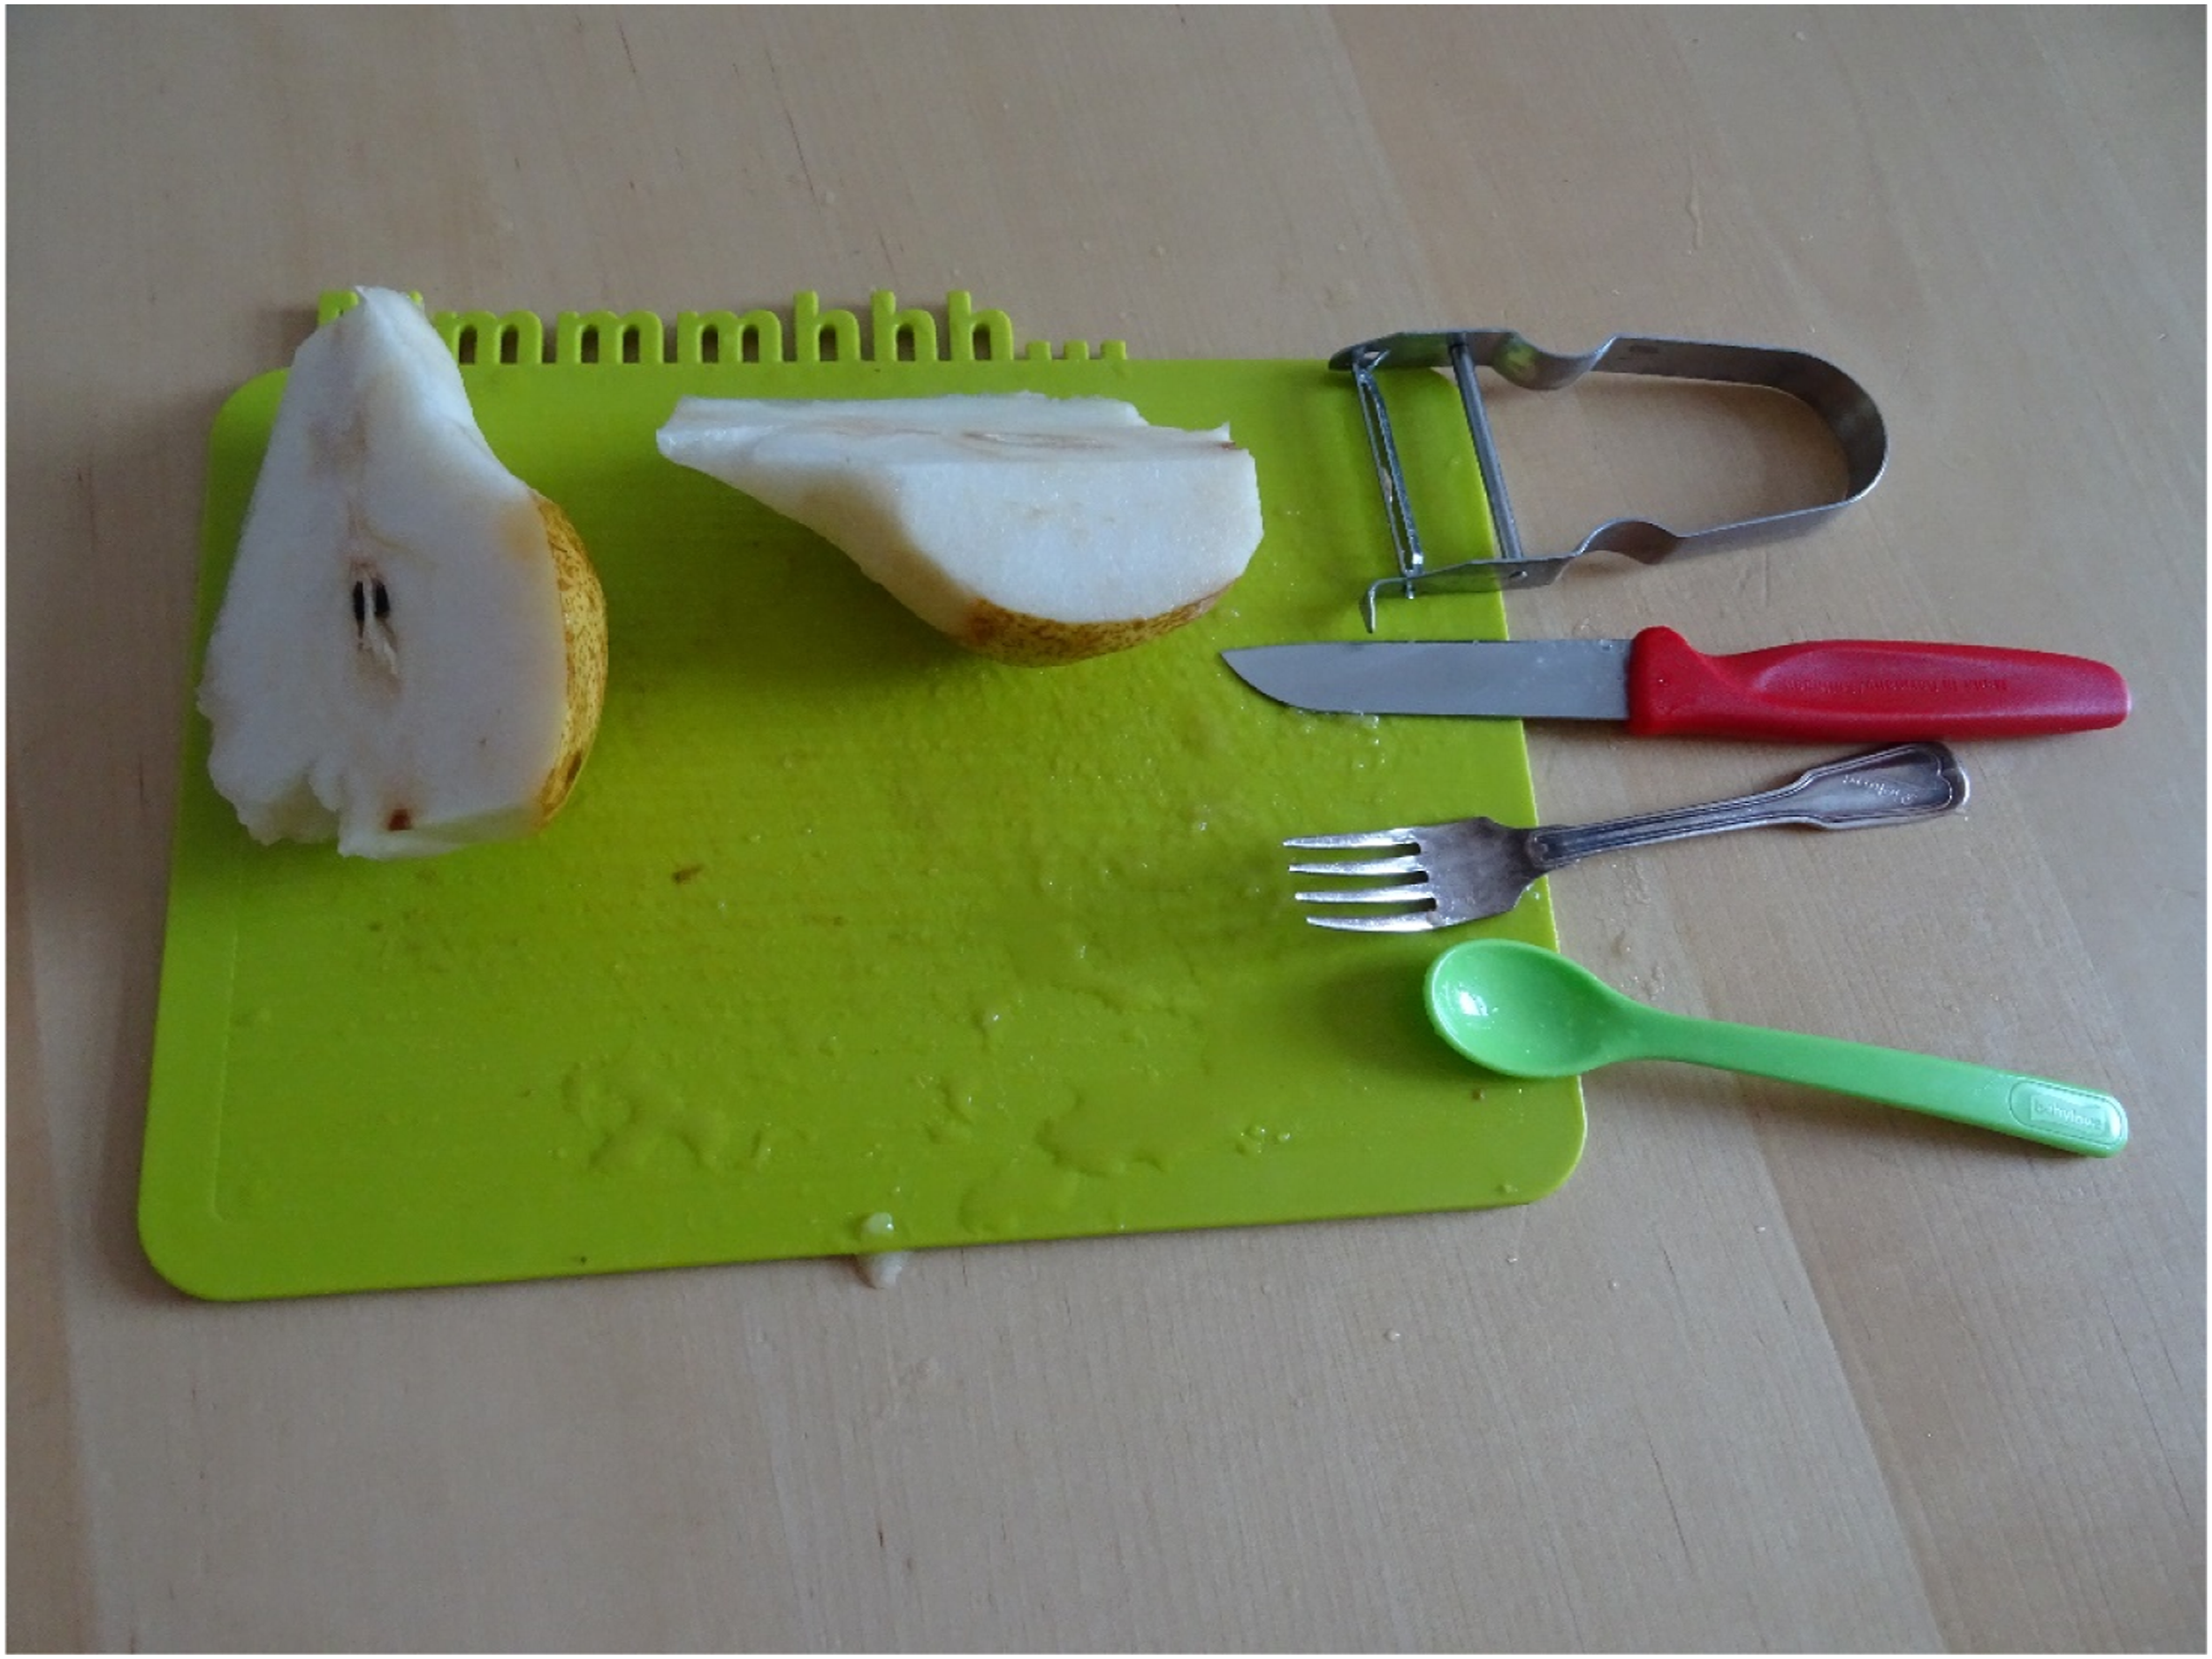
Qualitative Photograph Data Analysis Phase of the Empiric Example
The selected single photographs were analyzed using a process based on visual segment analysis (Breckner, 2012). The interpretation process involves three steps. The first step includes the immediate photo perception and articulation of first impressions (Figure 4). The second step is the formal description with the identification of segments (units of meaning that build up the photograph, Figure 5. Depiction of self-reflective perceptive process of interpreter (first step). Identified segments.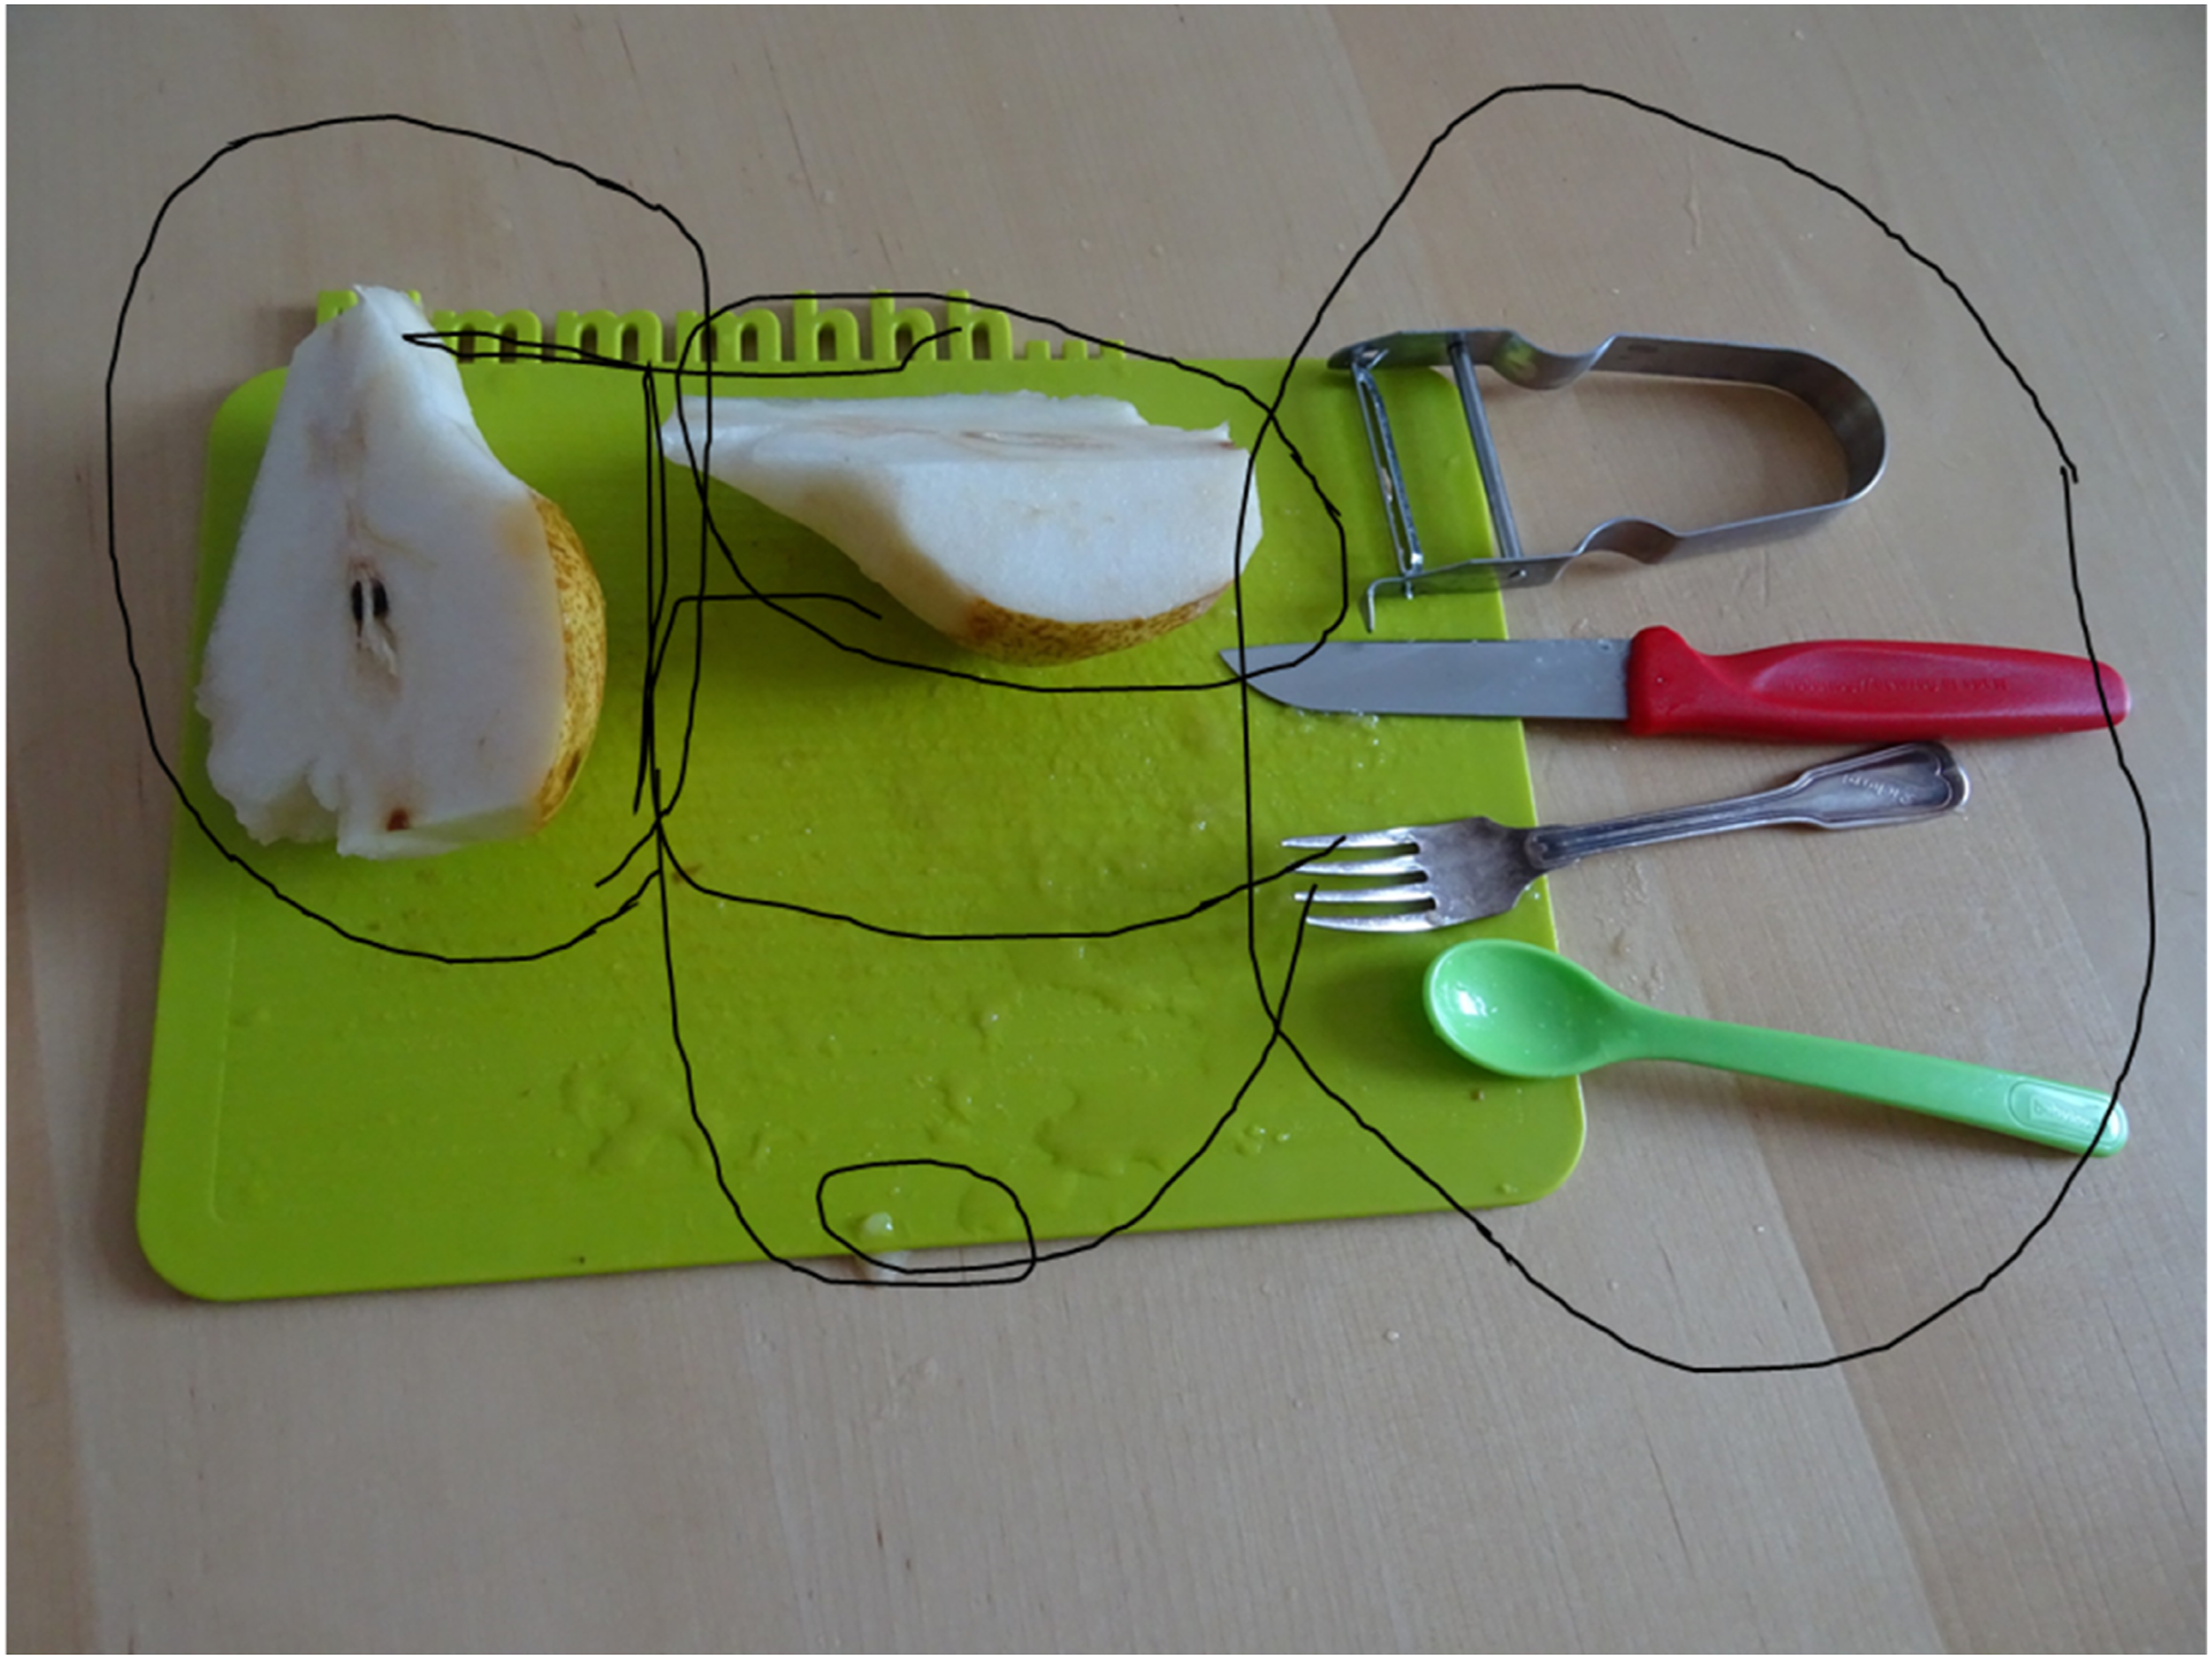
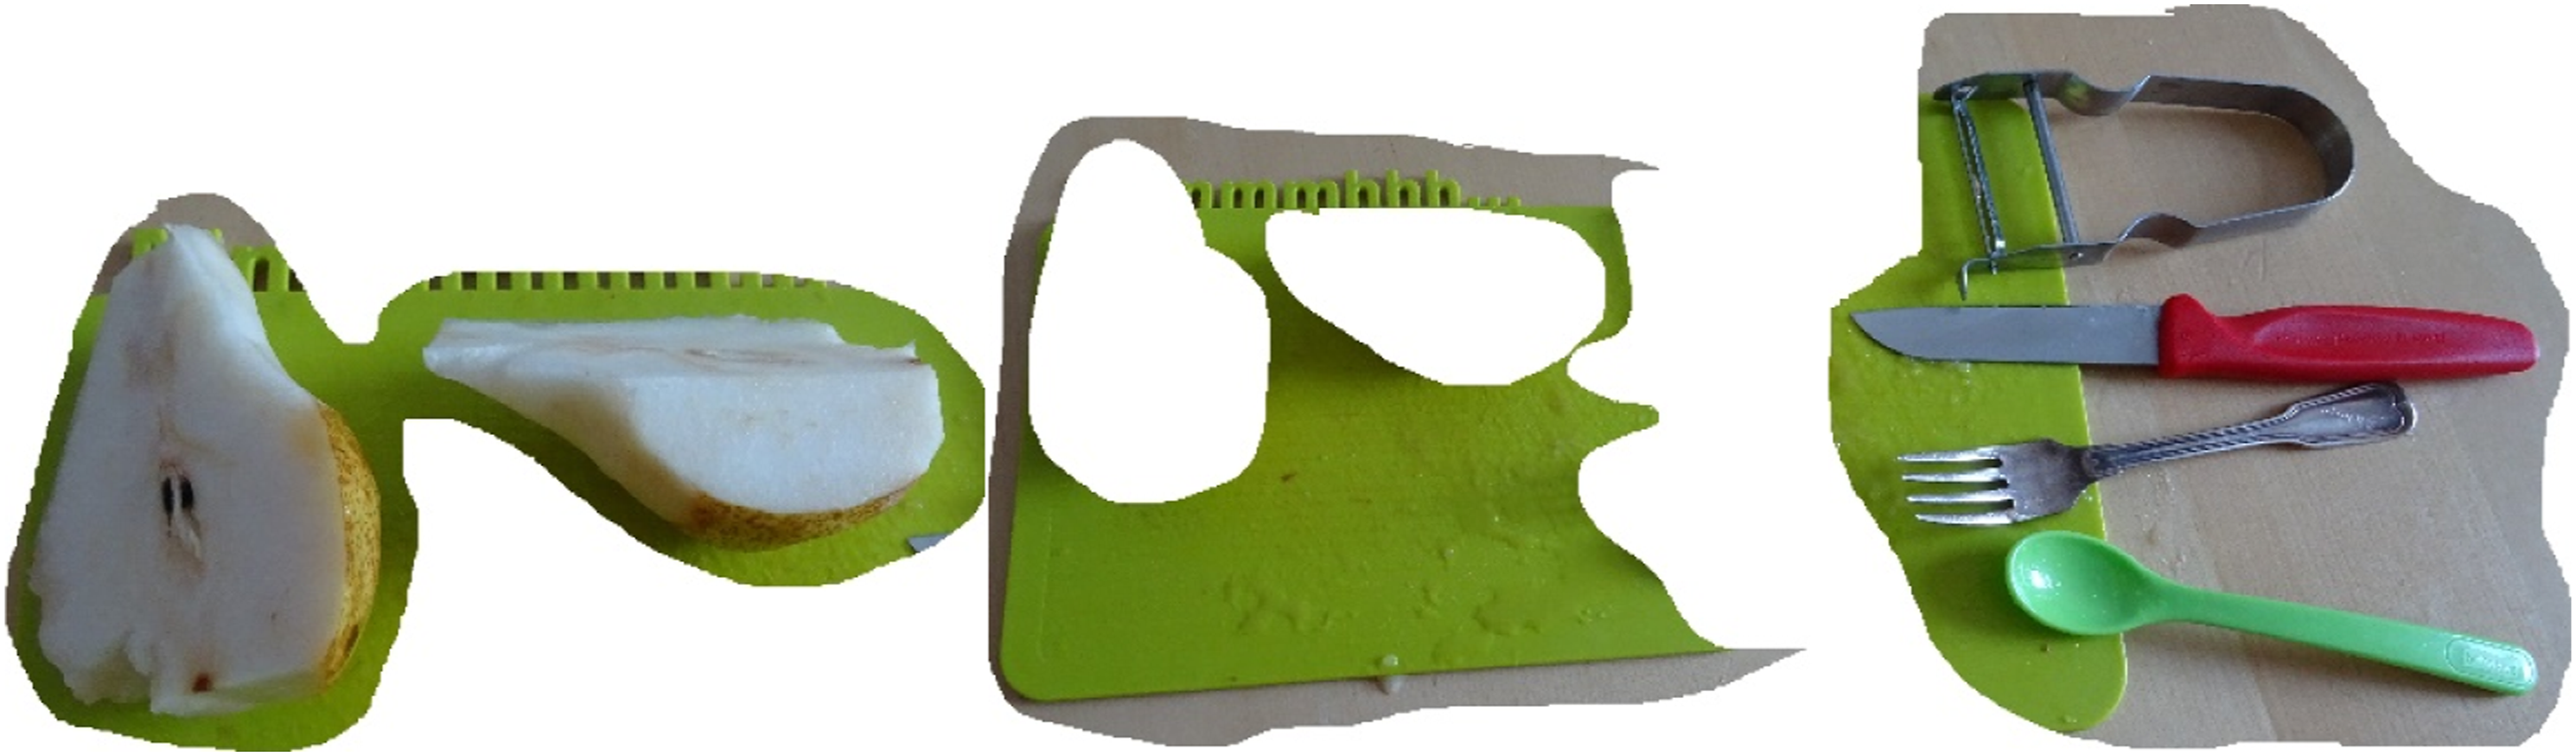
The third step is the description and interpretation of the single segments, their indexical, symbolical, iconic references and their relationship to the photograph surface and the combination of segments. This step can be enriched by (literature) research and applying different ways of seeing to corresponding possible photograph contexts. To illustrate the analysis process, excerpts of the interpretation during the third step for the segment “pears” are below:
Two halves of a pear can be seen. The formerly whole bulb has been cut, the cut-open side is facing upwards. This suggests that the pear is probably being prepared for consumption. Though often, a pear is consumed with its peel. Other contexts would be imaginable, such as a scientific investigation, checking for infestation, or displaying a pear for pedagogical purposes. Pears are fruits and commonly praised for their nutritional value. Thus, they fall under the social discourse of “health.” When comparing the pear with the apple, its advantage of having lower levels of acid is emphasized, which, in particular, makes it easier for babies to digest. Finally, the pear found its way into German poetry through the famous poem “Squire of Ribbeck at Ribbeck in Havelland.” This poem is taught in school and can be found in children’s books. It is about a man who gave pears to children until his death and then, by bringing a pear into his grave, made a pear tree grow to provide the fruits over the generations. The poem brings pears into the context of generosity and care (especially toward children) and of giving blessings even in death.
Summarizing the interpretations of the various segments, we conclude: the pear is a positively associated, healthy food, which is particularly suitable for children and popularly stands for generosity and care, and is aesthetically “presented” here in its preparation. The contrast between the white pear, the bright green cutting board, and the red knife handle and the careful alignment of the objects give a deliberately esthetic impression, even though the presumed action may be an everyday one. The mundane is arranged in a scene that suggests particular care, care presumably directed at a child, as can be inferred from the design of the cutting board, the small plastic spoon, and the manner of preparation (peeling). It may be concluded that the preparation of this pear is an act of care, love, and appreciation. Considering the strong association with fruits as a healthy food today, this photograph may also reveal what the photographer understands to be good parenting or how he or she understands the role of parenting.
Integration of the Quantitative and Qualitative Results Phase of the Empiric Example
The qualitative interpretation of a single photograph shows that it enriches the quantitative analysis and vice versa. The qualitative analysis gave the fruit and vegetable activities identified in the quantitative analysis a deeper dimension. It was possible to work out in which context a certain fruit and vegetable activity was carried out and according to which engagements, understandings, or procedures the respective activity was coordinated.
Empiric example of the Integration of photograph data analyses with other data analyses
The ways of how to integrate photograph data analyses with other data analyses are manifold. Shannon-Baker and Edwards (2018) suggested three ways of integrating visual data with other forms of data by drawing from three example studies: writing cases, quantifying visual images, and making cross-comparisons (e.g., data matrices). Transferred to our framework, we quantify the visual data during the quantitative content analysis. The resulting categories/variables could be integrated into other statistical data sets. Furthermore, the defined categories could also serve as deductive codes for qualitative text data, as follows:
The transcribed interviews were analyzed by deductive and inductive coding. We used the identified activities (e.g., preparing/handling) from the quantitative photograph analysis and results of the qualitative analysis (e.g., parenting) as codes (deductive), but also developed new codes from the text (inductive) to further capture the understandings, procedures, and engagements that structure fruit and vegetable consumption. We found dimensions such as “pleasure principle,” “time & practical constraints,” and “moral of healthiness,” many of which apply not only to fruit and vegetable consumption, but to food consumption or everyday practices in general. To integrate the text analysis with the photograph analysis, we compared the codes and the respective text segments in which the participant talked about the photograph, leading to a richer understanding.
The analyzed photograph came from a 31-year-old man, married, with a 9-month-old daughter. At the time of the interview, he was on parental leave, taking care of the baby and much of the household. His everyday life was structured according to the needs of his daughter. When he talked about the photograph, he became very particular, using a visual language: “Yes, here, exactly, we had already addressed that I just, so chop a pear into small pieces. […] Compared to an apple or something like that, which is still much too hard when you only have two little teeth […]. And um, and grapes […], they have also a skin. I chew them, that is, I open them in the middle, bite out the pulp, and give it back to her. Like a mother bird and then eat the rest of it. Yes.”
During other parts of the interview, he noted that he recognized that he takes much more care about what his daughter eats than what he himself eats, especially with reference to fruits and vegetables. His mother used to cut fruits for him when he was a child; nowadays he and his wife only do it when one of them is sick. Hence, the cutting of fruits expresses caring and is bound into the practices of caring and parenting.
The benefits of integrating the photograph analysis with the interview analysis is that it adds up to a condensed understanding of the photographs. It includes the intended meaning of the participants and may offer new facets, add, or even contradict the photograph interpretation.
Discussion and contribution to the field of mixed methods research
There are different ways of integrating data in mixed methods analysis (Fetters et al., 2013). Most social science studies do not employ full data integration; instead, the analyses are held separately and the results are then compared (Bryman, 2006). By contrast, our framework suggests how quantitative and qualitative photograph data analyses can influence each other during the analytical process. We show how integration with visual material (photographs) is possible by using data transformation: photographic material can be transformed into quantities or qualitative interpretations. In this sense, we demonstrated that the integration of different kinds of data in MMR can be extended by photographic material as another source of data. It goes beyond visual displays (Plano Clark & Sanders, 2015), or using photographs parallel to other types of data (e.g., O’Connell, 2013). Our example of integrating quantitative and qualitative photograph analyses is however, consecutive. The transformed visual data is not integrated into another data set. Our example starts with the quantitative photograph analysis, which informs the consecutive qualitative photograph analysis. It is also conceivable to start with a qualitative photograph analysis, and to use the findings to guide the quantitative photograph analysis. Drawing from our example, we could, based on the qualitative analysis, look for other displays and uses of pears or for photographs from the same vantage point, etc.
Our example shows how quantitative photograph analysis can be integrated with qualitative text analysis by using the emerged categories from the quantitative photograph analysis as deductive codes (added by inductive coding). Integration with other quantitative data (e.g., variables from surveys) is possible by, for instance, merging the quantitative data set which resulted from quantitative photograph analysis with another quantitative data set.
The integration of qualitative and quantitative photograph analysis can be applied to different mixed methods designs with either quantitative or qualitative priority (or both), and be mixed with different data types. Our empiric example followed an explanatory mixed methods research design in the analysis (first quantitative, then qualitative based on quantitative); we also mentioned how an exploratory mixed methods research design is possible (first qualitative, then quantitative based on qualitative). While it was beyond the scope of our empiric example, our suggested procedural framework could be used in convergent mixed methods research designs (concurrent quantitative and qualitative data collection) as well.
A distinctiveness of our mixed methods photograph analysis framework is that both the quantitative and qualitative approaches use the same data. The sampling of photograph data can occur either quantitatively (e.g., using software to select photographs within predefined categories) or qualitatively (e.g., based on a qualitative interview and open research question), and the resulting material can be treated both qualitatively and quantitatively. Hence, we agree with Vogl (2019) that data are constructed and not inherently qualitative or quantitative, and it may be discussed if the data processing makes them qualitative or quantitative.
The principles for the integration of quantitative and qualitative photograph data analysis methods, as well as the rationale for integration and means of transformation, are similar to those of other mixed methods data analyses: The selection of single photographs for a qualitative analysis can be based on a typology, can identify prototypes of a category, or can be understood as an intensive case analysis or case study (see Bazeley, 2009). Therefore, the suggested framework is congruent with the four analytical strategies in MMR (Caracelli & Greene, 1993). In our empiric example, the integration of photographic data analyses (quantitative and qualitative) was key for identifying and understanding the fruit and vegetable consumption activities. In the quantitative analysis, the different activities and their material expressions were determined, while in the qualitative analysis, the motivation and engagement that structure these activities were identified. Hence, our suggested framework enables a more comprehensive analysis of photographic material, as both levels expand and complement each other in the interpretation process, which is in line with the purposes for mixing methods identified by Greene et al. (1989) (complementarity and expansion) and Fielding (2012) (analytical density).
Limitations and Opportunities for Future Research
A shortcoming of our study is that we did not conduct a systematic literature review of existing photograph analysis methods. Consequently, our overview of such methods (Table 2) is neither mutually exclusive nor collectively exhaustive. This decision reflects the vast variety of such approaches, which is beyond the scope of this paper (for a more detailed review, see, e.g., Knoblauch et al., 2008). A systematic review may be another subject matter for further research. Furthermore, in future, the suggested framework and its different application possibilities should be fleshed out with more empiric examples. Our purpose here was to show in principle what the integration of qualitative and quantitative photograph analysis could look like and how it could be theoretically discussed in terms of MMR. Additionally, we focused our study on the analytical process, and not on photograph data sampling or the reporting of results of integrated quantitative and qualitative photograph analyses. Finally, in our empiric example, the researchers interpreted the photographs void of participants’ voice. This approach has the drawback that the (production) context of the photograph and participants’ intention for making this photograph are not considered during this analysis step.
Conclusion
The prevalence of photography in society requires the inclusion of photographs in market research and social science and calls for a comprehensive analysis of such photographic material. In this paper, we provided an overview of different qualitative and quantitative photograph analysis methods from different scientific fields and found that, in each method, photographs are transformed into text or quantitative data in some way. We showed that the integration in MMR can be enhanced by photographic material, using the mixed methods principles of data transformation, consolidation, typology, and extreme case analysis. As quantitative and qualitative photograph analyses investigate different levels of meaning, a mixed methods approach has the advantages of expansion and complementarity. Due to the transformation of photograph data into text and numbers, integration with other data types is also possible. Our work considered the challenge of integrating qualitative and quantitative data in the context of the analysis of photographs and demonstrates that photographs as a data source do not exist outside the qualitative-quantitative paradigm and hence fit into the conceptualizations of MMR. Depending on how photographs are used, they can be used as either qualitative or quantitative data. We hope that our contribution encourages the use of photographs in the research process for integration and stimulates both future reflection and application of integrated quantitative and qualitative photograph analyses.
Footnotes
Acknowledgments
The work was conducted within a joint PhD program at the Department of Agricultural Sciences, Ecotrophology, and Environmental Management, Justus-Liebig University Giessen.
Declaration of Conflicting Interests
The author(s) declared no potential conflicts of interest with respect to the research, authorship, and/or publication of this article.
Funding
The author(s) received no financial support for the research, authorship, and/or publication of this article.