
Abstract
The purpose of this article is to illustrate the process and insights gleaned from developing an implementation matrix to convey a concise, yet detailed representation of the project integration steps in a single diagram. The article is based on an explanatory sequential study conducted with 248 teachers exploring how beliefs shaped their use of technology. This article contributes to mixed methods research (MMR) by providing an example that can be used as guide by other researchers in developing and using the implementation matrix as a tool for communicating procedurally the mixed methods project integration steps for an explanatory sequential study. It also provides analytical insights gleaned and recommendations for how the implementation matrix can be developed and utilized.
In designing mixed methods studies there are certain dimensions that have been commonly discussed in the research literature and are at the forefront of the researcher’s mind when engaging in mixed methods research (MMR). For example, decisions about choosing a core design, using theory, developing research questions, points of integration, sampling, data collection and analysis strategies are of primary concern (Creswell, 2015; Fetters, 2020; Schoonenboom & Johnson, 2017). Attention to these components is warranted because if they are not considered carefully, they can result in a variety of challenges for researchers, especially in achieving optimal integration. There has been much attention to integration procedures in the MMR literature, such as the use of joint displays (Creswell, 2015; Fetters & Guetterman, 2021; Guetterman et al., 2015; Haynes-Brown & Fetters, 2021), data transformation (Castro et al., 2010) and pillar integration (Johnson et al., 2017). However, the scholarship on integration is most focused on data analysis (Guetterman et al., 2020) with less attention to the use of tools such as the implementation matrix.
The implementation matrix is described as an apt way of conveying procedurally how the study questions or aims, sample, data collection and outcomes within and across phases informed decisions taken to achieve integration (Fetters, 2020). The purpose of this article is to provide a practical illustration of the process involved in the development of an implementation matrix in an explanatory sequential mixed methods study. This article also shares analytical insights gleaned from reflection on the process of developing the implementation matrix.
Literature Review
The Role of the Implementation Matrix in a Mixed Methods Study
An implementation matrix can be defined as a table that illustrates an overview of the mixed methods research plan in a concise way (Fetters, 2020). Simply put, it is the blueprint for communicating the decisions taken in designing, conducting and analyzing the results of an MMR project to achieve integration. Although an implementation matrix somewhat resembles a procedural diagram, the implementation matrix is more complex and provides more than just a bird’s-eye view of the study. As Fetters (2020) explains, the implementation matrix provides a forest-level perspective with details on how the proposed methods are implemented in the field. It is described as a “forest-level” perspective owing to the number of details from the various elements of the project—objectives, theory, data collection, analytic procedures, outcomes, validity threats—that can be included. While the procedural diagram is considered more of a bird’s-eye view because it is more concise with fewer details. To provide this “forest-level” perspective, careful thought must first be given to all dimensions of the data collection and implementation plan. The researcher must be clear about why each data set is being collected, from whom, when, how each data set aligns with the study’s objectives and how each will contribute to the overall integration strategy to produce more comprehensive study findings. The implementation matrix can be developed at the start of the study, modified during data collection and analysis, or developed at the end of the study to communicate in a concise manner how the MMR project steps unfolded to achieve the primary goal of integration.
The development of an implementation matrix reflects all the major components of the study. These components are the aims or objectives, methods of data collection, analysis, and study outcomes (Fetters, 2020). These are important components that must be given careful consideration, because understanding the details that link the mixed methods research design phases, procedures, and products together helps the reader to better understand the methodological approaches used to achieve integration (Hou & Fetters, 2018). However, representing them in a single table can be a daunting task that requires constant reflection and refinement to communicate clearly and concisely.
Communicating Integration Decisions in the Implementation Matrix
Integration is described as how the researcher brings together the quantitative and qualitative findings in a mixed methods study (Creswell, 2015). Beyond that, integration is more than the process of bringing together the quantitative and qualitative data. It is an intentional activity that demonstrates a “purposeful interdependence between different sources, methods and approaches” (Bazeley, 2018, p. 7). Integration requires the researcher to illustrate how the combination of quantitative and qualitative data yields a more comprehensive understanding of the study findings that would not be otherwise achieved. The true value of MMR lies in the gains from integration. In fact, a growing consensus among leaders in the field of MMR is that integration is an all-important dimension of any MMR project (Fetters, 2020). The overall goal of combining qualitative and quantitative research components in a single study is to expand and strengthen a study’s conclusions (Schoonenboom & Johnson, 2017).
To illustrate how this is achieved, the outcomes of each phase of the study play an important role. As Creswell (2015) explains, the inclusion of products (outcomes) is helpful when writing up the report of an MMR project. The inclusion of the outcomes in the implementation matrix is of value in communicating the integration process. Making explicit the expected outcomes of the data collection and analysis done at each phase can help the researcher to communicate more effectively how the outcomes taken together enhanced the study’s conclusions. In developing the implementation matrix in an MMR project, attention to the expected outcomes from the inclusion of each data source, coupled with an understanding of how data collected align with the study aims and objectives when combined in a single matrix is highly beneficial for conveying integration decisions. For the explanatory sequential design where the intent is to use the qualitative data gathered in the follow-up phase to explain the quantitative results from the first phase (Creswell, 2015), being clear about the outcomes of each phase and how they align with the study objectives are of critical importance. However, the points of integration vary based on the MMR design and as a result, the role of the outcomes in conveying integration decisions may vary.
During this process of developing the implementation matrix the researcher must consider how to separate the datasets and at the same time think across the datasets to communicate how the decisions taken within and across phases contributed to the overall study conclusions. Additionally, researchers must also ensure that they communicate integration in such a way that the meta-inferences are evident and clearly communicated. The researcher in reporting the meta-inferences in the implementation matrix must also demonstrate that these overarching conclusions are consistent with the empirical data presented in the outcomes of the preceding phases of the study. Success with communicating these integration decisions in the implementation matrix lies in the researcher’s engagement in reflection on how the data collected and analyzed allowed for integration.
The Role of Reflection in Developing the Implementation Matrix
As the researcher reflects on the integration decisions and how to present them concisely in the implementation matrix, the researcher’s own construction of knowledge of MMR is being scaffolded. Scaffolding has been described as the steps taken to reduce the degrees of freedom in carrying out some tasks to allow the learner to concentrate on the difficult skill being acquired (Mercer, 1995). This concentration requires reflection, and the reflective process acts as a prompt for constructing knowledge. Developing an implementation matrix that accurately and concisely presents the forest-level view of complex processes involved in an MMR project similarly requires concentration and reflection which provide some level of scaffolding of the researcher’s knowledge. Engin (2011) proposes that researchers can use a diary to scaffold their learning about research as the diary acts as the expert other in the scaffolding of research knowledge of the novice researcher. The implementation matrix can be viewed in a similar manner as the researcher responds to critical questions in completing each component of the implementation matrix.
Study Illustration: The Development and Use of the Implementation Matrix
The study sought to explore how belief related to decisions to use technology in different ways. A procedural diagram outlining the study design is presented in Figure 1. Procedural diagram: Explanatory sequential mixed methods study.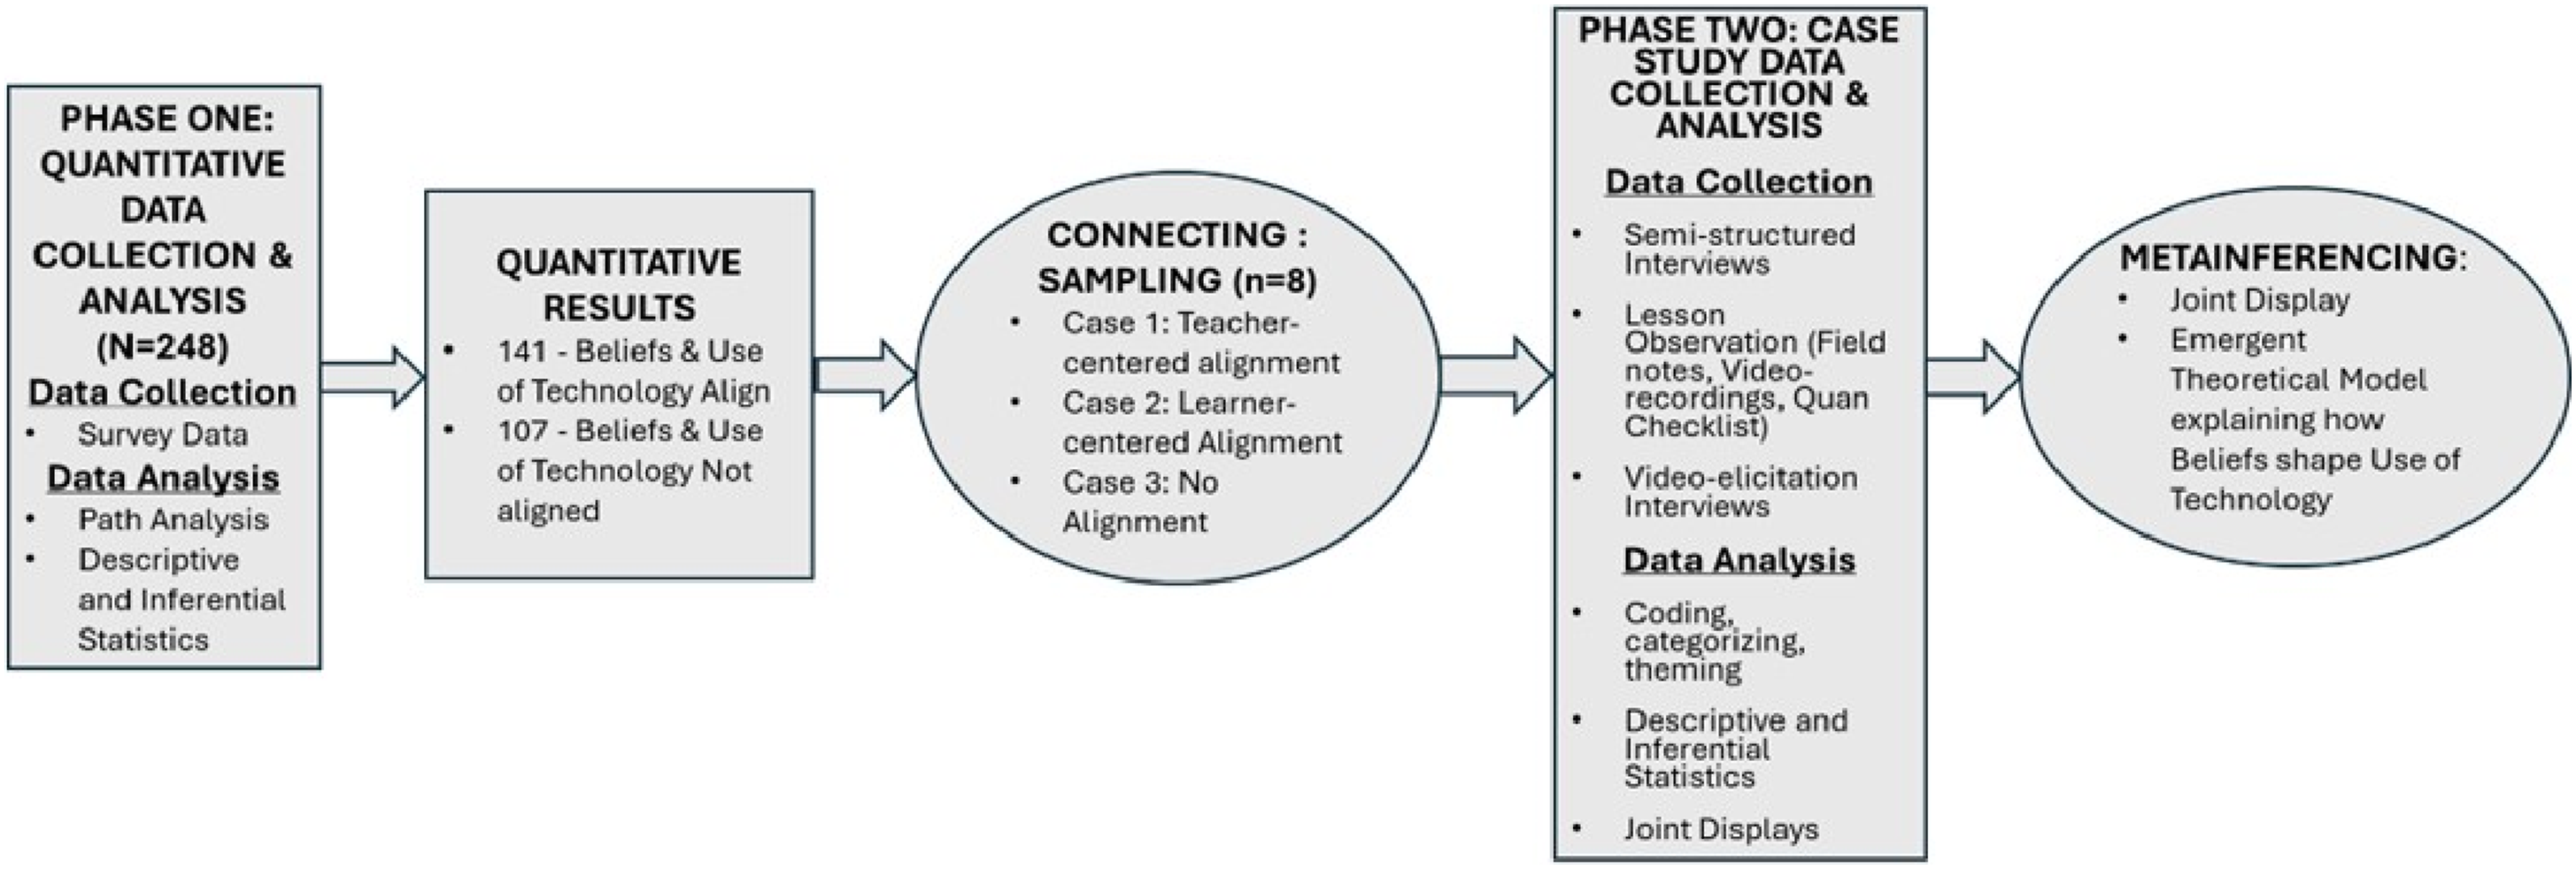
The study was guided by a theoretical model proposing that teachers’ beliefs were related to differences in how teachers used technology and that teachers’ beliefs, and use of technology were aligned in highly teacher-centered or learner-centered ways (Haynes-Brown, 2022). These propositions were based on extant literature that guided the development of the theoretical model. To explore these propositions, an explanatory sequential design was utilized.
Data Collection
Several sources of data were included in the study. The study received approval from the university’s ethical review board. In phase one quantitative data were collected from a sample of 248 teachers. The follow-up case study phase was conducted with a subsample eight teachers. After collecting and analyzing the data in the follow-up phase, the quantitative and qualitative data were integrated and presented in the final meta-inference phase that presented the overall study findings explaining how beliefs shaped teachers’ use of technology.
Data Analysis
Quantitative data analysis involved the use of descriptive and inferential statistics and grouping syntax commands using the software Statistical Package for the Social Sciences (SPSS) and path analysis using Smart PLS. Qualitative data analysis involved first and second cycle coding, categorizing and theming of the data. This process was managed using the QDA Miner software. To build meta-inferences that integrated the quantitative and qualitative data bar graph joint display analysis was used (Haynes-Brown & Fetters, 2021).
Developing the Implementation Matrix to Communicate Integration Across Phases
Developing the implementation matrix occurred in stages aligned with the phases of the research. This was achieved by focusing on conveying all the details one phase (row) at a time. Fetters (2020) suggests that developing the matrix in rows is useful especially for novice researchers. In developing each row of the implementation matrix, I focused on communicating how the integration process unfolded sequentially in keeping with the study design.
Phase One: Quantitative
The first iteration of developing the implementation matrix involved communicating the decisions taken in the first phase of the study. The objectives of the first phase focused on testing the propositions underpinning the theoretical model that was developed. As figure two details, objective one sought to determine the significance of beliefs in accounting for variance in teachers’ use of technology. The outcome aligned with that objective revealed that the variable beliefs explained 50% of the variance in teachers’ use of technology. Regarding the second objective which was to explore the extent that teachers’ beliefs and use of technology were aligned, the results revealed that of the 248 teachers in the sample, beliefs and use of technology were aligned for 57% of the teachers. Showing alignment among the objectives, data and outcomes was straightforward in the development of this first row of the implementation matrix. However, presenting the information concisely yet in a sufficiently detailed manner required at least two iterations.
Recommendation One: Keep it Simple!
The first step in the process of developing the draft of the implementation matrix was to decide what elements would be included in the matrix. I decided on including the objectives, data collection, analytic procedures and outcomes. There are other elements that could have been added such as theory, point of integration and validity threats depending on the relevance to a particular project (Fetters, 2020). Since I was not an expert in developing the implementation matrix, I decided to stick to the elements that I considered core to communicating the integration decisions. When considering adding elements to the implementation matrix it must be noted that each column adds complexity (Fetters, 2020). A rule of thumb in communicating procedures in a diagram or table is to keep it “simple, straightforward and located on a single page” (Creswell, 2015, p. 62).
The next step was to transfer pertinent details from the narrative in the report to the various headings of the matrix that were included. First, I selected the sentences in the draft of my research report for the quantitative phase that matched headings and transferred them to the implementation matrix. This resulted in a very crowded table that was difficult to read. In the second iteration I focused on reducing lengthy sentences into concise sentences and phrases that captured the critical ideas under each heading. Then I proceeded to reflect on the outcomes of phase one and how I would now illustrate using the connections between those outcomes and the integration decisions taken in selecting the subsample.
Phase Two: Connecting Through the Sampling Frame
Based on the sequential design of this MMR project, integration occurred through the process of connecting in the sampling frame (Creswell, 2015). Connecting the quantitative phase to the follow-up phase to achieve integration involved several procedures and considerations based on the outcomes of the quantitative analysis. It was important that these procedures and decisions that guided integration were clearly and concisely communicated. The implementation matrix provided an opportunity to present the integration decisions in a concise and integrated manner.
As I reflected more closely on the outcomes of phase one it was clear that the results confirmed to an extent one of the main propositions that underpinned the theoretical model indicating that beliefs account for variance in teachers’ use of technology. The second set of results contained both conforming and disconfirming results, since beliefs and use of technology were only aligned for 57% of the teachers. To communicate how both the confirming and disconfirming results informed the approach taken in designing the follow-up phase, it was important to represent the sampling procedure as a “phase” in the implementation matrix. In so doing I was able to communicate concisely how the outcomes of phase one informed integration decisions that would guide the follow-up phase. The sampling phase presented in the second row of the implementation matrix identified the integration process at this stage of the study as ‘connecting’ aligned with explanations in the MMR literature of different types of integration used with the core designs (Creswell, 2015). Figure 2 presents the implementation matrix with details of the information included for each study phase. The implementation matrix.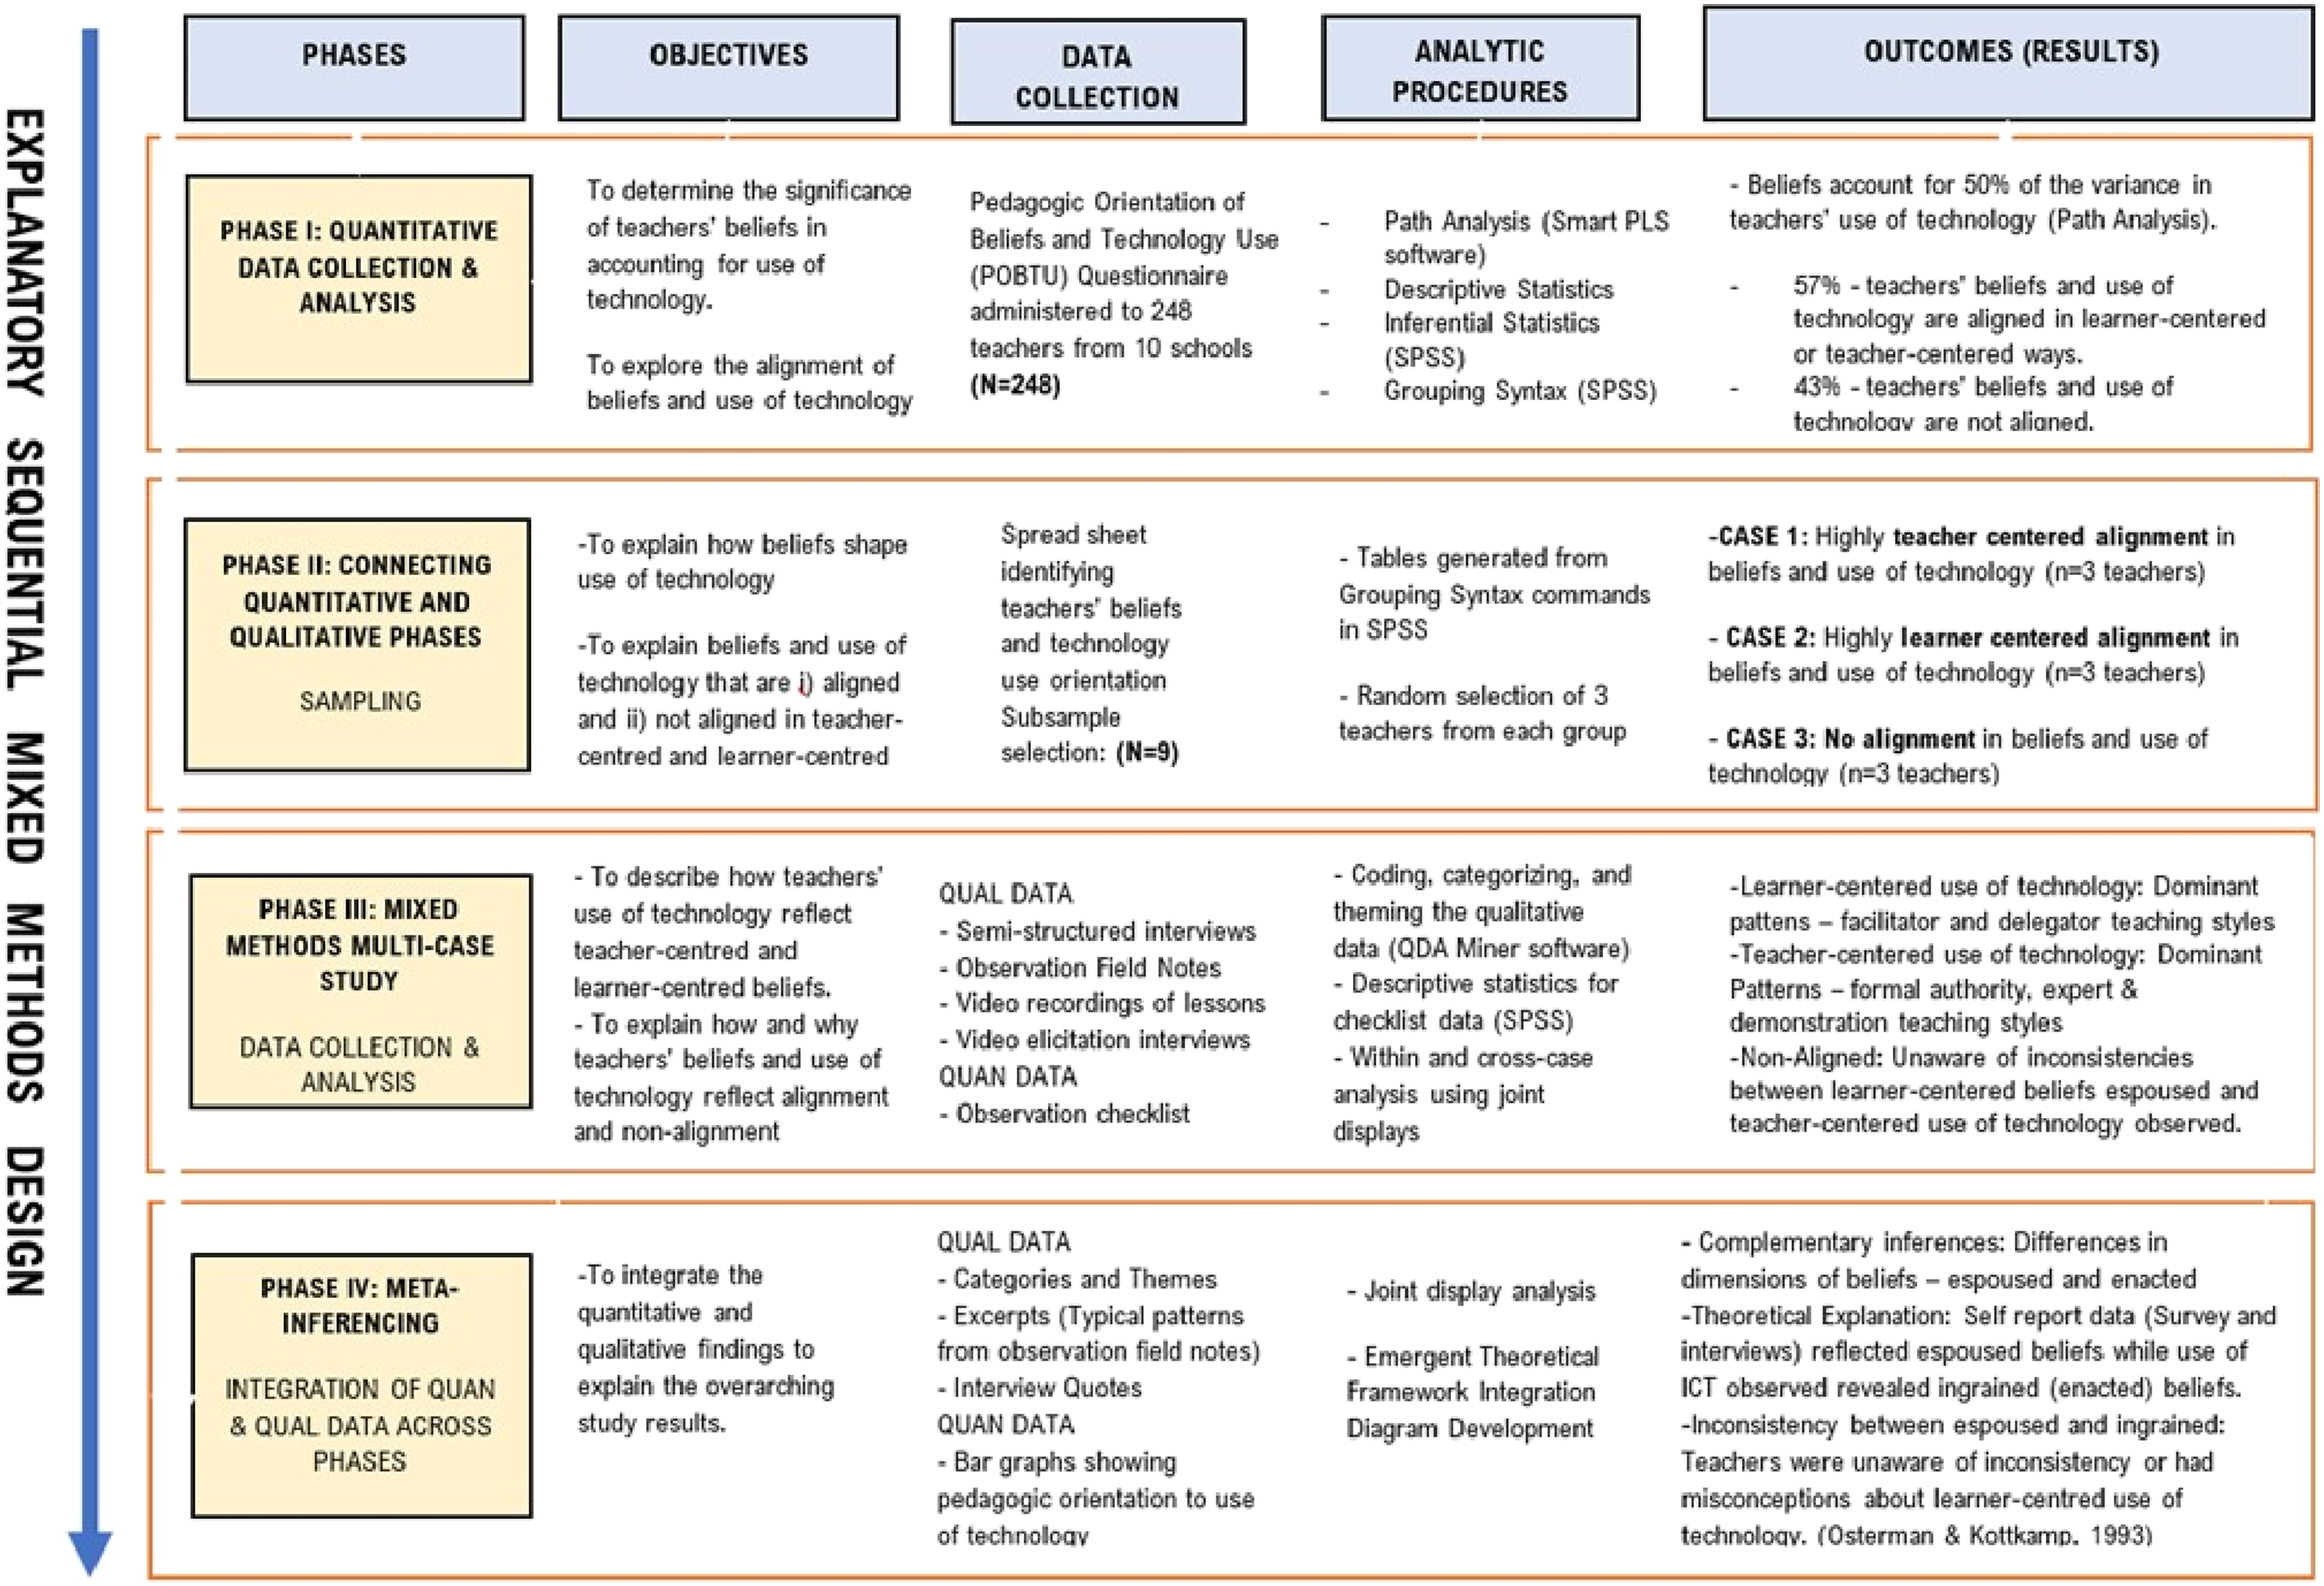
The objectives of the sampling phase focused on the decisions about what findings needed to be explained. Data collection and analysis columns reflected what data were used to select the sample and how the sampling procedure was done to yield the subsample selected. The outcome section showed how the samples were selected and grouped as cases aligned with the aim of explaining the confirming and disconfirming results. For example, case three allowed me to explain the disconfirming result which revealed that there were some teachers with beliefs and use of technology that were not aligned. In just two rows, the implementation matrix allowed me to communicate a series of procedures and integration decisions with adequate details concisely (see Figure 2).
Recommendation Two: Get Feedback on the Implementation Matrix Being Developed
The next step was to obtain feedback on the draft that I had produced. The questions asked during the feedback session were very useful because they helped to identify gaps in the information being conveyed. One of the lessons I learned during the feedback process was that if a detailed explanation of a component is needed, it is an indication that the idea is not being communicated clearly. In that case, take note of the questions, modify and reshare the draft. As I engaged in explaining how the objectives, data, sampling and outcomes aligned with integration decisions, my own understanding of MMR and the importance of integration procedures was being further concretized. This helped me to make changes to the information in the matrix to ensure greater clarity in communicating how the decisions reflected alignment among objectives, procedures, analysis and outcomes. Once these two rows were satisfactorily completed, I then moved to the development of the third and fourth rows of the implementation matrix.
Phase Three: The Follow-Up Case Study Phase
In the next iteration I focused on adding the follow-up case study phase. There were two main objectives of this phase: i) to explain how differences in teachers’ beliefs were reflected in their classroom practices, and ii) to explain why for some teachers their reported beliefs and use of technology were not aligned. Based on these objectives I reflected on the data collected to ensure that the types of data collected aligned with the objectives of this phase. I was satisfied that the interviews provided adequate depth in explaining teachers’ beliefs and rationale for using technology in the ways observed. However, the qualitative field notes were somewhat general. I wanted an objective means of identifying and classifying the differences in teachers’ use of technology based on the observation data collected. This was particularly important in explaining the non-alignment between beliefs and use of technology.
An observation checklist that had been developed to classify teachers’ use of technology (Judson, 2006) was applied to the video recorded data already collected. Reflection on the study objectives of this phase and how the data aligned with the expected outcomes prompted modifications to the plan for data analysis. By incorporating quantitative data into the follow-up case study phase, the design was expanded from a purely qualitative multi-case study to a mixed methods case study. This mixing of quantitative and qualitative data within the case study phase was included in the implementation matrix.
Recommendation Three: Adjust the Plan for Data Collection and Analysis if Necessary
During the implementation of an MMR project the researcher—even a novice—should not feel confined to the initial design. “Despite the best developed and clearest design plans, many projects require adjustments as they proceed” (Fetters, 2020, p. 149). In my case, I realized that the analysis and outcomes could be enhanced by adding a quantitative instrument during the follow-up case study phase. Although the data collected in this case study phase was primarily qualitative in nature, I added a quantitative instrument that was beneficial. The video-recordings of the teachers’ lessons that I had initially used as prompts for the video-elicitation interviews (Haynes-Brown & Shannon-Baker, 2022) provided an opportunity to further differentiate the teachers’ use of technology based on specific criteria indicated on an existing reliable checklist. Researchers in the field are being encouraged to think about integration more broadly and spark further innovation (Guetterman et al., 2020).
Phase Four: Meta-Inferencing Phase
In conveying the decisions in the final row of the implementation matrix, the focus was on conveying how the integration of both data sets from the quantitative phase and the case study phase provided overarching conclusions. As figure two shows, bar graph joint displays were used as the analytic tool during this meta-inferencing phase. The joint displays were presented by case in accordance with the sample selection generated from the data analyzed in phase one. The theoretical model was used to present overarching conclusions explaining how beliefs shaped teachers’ use of technology. As I developed the implementation matrix, my knowledge of MMR was being scaffolded by reflection on every decision made as I sought to achieve optimal integration within and across phases and datasets.
Discussion
An implementation matrix can be used multiple times and at different stages of an MMR project: i) at the proposal stage, ii) during the study implementation, iii) at the end when you are writing the research report (Fetters, 2020). In my case I had completed phase one and was in the process of analyzing the data from the follow-up case study phase. I had a detailed narration of the methodology section explaining the processes that I had engaged in for each phase of the study. Coupled with this were lengthy justifications of the decisions that spanned several pages in a draft of my MMR project report. Placing this information on a single table proved challenging because not every decision that was in the narrative could be included in the matrix.
Balancing conciseness and clarity in presenting the information in the implementation matrix was difficult at first and required critical reflection and several iterations in developing the rows to communicate the procedures and decisions for each phase of the study. It is important to ensure that the desire for clarity does not compromise conciseness and readability. As I learned during the development of the matrix, if the diagram is crowded with too many words it will be difficult to view the information because the font size is reduced to accommodate more words. However, with each iteration of developing the implementation matrix, balancing clarity and conciseness in communicating the objectives, data collection and analytic procedures became easier.
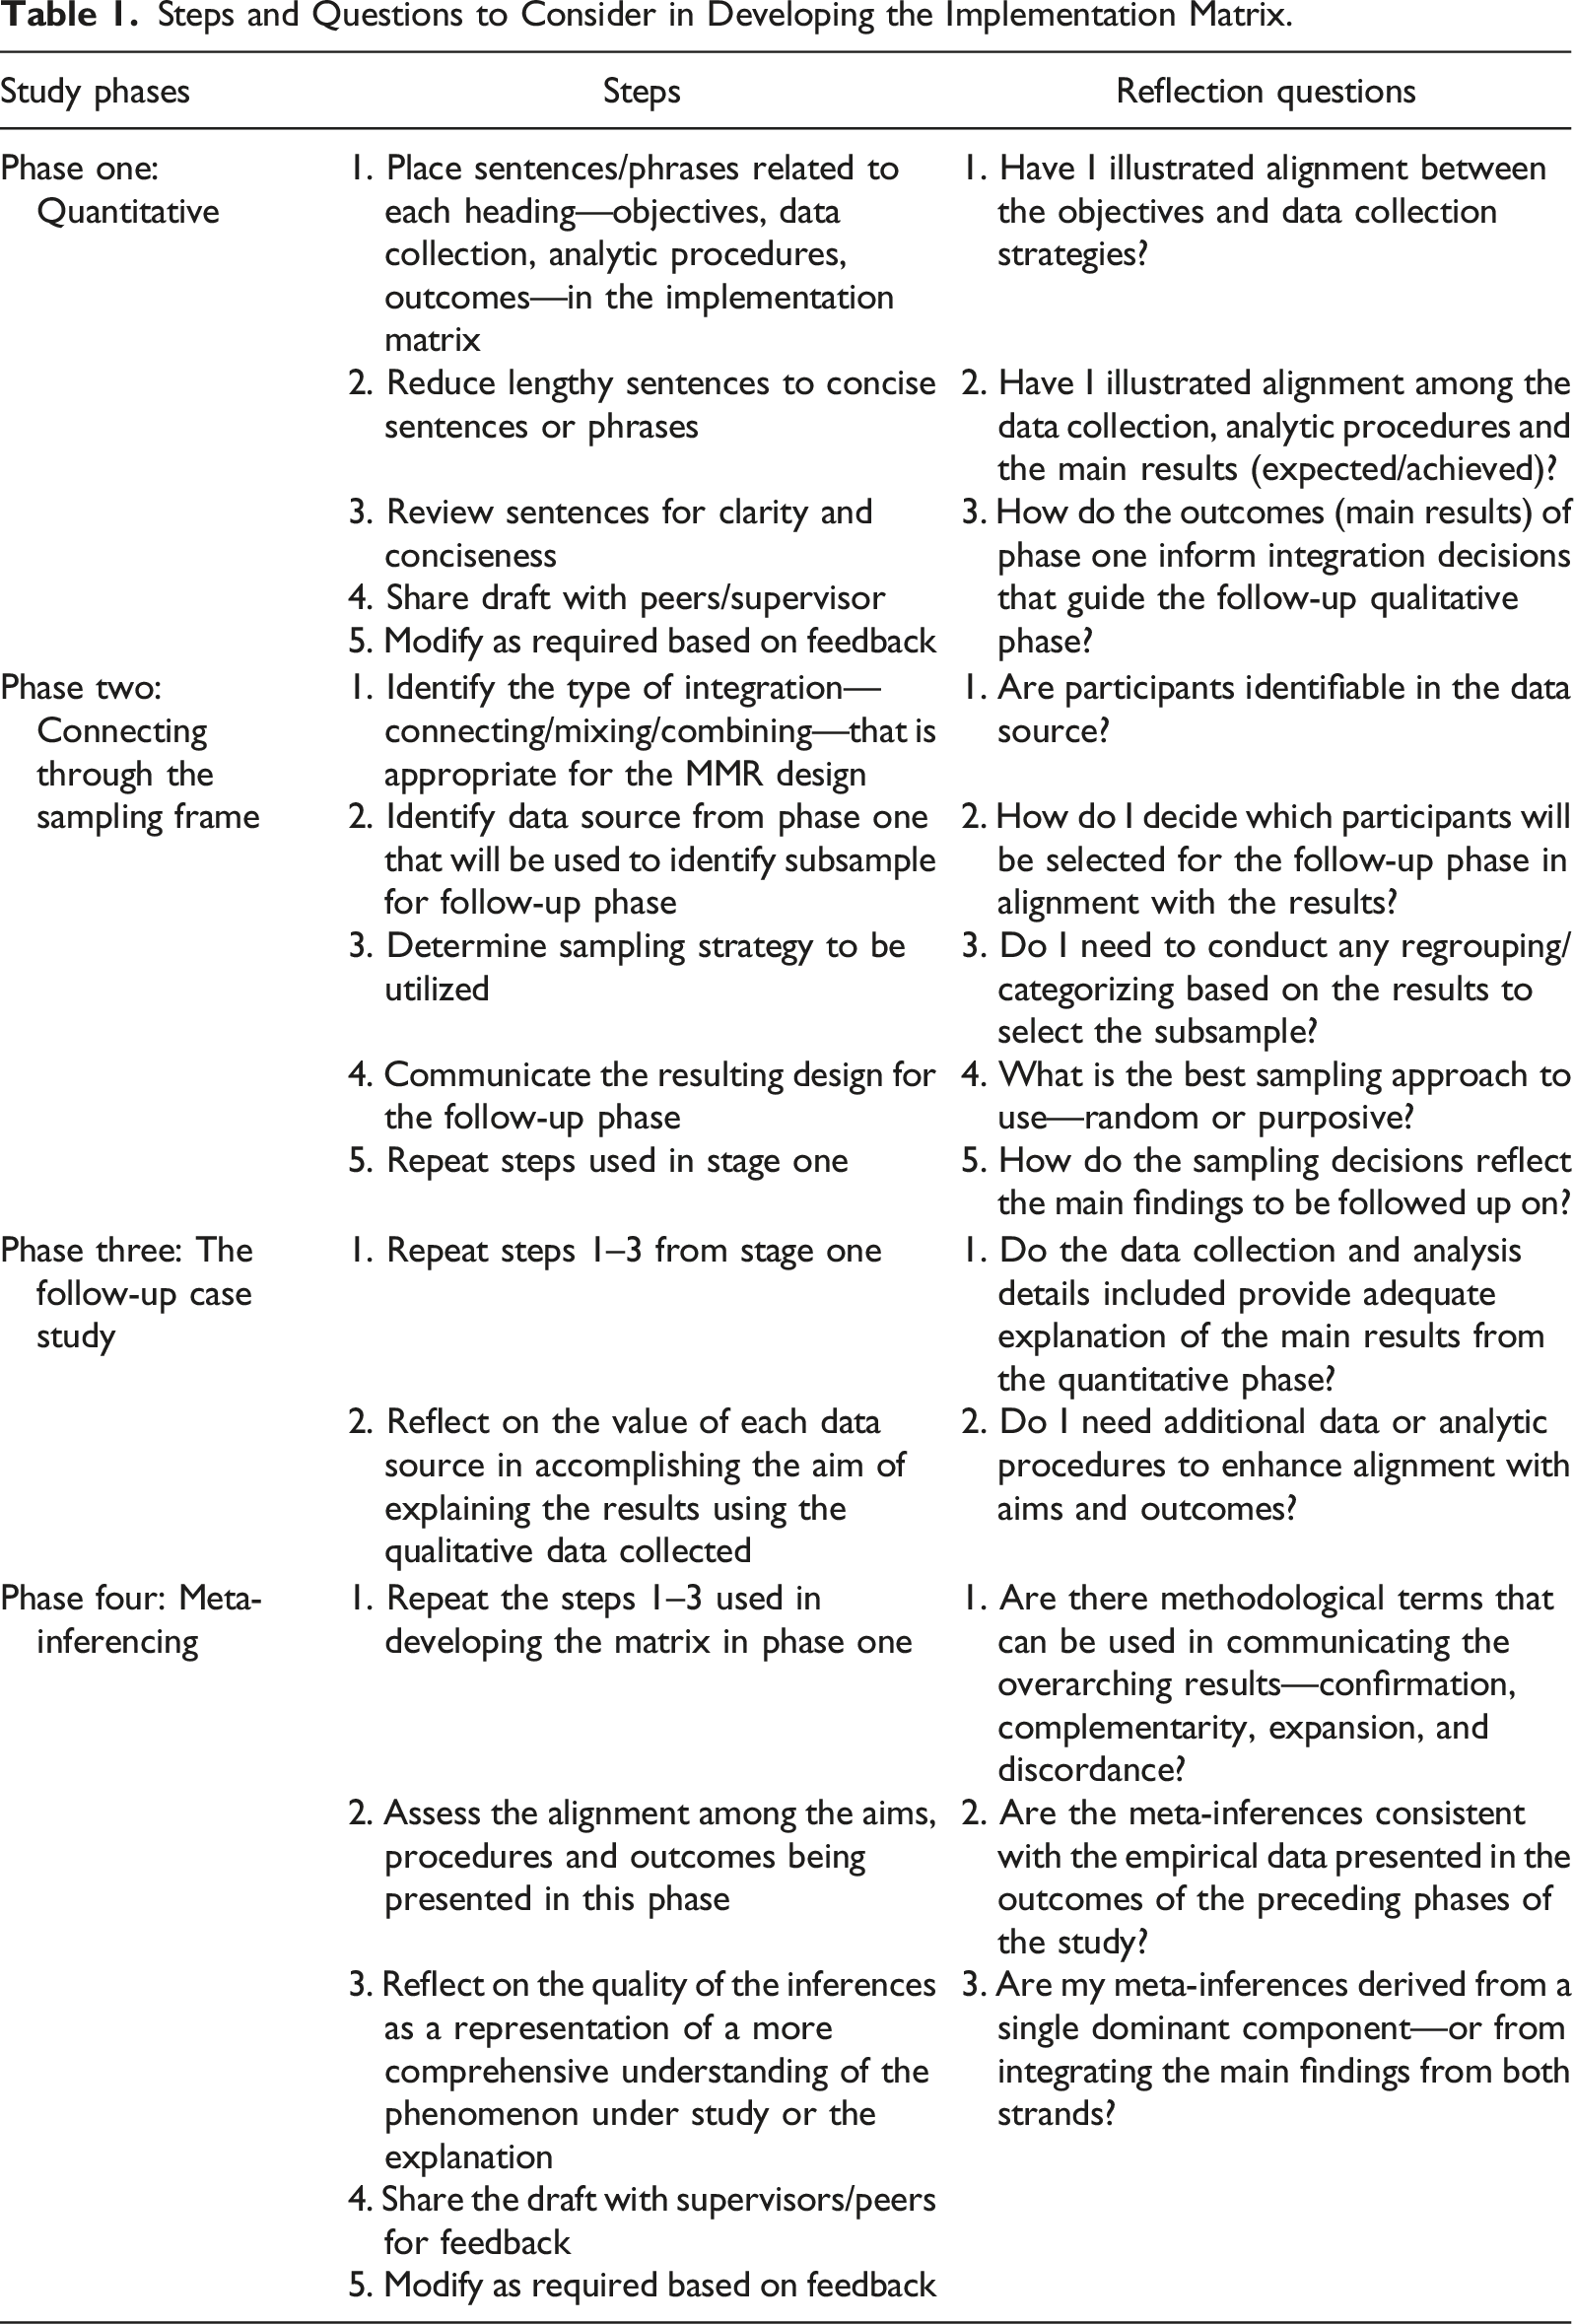
Steps and Questions to Consider in Developing the Implementation Matrix.
The explanatory sequential design is the most utilized design among novice mixed methods researchers because it is considered an easy straightforward design (Creswell, 2015). Although the design and implementation of the explanatory design may pose few challenges, communicating the decisions taken at each phase of the study to achieve optimal integration can be daunting owing to the need for clarity and conciseness to be communicated in a single page diagram. The use of an implementation matrix can help to make this task less formidable as it helps to communicate procedurally in a concise manner how the objectives, data collection, analysis and outcomes informed integration decisions. When I began to engage in the development of the implementation matrix, I gained greater clarity in communicating integration procedures, and scaffolded my MMR knowledge.
In reflecting on the process of developing the implementation matrix I noted several steps and key questions that played a critical role in the process. One of the benefits gleaned from the process of developing the implementation matrix was that it allowed me to reflect critically on the decisions taken at every stage of the MMR project. Each iteration allowed me to articulate more concisely and clearly the integration process. Constant reflection on what was being presented during interactions with my peers and mentor as I sought feedback on modified versions of the implementation matrix scaffolded my construction of research knowledge. All processes that MMR researchers engage in during the design, implementation, analysis and reporting have the potential to facilitate growth in the researcher’s knowledge and enhance integration in an MMR project. However, these benefits are tied to the researcher’s ability to carefully reflect at every stage of the project. The implementation matrix might seem a foregone conclusion but there are important considerations and processes involved in developing a matrix that adequately communicates a forest-level picture of the entire research.
The intent of the implementation matrix is not to complicate matters, but instead to bring into focus all the critical elements that guide the design and integration decisions to provide the researcher and reviewers with an opportunity to evaluate implementation outcomes and success. As I learned during the process of developing the implementation matrix in my MMR project, it is an invaluable tool that can be used as a reference for representing the procedures and integration decisions in a concise but sufficiently detailed way.
Contributions to MMR
The use of the implementation matrix in MMR is not new, yet there are few publications discussing how to develop and apply it. Of note however, is the MMR text authored by Fetters (2020) which has a chapter dedicated to helping researchers to understand its value and engage in developing the implementation matrix. This paper contributes to MMR by providing an illustration of how the implementation matrix was developed and applied in conveying procedurally the project integration steps within and across the phases of an explanatory sequential study. It provides other researchers with a practical example of how the study aims, sample, data and outcomes taken together can be conveyed in an implementation matrix in a concise yet detailed manner.
The insights shared on engaging in reflection on the decisions can serve as a guide for other researchers as they develop their own implementation matrixes. The questions presented in Table 1 are not necessarily unique to the development of the implementation matrix. However, they can serve as a guide to help other researchers to reflect as they engage with this process of developing the implementation matrix. These were the types of questions that guided my reflection as I developed the implementation matrix. Other researchers, especially those less experienced may find these questions helpful in scaffolding their knowledge of MMR as they strive to help readers to better understand the methodological decisions underpinning integration project steps. Reflection on these questions as well others that may emerge during presentation of the implementation matrix to mentors, supervisors, and other researchers can help to ensure that at every stage of conveying the project integration steps, the decisions reflect alignment among the study objectives, data collection, analytic procedures and outcomes.
Limitations
The procedural steps presented in this paper may not be applicable to other mixed methods designs that are not quantitative to qualitative in sequence. However, other mixed methods researchers may benefit at a conceptual level from understanding how the steps and questions can serve as guide in approaching the process in their own MMR studies. The study process and explanations though presented in some details in this paper were abridged versions and excerpts from the larger study. Therefore, other researchers, especially those completing their dissertations, should incorporate more detailed explanations of the procedures supported by citations from the methodological literature to strengthen the report.
Footnotes
Acknowledgments
This article pays homage to the late Professor Michael Fetters who was my mentor during my time as a Visiting Scholar to the Michigan Mixed Methods Scholarship Program. Professor Fetters introduced me to the use of the implementation matrix that soon became an invaluable tool as I conducted and engaged in several MMR projects. His guidance as I learned how to develop and use the implementation matrix prompted much reflection which scaffolded my knowledge of MMR. He was the co-author of my first methodological publication (Haynes-Brown & Fetters, 2021). During that process he taught me the value of sharing not just examples and illustrations of finished products, but how to be open and honest in sharing both the successes and challenges encountered in learning how to use of various MMR tools and procedures. His love of MMR was infectious and played a significant role in nurturing my love and desire to contribute to the MMR literature.
Declaration of Conflicting Interests
The author(s) declared no potential conflicts of interest with respect to the research, authorship, and/or publication of this article.
Funding
The author(s) received no financial support for the research, authorship, and/or publication of this article.