
Abstract
Yarn-dyed textiles complement digital printing textiles, which hold promise for high production and environmentally friendly energy efficiencies. However, the complicated structures of color-blended yarns lead to unpredictable colors in textile products and become a roadblock to developing nonpollution textile products. In the present work, we propose a framework of intelligent manufacturing of color blended yarn by combining the color prediction algorithm with a self-developed computer numerically controlled (CNC) ring spinning system. The S-N model is used for the prediction of the color blending effect of the ring-spun yarn. The optimized blending ratios of ring-spun yarn are obtained based on the proposed linear model of parameter W. Subsequently, the CNC ring-spinning frame is used to manufacture color-blended yarns, which can configure the constituent fibers in such a way that different sections of yarn exhibit different colors.
Introduction
In textile printing, repeating patterns is an inherently limited approach due to the repetition of the same thing. Alternatively, varying the color of the repeated pattern has become a promising way to attract customer attention. The yarn-dyed fabric is typically made from the weft and warp yarns with identical or different colors.1,2 Recently, the multi-channel drafting technique promotes the emergence of color blended yarn.3,4 Mixing various colored fiber components gives rise to different color appearances of yarns that can be manipulated through controlling the feeding speeds of rollers and the breaking and the main drafts of the drawing frame. In general, the HSB color space consists of three independent signals such as red, yellow, and blue. 5 Design stylists separate the color of the artwork into composite colors based on a qualitative description of the HSB color space.6–8 The color appearance of yarn can be decomposed as the weighted-average R, G, and B values of various colored fiber components because of the additive optical natures, that is, absorption and scattering, of opaque fibers in the fabric, and as such, it provides the possibility to predict the color of the fabric based on chromaticity values of each fiber component of yarn.
In textile production, the actual colors of fabrics do not precisely match with the colors of idealized samples due to the fiber physical form (fineness, length, and surface state) and manufacturing process. 9 The analytical model is a useful approach to predict fabric color. Typically, the Kubelka–Munk theory (K-M) is a model widely used in paper-making and color-using industries. 10 In recent years, many people have used the K-M model to predict the color blending effects of fiber blends and claimed to achieve qualitatively satisfactory results.11–13 However, the K-M model was initially designed to explain the light propagation in parallel colorant layers of infinite xy extension,14,15 which has not been a successful theory for other types of materials. The K-M model even fails to predict the color of dyed paper 10 in some situations. Therefore, the accuracy of the K-M model is highly system-dependent, and the predicted results may be fortuitous. On the other hand, the Stearns-Noechel (S-N) model is an analytical method to predict the color of fibrous materials.16–18 Unlike the K-M model, the S-N model is specifically designed to predict the color of fiber blends, which is more suitable to predict the color of fabrics.
This study establishes a framework to manufacture color-blended yarns by using a self-developed computer numerically controlled (CNC) ring-spinning frame19,20 combined with color matching prediction. Based on the S-N model, the W value of the prediction model is solved for the color-blended ring-spun yarn. Subsequently, the color differences are calculated, which are further minimized using the augmented Lagrangian optimization method. The optimal blending ratios of ring-spun yarns are obtained by using the least square method, which is subsequently used for manufacturing color-blended ring-spun yarn based on the CNC ring spinning frame.
Stearns-Noechel model with parameter optimization
The color-blended fabrics are made of color-blended yarns that mix different-colored fibers with specific blending ratios. The color appearance of fabric depends on the light scattered from the surface of the fabric, where the reflectance of the fabric is related to the reflectance and the blending ratios of different-colored fibers.
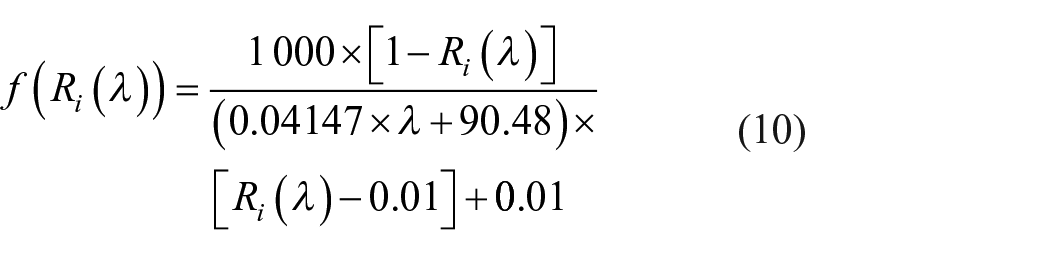
S-N model is an analytical method that explores the relation of the reflectance between fabric and fiber due to the additive principle, 16 as shown below:

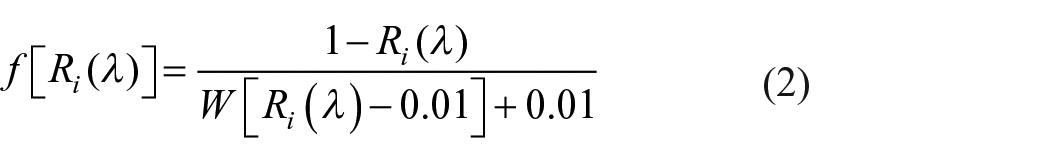

where W is an experimental parameter;
The reflectance of the monochromatic fibers and color-blended fabric can be measured by the Datacolor 650 Color measurement spectrophotometer, so we can perform a best-fit algorithm of optimization 21 to obtain parameter W at the specific wavelength λ based on equations (1) and (2), as illustrated in Figure 1. Figure 2 shows the reflectance curves of three monochromatic fibers. The optimized parameter W corresponds to the smallest difference between the predicted and the measured chromaticity values. For each wavelength, there are several samples with different blending ratios. For each sample, we can obtain an optimized W value. The best W value at each wavelength corresponds to the smallest value of the sum of absolute values of the color differences of all samples.
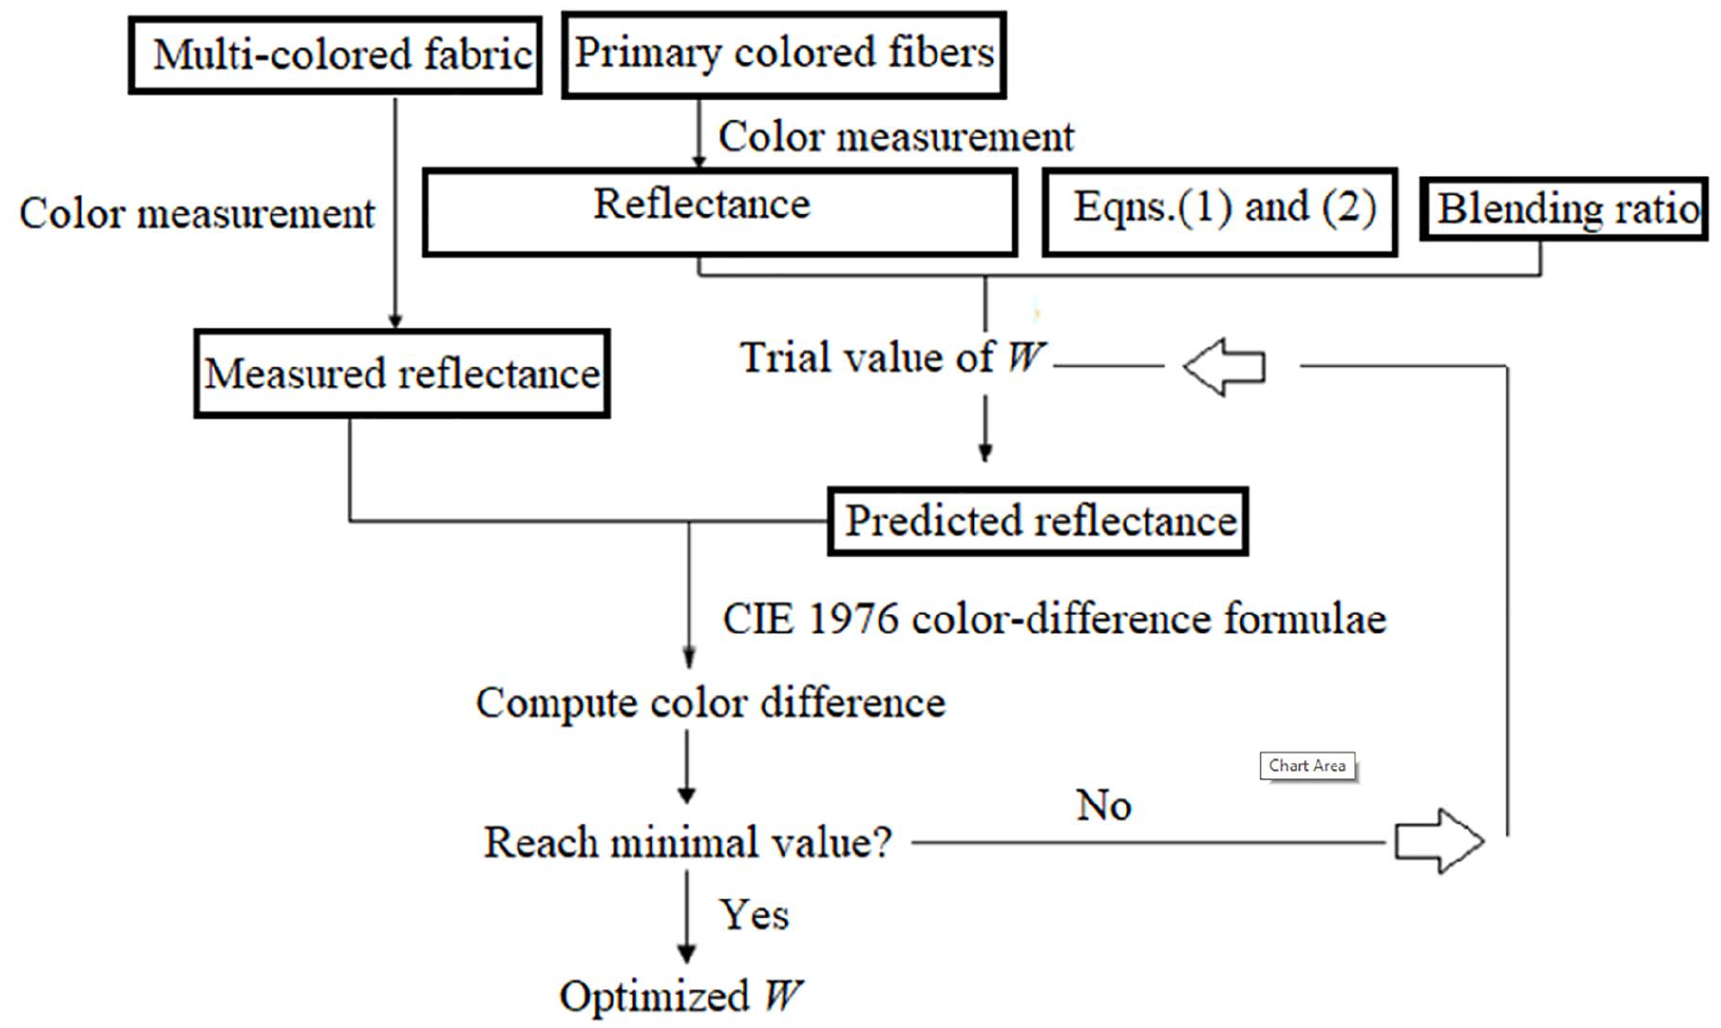
Schematic diagram illustrating the optimization process of parameter W.
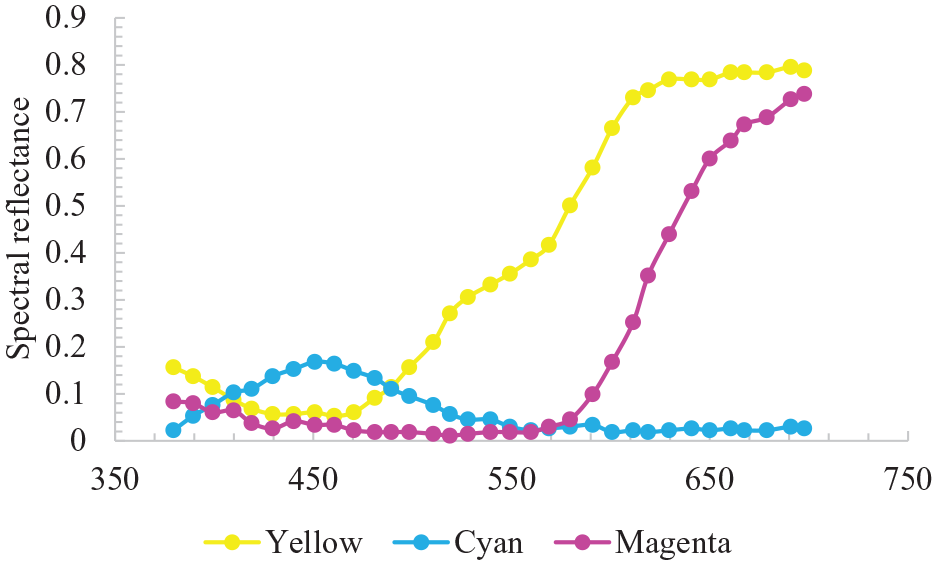
Reflectance curves of three primary colored fibers.
The chromaticity values L, a, and b of the fabric are obtained by solving the following coupled equations:

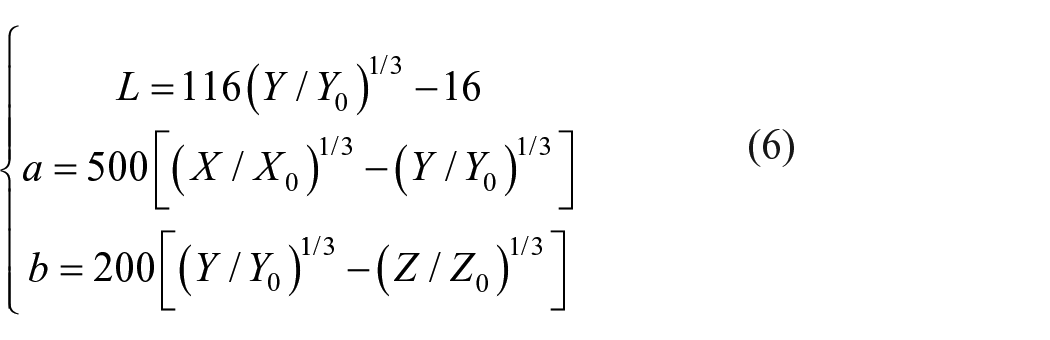
where X/X0, Y/Y0, and Z/Z0 must be larger than 0.008856; if not, the following equations are used to calculate L, a, and b.
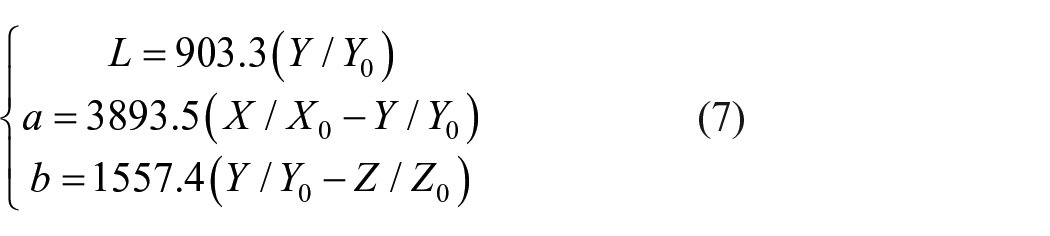
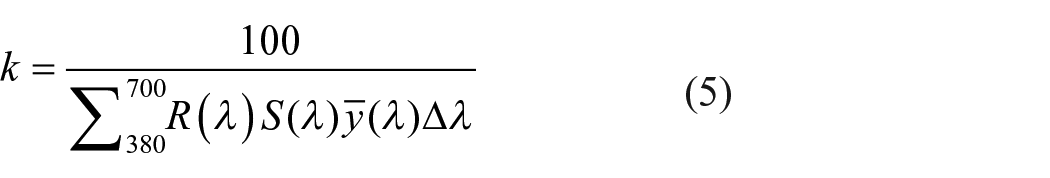
where X, Y, and Z are the tristimulus values of the fabric; S(λ) represents the spectral power distribution of the light source;
The color difference can be calculated using the CIE 1976 LAB color difference formula:
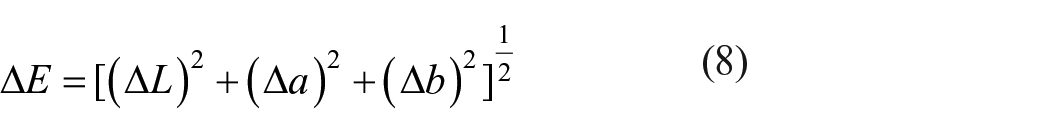
where ∆L, ∆a, and ∆b represent the differences between the predicted and measured chromaticity values.
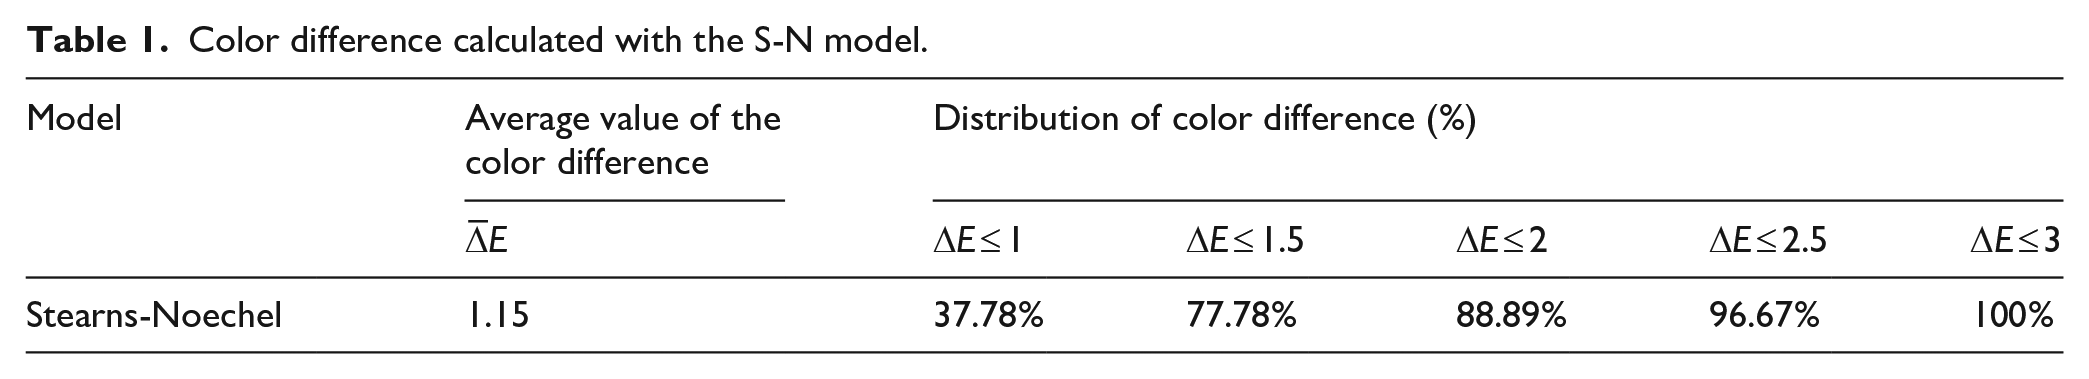
Figure 3(a) shows that the optimized W values are highly dispersed. Figure 3(b) shows that the fluctuation of the best W value is at 0–0.3, which is consistent with the recommended range (0–1) for cotton and wool fibers in the literature. 16 Table 1 shows that the average value of color differences is approximately 1, among which 78% are smaller than 1.5, which further verifies the reliability of the established linear model. In addition, the best W value demonstrates an approximately linear dependence of wavelength. A linear regression fit on the best W value as a function of the wavelength λ of incident light is obtained by the following relation:
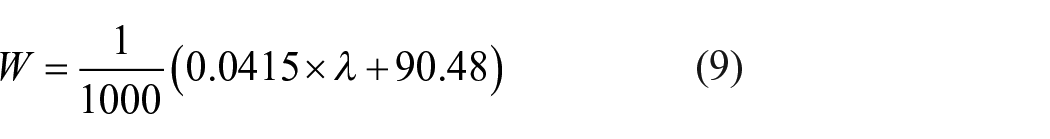
Substituting equation (9) into equation (2), we obtain
Once

(a) The dispersion and (b) the best W values at each wavelength.
Color difference calculated with the S-N model.
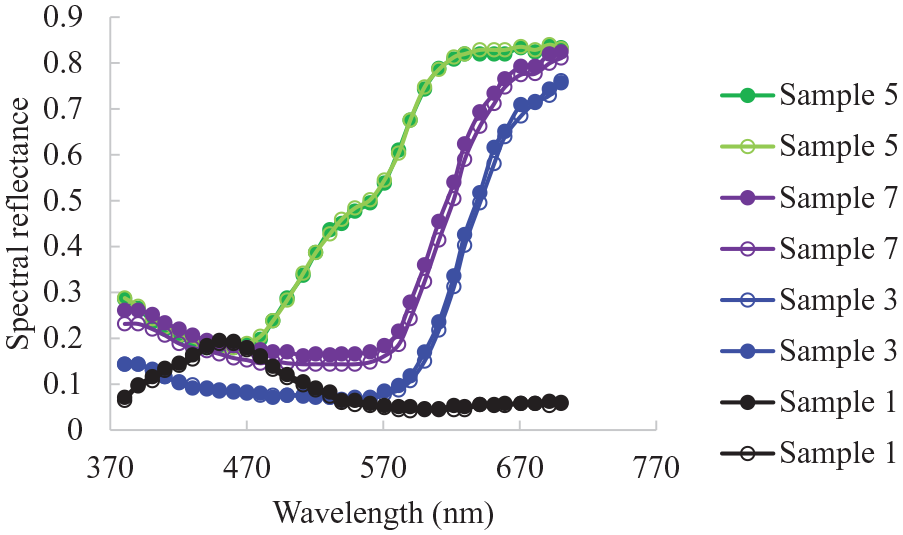
The comparison between the predicted and measured fabric reflectance of the most representative samples listed in Table 2.
To optimize the blending ratios of monochromatic fibers, we apply the augmented Lagrangian optimization to minimize the color difference, that is, equation (8), to obtain the reflectance of color-blended fabrics at each wavelength. Subsequently, we have the following relation based on equations (1) and (2):

where


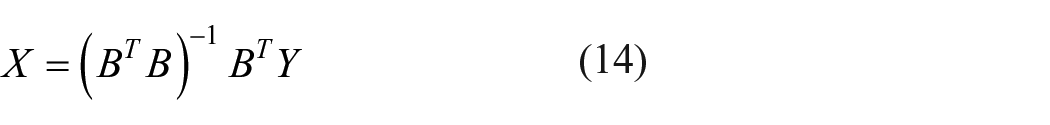
Equations (13) and (14) can be iteratively solved using the least-squares method. 22 Therefore, we obtain the optimized blending ratios of monochromatic fibers, which are used for manufacturing the color-blended yarn based on the self-developed ring-spinning frame described below.
Table 2 lists the measured and predicted chromaticity values, optimized blending ratios, and color differences using the S-N models. The predicted chromaticity values match remarkably well with the experimental data. Table 3 shows the distributions of the predicted color differences based on the optimized blending ratios. Approximately 78% of the color difference values are ≤1, which is higher than 37% of the color difference values based on the actual blending ratios in Table 1; thus, the optimized blending ratios significantly decrease the color difference.
Predicted results based on Stearns–Noechel model.

Color difference calculated with the optimized blending ratios using the S-N model.

Materials and methods
CNC system
The CNC ring spinning machine can apply different drafting to the rovings fed from three independent channels. A photograph and a schematic diagram of the CNC ring spinning system are provided in Figure 5(a) and (b). By changing the drafting ratios of three rovings, one can manipulate the linear density and blending ratio of yarns.9,10 After receiving the parameter information, the programmable logic controller (PLC) sends commands to regulate the speeds of the front, middle, and back rollers. The servo motors run according to a set of user-specified rules, and the photoelectric encoder sends the real-time running parameters to the PLC. The PLC compares the measured rotor speed with the preset speed. If the deviation exceeds a specific value, the system sends the modified frequency to the frequency converter according to the PID algorithm to adjust the rotor speeds to enforce articulated motions of servomotors.

(a) and (b) Schematic diagram and photograph of a three-channel CNC ring spinning machine, respectively; 1–3: back rollers; 4–6: rovings; 7–9: back rollers; 10–11: middle roller; 12: condenser; 13 and 14: front rollers; 15: attenuated roving; 16: thread guide; 17: spindle.
Manufacturing color-blended yarn
Assuming the feeding speed of the back roller is
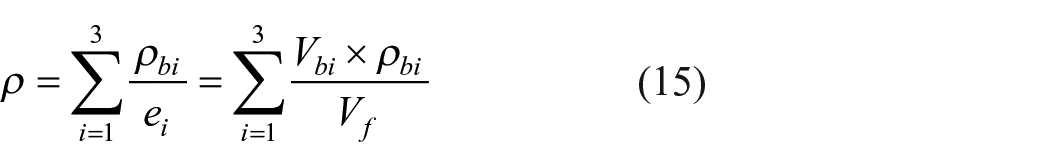
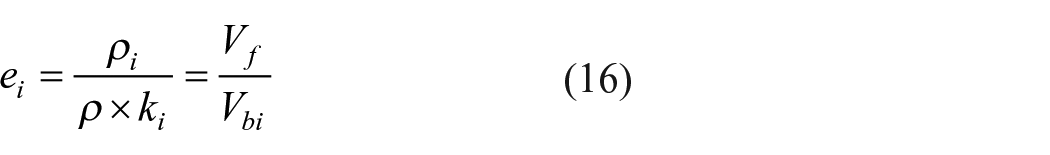
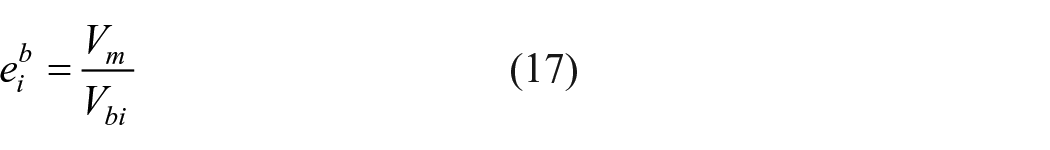

where ρ is the linear density of yarn;
With the optimized blending ratios described in the previous section and the linear densities of yarn and rovings, the total drafts of rovings can be determined from equation (16). The back roller speeds can be determined from equation (18). Subsequently, the front roller and middle roller speeds can be determined from equations (16) and (17), respectively.
The color-blended yarns were made of different colored cotton-rovings. The uniformity ratio, length, and strength of cotton fiber are 45.2%, 27.1 mm, and 22.3 cN/tex. The raw cotton was transformed into roving by going through the conventional opening, blending, and combing. The unevenness CVm of the roving was obtained as 3.19%. The dyes are C.I. Reactive Red 195 (Reactive Red M-2BF), C.I. Reactive blue 72 (Reactive blue PX-GR), and C.I. Reactive Yellow 176 (Reactive Yellow 3RS) purchased from Tapori Ltd (Zhejiang, China). The ring-spun yarns were spun on a JWF1551 spinning frame (Jingwei Textile Machinery Co., Ltd, Yuci Branch). The spindle speed was set as 12,000 r/min; the yarn count was set as 19.7 tex; the linear density of roving was 0.4 tex; the twist of yarn was set as 850 turns/m.
Testing method
Color-blended yarns (35.32 tex) were spun with the 10% gradient combination of three basic colored rovings, as shown in Table 2. Each sample was 30 cm × 30 cm, and the fabric had a density of 120 g/cm2 as fabricated by a TF-S3F4 circular knitting machine (Single Jersey) purchased from Nantong NTEC Ltd. The colors of fabrics were measured by the Datacolor 650 Color measurement spectrophotometer. The spectral reflectance and CIE Lab values (L, a, b) of the fabric were measured at the specified wavelength from 380 to 700 nm with a wavelength interval of 10 nm, the 30-mm aperture, the 100% ultraviolet, and D65/10 illuminant. During the color testing, the samples were folded five layers to ensure that light did not directly transmit through the fabric. For each sample, the color was measured at several locations and averaged. The value with average color differences less than 0.2 CIELAB color unit was taken as the result. All samples were placed under the standard room condition (65% ± 2% RH and 20°C ± 2°C) for at least 48 h before the test.
The yarn strength was measured using a YG068C fully automatic single yarn strength tester (Suzhou Changfeng Textile Mechanical and Electrical Technology Co., Ltd, China) according to GB/T14344. The evenness of the yarn was measured using a Uster YG135G at a speed of 200 m/min. The yarn hairiness was measured using a YG172A hairiness tester.
Results and discussion
Figure 6 shows the longitudinal view and sectional image of color-blended yarn. The fiber strands in the ring-spun yarn are twisted and wound simultaneously. 23 The core fibers are helically embedded in ring-spun yarn. The twist of the fibers is built from the outside to the inside, and the different-colored fibers are distributed evenly in a spiral shape along the yarn axis and helically arranged at the surface. 24 The structure of ring-spun yarn is drastically different from that of rotor-spun yarn. In the case of rotor-spun yarn, the yarn is a three-part structure: an inner zone of core fibers that are aligned with the axis of the yarn, an outer zone of fibers, which occurs irregularly along the core length, and the fibers that are wrapped around the outside of the yarn. 24 The reflectance of rotor-spun yarn depends on the wrapper fibers and fiber configuration in the outer zone, which results in a different W value in S-N model in comparison with ring spun yarn. 9 In addition, the reflectance of rotor-spun yarn is greater than that of ring-spun yarn due to a smoother surface.

(a) The cross-sectional image and (b) the longitudinal view of the color-blended yarn manufactured using the self-developed ring spinning frame.
The color-blended yarn has an esthetically appealing appearance; however, some properties of ordinary yarns have to be compromised to achieve the special effect. The main influencing factor on the performance of color-blended yarn is the blending ratio, so we conduct a study to investigate the impact of blending ratio on the evenness, strength, and hairiness of color-blended yarn.
Figure 7(a) shows that the yarn evenness decreases as the rovings tend to become more unevenly blended. This is probably because the fiber strand with a smaller linear density is subject to a larger drafting ratio and thus is loosely gripped between the front roller nip and the convergence point. Consequently, the fibers tend to be nonuniformly distributed in the yarn due to the mechanical vibration during spinning, which reduces the evenness of yarn. On the contrary, the evenness of rotor-spun yarn remains approximately constant with the changes in blending ratios. 25 This is due to the fact that rotor spinning relies on the depositions of fibers in the rotor to make up a yarn. Only one or two fibers can enter the rotor when the rotor passes the exit point of the transportation tube; consequently, the rotor-spun yarn is formed in a layer-by-layer fashion, which leads to a better evenness against the changes in blending ratios. Therefore, the evenness of ring-spun yarn is lower than that of rotor-spun yarn of the same component and count.25,26
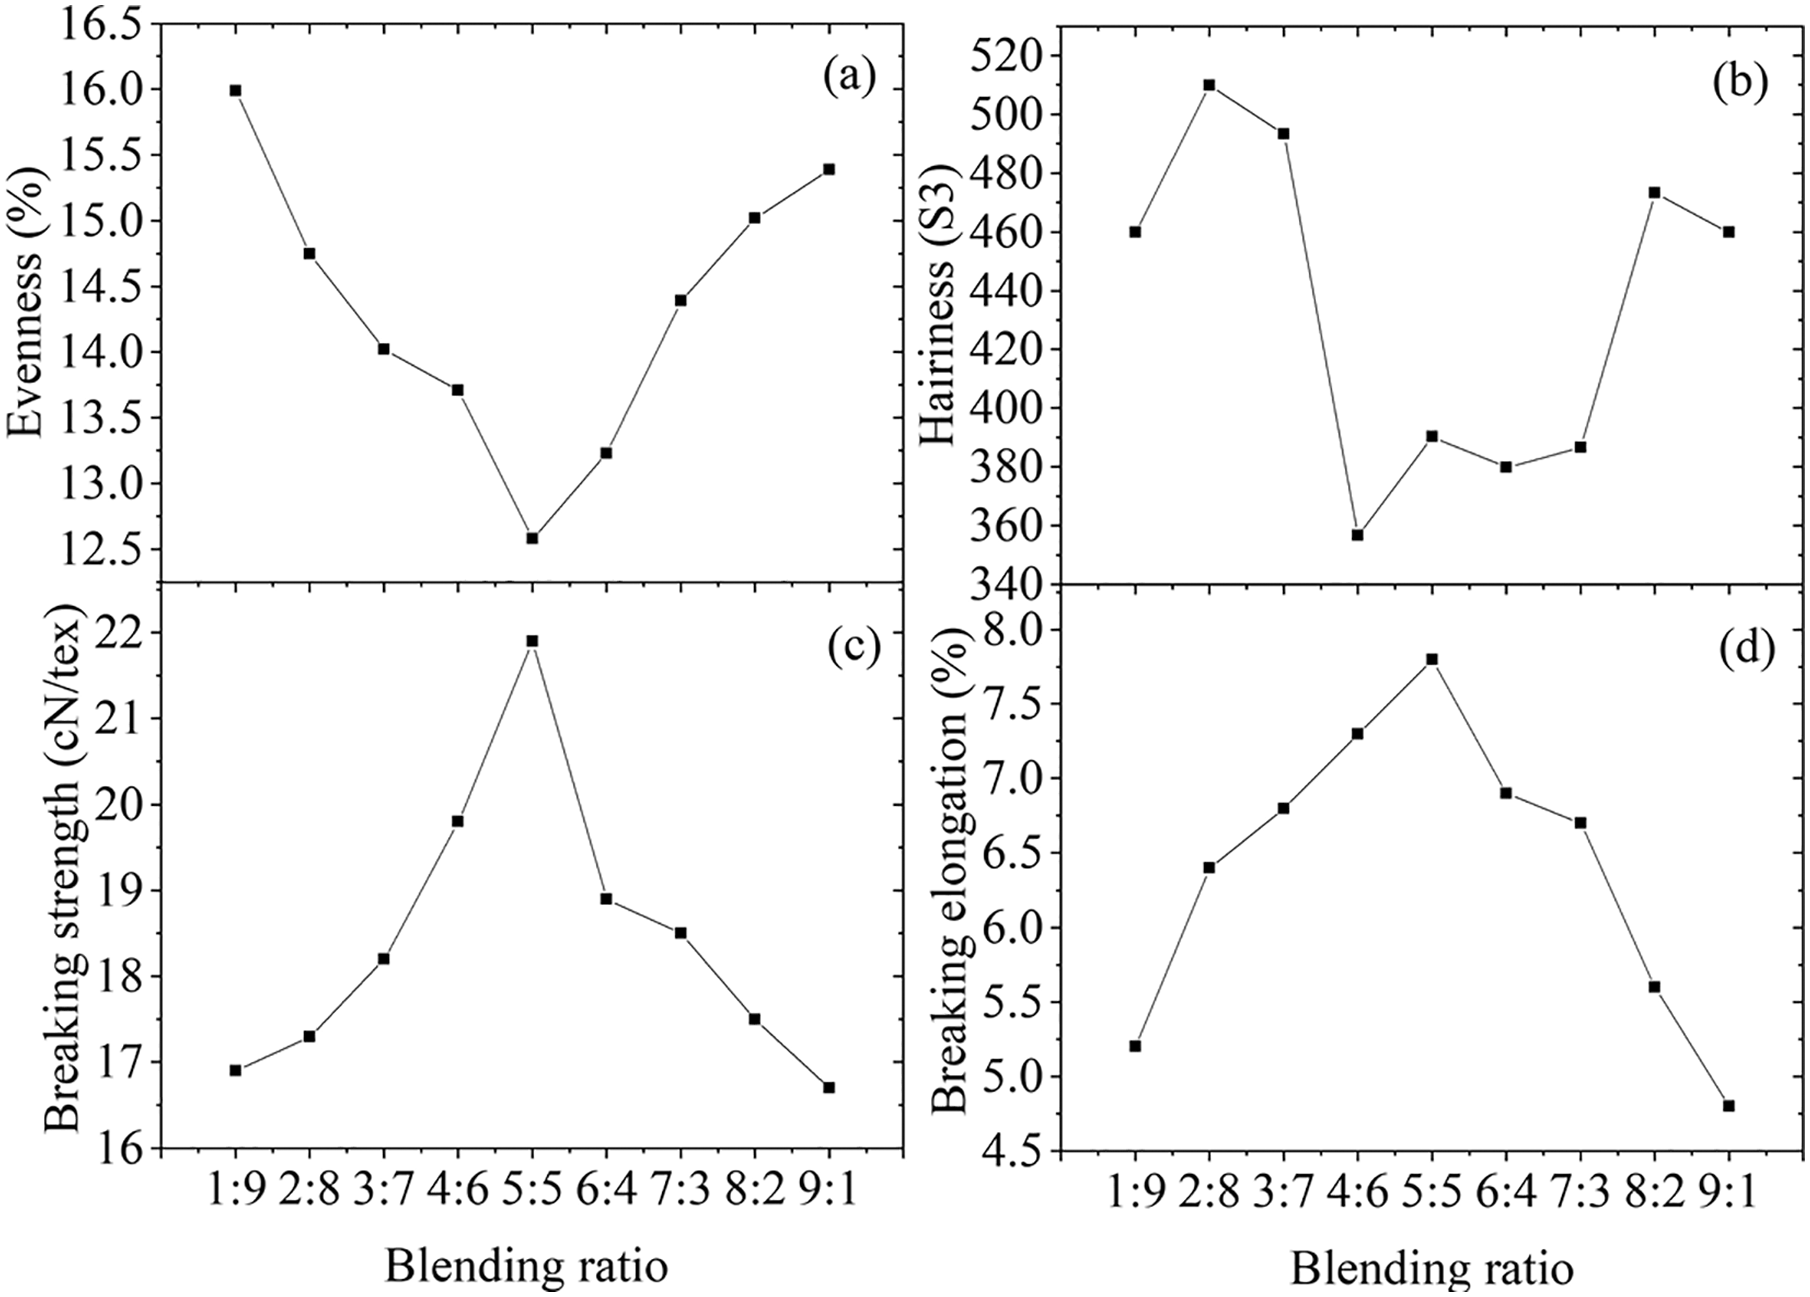
Variations of (a) evenness, (b) hairiness, (c) breaking strength, and (d) breaking elongation with respect to the blending ratio.
Figure 7(b) shows that the yarn hairiness decreases as the rovings tend to become more evenly blended. This is because the roving with a smaller blending ratio is loosely gripped by the back rollers, resulting in some free short fibers that protrude out of the surface of the yarn, which increases yarn hairiness. In addition, if the two rovings are unevenly blended, the fiber strands are subject to different drafting ratios; consequently, the convergence point is destabilized due to a loss of equilibrium of the spinning triangle, which increases the hairiness of yarn.27,28 The hairiness value of the rotor-spun yarn is lower than that of ring-spun yarn under the same blending ratio 26 since the wrapper fibers prevent fibers from protruding from the main yarn body. Therefore, the pilling resistance of rotor-spun yarn fabric is better than that of ring-spun yarn fabric. 26
Figure 7(c) and (d) show that both the yarn strength and breaking elongation decrease as the rovings tend to become more unevenly blended, for the same reason as were given to the yarn evenness. The yarn strength is critical to the quality of the fabric. A low strength not only results in a high breakage rate during spinning but also deteriorates the overall wearability of fabric. Rotor-spun yarns usually have lower strength than ring-spun yarns of the same component and count due to the poorer fiber deposition. 29 However, the rotor-spun yarn tends to have more uniform strength along its length due to the combined effects of opening roller velocity, airflow in the rotor spinning, and low yarn tension during yarn formation. 29
Table 2 shows that the measured lightness (L), red-green index (a), and yellow-blue index (b) are proportional to the blending percentage of yellow-colored fibers, whereas they are inversely proportional to the blending percentage of cyan-colored fibers. The reflectance of cyan-colored fiber is smaller than that of yellow-colored fiber; therefore, the lightness of color-blended fabric increases with the increases in the blending ratio of yellow-colored fibers with respect to cyan-colored fibers. Furthermore, cyan is a combination of green and blue. Therefore, the decreases in the blending percentage of cyan-colored fibers decrease the amount of green and blue present in the color-blended yarn, which, accordingly, increases the values of a and b for color-blended fabric. In addition, the reflectance of cyan is the smallest among the three colors (cyan, yellow, and magenta); therefore, reducing the blending percentage of cyan-colored fibers increases the reflectance of fabric.
Many factors contribute to the coloration of yarn, such as the sample preparation, the fiber physical form (fineness, length, and surface state), the fiber configurations in the yarn, and the spinning process.9,16 In particular, the yarn twist has a significant effect on the coloration of yarn. For example, Jin et al. showed that the light reflectance of vortex spun yarn is lower than that of ring-spun yarn due to the disorderly arrangement of surface fibers. For ring-spun yarn, the fibers are closely aligned along the yarn axis. 21 Therefore, increasing the twist angle reduces the surface reflectance of the yarn. 23
Conclusion
CNC ring spinning is a new, emerging technology of manufacturing color blended spun yarns. However, it requires considerable effort to control the colors of spun yarns during spinning. Color matching algorithms are commonly used for predicting and controlling the color blending effect of fiber blends. However, it is hard to control the color of spun yarn due to the complexity of configuring fibers in the spinning process. Such are the dilemmas that arise in the green, eco-friendly production of multi-colored textiles. Therefore, it is a holy grail to develop a framework that can manufacture the spun yarn with tunable and controllable colors.
In the present study, we conducted a pioneer work of manufacturing color-blended yarn using a model-based design approach that combines the CNC ring spinning with a color matching algorithm. The CNC three-channel ring-spinning frame can realize the intelligent control of the yarn’s structure via variable drafting and blending ratios, which introduces distinct color textures for the textile products, which increases the attractiveness of the fabric appearance. Moreover, the proposed CNC ring spinning can accurately control the segment length of color blended spun yarns through numerical technology. Compared with the traditional ring spinning system, the self-developed CNC ring-spinning frame can produce a wide variety of color-blended yarns, which is beneficial for the fashion design and raises the intrinsic values of textile products.
The S-N color matching model was used to predict and control the color of the ring-spun color blended cotton yarn by performing the best-fit algorithm of optimization. Subsequently, the blending ratios were optimized using augmented Lagrangian optimization, and a series of color-blended fabrics were manufactured using the CNC ring spinning frame. It was observed that the uneven blending ratio between rovings destabilizes convergence point and creates free short fibers, which increases the hairiness and decreases the yarn evenness, breaking strength and breaking elongation. Due to the structure difference, the ring-spun yarn typically has higher strength but lower pilling resistance than rotor-spun yarn of the same component and count. In addition, the color of the ring-spun yarn is darker than that of rotor-spun yarn due to different arrangements of fibers in blended yarns.
Footnotes
Appendix
W experimental parameter
λ wavelength of incident light
L, a, b chromaticity values
X, Y, and Z tristimulus values of the fabric
S(λ) spectral power distribution of the light source
Δλ wavelength interval
k normalized constant
X0, Y0, and Z0 tristimulus values under the CIE Standard Illuminant
∆L, ∆a, and ∆b differences between the predicted and measured chromaticity values
Vm feeding speed of the middle roller
Vf feeding speed of the front roller
ρ linear density of yarn
ei total draft of roving
CVm unevenness of roving
Declaration of conflicting interests
The author(s) declared no potential conflicts of interest with respect to the research, authorship, and/or publication of this article.
Funding
The author(s) received no financial support for the research, authorship, and/or publication of this article.